NVIDIA GeForce RTX 4060 ► remove from comparison The Nvidia GeForce RTX 4060 is a mid-range desktop GPU manufactured using the 5 nm process at TSMC. The AD107 chip is used here. It combines 3,072 shader units and 8 GB of GDDR6 memory. The memory interface is 128-bit, resulting in a memory bandwidth of 272 GB/s in conjunction with the VRAM clock speed.
Features
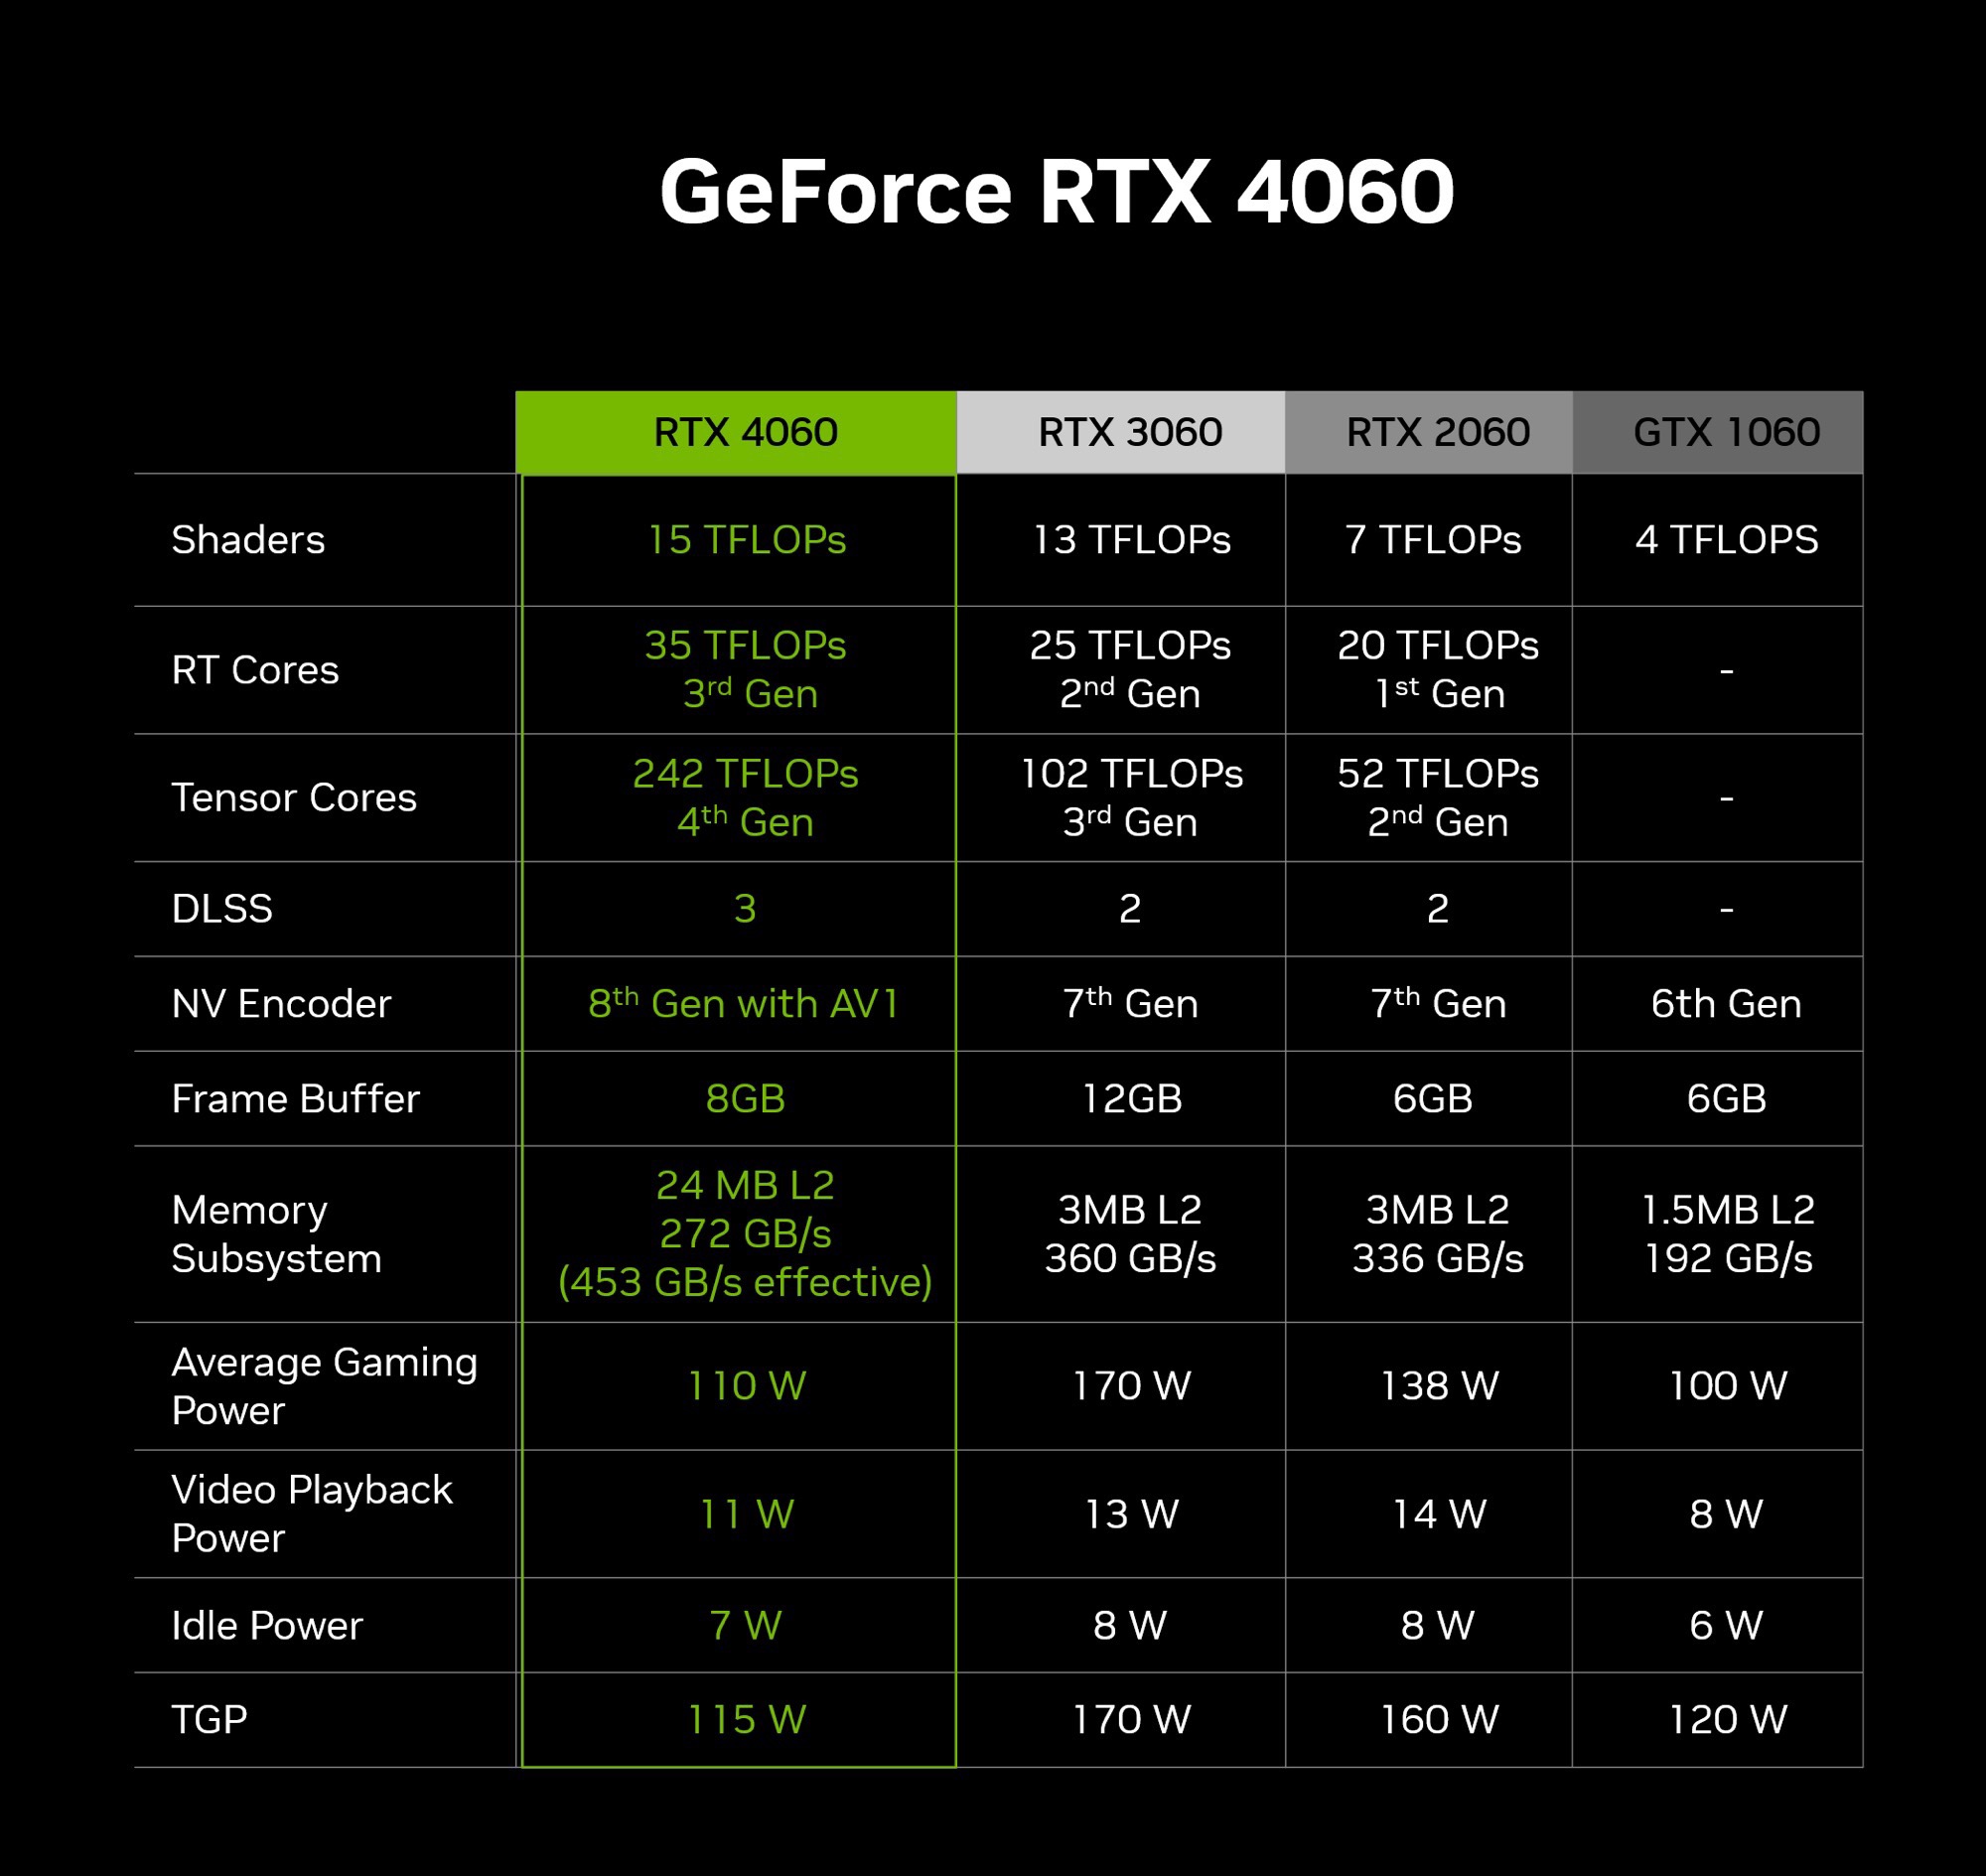
The features that were introduced with the high-end models of the Ada Lovelace generation, such as DLSS 3.0 with frame generation, are also present in the Nvidia GeForce RTX 4060. This sets the new mid-range card apart from the Nvidia GeForce RTX 3060 and provides a significant advantage in games that offer these features.
Performance
Without DLSS, the Nvidia GeForce RTX 4060 performs slightly behind the Nvidia GeForce RTX 3060 Ti . Compared to AMD, the Nvidia GeForce RTX 4060 often competes with an AMD Radeon RX 6650 XT. The GeForce RTX 4060 caters to the 1080p gaming range in terms of performance. At times, the performance is sufficient for 1440p gaming as well, although older games are more suitable for this resolution. Additionally, some compromises in terms of graphical fidelity might be necessary for the latest games. The performance is suitable for playable frame rates at high detail settings.
Power Consumption
The power consumption of the Nvidia GeForce RTX 4060 is specified by the manufacturer at 115 Watts (TDP). This is significantly lower than the Nvidia GeForce RTX 3060, which has a TDP of 170 watts. In comparison to the Nvidia GeForce RTX 3060 Ti (200 W TDP), the Nvidia GeForce RTX 4060 performs well and delivers similar performance with significantly lower power consumption. Power is supplied through a PCIe slot and an additional 6+2-pin connector.
NVIDIA GeForce RTX 2050 Mobile ► remove from comparison The NVIDIA GeForce RTX 2050 for laptops (GN20-S7) is a fast mid-range gaming graphics card for laptops . The RTX 2050 is based on the modern Ampere GA107 chip (like the RTX 3050 ) which is manufactured on an 8nm Samsung process (8N). Compared to the similar GeForce MX570 , the RTX2050 offers Raytracing and DLSS support.
Compared to the old Geforce RTX 2060 Mobile, the 2050 offers more shaders (2,048) but a greatly reduced memory bus (64 Bit). It is available in different versions with with TGPs ranging from 30 to 45 Watt. The maximum boost clock ranges from 1155 to 1477 MHz. It features up to 4 GB GDDR6 graphics memory (14 Gbps leading to 112 GB/s max throughput).
The gaming performance of the mobile RTX 2050 should be clearly lower than the RTX 2060 thanks to the greatly reduced graphics memory bus. First benchmarks position a fast version slightly above a GeForce GTX 1650 and on the same level of a GeForce MX570. However, games that support DLSS can offer clear performance advantages thanks to the Tensor cores.
NVIDIA GeForce RTX 4060 NVIDIA GeForce RTX 2050 Mobile GeForce RTX 2000 Series Codename AD107 GN20-S7 Architecture Ada Lovelace Ampere Pipelines 3072 - unified 2048 - unified TMUs 96 ROPs 48 Raytracing Cores 24 Tensor / AI Cores 96 Core Speed 1830 - 2460 (Boost) MHz 1477 (Boost) MHz Theoretical Performance 15.11 TFLOPS FP16, 15.11 TFLOPS FP32 Cache L1: 128 KB, L2: 24 KB Memory Speed 17000 effective = 2125 MHz 14000 MHz Memory Bus Width 128 Bit 64 Bit Memory Type GDDR6 GDDR6 Max. Amount of Memory 8 GB 4 GB Shared Memory no no Memory Bandwidth 272 GB/s API DirectX 12_2, Shader 6.7, OpenGL 4.6, OpenCL 3.0, Vulkan 1.3 DirectX 12_1, OpenGL 4.6 Power Consumption 115 Watt 30-45 Watt Transistors 18.9 Billion Die Size 118.9 mm² technology 5 nm 8 nm PCIe PCIe 4.0 x8 Displays 4 Displays (max.), HDMI 2.1, DisplayPort 1.4a Date of Announcement 18.05.2023 17.12.2021 Predecessor NVIDIA GeForce RTX 3060 Features DLSS, Raytraycing, VR Ready, G-SYNC, Vulkan, Multi Monitor Notebook Size large
Performance Rating - 3DMark 11 + Fire Strike + Time Spy - NVIDIA GeForce RTX 4060
Performance Rating - 3DMark 11 + Fire Strike + Time Spy - GeForce RTX 2050 Mobile
...
NVIDIA GeForce RTX 2050 Mobile
...
3DMark - 3DMark Time Spy Score
min: 10824 avg: 11061 median: 11117.5 (30%) max: 11184 Points
GPU TDP ? TDP 75 W TDP 115 W 100% 100% 99%
min: 1230 avg: 3461 median: 3529 (9%) max: 4326 Points
GPU TDP ? TDP 30 W TDP 32 W TDP 35 W TDP 40 W TDP 60 W TDP 75 W TDP 115 W 56% 28% 11% 31% 33% 39% 100% 99%
3DMark - 3DMark Time Spy Graphics
min: 10270 avg: 10427 median: 10391.5 (21%) max: 10656 Points
GPU TDP ? TDP 75 W TDP 115 W 98% 100% 96%
min: 1072 avg: 3155 median: 3220.5 (7%) max: 3938 Points
GPU TDP ? TDP 30 W TDP 32 W TDP 35 W TDP 40 W TDP 60 W TDP 75 W TDP 115 W 64% 27% 10% 30% 32% 37% 100% 96%
3DMark - 3DMark Ice Storm Unlimited Graphics
min: 769721 avg: 786164 median: 783772 (79%) max: 804999 Points
GPU TDP ? TDP 115 W 97% 100%
3DMark - 3DMark Ice Storm Extreme Graphics
min: 339037 avg: 366441 median: 347282 (41%) max: 413005 Points
GPU TDP ? TDP 115 W 100% 83%
3DMark - 3DMark Cloud Gate Score
min: 66470 avg: 73814 median: 75649 (71%) max: 77488 Points
GPU TDP ? TDP 75 W TDP 115 W 97% 86% 100%
min: 23186 avg: 29670 median: 26385 (25%) max: 40781 Points
GPU TDP ? TDP 30 W TDP 32 W TDP 35 W TDP 40 W TDP 60 W TDP 75 W TDP 115 W 67% 33% 30% 36% 34% 52% 86% 100%
3DMark - 3DMark Cloud Gate Graphics
min: 142997 avg: 147725 median: 145880 (36%) max: 156140 Points
GPU TDP ? TDP 75 W TDP 115 W 100% 94% 92%
min: 47225 avg: 57528 median: 58068 (14%) max: 66365 Points
GPU TDP ? TDP 30 W TDP 32 W TDP 35 W TDP 40 W TDP 60 W TDP 75 W TDP 115 W 73% 33% 32% 38% 44% 44% 100% 99%
3DMark - 3DMark Fire Strike Standard Score
min: 25802 avg: 26489 median: 26581.5 (40%) max: 26991 Points
GPU TDP ? TDP 75 W TDP 115 W 100% 100% 96%
min: 7230 avg: 8117 median: 7959.5 (12%) max: 9475 Points
GPU TDP ? TDP 30 W TDP 32 W TDP 35 W TDP 40 W TDP 60 W TDP 75 W TDP 115 W 65% 27% 27% 29% 31% 35% 100% 96%
3DMark - 3DMark Fire Strike Standard Graphics
min: 26660 avg: 27764 median: 27882.5 (26%) max: 28629 Points
GPU TDP ? TDP 75 W TDP 115 W 98% 100% 95%
min: 8249 avg: 9219 median: 8964.5 (8%) max: 10621 Points
GPU TDP ? TDP 30 W TDP 32 W TDP 35 W TDP 40 W TDP 60 W TDP 75 W TDP 115 W 65% 29% 29% 31% 33% 37% 100% 95%
3DMark - 3DMark Ice Storm Graphics
min: 400232 avg: 431619 median: 408919 (45%) max: 485707 Points
GPU TDP ? TDP 115 W 100% 83%
min: 112270 avg: 137604 median: 143152 (16%) max: 151843 Points
GPU TDP ? TDP 32 W TDP 35 W TDP 115 W 100% 23% 30% 83%
3DMark - 3DMark Wild Life Extreme Unlimited
min: 8064 avg: 8136 median: 8135.5 (9%) max: 8207 Points
3DMark - 3DMark Night Raid
min: 69264 avg: 71823 median: 71093 (67%) max: 75112 Points
GPU TDP ? TDP 115 W 98% 100%
3DMark - 3DMark Night Raid Graphics Score
min: 123628 avg: 125620 median: 124472 (48%) max: 128761 Points
GPU TDP ? TDP 115 W 100% 96%
3DMark 11 - 3DM11 Performance Score
min: 32694 avg: 35255 median: 35757 (43%) max: 36813 Points
GPU TDP ? TDP 75 W TDP 115 W 100% 89% 97%
min: 9246 avg: 12457 median: 12222.5 (15%) max: 15542 Points
GPU TDP ? TDP 30 W TDP 32 W TDP 35 W TDP 40 W TDP 60 W TDP 75 W TDP 115 W 69% 30% 26% 32% 37% 43% 91% 100%
3DMark 11 - 3DM11 Performance GPU
min: 36439 avg: 37622 median: 37777 (29%) max: 38495 Points
GPU TDP ? TDP 75 W TDP 115 W 99% 100% 96%
min: 10598 avg: 12801 median: 12495 (10%) max: 15411 Points
GPU TDP ? TDP 30 W TDP 32 W TDP 35 W TDP 40 W TDP 60 W TDP 75 W TDP 115 W 66% 29% 28% 32% 35% 39% 100% 96%
3DMark Vantage + NVIDIA GeForce RTX 4060 3DMark Vantage - 3DM Vant. Perf. total
min: 106850 avg: 107556 median: 107451 (31%) max: 108367 Points
GPU TDP ? TDP 115 W 100% 100%
3DM Vant. Perf. total + NVIDIA GeForce RTX 2050 Mobile min: 40973 avg: 46821 median: 46821 (14%) max: 52669 Points
GPU TDP ? TDP 35 W TDP 60 W TDP 115 W 100% 38% 49% 100%
3DM Vant. Perf. GPU no PhysX + NVIDIA GeForce RTX 4060 3DMark Vantage - 3DM Vant. Perf. GPU no PhysX
min: 105381 avg: 107166 median: 108029 (59%) max: 108088 Points
GPU TDP ? TDP 115 W 100% 99%
3DM Vant. Perf. GPU no PhysX + NVIDIA GeForce RTX 2050 Mobile min: 42344 avg: 45988 median: 45987.5 (25%) max: 49631 Points
GPU TDP ? TDP 35 W TDP 60 W TDP 115 W 100% 39% 46% 99%
3DMark 05 - 3DMark 05 - Standard
min: 77262 avg: 82572 median: 85082 (93%) max: 85372 Points
GPU TDP ? TDP 115 W 100% 95%
3DMark 06 3DMark 06 - Standard 1280x1024 + NVIDIA GeForce RTX 4060 3DMark 06
min: 61591 avg: 67875 median: 68041 (89%) max: 73993 Points
GPU TDP ? TDP 115 W 100% 100%
3DMark 06 - Standard 1280x1024 + NVIDIA GeForce RTX 2050 Mobile min: 38036 avg: 39263 median: 39263 (51%) max: 40490 Points
GPU TDP ? TDP 30 W TDP 35 W TDP 115 W 100% 56% 60% 100%
Unigine Valley 1.0 - Unigine Valley 1.0 DX
min: 110.2 avg: 112.7 median: 112.6 (34%) max: 115.3 fps
GPU TDP ? TDP 115 W 100% 97%
Blender - Blender 3.3 Classroom CUDA *
min: 40 avg: 40.3 median: 40 (6%) max: 41 Seconds
GPU TDP ? TDP 75 W TDP 115 W 100% 100% 100%
min: 126 avg: 148.3 median: 147 (22%) max: 175 Seconds
GPU TDP ? TDP 30 W TDP 32 W TDP 35 W TDP 40 W TDP 60 W TDP 75 W TDP 115 W 117% 100% 106% 102% 107% 109% 127% 127%
Blender - Blender 3.3 Classroom OPTIX *
min: 21 avg: 22 median: 21 (8%) max: 24 Seconds
GPU TDP ? TDP 75 W TDP 115 W 101% 100% 101%
min: 76 avg: 90.8 median: 87 (32%) max: 110 Seconds
GPU TDP ? TDP 30 W TDP 32 W TDP 35 W TDP 40 W TDP 60 W TDP 75 W TDP 115 W 136% 100% 114% 104% 116% 120% 154% 156%
SPECviewperf 12 + NVIDIA GeForce RTX 4060 SPECviewperf 12 - specvp12 sw-03
min: 91.2 avg: 91.5 median: 91.5 (23%) max: 91.7 fps
GPU TDP ? TDP 115 W 99% 100%
specvp12 snx-02 + NVIDIA GeForce RTX 4060 SPECviewperf 12 - specvp12 snx-02
min: 14.2 avg: 14.5 median: 14.5 (2%) max: 14.8 fps
GPU TDP ? TDP 115 W 96% 100%
specvp12 showcase-01 + NVIDIA GeForce RTX 4060 SPECviewperf 12 - specvp12 showcase-01
min: 109 avg: 112 median: 112 (20%) max: 115 fps
GPU TDP ? TDP 115 W 95% 100%
specvp12 mediacal-01 + NVIDIA GeForce RTX 4060 SPECviewperf 12 - specvp12 mediacal-01
min: 82.4 avg: 84 median: 84 (21%) max: 85.6 fps
GPU TDP ? TDP 115 W 96% 100%
specvp12 maya-04 + NVIDIA GeForce RTX 4060 SPECviewperf 12 - specvp12 maya-04
min: 233 avg: 235.5 median: 235.5 (64%) max: 238 fps
GPU TDP ? TDP 115 W 98% 100%
specvp12 energy-01 + NVIDIA GeForce RTX 4060 SPECviewperf 12 - specvp12 energy-01
min: 15.7 avg: 15.8 median: 15.8 (14%) max: 15.9 fps
GPU TDP ? TDP 115 W 100% 99%
specvp12 creo-01 + NVIDIA GeForce RTX 4060 SPECviewperf 12 - specvp12 creo-01
min: 60.6 avg: 61.9 median: 61.9 (25%) max: 63.2 fps
GPU TDP ? TDP 115 W 96% 100%
specvp12 catia-04 + NVIDIA GeForce RTX 4060 SPECviewperf 12 - specvp12 catia-04
min: 113 avg: 114 median: 114 (19%) max: 115 fps
GPU TDP ? TDP 115 W 98% 100%
specvp12 3dsmax-05 + NVIDIA GeForce RTX 4060 SPECviewperf 12 - specvp12 3dsmax-05
min: 244 avg: 247.5 median: 247.5 (37%) max: 251 fps
GPU TDP ? TDP 115 W 100% 97%
SPECviewperf 13 specvp13 sw-04 + NVIDIA GeForce RTX 4060 SPECviewperf 13 - specvp13 sw-04
min: 127 avg: 129 median: 129 (35%) max: 131 fps
GPU TDP ? TDP 115 W 97% 100%
specvp13 sw-04 + NVIDIA GeForce RTX 2050 Mobile GPU TDP ? TDP 35 W TDP 115 W 97% 51% 100%
specvp13 snx-03 + NVIDIA GeForce RTX 4060 SPECviewperf 13 - specvp13 snx-03
min: 25.6 avg: 26.2 median: 26.2 (3%) max: 26.8 fps
GPU TDP ? TDP 115 W 96% 100%
specvp13 snx-03 + NVIDIA GeForce RTX 2050 Mobile GPU TDP ? TDP 35 W TDP 115 W 96% 44% 100%
specvp13 showcase-02 + NVIDIA GeForce RTX 4060 SPECviewperf 13 - specvp13 showcase-02
min: 108 avg: 111.5 median: 111.5 (19%) max: 115 fps
GPU TDP ? TDP 115 W 94% 100%
specvp13 showcase-02 + NVIDIA GeForce RTX 2050 Mobile GPU TDP ? TDP 35 W TDP 115 W 94% 35% 100%
specvp13 medical-02 + NVIDIA GeForce RTX 4060 SPECviewperf 13 - specvp13 medical-02
min: 67.5 avg: 72 median: 72 (12%) max: 76.5 fps
GPU TDP ? TDP 115 W 100% 88%
specvp13 medical-02 + NVIDIA GeForce RTX 2050 Mobile GPU TDP ? TDP 35 W TDP 115 W 100% 40% 88%
specvp13 maya-05 + NVIDIA GeForce RTX 4060 SPECviewperf 13 - specvp13 maya-05
min: 343 avg: 347.5 median: 347.5 (39%) max: 352 fps
GPU TDP ? TDP 115 W 97% 100%
specvp13 maya-05 + NVIDIA GeForce RTX 2050 Mobile GPU TDP ? TDP 35 W TDP 115 W 97% 37% 100%
specvp13 energy-02 + NVIDIA GeForce RTX 4060 SPECviewperf 13 - specvp13 energy-02
min: 33.7 avg: 34.2 median: 34.2 (11%) max: 34.6 fps
GPU TDP ? TDP 115 W 100% 97%
specvp13 energy-02 + NVIDIA GeForce RTX 2050 Mobile GPU TDP ? TDP 35 W TDP 115 W 100% 17% 97%
specvp13 creo-02 + NVIDIA GeForce RTX 4060 SPECviewperf 13 - specvp13 creo-02
min: 230 avg: 230.5 median: 230.5 (34%) max: 231 fps
GPU TDP ? TDP 115 W 100% 100%
specvp13 creo-02 + NVIDIA GeForce RTX 2050 Mobile GPU TDP ? TDP 35 W TDP 115 W 100% 42% 100%
specvp13 catia-05 + NVIDIA GeForce RTX 4060 SPECviewperf 13 - specvp13 catia-05
min: 159 avg: 161 median: 161 (18%) max: 163 fps
GPU TDP ? TDP 115 W 100% 98%
specvp13 catia-05 + NVIDIA GeForce RTX 2050 Mobile GPU TDP ? TDP 35 W TDP 115 W 100% 39% 98%
specvp13 3dsmax-06 + NVIDIA GeForce RTX 4060 SPECviewperf 13 - specvp13 3dsmax-06
min: 244 avg: 248 median: 248 (39%) max: 252 fps
GPU TDP ? TDP 115 W 100% 97%
specvp13 3dsmax-06 + NVIDIA GeForce RTX 2050 Mobile GPU TDP ? TDP 35 W TDP 115 W 100% 36% 97%
SPECviewperf 2020 specvp2020 snx-04 1080p + NVIDIA GeForce RTX 4060 SPECviewperf 2020 - specvp2020 snx-04 1080p
min: 26.1 avg: 26.4 median: 26.4 (3%) max: 26.7 fps
specvp2020 snx-04 1080p + NVIDIA GeForce RTX 2050 Mobile GPU TDP 35 W TDP 115 W 89% 100%
specvp2020 medical-03 1080p + NVIDIA GeForce RTX 4060 SPECviewperf 2020 - specvp2020 medical-03 1080p
min: 33.6 avg: 33.7 median: 33.7 (9%) max: 33.8 fps
specvp2020 medical-03 1080p + NVIDIA GeForce RTX 2050 Mobile GPU TDP 35 W TDP 115 W 92% 100%
specvp2020 maya-06 1080p + NVIDIA GeForce RTX 4060 SPECviewperf 2020 - specvp2020 maya-06 1080p
min: 432 avg: 434.5 median: 434.5 (47%) max: 437 fps
specvp2020 maya-06 1080p + NVIDIA GeForce RTX 2050 Mobile GPU TDP 35 W TDP 115 W 75% 100%
specvp2020 energy-03 1080p + NVIDIA GeForce RTX 4060 SPECviewperf 2020 - specvp2020 energy-03 1080p
min: 33.4 avg: 33.5 median: 33.5 (5%) max: 33.6 fps
specvp2020 energy-03 1080p + NVIDIA GeForce RTX 2050 Mobile GPU TDP 35 W TDP 115 W 100% 94%
specvp2020 creo-03 1080p + NVIDIA GeForce RTX 4060 SPECviewperf 2020 - specvp2020 creo-03 1080p
min: 111 avg: 114.5 median: 114.5 (39%) max: 118 fps
specvp2020 creo-03 1080p + NVIDIA GeForce RTX 2050 Mobile GPU TDP 35 W TDP 115 W 83% 100%
specvp2020 catia-06 1080p + NVIDIA GeForce RTX 4060 SPECviewperf 2020 - specvp2020 catia-06 1080p
specvp2020 catia-06 1080p + NVIDIA GeForce RTX 2050 Mobile GPU TDP 35 W TDP 115 W 96% 100%
specvp2020 3dsmax-07 1080p + NVIDIA GeForce RTX 4060 SPECviewperf 2020 - specvp2020 3dsmax-07 1080p
min: 97.4 avg: 99.2 median: 99.2 (26%) max: 101 fps
specvp2020 3dsmax-07 1080p + NVIDIA GeForce RTX 2050 Mobile GPU TDP 35 W TDP 115 W 91% 100%
specvp2020 snx-04 4k + NVIDIA GeForce RTX 4060 SPECviewperf 2020 - specvp2020 snx-04 4k
min: 19.5 avg: 19.8 median: 19.8 (2%) max: 20.2 fps
GPU TDP ? TDP 115 W 98% 100%
specvp2020 medical-03 4k + NVIDIA GeForce RTX 4060 SPECviewperf 2020 - specvp2020 medical-03 4k
min: 12.3 avg: 12.8 median: 12.4 (8%) max: 13.7 fps
GPU TDP ? TDP 115 W 100% 90%
specvp2020 maya-06 4k + NVIDIA GeForce RTX 4060 SPECviewperf 2020 - specvp2020 maya-06 4k
min: 196 avg: 198 median: 198 (28%) max: 200 fps
GPU TDP ? TDP 115 W 98% 100%
specvp2020 energy-03 4k + NVIDIA GeForce RTX 4060 SPECviewperf 2020 - specvp2020 energy-03 4k
min: 32.3 avg: 39.2 median: 33.2 (5%) max: 52.2 fps
GPU TDP ? TDP 115 W 79% 100%
specvp2020 creo-03 4k + NVIDIA GeForce RTX 4060 SPECviewperf 2020 - specvp2020 creo-03 4k
min: 85.2 avg: 86.4 median: 85.9 (39%) max: 88.2 fps
GPU TDP ? TDP 115 W 99% 100%
specvp2020 catia-06 4k + NVIDIA GeForce RTX 4060 SPECviewperf 2020 - specvp2020 catia-06 4k
min: 33.9 avg: 34.1 median: 34 (22%) max: 34.4 fps
GPU TDP ? TDP 115 W 100% 100%
specvp2020 3dsmax-07 4k + NVIDIA GeForce RTX 4060 SPECviewperf 2020 - specvp2020 3dsmax-07 4k
min: 64 avg: 66 median: 66.7 (22%) max: 67.4 fps
GPU TDP ? TDP 115 W 100% 97%
specvp2020 solidworks-05 1080p + NVIDIA GeForce RTX 2050 Mobile SPECviewperf 2020 - specvp2020 solidworks-05 1080p
Cinebench R10 Cinebench R10 Shading (32bit) + NVIDIA GeForce RTX 2050 Mobile Cinebench R10 - Cinebench R10 Shading (32bit)
Cinebench R11.5 Cinebench R11.5 OpenGL 64 Bit + NVIDIA GeForce RTX 2050 Mobile Cinebench R11.5 - Cinebench R11.5 OpenGL 64 Bit
Cinebench R15 + NVIDIA GeForce RTX 4060 Cinebench R15 - Cinebench R15 OpenGL 64 Bit
Cinebench R15 OpenGL 64 Bit + NVIDIA GeForce RTX 2050 Mobile min: 142.3 avg: 166 median: 159.8 (9%) max: 211 fps
GPU TDP ? TDP 30 W TDP 32 W TDP 35 W TDP 40 W TDP 60 W TDP 75 W 57% 55% 52% 57% 66% 68% 100%
Cinebench R15 OpenGL Ref. Match 64 Bit + NVIDIA GeForce RTX 4060 Cinebench R15 - Cinebench R15 OpenGL Ref. Match 64 Bit
Cinebench R15 OpenGL Ref. Match 64 Bit + NVIDIA GeForce RTX 2050 Mobile GPU TDP ? TDP 30 W TDP 32 W TDP 35 W TDP 40 W TDP 60 W TDP 75 W 100% 100% 100% 100% 100% 100% 100%
GFXBench - GFXBench 5.0 4K Aztec Ruins High Tier Offscreen
min: 36.93 avg: 39.8 median: 39.8 (15%) max: 42.6 fps
GPU TDP 35 W TDP 60 W 87% 100%
GFXBench - GFXBench 5.0 Aztec Ruins High Tier Offscreen
min: 83.53 avg: 93.2 median: 93.2 (17%) max: 102.8 fps
GPU TDP 35 W TDP 60 W 81% 100%
GFXBench - GFXBench 5.0 Aztec Ruins Normal Tier Offscreen
min: 213.05 avg: 231.7 median: 231.7 (17%) max: 250.3 fps
GPU TDP 35 W TDP 60 W 85% 100%
GFXBench - GFXBench Car Chase Offscreen
min: 198.63 avg: 216.2 median: 216.2 (20%) max: 233.8 fps
GPU TDP 35 W TDP 60 W 85% 100%
GFXBench 3.0 - GFXBench 3.0 Manhattan Offscreen
GFXBench (DX / GLBenchmark) 2.7 + NVIDIA GeForce RTX 2050 Mobile GFXBench (DX / GLBenchmark) 2.7 - GFXBench T-Rex HD Offscreen C24Z16
Basemark GPU 1.2 - Basemark GPU 1.2 Vulkan Official Medium Offscreen 1080
min: 153.5 avg: 163.7 median: 163.7 (4%) max: 173.8 fps
GPU TDP 35 W TDP 40 W TDP 75 W 88% 100% 60%
Basemark GPU 1.2 - Basemark GPU 1.2 Vulkan Official High Offscreen 2160
Geekbench 6.4 - Geekbench 6.4 GPU OpenCL
min: 8275 avg: 54976 median: 54975.5 (14%) max: 101676 Points
GPU TDP 75 W TDP 115 W 8% 100%
min: 42076 avg: 43667 median: 43444.5 (11%) max: 45703 Points
GPU TDP 30 W TDP 35 W TDP 40 W TDP 75 W TDP 115 W 43% 41% 44% 8% 100%
Geekbench 6.4 - Geekbench 6.4 GPU Vulkan
min: 9496 avg: 55977 median: 55976.5 (14%) max: 102457 Points
GPU TDP 75 W TDP 115 W 9% 100%
min: 40112 avg: 41614 median: 41279 (10%) max: 43451 Points
GPU TDP 30 W TDP 40 W TDP 75 W TDP 115 W 39% 41% 9% 100%
LuxMark v2.0 64Bit - LuxMark v2.0 Room GPU
min: 3915 avg: 3970 median: 3932 (14%) max: 4063 Samples/s
GPU TDP ? TDP 115 W 100% 97%
GPU TDP ? TDP 60 W TDP 115 W 100% 29% 97%
LuxMark v2.0 64Bit - LuxMark v2.0 Sala GPU
min: 8823 avg: 8899 median: 8882 (16%) max: 8991 Samples/s
GPU TDP ? TDP 115 W 100% 98%
GPU TDP ? TDP 60 W TDP 115 W 100% 30% 98%
ComputeMark v2.1 - ComputeMark v2.1 Result
min: 22964 avg: 23462 median: 23582 (20%) max: 23841 Points
GPU TDP ? TDP 115 W 100% 98%
min: 8754 avg: 9237 median: 9236.5 (8%) max: 9719 Points
GPU TDP ? TDP 35 W TDP 60 W TDP 115 W 100% 37% 41% 98%
Power Consumption - Furmark Stress Test Power Consumption - external Monitor *
min: 189.4 avg: 217.1 median: 211 (28%) max: 251 Watt
GPU TDP ? TDP 75 W TDP 115 W 100% 113% 108%
min: 49.4 avg: 61.5 median: 54.8 (7%) max: 91.6 Watt
GPU TDP ? TDP 30 W TDP 32 W TDP 35 W TDP 40 W TDP 60 W TDP 75 W TDP 115 W 111% 130% 130% 130% 128% 123% 104% 100%
Power Consumption - The Witcher 3 Power Consumption - external Monitor *
min: 233 avg: 252.5 median: 252.5 (35%) max: 272 Watt
GPU TDP ? TDP 115 W 100% 109%
min: 44.1 avg: 60.8 median: 59.9 (8%) max: 79.4 Watt
GPU TDP ? TDP 30 W TDP 32 W TDP 35 W TDP 40 W TDP 60 W TDP 115 W 113% 139% 138% 136% 135% 133% 100%
Power Consumption - Witcher 3 Power Consumption *
min: 49.3 avg: 64.5 median: 60.4 (13%) max: 85 Watt
GPU TDP ? TDP 30 W TDP 32 W TDP 35 W TDP 40 W TDP 60 W 104% 109% 109% 106% 107% 100%
Power Consumption - Power Efficiency - Witcher 3 ultra
min: 0.4614 avg: 0.5 median: 0.5 (46%) max: 0.55 fps per Watt
GPU TDP 35 W TDP 40 W TDP 60 W 99% 100% 84%
Power Consumption - Power Efficiency - Witcher 3 ultra external Monitor
min: 0.4103 avg: 0.4 median: 0.4 (37%) max: 0.4734 fps per Watt
GPU TDP ? TDP 115 W 87% 100%
min: 0.4987 avg: 0.5 median: 0.5 (44%) max: 0.57 fps per Watt
GPU TDP ? TDP 30 W TDP 35 W TDP 40 W TDP 60 W TDP 115 W 72% 97% 100% 92% 90% 83%
Power Consumption - Cyberpunk 2077 Power Consumption 150cd *
min: 57.6 avg: 65.6 median: 65.6 (19%) max: 73.5 Watt
GPU TDP 35 W TDP 40 W 106% 100%
Power Consumption - Cyberpunk 2077 Power Consumption - external Monitor *
min: 252 avg: 271.5 median: 271.5 (34%) max: 291 Watt
GPU TDP 75 W TDP 115 W 100% 108%
min: 54.4 avg: 63.2 median: 63.2 (8%) max: 72 Watt
GPU TDP 35 W TDP 40 W TDP 75 W TDP 115 W 148% 144% 100% 108%
Power Consumption - Power Efficiency - Cyberpunk 2077 ultra
min: 0.2464 avg: 0.3 median: 0.3 (1%) max: 0.2968 fps per Watt
GPU TDP 75 W TDP 115 W 83% 100%
GPU TDP 40 W TDP 75 W TDP 115 W 95% 83% 100%
Emissions Witcher 3 Fan Noise + NVIDIA GeForce RTX 4060 Emissions - Witcher 3 Fan Noise
Witcher 3 Fan Noise + NVIDIA GeForce RTX 2050 Mobile min: 38.2 avg: 43.9 median: 45.4 (73%) max: 47 dB(A)
GPU TDP ? TDP 30 W TDP 35 W TDP 60 W 98% 83% 96% 100%
Clock Speed - GPU Clock Witcher 3 ultra
Average Benchmarks NVIDIA GeForce RTX 4060 → 100% n=38 Average Benchmarks NVIDIA GeForce RTX 2050 Mobile → 54% n=38
- Range of benchmark values for this graphics card
- Average benchmark values for this graphics card
* Smaller numbers mean a higher performance
1 This benchmark is not used for the average calculation
The following benchmarks stem from our benchmarks of review laptops. The performance depends on the used graphics memory, clock rate, processor, system settings, drivers, and operating systems. So the results don't have to be representative for all laptops with this GPU. For detailed information on the benchmark results, click on the fps number.
NVIDIA GeForce RTX 4060 NVIDIA GeForce RTX 2050 Mobile low med. high ultra QHD 4K low med. high ultra QHD 4K F1 25 268 216 161.8 22.3 11.5 4.18 Doom: The Dark Ages 73.3 63.2 58.6 56.2 36.5 The Elder Scrolls IV Oblivion Remastered 130.1 85.7 55.2 25.2 13.8 Assassin's Creed Shadows 57 48 39 27 21 Civilization 7 211 210 111.1 66.7 30.7 Monster Hunter Wilds 74.8 60.9 39.5 26.4 Kingdom Come Deliverance 2 124 95 77.8 56.3 38.9 21.2 Indiana Jones and the Great Circle 108 68 54 0 0 Stalker 2 78 68 57 47 32 3 Call of Duty Black Ops 6 130 119 78 75 52 29 40 37 25 19 Until Dawn 140 90 60 44 30 15 35.5 22.1 14.9 10.6 God of War Ragnarök 147 119 104 95 70 39 43.6 34.2 31.7 27.4 Final Fantasy XVI 68 67 58 54 35 18 17.4 16.4 15 14.1 Space Marine 2 112 93 89 78 52 26 36.8 31.3 30.6 22.7 Star Wars Outlaws 58 53 45 36 24 9 22.9 20.8 16.2 8.74 Black Myth: Wukong 86 65 50 27 20 10 Once Human 210 133 114 103 61 30 The First Descendant 166 106 85 72 45 24 F1 24 305 267 196 67 43 19 90 50 49 10 Alone in the Dark 240 216 186.8 109.2 62.8 14.1 Alan Wake 2 71 65 60 37 17.5 17.8 15.3 13.8 Total War Pharaoh 429 266 158 123 83 40 80.7 50.4 29.5 19 Cyberpunk 2077 2.2 Phantom Liberty 144 109 91 77 45 18 42 32 25 21 Baldur's Gate 3 141 112 99 97 64 33 48 38 33 32 F1 23 319 285 195.2 60.2 38 16.5 54.8 50.8 36.9 11.3 Diablo 4 278 237 206 174 112.7 55.4 48.6 42.8 38.8 34.5 Star Wars Jedi Survivor 85.1 74 69.3 65.4 40.8 19.3 21.8 20.1 19.1 Dead Island 2 304 258 184.2 138 89.7 43.5 57.4 46.2 31.4 25.4 The Last of Us 117.3 95.4 81.3 68.2 39.9 18.6 31.2 23.8 18.3 13.3 Resident Evil 4 Remake 154 109.1 99.6 74.2 53.2 28.9 25.2 19.2 17.1 9.16 Company of Heroes 3 238.8 199.6 145.8 145.1 102.9 56.4 38.5 35 26.5 28.2 Sons of the Forest 107.1 92.3 88.4 86.8 65.5 38.2 35.9 34.1 33 Atomic Heart 213 159.3 93.5 70.9 53.1 30.1 48.7 29.5 29.1 Returnal 111 106 97 82 59 32 26 29 26 21 Hogwarts Legacy 148.1 111.8 85.1 63 45 24 34.5 25.9 18.6 Dead Space Remake 94.6 91.4 77.8 77.2 49.5 36 29 23 20 7.4 The Witcher 3 v4 224 178 149 117 81 44 66.7 46.2 18.8 15.8 High On Life 287 170.6 141.3 109 65.1 26.4 77.5 41.2 34.6 28.2 The Callisto Protocol 162.3 161.7 160.1 189.3 120.3 67 46.25 34.95 Spider-Man Miles Morales 141.9 130.4 119.6 111.7 80.1 43.9 41.6 32 29.6 Uncharted Legacy of Thieves Collection 98.5 95.1 88.6 84.9 61.5 26.5 29 25 13 12.9 A Plague Tale Requiem 121.7 91.2 66.9 50.8 36 19.7 33 25.5 21.3 The Quarry 174 126 103 80.5 54.7 17.5 50.7 36.9 30.7 23.6 F1 22 294 228 239 68 42.8 20.7 110 82 68 25 12 Ghostwire Tokyo 188.3 177.6 177.2 175.5 101.5 46.1 53.7 51.5 50.8 45 Tiny Tina's Wonderlands 239 188 122 93 62.6 26.6 74.6 59.2 37.8 29.5 Cyberpunk 2077 1.6 139.3 107.4 90.2 79.9 47.7 20.4 44 37 27 24 GRID Legends 258 211 180.4 143.7 112.7 67.1 102 76 65 49 39.4 23.3 God of War 146 122 101 69 56 37 42.6 48 37 23 Forza Horizon 5 338 238 221 117 80 54 111 62 53 18 Guardians of the Galaxy 225 162 162 154 104 55 67 48 47 45 Far Cry 6 228 163 140 120 85 34 81 51 43 27 Borderlands 3 242 186.7 124.8 93.9 64.8 33.8 Control 236 130.5 92.6 58.4 28.4 Far Cry New Dawn 201 165 156 139 111 58 Metro Exodus 267 138.8 102.6 80.2 62.9 38.3 Shadow of the Tomb Raider 326 183.3 163.6 148.1 96 46.4 Strange Brigade 615 269 216 190 129.1 69.8 175 77 64 56 46.5 Far Cry 5 231 181 167 157 109 54 108 59 55 52 37 18 X-Plane 11.11 205 186 150 125 106 89 73 55 Final Fantasy XV Benchmark 231 157 109 78 43 89 50 35 25 13.4 Dota 2 Reborn 297 264 253 229 143 150 131 115 107 44 The Witcher 3 583 380 216 111 80 66 179 102 60 33 GTA V 188 187 185 125 90.3 88.9 162 156 92 46 37.3 NVIDIA GeForce RTX 4060 NVIDIA GeForce RTX 2050 Mobile low med. high ultra QHD 4K low med. high ultra QHD 4K < 30 fps < 60 fps < 120 fps ≥ 120 fps 2 14 48 2 25 36 7 29 27 4 9 31 15 6 25 28 2 27 24 5 2 < 30 fps < 60 fps < 120 fps ≥ 120 fps 6 18 13 4 11 27 6 2 19 19 7 30 10 1 3 4 3 2
log 09. 00:45:05
#0 ran 0s before starting gpusingle class +0s ... 0s
#1 checking url part for id 11593 +0s ... 0s
#2 checking url part for id 11108 +0s ... 0s
#3 redirected to Ajax server, took 1752014705s time from redirect:0 +0s ... 0s
#4 did not recreate cache, as it is less than 5 days old! Created at Mon, 07 Jul 2025 05:22:05 +0200 +0s ... 0s
#5 composed specs +0.005s ... 0.005s
#6 did output specs +0s ... 0.005s
#7 start showIntegratedCPUs +0s ... 0.005s
#8 getting avg benchmarks for device 11593 +0.021s ... 0.026s
#9 got single benchmarks 11593 +0.009s ... 0.035s
#10 getting avg benchmarks for device 11108 +0.004s ... 0.039s
#11 got single benchmarks 11108 +0.019s ... 0.058s
#12 got avg benchmarks for devices +0s ... 0.058s
#13 min, max, avg, median took s +0.059s ... 0.117s
#14 before gaming benchmark output +0s ... 0.117s
#15 Got 1300 rows for game benchmarks. +0.048s ... 0.165s
#16 composed SQL query for gamebenchmarks +0s ... 0.165s
#17 got data and put it in $dataArray +0.006s ... 0.171s
#18 benchmarks composed for output. +0.042s ... 0.213s
#19 calculated avg scores. +0s ... 0.213s
#20 return log +0.004s ... 0.217s