AMD Radeon 680M vs NVIDIA GeForce GTX 1660 Ti Max-Q
AMD Radeon 680M ► remove from comparison
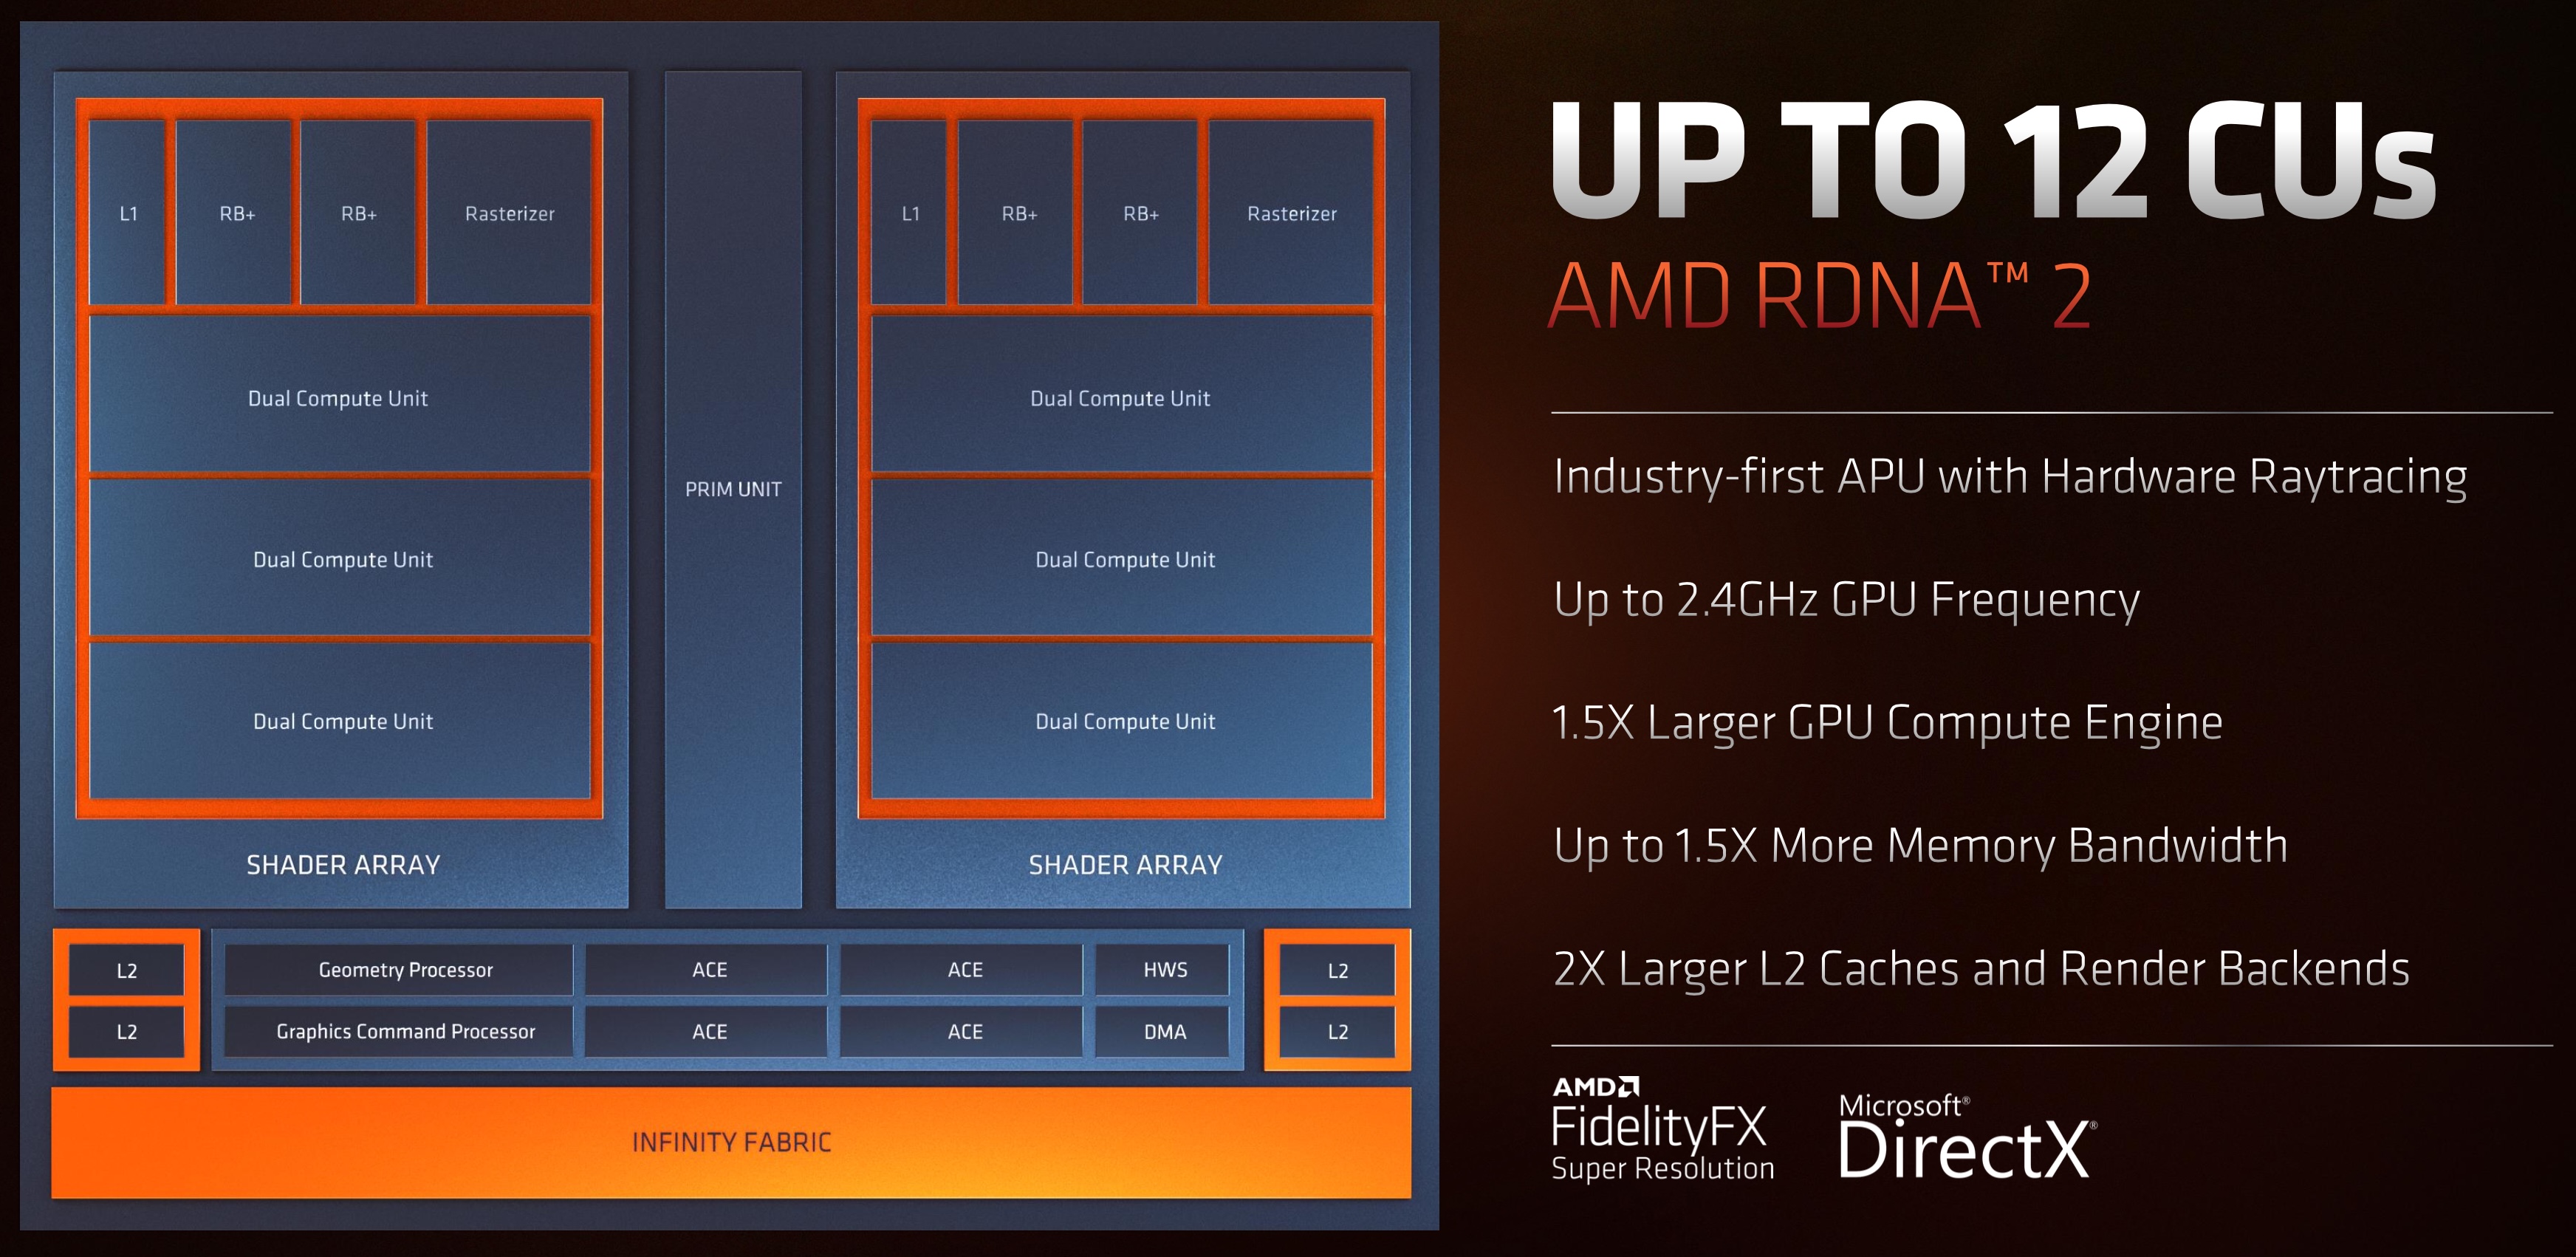
The AMD Radeon 680M is an integrated GPU in the Ryzen 6000 series for laptops (Rembrandt, e.g. Ryzen 9 6980HX ). The iGPU is based on the RDNA2 architecture and has 12 CUs (= 768 shaders) clocked at up to 2,400 MHz (depending on the CPU model). The 680M and 660M iGPUs are the first integrated graphics card with hardware raytracing support, although the performance is too slow to use it in current games.
Thanks to the new architecture, high core count and the increased maximum core clock, the Radeon 680M should be clearly faster then the old Radeon Vega 8 iGPUs . Therefore, the 680M should be the fastest integrated graphics card in early 2022. Compared to the dedicated Radeon 5300M (also RDNA), the 680M should still be significantly slower. According to AMD, the Radeon 680M (in the 6800U) is faster than a dedicated Nvidia GeForce MX450 and best suited for 1080p gaming and low details (for AAA games).
Thanks to the modern 6nm process and clever power-saving features, the power consumption is comparatively low (according to AMD), so the graphics card can also be used for slim and light notebooks (depending on the CPU model). The whole Ryzen 6000 chip can be configured down to 15W.
NVIDIA GeForce GTX 1660 Ti Max-Q ► remove from comparison
The Nvidia GeForce GTX 1660 Ti with Max-Q Design is a mobile graphics card for laptops that is based on the Turing architecture (TU116 chip). It is designed for thin and light laptops and about 10-15% slower than a regular GTX 1660 Ti for laptops (depending on the cooling capabilities). According to the specifications, the Max-Q variant clocks 22% slower for the base speed and 16% for the boost speed.
Compared to the faster RTX 2000 GPUs (e.g. RTX 2060 ), the 1660Ti integrates no Raytracing or Tensor cores. The performance is similar to the old GTX 1070 (Max-Q) but at a reduced TGP of 60 Watt (versus 80 of the laptop version 115 Watt of the desktop version).
In April 2020 Nvidia refreshed the GTX 1660 Ti with the new codename N18E-G0-A1 with similar specs and pin compatible to the refreshed RTX chips (e.g., RTX 2070 Super Mobile ).
The Turing generation did not only introduce raytracing for the RTX cards, but also optimized the architecture of the cores and caches. According to Nvidia the CUDA cores offer now a concurrent execution of floating point and integer operations for increased performance in compute-heavy workloads of modern games. Furthermore, the caches were reworked (new unified memory architecture with twice the cache compared to Pascal). This leads to 50% more instructions per clock and a 40% more power efficient usage compared to Pascal.
Nvidia specifies a power consumption of 60 Watt TGP (Total Graphics Power) and therefore 20 Watts lower than a normal (Max-P) 1660Ti for laptops . Therefore, the Max-Q variant is well suited for thin and light gaming laptops. The TU116 chip is manufactured in 12nm FFN at TSMC.
AMD Radeon 680M NVIDIA GeForce GTX 1660 Ti Max-Q GeForce GTX 1600 Series Codename RDNA 2 Rembrandt N18E-G0 Architecture RDNA 2 Turing Pipelines 768 - unified 1536 - unified Core Speed 2400 (Boost) MHz 1140 - 1335 (Boost) MHz Shared Memory no no API DirectX 12_1 DirectX 12_1, OpenGL 4.6 Power Consumption 45 Watt 60 Watt technology 6 nm 12 nm Features Tiled Rasterization, Shared Memory (up to Dual-Channel DDR4-3200) Date of Announcement 04.01.2022 23.04.2019 Memory Speed 12000 MHz Memory Bus Width 192 Bit Memory Type GDDR6 Max. Amount of Memory 6 GB Notebook Size medium sized Link to Manufacturer Page www.nvidia.com
CPU in Radeon 680M GPU Base Speed GPU Boost / Turbo AMD Ryzen 9 6980HX 8 x 3300 MHz, 45 W ? MHz 2400 MHz AMD Ryzen 9 PRO 6950H 8 x 3300 MHz, 45 W ? MHz 2400 MHz AMD Ryzen 9 6900HX 8 x 3300 MHz, 45 W ? MHz 2400 MHz » show 14 more AMD Ryzen 9 6980HS 8 x 3300 MHz, 35 W ? MHz 2400 MHz AMD Ryzen 9 6900HS 8 x 3300 MHz, 35 W ? MHz 2400 MHz AMD Ryzen 9 PRO 6950HS 8 x 3300 MHz, 35 W ? MHz 2400 MHz AMD Ryzen 7 6800H 8 x 3200 MHz, 45 W ? MHz 2200 MHz AMD Ryzen 7 PRO 6850H 8 x 3200 MHz, 45 W ? MHz 2200 MHz AMD Ryzen 7 7735HS 8 x 3200 MHz, 35 W ? MHz 2200 MHz AMD Ryzen 7 7735H 8 x 3200 MHz, 35 W ? MHz 2200 MHz AMD Ryzen 7 PRO 6850HS 8 x 3200 MHz, 35 W ? MHz 2200 MHz AMD Ryzen 7 6800HS 8 x 3200 MHz, 35 W ? MHz 2200 MHz AMD Ryzen 7 7735U 8 x 2700 MHz, 28 W ? MHz 2200 MHz AMD Ryzen 7 PRO 6860Z 8 x 2700 MHz, 28 W ? MHz 2200 MHz AMD Ryzen 7 7736U 8 x 2700 MHz, 28 W ? MHz 2200 MHz AMD Ryzen 7 PRO 6850U 8 x 2700 MHz, 28 W ? MHz 2200 MHz AMD Ryzen 7 6800U 8 x 2700 MHz, 28 W ? MHz 2200 MHz min. - max. ? MHz 2200 - 2400 MHz
Benchmarks Performance Rating - 3DMark 11 + Fire Strike + Time Spy - Radeon 680M
3.1 pt (9%)
...
...
max:
Performance Rating - 3DMark 11 + Fire Strike + Time Spy - GeForce GTX 1660 Ti Max-Q
6.1 pt (18%)
...
NVIDIA GeForce GTX 1660 Ti Max-Q
...
max:
3DMark - 3DMark Time Spy Score
min: 1546 avg: 2497 median: 2594.5 (7%) max: 2914 Points
min: 4547 avg: 5197 median: 5072 (15%) max: 6395 Points
3DMark - 3DMark Time Spy Graphics
min: 1359 avg: 2229 median: 2313 (6%) max: 2607 Points
min: 4867 avg: 5089 median: 5084.5 (13%) max: 5440 Points
3DMark - 3DMark Ice Storm Unlimited Graphics
min: 111130 avg: 334841 median: 359776 (41%) max: 419088 Points
min: 220799 avg: 314100 median: 306910 (35%) max: 414592 Points
3DMark - 3DMark Ice Storm Extreme Graphics
min: 64259 avg: 152833 median: 149024 (19%) max: 199788 Points
min: 76153 avg: 110626 median: 110626 (14%) max: 145099 Points
3DMark - 3DMark Cloud Gate Score
min: 21960 avg: 29933 median: 31002 (33%) max: 35309 Points
min: 16807 avg: 29350 median: 33027 (35%) max: 39942 Points
3DMark - 3DMark Cloud Gate Graphics
min: 24634 avg: 40893 median: 43250 (11%) max: 50120 Points
min: 38321 avg: 63736 median: 63086 (17%) max: 89505 Points
3DMark - 3DMark Fire Strike Standard Score
min: 3531 avg: 6112 median: 6292 (11%) max: 6993 Points
min: 10103 avg: 11548 median: 11615 (20%) max: 12739 Points
3DMark - 3DMark Fire Strike Standard Graphics
min: 3791 avg: 6689 median: 6865 (8%) max: 7653 Points
min: 12903 avg: 13356 median: 13355 (15%) max: 13870 Points
3DMark - 3DMark Ice Storm Graphics
min: 68280 avg: 208623 median: 209290 (25%) max: 310414 Points
min: 59373 avg: 104094 median: 86295 (10%) max: 166615 Points
3DMark - 3DMark Wild Life Unlimited
min: 14403 avg: 15238 median: 15237.5 (8%) max: 16072 Points
3DMark - 3DMark Wild Life Extreme Unlimited
min: 2476 avg: 3812 median: 3955 (5%) max: 4497 Points
3DMark 11 - 3DM11 Performance Score
min: 6723 avg: 9969 median: 10377 (14%) max: 11523 Points
min: 12279 avg: 15364 median: 15913 (22%) max: 17377 Points
3DMark 11 - 3DM11 Performance GPU
min: 6858 avg: 10030 median: 10399 (9%) max: 11668 Points
min: 17010 avg: 17711 median: 17439 (15%) max: 18653 Points
3DMark Vantage + AMD Radeon 680M 3DMark Vantage - 3DM Vant. Perf. total
min: 17643 avg: 31620 median: 34600 (10%) max: 39139 Points
3DM Vant. Perf. total + NVIDIA GeForce GTX 1660 Ti Max-Q
31845 Points (9%)
3DM Vant. Perf. GPU no PhysX + AMD Radeon 680M 3DMark Vantage - 3DM Vant. Perf. GPU no PhysX
min: 14306 avg: 27350 median: 29953 (17%) max: 34407 Points
3DM Vant. Perf. GPU no PhysX + NVIDIA GeForce GTX 1660 Ti Max-Q
34951 Points (20%)
3DMark 05 - 3DMark 05 - Standard
min: 11711 avg: 43633 median: 46753 (51%) max: 54628 Points
3DMark 06 3DMark 06 - Standard 1366x768 + AMD Radeon 680M
25274 Points (33%)
3DMark 06 - Standard 1280x1024 + AMD Radeon 680M
min: 13533 avg: 31075 median: 34617 (45%) max: 39654 Points
3DMark 06 - Standard 1280x1024 + NVIDIA GeForce GTX 1660 Ti Max-Q
min: 24029 avg: 28247 median: 25211 (33%) max: 38536 Points
Unigine Valley 1.0 - Unigine Valley 1.0 DX
min: 11.6 avg: 17.8 median: 18.9 (6%) max: 23.7 fps
Blender - Blender 3.3 Classroom HIP *
min: 270 avg: 347.4 median: 331.5 (27%) max: 555 Seconds
SPECviewperf 12 + AMD Radeon 680M SPECviewperf 12 - specvp12 sw-03
min: 58.6 avg: 91 median: 90.3 (22%) max: 120 fps
specvp12 snx-02 + AMD Radeon 680M SPECviewperf 12 - specvp12 snx-02
min: 37.5 avg: 54.4 median: 58.5 (9%) max: 65.6 fps
specvp12 showcase-01 + AMD Radeon 680M SPECviewperf 12 - specvp12 showcase-01
min: 17.5 avg: 29.9 median: 30.4 (7%) max: 36.2 fps
specvp12 mediacal-01 + AMD Radeon 680M SPECviewperf 12 - specvp12 mediacal-01
min: 15 avg: 33.2 median: 30.5 (8%) max: 51.3 fps
specvp12 maya-04 + AMD Radeon 680M SPECviewperf 12 - specvp12 maya-04
min: 37.9 avg: 60.5 median: 61.9 (17%) max: 75.7 fps
specvp12 energy-01 + AMD Radeon 680M SPECviewperf 12 - specvp12 energy-01
min: 3.14 avg: 36.4 median: 32.2 (29%) max: 80.4 fps
specvp12 creo-01 + AMD Radeon 680M SPECviewperf 12 - specvp12 creo-01
min: 30.9 avg: 43.5 median: 44.5 (18%) max: 56.7 fps
specvp12 catia-04 + AMD Radeon 680M SPECviewperf 12 - specvp12 catia-04
min: 48.7 avg: 67.9 median: 70.9 (12%) max: 91.2 fps
specvp12 3dsmax-05 + AMD Radeon 680M SPECviewperf 12 - specvp12 3dsmax-05
min: 46.9 avg: 76.5 median: 80.5 (14%) max: 90.8 fps
SPECviewperf 13 specvp13 sw-04 + AMD Radeon 680M SPECviewperf 13 - specvp13 sw-04
min: 63.1 avg: 92.5 median: 98 (26%) max: 111 fps
specvp13 snx-03 + AMD Radeon 680M SPECviewperf 13 - specvp13 snx-03
min: 40.2 avg: 94.7 median: 107 (12%) max: 124 fps
specvp13 showcase-02 + AMD Radeon 680M SPECviewperf 13 - specvp13 showcase-02
min: 17.4 avg: 29.6 median: 29.9 (7%) max: 37.5 fps
specvp13 medical-02 + AMD Radeon 680M SPECviewperf 13 - specvp13 medical-02
min: 20.5 avg: 43 median: 41.4 (9%) max: 63.1 fps
specvp13 maya-05 + AMD Radeon 680M SPECviewperf 13 - specvp13 maya-05
min: 58.3 avg: 91.6 median: 98.7 (11%) max: 113 fps
specvp13 energy-02 + AMD Radeon 680M SPECviewperf 13 - specvp13 energy-02
min: 1.04 avg: 10.8 median: 11.9 (4%) max: 14.6 fps
specvp13 creo-02 + AMD Radeon 680M SPECviewperf 13 - specvp13 creo-02
min: 44.9 avg: 69.8 median: 70.8 (10%) max: 87.1 fps
specvp13 catia-05 + AMD Radeon 680M SPECviewperf 13 - specvp13 catia-05
min: 73.9 avg: 97.2 median: 99.8 (11%) max: 118 fps
specvp13 3dsmax-06 + AMD Radeon 680M SPECviewperf 13 - specvp13 3dsmax-06
min: 48.3 avg: 75.7 median: 79.2 (14%) max: 90.3 fps
SPECviewperf 2020 specvp2020 solidworks-05 1080p + AMD Radeon 680M SPECviewperf 2020 - specvp2020 solidworks-05 1080p
min: 39.7 avg: 45.2 median: 45.2 (9%) max: 50.6 fps
specvp2020 snx-04 1080p + AMD Radeon 680M SPECviewperf 2020 - specvp2020 snx-04 1080p
min: 40.4 avg: 94.1 median: 118 (19%) max: 124 fps
specvp2020 medical-03 1080p + AMD Radeon 680M SPECviewperf 2020 - specvp2020 medical-03 1080p
min: 15.4 avg: 21.8 median: 15.6 (11%) max: 34.3 fps
specvp2020 maya-06 1080p + AMD Radeon 680M SPECviewperf 2020 - specvp2020 maya-06 1080p
min: 88.1 avg: 108 median: 102 (15%) max: 134 fps
specvp2020 energy-03 1080p + AMD Radeon 680M SPECviewperf 2020 - specvp2020 energy-03 1080p
min: 0.85 avg: 7.5 median: 6.7 (5%) max: 14.9 fps
specvp2020 creo-03 1080p + AMD Radeon 680M SPECviewperf 2020 - specvp2020 creo-03 1080p
min: 35.3 avg: 47 median: 45.9 (23%) max: 59.8 fps
specvp2020 catia-06 1080p + AMD Radeon 680M SPECviewperf 2020 - specvp2020 catia-06 1080p
min: 18.9 avg: 24.3 median: 21 (14%) max: 32.9 fps
specvp2020 3dsmax-07 1080p + AMD Radeon 680M SPECviewperf 2020 - specvp2020 3dsmax-07 1080p
min: 28.5 avg: 33.6 median: 35 (16%) max: 37.2 fps
specvp2020 solidworks-05 4k + AMD Radeon 680M SPECviewperf 2020 - specvp2020 solidworks-05 4k
min: 11.6 avg: 17.6 median: 18.7 (6%) max: 21.2 fps
specvp2020 snx-04 4k + AMD Radeon 680M SPECviewperf 2020 - specvp2020 snx-04 4k
min: 33 avg: 52.8 median: 56.7 (6%) max: 62.2 fps
specvp2020 medical-03 4k + AMD Radeon 680M SPECviewperf 2020 - specvp2020 medical-03 4k
min: 3.73 avg: 7.9 median: 8.6 (8%) max: 12.1 fps
specvp2020 maya-06 4k + AMD Radeon 680M SPECviewperf 2020 - specvp2020 maya-06 4k
min: 29.5 avg: 42.6 median: 43.9 (7%) max: 50.1 fps
specvp2020 energy-03 4k + AMD Radeon 680M SPECviewperf 2020 - specvp2020 energy-03 4k
min: 4.77 avg: 10.1 median: 8 (2%) max: 19.4 fps
specvp2020 creo-03 4k + AMD Radeon 680M SPECviewperf 2020 - specvp2020 creo-03 4k
min: 17.5 avg: 26.2 median: 29 (14%) max: 32 fps
specvp2020 catia-06 4k + AMD Radeon 680M SPECviewperf 2020 - specvp2020 catia-06 4k
min: 13.1 avg: 18.9 median: 20.3 (13%) max: 22.8 fps
specvp2020 3dsmax-07 4k + AMD Radeon 680M SPECviewperf 2020 - specvp2020 3dsmax-07 4k
min: 9.26 avg: 16.5 median: 17.5 (7%) max: 20.1 fps
Cinebench R10 Cinebench R10 Shading (32bit) + AMD Radeon 680M Cinebench R10 - Cinebench R10 Shading (32bit)
min: 6573 avg: 14793 median: 15332 (11%) max: 17565 Points
Cinebench R10 Shading (32bit) + NVIDIA GeForce GTX 1660 Ti Max-Q
min: 6820 avg: 9290 median: 8562.5 (6%) max: 13213 Points
Cinebench R11.5 Cinebench R11.5 OpenGL 64 Bit + AMD Radeon 680M Cinebench R11.5 - Cinebench R11.5 OpenGL 64 Bit
min: 59.85 avg: 98.1 median: 109.4 (38%) max: 113.68 fps
Cinebench R11.5 OpenGL 64 Bit + NVIDIA GeForce GTX 1660 Ti Max-Q
min: 49.83 avg: 59.5 median: 59.5 (21%) max: 69.2 fps
Cinebench R15 + AMD Radeon 680M Cinebench R15 - Cinebench R15 OpenGL 64 Bit
min: 72.39 avg: 137.6 median: 145 (8%) max: 186.07 fps
Cinebench R15 OpenGL 64 Bit + NVIDIA GeForce GTX 1660 Ti Max-Q
min: 78.2 avg: 100.5 median: 96.9 (6%) max: 130.7 fps
Cinebench R15 OpenGL Ref. Match 64 Bit + AMD Radeon 680M Cinebench R15 - Cinebench R15 OpenGL Ref. Match 64 Bit
min: 97.9 avg: 97.9 median: 97.9 (98%) max: 98 %
Cinebench R15 OpenGL Ref. Match 64 Bit + NVIDIA GeForce GTX 1660 Ti Max-Q
99.6 % (100%)
GFXBench - GFXBench 5.0 4K Aztec Ruins High Tier Offscreen
23.2 fps (9%)
GFXBench - GFXBench 5.0 Aztec Ruins High Tier Offscreen
min: 47.8 avg: 49.2 median: 49.2 (9%) max: 50.6 fps
110.2 fps (20%)
GFXBench - GFXBench 5.0 Aztec Ruins Normal Tier Offscreen
min: 120 avg: 120.6 median: 120.6 (9%) max: 121.1 fps
253.8 fps (19%)
GFXBench - GFXBench Car Chase Offscreen
min: 105.6 avg: 107.5 median: 107.5 (12%) max: 109.3 fps
227.4 fps (26%)
GFXBench 3.1 - GFXBench Manhattan ES 3.1 Offscreen
345.8 fps (7%)
GFXBench 3.0 - GFXBench 3.0 Manhattan Offscreen
360.6 fps (21%)
GFXBench (DX / GLBenchmark) 2.7 + NVIDIA GeForce GTX 1660 Ti Max-Q GFXBench (DX / GLBenchmark) 2.7 - GFXBench T-Rex HD Offscreen C24Z16
943 fps (8%)
Basemark GPU 1.2 - Basemark GPU 1.2 Vulkan Official Medium Offscreen 1080
min: 104.6 avg: 199.3 median: 234.5 (1%) max: 289 fps
Basemark GPU 1.2 - Basemark GPU 1.2 Vulkan Official High Offscreen 2160
min: 3.64 avg: 11.3 median: 3.6 (1%) max: 24.1 fps
Geekbench 6.2 - Geekbench 6.2 GPU OpenCL
min: 14210 avg: 25785 median: 27759 (8%) max: 29288 Points
Geekbench 6.2 - Geekbench 6.2 GPU Vulkan
min: 18321 avg: 25952 median: 27324 (9%) max: 29819 Points
LuxMark v2.0 64Bit - LuxMark v2.0 Room GPU
min: 353 avg: 693 median: 584.5 (3%) max: 1958 Samples/s
2141 Samples/s (10%)
LuxMark v2.0 64Bit - LuxMark v2.0 Sala GPU
min: 766 avg: 1162 median: 1290.5 (2%) max: 1406 Samples/s
4254 Samples/s (7%)
ComputeMark v2.1 - ComputeMark v2.1 Result
min: 3439 avg: 5712 median: 5921.5 (6%) max: 7111 Points
10027 Points (11%)
Power Consumption - Furmark Stress Test Power Consumption - external Monitor *
min: 35 avg: 57.6 median: 58.3 (8%) max: 80.2 Watt
min: 77.6 avg: 86.3 median: 86.3 (12%) max: 95 Watt
Power Consumption - The Witcher 3 Power Consumption - external Monitor *
min: 28.2 avg: 53.7 median: 54.1 (8%) max: 76.8 Watt
min: 92 avg: 96.6 median: 96.6 (13%) max: 101.2 Watt
Power Consumption - Witcher 3 Power Consumption *
min: 40.1 avg: 53.5 median: 50.1 (11%) max: 69 Watt
min: 94.2 avg: 104.8 median: 106.9 (24%) max: 121 Watt
Power Consumption - Witcher 3 ultra Power Efficiency
min: 0.2296 avg: 0.4 median: 0.4 (41%) max: 0.558 fps per Watt
min: 0.4388 avg: 0.5 median: 0.5 (47%) max: 0.537 fps per Watt
Power Consumption - Witcher 3 ultra Power Efficiency - external Monitor
min: 0.2466 avg: 0.4 median: 0.4 (36%) max: 0.713 fps per Watt
min: 0.4822 avg: 0.5 median: 0.5 (44%) max: 0.578 fps per Watt
Emissions Witcher 3 Fan Noise + AMD Radeon 680M Emissions - Witcher 3 Fan Noise
min: 27.5 avg: 38.9 median: 40.2 (64%) max: 48.6 dB(A)
Witcher 3 Fan Noise + NVIDIA GeForce GTX 1660 Ti Max-Q
min: 34 avg: 43.4 median: 43.7 (70%) max: 53.8 dB(A)
Clock Speed - GPU Clock Witcher 3 ultra
1724 MHz (68%)
1501 MHz (59%)
Clock Speed - GPU Clock Speed Furmark
1062 MHz (42%)
Average Benchmarks AMD Radeon 680M → 100% n=25 Average Benchmarks NVIDIA GeForce GTX 1660 Ti Max-Q → 149% n=25
- Range of benchmark values for this graphics card
- Average benchmark values for this graphics card
* Smaller numbers mean a higher performance
1 This benchmark is not used for the average calculation
Game Benchmarks The following benchmarks stem from our benchmarks of review laptops. The performance depends on the used graphics memory, clock rate, processor, system settings, drivers, and operating systems. So the results don't have to be representative for all laptops with this GPU. For detailed information on the benchmark results, click on the fps number.
100%
Radeon 680M:
89.3 [X] Maxtang MTN-FP750 AMD Ryzen 7 7735HS 3.2GHz
Radeon 680M
min:
12.9 fps, P0.1:
14.8 fps, P1:
60.6 fps, max:
238 fps
175.4 [X] Aoostar GEM10 AMD Ryzen 7 6800H 3.2GHz
Radeon 680M
min:
13.2 fps, P0.1:
40.9 fps, P1:
110.3 fps, max:
400 fps
~ 132 fps
100%
Radeon 680M:
58.8 [X] Maxtang MTN-FP750 AMD Ryzen 7 7735HS 3.2GHz
Radeon 680M
min:
13.1 fps, P0.1:
13.5 fps, P1:
35.1 fps, max:
219 fps
131.4 [X] Aoostar GEM10 AMD Ryzen 7 6800H 3.2GHz
Radeon 680M
min:
13.3 fps, P0.1:
58.9 fps, P1:
91.8 fps, max:
242 fps
~ 95 fps
100%
Radeon 680M:
58.4 [X] Maxtang MTN-FP750 AMD Ryzen 7 7735HS 3.2GHz
Radeon 680M
min:
10.6 fps, P0.1:
13.3 fps, P1:
31.3 fps, max:
210 fps
124.2 [X] Aoostar GEM10 AMD Ryzen 7 6800H 3.2GHz
Radeon 680M
min:
12.7 fps, P0.1:
66.3 fps, P1:
93 fps, max:
223 fps
~ 91 fps
100%
Radeon 680M:
18.3 [X] Asus ROG Zephyrus G14 AMD Ryzen 9 6900HS 3.3GHz
Radeon 680M
min:
8.74 fps, P0.1:
9.08 fps, P1:
10.3 fps, max:
48.6 fps
fps
100%
Radeon 680M:
16 [X] Asus ROG Zephyrus G14 AMD Ryzen 9 6900HS 3.3GHz
Radeon 680M
min:
8.25 fps, P0.1:
8.44 fps, P1:
9.66 fps, max:
59.3 fps
fps
100%
Radeon 680M:
14.9 [X] Asus ROG Zephyrus G14 AMD Ryzen 9 6900HS 3.3GHz
Radeon 680M
min:
6.84 fps, P0.1:
6.96 fps, P1:
8.52 fps, max:
45.9 fps
fps
100%
Radeon 680M:
24.3 [X] Asus ROG Zephyrus G14 AMD Ryzen 9 6900HS 3.3GHz
Radeon 680M
min:
15.9 fps, P0.1:
17.1 fps, P1:
18.7 fps, max:
48.6 fps
fps
100%
Radeon 680M:
18.3 [X] Asus ROG Zephyrus G14 AMD Ryzen 9 6900HS 3.3GHz
Radeon 680M
min:
14.3 fps, P0.1:
14.4 fps, P1:
14.8 fps, max:
23.2 fps
fps
100%
Radeon 680M:
12.3 [X] Asus ROG Zephyrus G14 AMD Ryzen 9 6900HS 3.3GHz
Radeon 680M
min:
10 fps, P0.1:
10.1 fps, P1:
10.5 fps, max:
14.9 fps
fps
100%
Radeon 680M:
8.7 [X] Asus ROG Zephyrus G14 AMD Ryzen 9 6900HS 3.3GHz
Radeon 680M
min:
7.52 fps, P0.1:
7.52 fps, P1:
7.67 fps, max:
11.1 fps
fps
100%
Radeon 680M:
43.3 72.4 [X] Asus ROG Zephyrus G14 AMD Ryzen 9 6900HS 3.3GHz
Radeon 680M
min:
61 fps
74.6 84.4 [X] Aoostar GEM10 AMD Ryzen 7 6800H 3.2GHz
Radeon 680M
~ 69 fps
100%
Radeon 680M:
33.3 62.5 65.1 [X] Asus ROG Zephyrus G14 AMD Ryzen 9 6900HS 3.3GHz
Radeon 680M
min:
54 fps
68.6 [X] Aoostar GEM10 AMD Ryzen 7 6800H 3.2GHz
Radeon 680M
~ 57 fps
100%
Radeon 680M:
21.6 48.4 51.8 [X] Aoostar GEM10 AMD Ryzen 7 6800H 3.2GHz
Radeon 680M
52.6 [X] Asus ROG Zephyrus G14 AMD Ryzen 9 6900HS 3.3GHz
Radeon 680M
min:
38 fps
~ 44 fps
100%
Radeon 680M:
16.9 43.6 46.3 [X] Asus ROG Zephyrus G14 AMD Ryzen 9 6900HS 3.3GHz
Radeon 680M
min:
31 fps
46.9 [X] Aoostar GEM10 AMD Ryzen 7 6800H 3.2GHz
Radeon 680M
~ 38 fps
100%
Radeon 680M:
34 [X] Asus ROG Zephyrus G14 AMD Ryzen 9 6900HS 3.3GHz
Radeon 680M
min:
4 fps
fps
100%
Radeon 680M:
32 [X] Asus ROG Zephyrus G14 AMD Ryzen 9 6900HS 3.3GHz
Radeon 680M
min:
3 fps
fps
100%
Radeon 680M:
30 [X] Asus ROG Zephyrus G14 AMD Ryzen 9 6900HS 3.3GHz
Radeon 680M
min:
6 fps
fps
100%
Radeon 680M:
24 [X] Asus ROG Zephyrus G14 AMD Ryzen 9 6900HS 3.3GHz
Radeon 680M
min:
6 fps
fps
100%
Radeon 680M:
80.3 [X] Asus ROG Zephyrus G14 AMD Ryzen 9 6900HS 3.3GHz
Radeon 680M
min:
25.7 fps, P0.1:
27.8 fps, P1:
36.1 fps, max:
135.6 fps
fps
100%
Radeon 680M:
57.9 [X] Asus ROG Zephyrus G14 AMD Ryzen 9 6900HS 3.3GHz
Radeon 680M
min:
13.7 fps, P0.1:
19 fps, P1:
23.3 fps, max:
148.9 fps
fps
100%
Radeon 680M:
42 [X] Asus ROG Zephyrus G14 AMD Ryzen 9 6900HS 3.3GHz
Radeon 680M
min:
12.4 fps, P0.1:
12.5 fps, P1:
17.1 fps, max:
98.1 fps
fps
100%
Radeon 680M:
39.5 [X] Asus ROG Zephyrus G14 AMD Ryzen 9 6900HS 3.3GHz
Radeon 680M
min:
5.97 fps, P0.1:
7.1 fps, P1:
12.6 fps, max:
141 fps
fps
100%
Radeon 680M:
32.1 34.8 [X] Aoostar GEM10 2.11
AMD Ryzen 7 6800H 3.2GHz
Radeon 680M
min:
29.9 fps, max:
40.9 fps
35.7 [X] Asus ROG Zephyrus G14 AMD Ryzen 9 6900HS 3.3GHz
Radeon 680M
min:
16 fps
~ 34 fps
100%
Radeon 680M:
25.1 27.2 [X] Aoostar GEM10 2.11
AMD Ryzen 7 6800H 3.2GHz
Radeon 680M
min:
23.6 fps, max:
31.8 fps
27.3 [X] Asus ROG Zephyrus G14 AMD Ryzen 9 6900HS 3.3GHz
Radeon 680M
min:
12 fps
~ 27 fps
100%
Radeon 680M:
20.1 21.3 [X] Aoostar GEM10 2.11
AMD Ryzen 7 6800H 3.2GHz
Radeon 680M
min:
18.4 fps, max:
25.6 fps
21.8 [X] Asus ROG Zephyrus G14 AMD Ryzen 9 6900HS 3.3GHz
Radeon 680M
min:
14 fps
~ 21 fps
100%
Radeon 680M:
18.1 [X] Aoostar GEM10 2.11
AMD Ryzen 7 6800H 3.2GHz
Radeon 680M
min:
15.3 fps, max:
23.2 fps
18.4 20 [X] Asus ROG Zephyrus G14 AMD Ryzen 9 6900HS 3.3GHz
Radeon 680M
min:
13 fps
~ 19 fps
100%
Radeon 680M:
10.4 fps
100%
Radeon 680M:
42.5 [X] Asus ROG Zephyrus G14 AMD Ryzen 9 6900HS 3.3GHz
Radeon 680M
min:
18.9 fps, P0.1:
20.9 fps, P1:
22.4 fps, max:
174.5 fps
fps
100%
Radeon 680M:
37.2 [X] Asus ROG Zephyrus G14 AMD Ryzen 9 6900HS 3.3GHz
Radeon 680M
min:
17.5 fps, P0.1:
18.9 fps, P1:
19.6 fps, max:
176.9 fps
fps
100%
Radeon 680M:
32.7 [X] Asus ROG Zephyrus G14 AMD Ryzen 9 6900HS 3.3GHz
Radeon 680M
min:
14.6 fps, P0.1:
14.8 fps, P1:
16.2 fps, max:
153.7 fps
fps
100%
Radeon 680M:
29.2 [X] Asus ROG Zephyrus G14 AMD Ryzen 9 6900HS 3.3GHz
Radeon 680M
min:
13.9 fps, P0.1:
14 fps, P1:
14.8 fps, max:
150.9 fps
fps
100%
Radeon 680M:
29 [X] Asus ROG Zephyrus G14 AMD Ryzen 9 6900HS 3.3GHz
Radeon 680M
min:
24 fps
fps
100%
Radeon 680M:
28 [X] Asus ROG Zephyrus G14 AMD Ryzen 9 6900HS 3.3GHz
Radeon 680M
min:
24 fps
fps
100%
Radeon 680M:
24 [X] Asus ROG Zephyrus G14 AMD Ryzen 9 6900HS 3.3GHz
Radeon 680M
min:
20 fps
fps
100%
Radeon 680M:
20 [X] Asus ROG Zephyrus G14 AMD Ryzen 9 6900HS 3.3GHz
Radeon 680M
min:
17 fps
fps
100%
Radeon 680M:
23.2 [X] Asus ROG Zephyrus G14 AMD Ryzen 9 6900HS 3.3GHz
Radeon 680M
min:
17 fps, P0.1:
17.1 fps, P1:
18.6 fps, max:
35.4 fps
fps
100%
Radeon 680M:
19.4 [X] Asus ROG Zephyrus G14 AMD Ryzen 9 6900HS 3.3GHz
Radeon 680M
min:
14.7 fps, P0.1:
15 fps, P1:
16 fps, max:
25.6 fps
fps
100%
Radeon 680M:
14.8 [X] Asus ROG Zephyrus G14 AMD Ryzen 9 6900HS 3.3GHz
Radeon 680M
min:
8.47 fps, P0.1:
8.62 fps, P1:
10.3 fps, max:
19.1 fps
fps
100%
Radeon 680M:
12.7 [X] Asus ROG Zephyrus G14 AMD Ryzen 9 6900HS 3.3GHz
Radeon 680M
min:
7.99 fps, P0.1:
8.15 fps, P1:
8.83 fps, max:
21.2 fps
fps
100%
Radeon 680M:
32.3 [X] Asus ROG Zephyrus G14 AMD Ryzen 9 6900HS 3.3GHz
Radeon 680M
min:
5.15 fps, P0.1:
5.29 fps, P1:
21.6 fps, max:
75.1 fps
fps
100%
Radeon 680M:
31.4 [X] Asus ROG Zephyrus G14 AMD Ryzen 9 6900HS 3.3GHz
Radeon 680M
min:
5.99 fps, P0.1:
9.32 fps, P1:
21.8 fps, max:
68 fps
fps
100%
Radeon 680M:
30 [X] Asus ROG Zephyrus G14 AMD Ryzen 9 6900HS 3.3GHz
Radeon 680M
min:
6.61 fps, P0.1:
6.88 fps, P1:
19.7 fps, max:
93.9 fps
fps
100%
Radeon 680M:
25.3 [X] Asus ROG Zephyrus G14 AMD Ryzen 9 6900HS 3.3GHz
Radeon 680M
min:
6.68 fps, P0.1:
9.1 fps, P1:
20.1 fps, max:
67.5 fps
fps
100%
Radeon 680M:
17.4 [X] Asus ROG Zephyrus G14 AMD Ryzen 9 6900HS 3.3GHz
Radeon 680M
min:
8.04 fps, P0.1:
8.86 fps, P1:
10.7 fps, max:
29.8 fps
fps
100%
Radeon 680M:
14.7 [X] Asus ROG Zephyrus G14 AMD Ryzen 9 6900HS 3.3GHz
Radeon 680M
min:
7.65 fps, P0.1:
8.39 fps, P1:
10.2 fps, max:
23.5 fps
fps
100%
Radeon 680M:
10.4 [X] Asus ROG Zephyrus G14 AMD Ryzen 9 6900HS 3.3GHz
Radeon 680M
min:
6.22 fps, P0.1:
6.34 fps, P1:
6.75 fps, max:
14.2 fps
fps
100%
Radeon 680M:
36 [X] Asus ROG Zephyrus G14 AMD Ryzen 9 6900HS 3.3GHz
Radeon 680M
min:
27.5 fps, P0.1:
27.7 fps, P1:
28.7 fps, max:
45.4 fps
fps
100%
Radeon 680M:
34.8 [X] Asus ROG Zephyrus G14 AMD Ryzen 9 6900HS 3.3GHz
Radeon 680M
min:
26.7 fps, P0.1:
26.9 fps, P1:
28.1 fps, max:
42.4 fps
fps
100%
Radeon 680M:
32 [X] Asus ROG Zephyrus G14 AMD Ryzen 9 6900HS 3.3GHz
Radeon 680M
min:
23.2 fps, P0.1:
24.5 fps, P1:
26.9 fps, max:
42.3 fps
fps
100%
Radeon 680M:
24.9 [X] Asus ROG Zephyrus G14 AMD Ryzen 9 6900HS 3.3GHz
Radeon 680M
min:
21.1 fps, P0.1:
21.1 fps, P1:
21.3 fps, max:
29.6 fps
fps
100%
Radeon 680M:
34.9 [X] Asus ROG Zephyrus G14 AMD Ryzen 9 6900HS 3.3GHz
Radeon 680M
min:
22.2 fps, P0.1:
22.8 fps, P1:
24.8 fps, max:
83.9 fps
36.9 [X] Aoostar GEM10 AMD Ryzen 7 6800H 3.2GHz
Radeon 680M
min:
23.7 fps, P0.1:
25.2 fps, P1:
27.4 fps, max:
72.5 fps
~ 36 fps
100%
Radeon 680M:
28 [X] Asus ROG Zephyrus G14 AMD Ryzen 9 6900HS 3.3GHz
Radeon 680M
min:
17.4 fps, P0.1:
18.6 fps, P1:
21 fps, max:
59.6 fps
28.3 [X] Aoostar GEM10 AMD Ryzen 7 6800H 3.2GHz
Radeon 680M
min:
8.76 fps, P0.1:
14.9 fps, P1:
21.7 fps, max:
144.4 fps
~ 28 fps
100%
Radeon 680M:
22.6 [X] Asus ROG Zephyrus G14 AMD Ryzen 9 6900HS 3.3GHz
Radeon 680M
min:
14.1 fps, P0.1:
14.6 fps, P1:
16.5 fps, max:
48.6 fps
23.3 [X] Aoostar GEM10 AMD Ryzen 7 6800H 3.2GHz
Radeon 680M
min:
16.6 fps, P0.1:
16.7 fps, P1:
18.3 fps, max:
42.6 fps
~ 23 fps
100%
Radeon 680M:
22.1 [X] Asus ROG Zephyrus G14 AMD Ryzen 9 6900HS 3.3GHz
Radeon 680M
min:
13.8 fps, P0.1:
14.2 fps, P1:
15.6 fps, max:
51 fps
22.8 [X] Aoostar GEM10 AMD Ryzen 7 6800H 3.2GHz
Radeon 680M
min:
15.6 fps, P0.1:
15.9 fps, P1:
17.6 fps, max:
42.5 fps
~ 22 fps
100%
Radeon 680M:
29.9 [X] Asus ROG Zephyrus G14 AMD Ryzen 9 6900HS 3.3GHz
Radeon 680M
min:
21.1 fps, P0.1:
22.6 fps, P1:
23.4 fps, max:
37.5 fps
fps
100%
Radeon 680M:
25.5 [X] Asus ROG Zephyrus G14 AMD Ryzen 9 6900HS 3.3GHz
Radeon 680M
min:
19.3 fps, P0.1:
19.4 fps, P1:
20.1 fps, max:
32.9 fps
fps
100%
Radeon 680M:
21.1 [X] Asus ROG Zephyrus G14 AMD Ryzen 9 6900HS 3.3GHz
Radeon 680M
min:
13.5 fps, P0.1:
13.6 fps, P1:
15.7 fps, max:
32.7 fps
fps
100%
Radeon 680M:
18 [X] Asus ROG Zephyrus G14 AMD Ryzen 9 6900HS 3.3GHz
Radeon 680M
min:
10.1 fps, P0.1:
10.8 fps, P1:
12.6 fps, max:
24.9 fps
fps
100%
Radeon 680M:
45.3 [X] Maxtang MTN-FP750 1070925
AMD Ryzen 7 7735HS 3.2GHz
Radeon 680M
min:
35 fps, P1:
30 fps, max:
54 fps
66.6 71 [X] Asus ROG Zephyrus G14 AMD Ryzen 9 6900HS 3.3GHz
Radeon 680M
min:
55 fps
71.8 [X] Acemagic AM20 1026791
AMD Ryzen 7 7735H 3.2GHz
Radeon 680M
min:
58 fps, P1:
53 fps, max:
83 fps
74.2 [X] Aoostar GOD77 1070925
AMD Ryzen 7 7735HS 3.2GHz
Radeon 680M
min:
62 fps, P1:
57 fps, max:
88 fps
76.1 [X] Aoostar GEM10 1093534
AMD Ryzen 7 6800H 3.2GHz
Radeon 680M
min:
60 fps, P1:
55 fps, max:
88 fps
~ 68 fps
100%
Radeon 680M:
40.1 [X] Maxtang MTN-FP750 1070925
AMD Ryzen 7 7735HS 3.2GHz
Radeon 680M
min:
33 fps, P1:
26 fps, max:
48 fps
56.3 63 [X] Asus ROG Zephyrus G14 AMD Ryzen 9 6900HS 3.3GHz
Radeon 680M
min:
51 fps
64.5 [X] Acemagic AM20 1026791
AMD Ryzen 7 7735H 3.2GHz
Radeon 680M
min:
56 fps, P1:
43 fps, max:
74 fps
66.2 [X] Aoostar GOD77 1070925
AMD Ryzen 7 7735HS 3.2GHz
Radeon 680M
min:
58 fps, P1:
54 fps, max:
78 fps
68 [X] Aoostar GEM10 1093534
AMD Ryzen 7 6800H 3.2GHz
Radeon 680M
min:
53 fps, P1:
47 fps, max:
79 fps
~ 60 fps
100%
Radeon 680M:
29.1 [X] Maxtang MTN-FP750 1070925
AMD Ryzen 7 7735HS 3.2GHz
Radeon 680M
min:
8 fps, P1:
15 fps, max:
34 fps
40.9 44.7 [X] Acemagic AM20 1026791
AMD Ryzen 7 7735H 3.2GHz
Radeon 680M
min:
37 fps, P1:
33 fps, max:
51 fps
45 [X] Asus ROG Zephyrus G14 AMD Ryzen 9 6900HS 3.3GHz
Radeon 680M
min:
38 fps
47.6 [X] Aoostar GOD77 1070925
AMD Ryzen 7 7735HS 3.2GHz
Radeon 680M
min:
38 fps, P1:
38 fps, max:
55 fps
47.8 [X] Aoostar GEM10 1093534
AMD Ryzen 7 6800H 3.2GHz
Radeon 680M
min:
37 fps, P1:
36 fps, max:
55 fps
~ 43 fps
100%
Radeon 680M:
9 [X] Asus ROG Zephyrus G14 AMD Ryzen 9 6900HS 3.3GHz
Radeon 680M
min:
6 fps
9.4 [X] Acemagic AM20 1026791
AMD Ryzen 7 7735H 3.2GHz
Radeon 680M
min:
6 fps, P1:
6 fps, max:
12 fps
10 [X] Aoostar GEM10 1093534
AMD Ryzen 7 6800H 3.2GHz
Radeon 680M
min:
6 fps, P1:
6 fps, max:
12 fps
10.7 ~ 10 fps
100%
Radeon 680M:
45.8 [X] Asus ROG Zephyrus G14 AMD Ryzen 9 6900HS 3.3GHz
Radeon 680M
min:
22 fps, P0.1:
22.9 fps, P1:
29.1 fps, max:
121.2 fps
fps
100%
Radeon 680M:
43.5 [X] Asus ROG Zephyrus G14 AMD Ryzen 9 6900HS 3.3GHz
Radeon 680M
min:
7.94 fps, P0.1:
15.4 fps, P1:
33 fps, max:
286 fps
fps
100%
Radeon 680M:
39.1 [X] Asus ROG Zephyrus G14 AMD Ryzen 9 6900HS 3.3GHz
Radeon 680M
min:
23.1 fps, P0.1:
24.2 fps, P1:
29.1 fps, max:
86.9 fps
fps
100%
Radeon 680M:
32.8 [X] Asus ROG Zephyrus G14 AMD Ryzen 9 6900HS 3.3GHz
Radeon 680M
min:
9.36 fps, P0.1:
10.1 fps, P1:
16.4 fps, max:
79.5 fps
fps
100%
Radeon 680M:
40.2 [X] Asus ROG Zephyrus G14 AMD Ryzen 9 6900HS 3.3GHz
Radeon 680M
min:
18.4 fps, P0.1:
19.4 fps, P1:
28.7 fps, max:
53 fps
fps
100%
Radeon 680M:
27.3 [X] Asus ROG Zephyrus G14 AMD Ryzen 9 6900HS 3.3GHz
Radeon 680M
min:
14.2 fps, P0.1:
14.5 fps, P1:
17.1 fps, max:
57.5 fps
fps
100%
Radeon 680M:
19.7 [X] Asus ROG Zephyrus G14 AMD Ryzen 9 6900HS 3.3GHz
Radeon 680M
min:
10.1 fps, P0.1:
11 fps, P1:
13.4 fps, max:
59.3 fps
fps
100%
Radeon 680M:
15.4 [X] Asus ROG Zephyrus G14 AMD Ryzen 9 6900HS 3.3GHz
Radeon 680M
min:
8.22 fps, P0.1:
8.38 fps, P1:
11 fps, max:
28 fps
fps
100%
Radeon 680M:
62.4 [X] Asus ROG Zephyrus G14 AMD Ryzen 9 6900HS 3.3GHz
Radeon 680M
min:
32 fps, P0.1:
32.5 fps, P1:
34.3 fps, max:
194.1 fps
fps
100%
Radeon 680M:
51.6 [X] Asus ROG Zephyrus G14 AMD Ryzen 9 6900HS 3.3GHz
Radeon 680M
min:
12 fps, P0.1:
14.2 fps, P1:
26.2 fps, max:
206 fps
fps
100%
Radeon 680M:
39.5 [X] Asus ROG Zephyrus G14 AMD Ryzen 9 6900HS 3.3GHz
Radeon 680M
min:
14.9 fps, P0.1:
17.4 fps, P1:
20.9 fps, max:
168 fps
fps
100%
Radeon 680M:
32.4 [X] Asus ROG Zephyrus G14 AMD Ryzen 9 6900HS 3.3GHz
Radeon 680M
min:
7.38 fps, P0.1:
7.91 fps, P1:
13.5 fps, max:
194.5 fps
fps
100%
Radeon 680M:
26.4 [X] Asus ROG Zephyrus G14 AMD Ryzen 9 6900HS 3.3GHz
Radeon 680M
min:
17.7 fps, P0.1:
18.6 fps, P1:
21.7 fps, max:
35.3 fps
fps
100%
Radeon 680M:
19.5 [X] Asus ROG Zephyrus G14 AMD Ryzen 9 6900HS 3.3GHz
Radeon 680M
min:
14.5 fps, P0.1:
16 fps, P1:
16.9 fps, max:
25.2 fps
fps
100%
Radeon 680M:
16.6 [X] Asus ROG Zephyrus G14 AMD Ryzen 9 6900HS 3.3GHz
Radeon 680M
min:
13.2 fps, P0.1:
14 fps, P1:
14.4 fps, max:
21.3 fps
fps
100%
Radeon 680M:
13.1 [X] Asus ROG Zephyrus G14 AMD Ryzen 9 6900HS 3.3GHz
Radeon 680M
min:
3.17 fps, P0.1:
3.18 fps, P1:
11.4 fps, max:
17.4 fps
fps
100%
Radeon 680M:
31.6 [X] Asus ROG Zephyrus G14 AMD Ryzen 9 6900HS 3.3GHz
Radeon 680M
min:
9.4 fps, P0.1:
14.4 fps, P1:
23.1 fps, max:
47.2 fps
fps
100%
Radeon 680M:
25.6 [X] Asus ROG Zephyrus G14 AMD Ryzen 9 6900HS 3.3GHz
Radeon 680M
min:
13 fps, P0.1:
14.4 fps, P1:
20.1 fps, max:
37.4 fps
fps
100%
Radeon 680M:
21.8 [X] Asus ROG Zephyrus G14 AMD Ryzen 9 6900HS 3.3GHz
Radeon 680M
min:
11.6 fps, P0.1:
13.3 fps, P1:
17.6 fps, max:
28.2 fps
fps
100%
Radeon 680M:
13.6 [X] Asus ROG Zephyrus G14 AMD Ryzen 9 6900HS 3.3GHz
Radeon 680M
min:
4.73 fps, P0.1:
5.23 fps, P1:
9.04 fps, max:
17.2 fps
fps
100%
Radeon 680M:
52.5 [X] Asus ROG Zephyrus G14 AMD Ryzen 9 6900HS 3.3GHz
Radeon 680M
min:
30 fps
fps
100%
Radeon 680M:
46.6 [X] Asus ROG Zephyrus G14 AMD Ryzen 9 6900HS 3.3GHz
Radeon 680M
min:
29 fps
fps
100%
Radeon 680M:
33.7 [X] Asus ROG Zephyrus G14 AMD Ryzen 9 6900HS 3.3GHz
Radeon 680M
min:
19.4 fps, P0.1:
19.8 fps, P1:
22.2 fps, max:
56.4 fps
fps
100%
Radeon 680M:
24.9 [X] Asus ROG Zephyrus G14 AMD Ryzen 9 6900HS 3.3GHz
Radeon 680M
min:
12.6 fps, P0.1:
15 fps, P1:
16.8 fps, max:
38.9 fps
fps
100%
Radeon 680M:
23.6 [X] Asus ROG Zephyrus G14 AMD Ryzen 9 6900HS 3.3GHz
Radeon 680M
min:
12.9 fps, P0.1:
13.5 fps, P1:
15.5 fps, max:
38.3 fps
fps
100%
Radeon 680M:
23.3 [X] Asus ROG Zephyrus G14 AMD Ryzen 9 6900HS 3.3GHz
Radeon 680M
min:
11.2 fps, P0.1:
13.6 fps, P1:
15.8 fps, max:
40.4 fps
fps
100%
Radeon 680M:
47.2 [X] Asus ROG Zephyrus G14 AMD Ryzen 9 6900HS 3.3GHz
Radeon 680M
min:
20.2 fps, P0.1:
25.5 fps, P1:
30.6 fps, max:
105 fps
fps
100%
Radeon 680M:
36.8 [X] Asus ROG Zephyrus G14 AMD Ryzen 9 6900HS 3.3GHz
Radeon 680M
min:
20.7 fps, P0.1:
21.1 fps, P1:
25.7 fps, max:
76.4 fps
fps
100%
Radeon 680M:
20.3 [X] Asus ROG Zephyrus G14 AMD Ryzen 9 6900HS 3.3GHz
Radeon 680M
min:
10.7 fps, P0.1:
11.8 fps, P1:
14.1 fps, max:
58.3 fps
fps
100%
Radeon 680M:
16.9 [X] Asus ROG Zephyrus G14 AMD Ryzen 9 6900HS 3.3GHz
Radeon 680M
min:
10.2 fps, P0.1:
11.7 fps, P1:
12.4 fps, max:
31.1 fps
fps
100%
Radeon 680M:
23 [X] Asus ROG Zephyrus G14 AMD Ryzen 9 6900HS 3.3GHz
Radeon 680M
min:
11 fps
fps
100%
Radeon 680M:
19 [X] Asus ROG Zephyrus G14 AMD Ryzen 9 6900HS 3.3GHz
Radeon 680M
min:
9 fps
fps
100%
Radeon 680M:
17 [X] Asus ROG Zephyrus G14 AMD Ryzen 9 6900HS 3.3GHz
Radeon 680M
min:
7 fps
fps
100%
Radeon 680M:
14 [X] Asus ROG Zephyrus G14 AMD Ryzen 9 6900HS 3.3GHz
Radeon 680M
min:
6 fps
fps
100%
Radeon 680M:
34.1 [X] Asus ROG Zephyrus G14 AMD Ryzen 9 6900HS 3.3GHz
Radeon 680M
min:
16.2 fps, P0.1:
16.6 fps, P1:
20.6 fps, max:
66.9 fps
fps
100%
Radeon 680M:
21.8 [X] Asus ROG Zephyrus G14 AMD Ryzen 9 6900HS 3.3GHz
Radeon 680M
min:
10.6 fps, P0.1:
10.7 fps, P1:
12.2 fps, max:
58.4 fps
fps
100%
Radeon 680M:
19.6 [X] Asus ROG Zephyrus G14 AMD Ryzen 9 6900HS 3.3GHz
Radeon 680M
min:
7.13 fps, P0.1:
7.72 fps, P1:
11.4 fps, max:
59.7 fps
fps
100%
Radeon 680M:
14.2 [X] Asus ROG Zephyrus G14 AMD Ryzen 9 6900HS 3.3GHz
Radeon 680M
min:
7.61 fps, P0.1:
7.75 fps, P1:
8.33 fps, max:
35.1 fps
fps
100%
Radeon 680M:
42.5 43.3 44.7 [X] Asus ROG Zephyrus G14 AMD Ryzen 9 6900HS 3.3GHz
Radeon 680M
min:
22.2 fps, P0.1:
22.7 fps, P1:
24.8 fps, max:
111.2 fps
~ 44 fps
100%
Radeon 680M:
33.3 35.7 [X] Asus ROG Zephyrus G14 AMD Ryzen 9 6900HS 3.3GHz
Radeon 680M
min:
16.7 fps, P0.1:
22.1 fps, P1:
26.8 fps, max:
61.8 fps
38.9 ~ 36 fps
100%
Radeon 680M:
28.7 30.2 [X] Asus ROG Zephyrus G14 AMD Ryzen 9 6900HS 3.3GHz
Radeon 680M
min:
19.1 fps, P0.1:
19.5 fps, P1:
23.6 fps, max:
49 fps
35.1 ~ 31 fps
100%
Radeon 680M:
24.5 [X] Asus ROG Zephyrus G14 AMD Ryzen 9 6900HS 3.3GHz
Radeon 680M
min:
12 fps, P0.1:
12.2 fps, P1:
13.5 fps, max:
50 fps
24.5 29.3 ~ 26 fps
100%
Radeon 680M:
16.4 fps
100%
Radeon 680M:
63.1 [X] Asus ROG Zephyrus G14 AMD Ryzen 9 6900HS 3.3GHz
Radeon 680M
min:
32.4 fps, P0.1:
33.1 fps, P1:
36.6 fps, max:
140.5 fps
fps
100%
Radeon 680M:
45 [X] Asus ROG Zephyrus G14 AMD Ryzen 9 6900HS 3.3GHz
Radeon 680M
min:
21.7 fps, P0.1:
23.4 fps, P1:
25.9 fps, max:
92.8 fps
fps
100%
Radeon 680M:
33.8 [X] Asus ROG Zephyrus G14 AMD Ryzen 9 6900HS 3.3GHz
Radeon 680M
min:
18.1 fps, P0.1:
18.1 fps, P1:
19.8 fps, max:
128.2 fps
fps
100%
Radeon 680M:
25.7 [X] Asus ROG Zephyrus G14 AMD Ryzen 9 6900HS 3.3GHz
Radeon 680M
min:
12.2 fps, P0.1:
12.7 fps, P1:
14.8 fps, max:
73.9 fps
fps
100%
Radeon 680M:
29.6 40 [X] Asus ROG Zephyrus G14 AMD Ryzen 9 6900HS 3.3GHz
Radeon 680M
~ 35 fps
100%
Radeon 680M:
19.4 27.3 [X] Asus ROG Zephyrus G14 AMD Ryzen 9 6900HS 3.3GHz
Radeon 680M
~ 23 fps
100%
Radeon 680M:
10.8 17.5 [X] Asus ROG Zephyrus G14 AMD Ryzen 9 6900HS 3.3GHz
Radeon 680M
~ 14 fps
100%
Radeon 680M:
11.7 17 [X] Asus ROG Zephyrus G14 AMD Ryzen 9 6900HS 3.3GHz
Radeon 680M
~ 14 fps
100%
Radeon 680M:
49.4 [X] Asus ROG Zephyrus G14 AMD Ryzen 9 6900HS 3.3GHz
Radeon 680M
min:
26.5 fps, P0.1:
32.8 fps, P1:
34.9 fps, max:
85.4 fps
fps
100%
Radeon 680M:
41 [X] Asus ROG Zephyrus G14 AMD Ryzen 9 6900HS 3.3GHz
Radeon 680M
min:
13.4 fps, P0.1:
26.9 fps, P1:
32.5 fps, max:
62.8 fps
fps
100%
Radeon 680M:
31.7 [X] Asus ROG Zephyrus G14 AMD Ryzen 9 6900HS 3.3GHz
Radeon 680M
min:
18.8 fps, P0.1:
21.3 fps, P1:
24.1 fps, max:
56.9 fps
fps
100%
Radeon 680M:
27.5 [X] Asus ROG Zephyrus G14 AMD Ryzen 9 6900HS 3.3GHz
Radeon 680M
min:
16 fps, P0.1:
19 fps, P1:
20.8 fps, max:
41.9 fps
fps
100%
Radeon 680M:
33.4 [X] HP EliteBook 835 G9 AMD Ryzen 7 PRO 6850U 2.7GHz
Radeon 680M
min:
25.7 fps, P0.1:
25.9 fps, P1:
28.1 fps, max:
48.8 fps
43 [X] Asus ROG Zephyrus G14 AMD Ryzen 9 6900HS 3.3GHz
Radeon 680M
min:
16.1 fps, P0.1:
17.8 fps, P1:
35 fps, max:
54.4 fps
~ 38 fps
100%
Radeon 680M:
28.8 [X] HP EliteBook 835 G9 AMD Ryzen 7 PRO 6850U 2.7GHz
Radeon 680M
min:
21.4 fps, P0.1:
22.5 fps, P1:
24.3 fps, max:
43.2 fps
36.7 [X] Asus ROG Zephyrus G14 AMD Ryzen 9 6900HS 3.3GHz
Radeon 680M
min:
22.5 fps, P0.1:
27.2 fps, P1:
31.6 fps, max:
42.4 fps
~ 33 fps
100%
Radeon 680M:
23.8 [X] HP EliteBook 835 G9 AMD Ryzen 7 PRO 6850U 2.7GHz
Radeon 680M
min:
6.04 fps, P0.1:
6.49 fps, P1:
14.4 fps, max:
37.1 fps
33.6 [X] Asus ROG Zephyrus G14 AMD Ryzen 9 6900HS 3.3GHz
Radeon 680M
min:
25.7 fps, P0.1:
25.9 fps, P1:
28.2 fps, max:
40.3 fps
~ 29 fps
100%
Radeon 680M:
21.1 [X] HP EliteBook 835 G9 AMD Ryzen 7 PRO 6850U 2.7GHz
Radeon 680M
min:
5.77 fps, P0.1:
6.03 fps, P1:
7.28 fps, max:
38.3 fps
30.2 [X] Asus ROG Zephyrus G14 AMD Ryzen 9 6900HS 3.3GHz
Radeon 680M
min:
21.7 fps, P0.1:
23.1 fps, P1:
25.3 fps, max:
35.1 fps
~ 26 fps
100%
Radeon 680M:
54 61 [X] Asus ROG Zephyrus G14 AMD Ryzen 9 6900HS 3.3GHz
Radeon 680M
min:
42 fps
~ 58 fps
100%
Radeon 680M:
46 54 [X] Asus ROG Zephyrus G14 AMD Ryzen 9 6900HS 3.3GHz
Radeon 680M
min:
36 fps
~ 50 fps
100%
Radeon 680M:
37 [X] Asus ROG Zephyrus G14 AMD Ryzen 9 6900HS 3.3GHz
Radeon 680M
min:
18 fps
38 ~ 38 fps
100%
Radeon 680M:
34 [X] Asus ROG Zephyrus G14 AMD Ryzen 9 6900HS 3.3GHz
Radeon 680M
min:
14 fps
34 ~ 34 fps
100%
Radeon 680M:
28.5 [X] Asus ROG Zephyrus G14 AMD Ryzen 9 6900HS 3.3GHz
Radeon 680M
min:
24.6 fps, P0.1:
25 fps, P1:
26.4 fps, max:
33.8 fps
fps
100%
Radeon 680M:
26.5 [X] Asus ROG Zephyrus G14 AMD Ryzen 9 6900HS 3.3GHz
Radeon 680M
min:
17.3 fps, P0.1:
18.1 fps, P1:
23.8 fps, max:
38.9 fps
fps
100%
Radeon 680M:
23.1 [X] Asus ROG Zephyrus G14 AMD Ryzen 9 6900HS 3.3GHz
Radeon 680M
min:
15.8 fps, P0.1:
17.3 fps, P1:
20.3 fps, max:
28.9 fps
fps
100%
Radeon 680M:
22 [X] Asus ROG Zephyrus G14 AMD Ryzen 9 6900HS 3.3GHz
Radeon 680M
min:
18.1 fps, P0.1:
18.4 fps, P1:
19.9 fps, max:
25.7 fps
fps
100%
Radeon 680M:
20.7 [X] Asus ROG Zephyrus G14 AMD Ryzen 9 6900HS 3.3GHz
Radeon 680M
min:
15.8 fps, P0.1:
15.9 fps, P1:
17.6 fps, max:
27 fps
23.8 [X] HP EliteBook 835 G9 AMD Ryzen 7 PRO 6850U 2.7GHz
Radeon 680M
min:
6.61 fps, P0.1:
10.8 fps, P1:
15.5 fps, max:
67 fps
~ 22 fps
100%
Radeon 680M:
18.4 [X] Asus ROG Zephyrus G14 AMD Ryzen 9 6900HS 3.3GHz
Radeon 680M
min:
10.4 fps, P0.1:
12.3 fps, P1:
15.5 fps, max:
46.7 fps
19.3 [X] HP EliteBook 835 G9 AMD Ryzen 7 PRO 6850U 2.7GHz
Radeon 680M
min:
7.21 fps, P0.1:
8.56 fps, P1:
13.4 fps, max:
61.8 fps
~ 19 fps
100%
Radeon 680M:
14.3 [X] HP EliteBook 835 G9 AMD Ryzen 7 PRO 6850U 2.7GHz
Radeon 680M
min:
7.74 fps, P0.1:
8.53 fps, P1:
11.3 fps, max:
63.9 fps
16.3 [X] Asus ROG Zephyrus G14 AMD Ryzen 9 6900HS 3.3GHz
Radeon 680M
min:
12.8 fps, P0.1:
13.4 fps, P1:
14.2 fps, max:
22.4 fps
~ 15 fps
100%
Radeon 680M:
13.9 [X] HP EliteBook 835 G9 AMD Ryzen 7 PRO 6850U 2.7GHz
Radeon 680M
min:
6.59 fps, P0.1:
7.18 fps, P1:
11.2 fps, max:
20 fps
14.2 [X] Asus ROG Zephyrus G14 AMD Ryzen 9 6900HS 3.3GHz
Radeon 680M
min:
11.2 fps, P0.1:
11.6 fps, P1:
12.4 fps, max:
17.2 fps
~ 14 fps
100%
Radeon 680M:
79.9 [X] Asus ROG Zephyrus G14 AMD Ryzen 9 6900HS 3.3GHz
Radeon 680M
min:
17.3 fps, P0.1:
27.6 fps, P1:
44.1 fps, max:
150.1 fps
83 ~ 81 fps
100%
Radeon 680M:
71.6 [X] Asus ROG Zephyrus G14 AMD Ryzen 9 6900HS 3.3GHz
Radeon 680M
min:
23.9 fps, P0.1:
32.9 fps, P1:
39.6 fps, max:
126.8 fps
73 ~ 72 fps
100%
Radeon 680M:
44.5 [X] Asus ROG Zephyrus G14 AMD Ryzen 9 6900HS 3.3GHz
Radeon 680M
min:
5.71 fps, P0.1:
6.32 fps, P1:
31.4 fps, max:
64.3 fps
51 ~ 48 fps
100%
Radeon 680M:
44.4 [X] Asus ROG Zephyrus G14 AMD Ryzen 9 6900HS 3.3GHz
Radeon 680M
min:
23.1 fps, P0.1:
24.3 fps, P1:
26.5 fps, max:
110.6 fps
53 ~ 49 fps
100%
Radeon 680M:
31.8 [X] HP EliteBook 835 G9 AMD Ryzen 7 PRO 6850U 2.7GHz
Radeon 680M
min:
11.5 fps, P0.1:
16.2 fps, P1:
23 fps, max:
78.9 fps
38.3 [X] Asus ROG Zephyrus G14 AMD Ryzen 9 6900HS 3.3GHz
Radeon 680M
min:
15 fps
~ 35 fps
100%
Radeon 680M:
23.7 [X] HP EliteBook 835 G9 AMD Ryzen 7 PRO 6850U 2.7GHz
Radeon 680M
min:
9.54 fps, P0.1:
9.62 fps, P1:
14.8 fps, max:
76.6 fps
27.8 [X] Asus ROG Zephyrus G14 AMD Ryzen 9 6900HS 3.3GHz
Radeon 680M
min:
10 fps
~ 26 fps
100%
Radeon 680M:
17.4 [X] HP EliteBook 835 G9 AMD Ryzen 7 PRO 6850U 2.7GHz
Radeon 680M
min:
6.25 fps, P0.1:
6.55 fps, P1:
9.32 fps, max:
71.7 fps
21.9 [X] Asus ROG Zephyrus G14 AMD Ryzen 9 6900HS 3.3GHz
Radeon 680M
min:
9 fps
~ 20 fps
100%
Radeon 680M:
12 [X] HP EliteBook 835 G9 AMD Ryzen 7 PRO 6850U 2.7GHz
Radeon 680M
min:
4.37 fps, P0.1:
4.64 fps, P1:
5.96 fps, max:
69.9 fps
fps
100%
Radeon 680M:
44.1 45.6 [X] Maxtang MTN-FP750 959964
AMD Ryzen 7 7735HS 3.2GHz
Radeon 680M
min:
37 fps, P1:
29 fps, max:
54 fps
49.7 53.1 66.5 66.7 71.4 72.1 [X] ACEMagician Ace Magician AM08 Pro 959964
AMD Ryzen 9 6900HX 3.3GHz
Radeon 680M
min:
57 fps, P1:
54 fps, max:
83 fps
74.3 77.1 [X] Aoostar GOD77 959964
AMD Ryzen 7 7735HS 3.2GHz
Radeon 680M
min:
64 fps, P1:
61 fps, max:
89 fps
77.3 78.1 [X] GPD Win 4 959964
AMD Ryzen 7 6800U 2.7GHz
Radeon 680M
min:
58 fps, P1:
57 fps, max:
96 fps
78.4 [X] Aokzoe A1 959964
AMD Ryzen 7 6800U 2.7GHz
Radeon 680M
min:
63 fps, P1:
44 fps, max:
94 fps
79.8 [X] ACEMagician Ace Magician AM08 Pro 959964
AMD Ryzen 9 6900HX 3.3GHz
Radeon 680M
min:
65 fps, P1:
54 fps, max:
92 fps
80 [X] Asus ROG Zephyrus G14 AMD Ryzen 9 6900HS 3.3GHz
Radeon 680M
min:
69 fps
80.1 80.2 80.2 [X] Acemagic AM20 959964
AMD Ryzen 7 7735H 3.2GHz
Radeon 680M
min:
68 fps, P1:
59 fps, max:
95 fps
80.3 [X] Aoostar GEM10 959964
AMD Ryzen 7 6800H 3.2GHz
Radeon 680M
min:
68 fps, P1:
65 fps, max:
93 fps
80.8 82 82.6 [X] GMK NucBox K2 959964
AMD Ryzen 7 7735HS 3.2GHz
Radeon 680M
min:
71 fps, P1:
57 fps, max:
96 fps
83.1 85.4 ~ 73 fps
100%
Radeon 680M:
38 40.6 [X] Maxtang MTN-FP750 959964
AMD Ryzen 7 7735HS 3.2GHz
Radeon 680M
min:
33 fps, P1:
29 fps, max:
48 fps
46.1 49.1 55.4 60.3 61.1 62.8 [X] ACEMagician Ace Magician AM08 Pro 959964
AMD Ryzen 9 6900HX 3.3GHz
Radeon 680M
min:
55 fps, P1:
46 fps, max:
70 fps
65.4 65.4 66.9 [X] Aoostar GOD77 959964
AMD Ryzen 7 7735HS 3.2GHz
Radeon 680M
min:
56 fps, P1:
51 fps, max:
78 fps
69 [X] Aokzoe A1 959964
AMD Ryzen 7 6800U 2.7GHz
Radeon 680M
min:
55 fps, P1:
40 fps, max:
80 fps
69.5 69.9 [X] Acemagic AM20 959964
AMD Ryzen 7 7735H 3.2GHz
Radeon 680M
min:
60 fps, P1:
45 fps, max:
82 fps
70.1 70.3 [X] Aoostar GEM10 959964
AMD Ryzen 7 6800H 3.2GHz
Radeon 680M
min:
55 fps, P1:
51 fps, max:
80 fps
70.4 [X] GPD Win 4 959964
AMD Ryzen 7 6800U 2.7GHz
Radeon 680M
min:
57 fps, P1:
56 fps, max:
83 fps
70.4 70.5 71.6 [X] ACEMagician Ace Magician AM08 Pro 959964
AMD Ryzen 9 6900HX 3.3GHz
Radeon 680M
min:
50 fps, P1:
46 fps, max:
84 fps
72 [X] Asus ROG Zephyrus G14 AMD Ryzen 9 6900HS 3.3GHz
Radeon 680M
min:
63 fps
72.9 74.1 [X] GMK NucBox K2 959964
AMD Ryzen 7 7735HS 3.2GHz
Radeon 680M
min:
61 fps, P1:
47 fps, max:
88 fps
74.6 ~ 64 fps
100%
Radeon 680M:
30 32.1 [X] Maxtang MTN-FP750 959964
AMD Ryzen 7 7735HS 3.2GHz
Radeon 680M
min:
25 fps, P1:
22 fps, max:
37 fps
34.8 35.4 36.9 42.3 44.5 45.6 [X] ACEMagician Ace Magician AM08 Pro 959964
AMD Ryzen 9 6900HX 3.3GHz
Radeon 680M
min:
39 fps, P1:
34 fps, max:
53 fps
48.4 50.1 [X] Aoostar GOD77 959964
AMD Ryzen 7 7735HS 3.2GHz
Radeon 680M
min:
40 fps, P1:
39 fps, max:
59 fps
50.5 [X] Aokzoe A1 959964
AMD Ryzen 7 6800U 2.7GHz
Radeon 680M
min:
40 fps, P1:
28 fps, max:
59 fps
50.5 [X] Acemagic AM20 959964
AMD Ryzen 7 7735H 3.2GHz
Radeon 680M
min:
44 fps, P1:
37 fps, max:
58 fps
51.5 [X] GPD Win 4 959964
AMD Ryzen 7 6800U 2.7GHz
Radeon 680M
min:
44 fps, P1:
44 fps, max:
58 fps
51.7 52 [X] Asus ROG Zephyrus G14 AMD Ryzen 9 6900HS 3.3GHz
Radeon 680M
min:
44 fps
52 [X] Aoostar GEM10 959964
AMD Ryzen 7 6800H 3.2GHz
Radeon 680M
min:
38 fps, P1:
39 fps, max:
59 fps
52.2 52.3 [X] ACEMagician Ace Magician AM08 Pro 959964
AMD Ryzen 9 6900HX 3.3GHz
Radeon 680M
min:
41 fps, P1:
40 fps, max:
61 fps
52.5 52.9 53.8 54.7 [X] GMK NucBox K2 959964
AMD Ryzen 7 7735HS 3.2GHz
Radeon 680M
min:
47 fps, P1:
37 fps, max:
65 fps
54.9 55 ~ 47 fps
100%
Radeon 680M:
0 (!) 7.9 7.9 8.3 8.9 9.2 9.3 9.4 11.2 [X] ACEMagician Ace Magician AM08 Pro 959964
AMD Ryzen 9 6900HX 3.3GHz
Radeon 680M
min:
8 fps, P1:
8 fps, max:
13 fps
11.3 [X] ACEMagician Ace Magician AM08 Pro 959964
AMD Ryzen 9 6900HX 3.3GHz
Radeon 680M
min:
8 fps, P1:
8 fps, max:
15 fps
11.9 12.2 12.3 12.3 [X] Acemagic AM20 959964
AMD Ryzen 7 7735H 3.2GHz
Radeon 680M
min:
9 fps, P1:
9 fps, max:
15 fps
12.6 [X] GPD Win 4 959964
AMD Ryzen 7 6800U 2.7GHz
Radeon 680M
min:
9 fps, P1:
9 fps, max:
16 fps
13 [X] Aoostar GEM10 959964
AMD Ryzen 7 6800H 3.2GHz
Radeon 680M
min:
9 fps, P1:
9 fps, max:
16 fps
13.1 13.2 13.2 [X] Aokzoe A1 959964
AMD Ryzen 7 6800U 2.7GHz
Radeon 680M
min:
10 fps, P1:
7 fps, max:
16 fps
13.9 13.9 [X] GMK NucBox K2 959964
AMD Ryzen 7 7735HS 3.2GHz
Radeon 680M
min:
9 fps, P1:
9 fps, max:
17 fps
14.1 ~ 11 fps
100%
Radeon 680M:
92 [X] Asus ROG Zephyrus G14 AMD Ryzen 9 6900HS 3.3GHz
Radeon 680M
min:
14 fps
fps
100%
Radeon 680M:
61.7 [X] Asus ROG Zephyrus G14 AMD Ryzen 9 6900HS 3.3GHz
Radeon 680M
min:
11 fps
fps
100%
Radeon 680M:
55.6 [X] Asus ROG Zephyrus G14 AMD Ryzen 9 6900HS 3.3GHz
Radeon 680M
min:
13 fps
fps
100%
Radeon 680M:
41.3 [X] Asus ROG Zephyrus Duo 16 GX650RX AMD Ryzen 9 6900HX 3.3GHz
Radeon 680M
min:
20.4 fps, P0.1:
22.6 fps, P1:
24.4 fps, max:
140.6 fps
fps
100%
Radeon 680M:
18.8 41 [X] Asus ROG Zephyrus Duo 16 GX650RX AMD Ryzen 9 6900HX 3.3GHz
Radeon 680M
min:
20.5 fps, P0.1:
21 fps, P1:
24 fps, max:
126.4 fps
~ 30 fps
100%
Radeon 680M:
20 40.6 [X] Asus ROG Zephyrus Duo 16 GX650RX AMD Ryzen 9 6900HX 3.3GHz
Radeon 680M
min:
20.6 fps, P0.1:
21.8 fps, P1:
24 fps, max:
128.1 fps
~ 30 fps
100%
Radeon 680M:
18.6 39.2 [X] Asus ROG Zephyrus Duo 16 GX650RX AMD Ryzen 9 6900HX 3.3GHz
Radeon 680M
min:
20 fps, P0.1:
20.9 fps, P1:
23 fps, max:
114.8 fps
~ 29 fps
100%
Radeon 680M:
24.5 [X] Asus ROG Zephyrus Duo 16 GX650RX AMD Ryzen 9 6900HX 3.3GHz
Radeon 680M
min:
11.6 fps, P0.1:
12.9 fps, P1:
13.4 fps, max:
113.8 fps
fps
100%
Radeon 680M:
11 [X] Asus ROG Zephyrus Duo 16 GX650RX AMD Ryzen 9 6900HX 3.3GHz
Radeon 680M
min:
5.15 fps, P0.1:
5.18 fps, P1:
5.47 fps, max:
98.9 fps
fps
100%
Radeon 680M:
28.2 28.4 [X] ACEMagician Ace Magician AM08 Pro AMD Ryzen 9 6900HX 3.3GHz
Radeon 680M
30 30.6 32.7 [X] ACEMagician Ace Magician AM08 Pro AMD Ryzen 9 6900HX 3.3GHz
Radeon 680M
34.8 35.3 35.5 40.5 42.2 44 44 [X] Aoostar GEM10 AMD Ryzen 7 6800H 3.2GHz
Radeon 680M
44.2 44.4 44.9 45.1 47.1 [X] Asus ROG Zephyrus Duo 16 GX650RX AMD Ryzen 9 6900HX 3.3GHz
Radeon 680M
~ 38 fps
100%
Radeon 680M:
13.6 [X] Asus ROG Zephyrus Duo 16 GX650RX AMD Ryzen 9 6900HX 3.3GHz
Radeon 680M
fps
100%
Radeon 680M:
6.6 [X] Asus ROG Zephyrus Duo 16 GX650RX AMD Ryzen 9 6900HX 3.3GHz
Radeon 680M
fps
100%
Radeon 680M:
26 31.4 32 34 34 [X] Aokzoe A1 AMD Ryzen 7 6800U 2.7GHz
Radeon 680M
min:
9.8 fps, max:
93.3 fps
35.8 [X] GMK NucBox K2 AMD Ryzen 7 7735HS 3.2GHz
Radeon 680M
min:
14.4 fps, max:
49.1 fps
36.9 37.7 [X] GPD Win 4 AMD Ryzen 7 6800U 2.7GHz
Radeon 680M
min:
24.8 fps, max:
55.5 fps
40 40.8 [X] Asus ROG Zephyrus G14 AMD Ryzen 9 6900HS 3.3GHz
Radeon 680M
min:
22 fps
40.8 43 [X] Beelink GTR6 AMD Ryzen 9 6900HX 3.3GHz
Radeon 680M
min:
18 fps, max:
65.1 fps
43.3 43.4 [X] Asus ROG Zephyrus Duo 16 GX650RX AMD Ryzen 9 6900HX 3.3GHz
Radeon 680M
min:
27.1 fps, max:
65.9 fps
50.6 ~ 38 fps
100%
Radeon 680M:
20.1 24 24.4 25 25.8 [X] Aokzoe A1 AMD Ryzen 7 6800U 2.7GHz
Radeon 680M
min:
8 fps, max:
64.2 fps
26 27.4 [X] GMK NucBox K2 AMD Ryzen 7 7735HS 3.2GHz
Radeon 680M
min:
12.8 fps, max:
42.3 fps
28.1 28.9 [X] GPD Win 4 AMD Ryzen 7 6800U 2.7GHz
Radeon 680M
min:
21.8 fps, max:
40.1 fps
31.8 33 [X] Beelink GTR6 AMD Ryzen 9 6900HX 3.3GHz
Radeon 680M
min:
19.6 fps, max:
52.8 fps
33.1 [X] Asus ROG Zephyrus G14 AMD Ryzen 9 6900HS 3.3GHz
Radeon 680M
min:
19 fps
33.1 [X] Asus ROG Zephyrus Duo 16 GX650RX AMD Ryzen 9 6900HX 3.3GHz
Radeon 680M
min:
22.3 fps, max:
43.6 fps
33.1 41.8 ~ 29 fps
100%
Radeon 680M:
16.3 18 19 19 [X] Aokzoe A1 AMD Ryzen 7 6800U 2.7GHz
Radeon 680M
min:
3.9 fps, max:
88.9 fps
19 20 20.2 21 [X] GMK NucBox K2 AMD Ryzen 7 7735HS 3.2GHz
Radeon 680M
min:
9.9 fps, max:
36.5 fps
21.3 21.6 [X] GPD Win 4 AMD Ryzen 7 6800U 2.7GHz
Radeon 680M
min:
16 fps, max:
30 fps
21.8 22.3 [X] Beelink GTR6 AMD Ryzen 9 6900HX 3.3GHz
Radeon 680M
min:
5.3 fps, max:
31.8 fps
23.4 [X] Asus ROG Zephyrus G14 AMD Ryzen 9 6900HS 3.3GHz
Radeon 680M
min:
16 fps
23.9 [X] Asus ROG Zephyrus Duo 16 GX650RX AMD Ryzen 9 6900HX 3.3GHz
Radeon 680M
min:
18.2 fps, max:
32.2 fps
33.6 ~ 21 fps
100%
Radeon 680M:
14 14.7 15 15.7 16.7 [X] GPD Win 4 AMD Ryzen 7 6800U 2.7GHz
Radeon 680M
min:
10.9 fps, max:
24.4 fps
16.7 [X] Aokzoe A1 AMD Ryzen 7 6800U 2.7GHz
Radeon 680M
min:
3 fps, max:
59.4 fps
17.2 17.5 [X] Beelink GTR6 AMD Ryzen 9 6900HX 3.3GHz
Radeon 680M
min:
4 fps, max:
25.6 fps
17.5 17.6 18.9 19 19.1 [X] Asus ROG Zephyrus G14 AMD Ryzen 9 6900HS 3.3GHz
Radeon 680M
min:
14 fps
19.2 23.8 [X] Asus ROG Zephyrus Duo 16 GX650RX AMD Ryzen 9 6900HX 3.3GHz
Radeon 680M
min:
15.2 fps, max:
32.2 fps
~ 18 fps
100%
Radeon 680M:
9.9 10.7 [X] Asus ROG Zephyrus Duo 16 GX650RX AMD Ryzen 9 6900HX 3.3GHz
Radeon 680M
min:
8 fps, max:
15.2 fps
~ 10 fps
100%
Radeon 680M:
3.4 4.3 [X] Asus ROG Zephyrus Duo 16 GX650RX AMD Ryzen 9 6900HX 3.3GHz
Radeon 680M
min:
2.8 fps, max:
6.3 fps
~ 4 fps
100%
Radeon 680M:
37.8 [X] Asus ROG Zephyrus G14 AMD Ryzen 9 6900HS 3.3GHz
Radeon 680M
min:
22.6 fps, P0.1:
24 fps, P1:
32 fps, max:
46.4 fps
fps
100%
Radeon 680M:
31.3 [X] Asus ROG Zephyrus G14 AMD Ryzen 9 6900HS 3.3GHz
Radeon 680M
min:
22.1 fps, P0.1:
24.6 fps, P1:
26.8 fps, max:
37.8 fps
fps
100%
Radeon 680M:
26.4 [X] Asus ROG Zephyrus G14 AMD Ryzen 9 6900HS 3.3GHz
Radeon 680M
min:
21.4 fps, P0.1:
21.9 fps, P1:
22.6 fps, max:
31.8 fps
fps
100%
Radeon 680M:
22.6 [X] Asus ROG Zephyrus G14 AMD Ryzen 9 6900HS 3.3GHz
Radeon 680M
min:
17.3 fps, P0.1:
17.7 fps, P1:
18.9 fps, max:
27.5 fps
fps
100%
Radeon 680M:
24.4 35.5 58.2 61.2 [X] ACEMagician Ace Magician AM08 Pro 712825
AMD Ryzen 9 6900HX 3.3GHz
Radeon 680M
min:
5.05 fps, max:
113.2 fps
62.1 66.5 [X] ACEMagician Ace Magician AM08 Pro 712825
AMD Ryzen 9 6900HX 3.3GHz
Radeon 680M
min:
29.9 fps, max:
144.1 fps
76.9 [X] Acemagic AM20 800660
AMD Ryzen 7 7735H 3.2GHz
Radeon 680M
min:
26.8 fps, max:
157.3 fps
81.1 84.5 91 [X] Aoostar GOD77 800660
AMD Ryzen 7 7735HS 3.2GHz
Radeon 680M
min:
26.3 fps, max:
201 fps
91.9 [X] Aoostar GEM10 800660
AMD Ryzen 7 6800H 3.2GHz
Radeon 680M
min:
30.3 fps, max:
169.6 fps
93.5 114 [X] Asus ROG Zephyrus G14 AMD Ryzen 9 6900HS 3.3GHz
Radeon 680M
min:
93 fps
~ 72 fps
100%
Radeon 680M:
29.5 45 47.4 [X] ACEMagician Ace Magician AM08 Pro 712825
AMD Ryzen 9 6900HX 3.3GHz
Radeon 680M
min:
3.63 fps, max:
129.9 fps
47.4 50 [X] ACEMagician Ace Magician AM08 Pro 712825
AMD Ryzen 9 6900HX 3.3GHz
Radeon 680M
min:
4.32 fps, max:
114.9 fps
60.6 [X] Acemagic AM20 800660
AMD Ryzen 7 7735H 3.2GHz
Radeon 680M
min:
24.3 fps, max:
134.4 fps
62.9 63.4 66.7 69.6 [X] Aoostar GOD77 800660
AMD Ryzen 7 7735HS 3.2GHz
Radeon 680M
min:
34.9 fps, max:
137.1 fps
70.7 [X] Aoostar GEM10 800660
AMD Ryzen 7 6800H 3.2GHz
Radeon 680M
min:
31.1 fps, max:
137.2 fps
82.2 [X] Asus ROG Zephyrus G14 AMD Ryzen 9 6900HS 3.3GHz
Radeon 680M
min:
62 fps
~ 58 fps
100%
Radeon 680M:
24.4 34.2 36.7 37.3 [X] ACEMagician Ace Magician AM08 Pro 712825
AMD Ryzen 9 6900HX 3.3GHz
Radeon 680M
min:
18.3 fps, max:
83.2 fps
44.1 [X] ACEMagician Ace Magician AM08 Pro 712825
AMD Ryzen 9 6900HX 3.3GHz
Radeon 680M
min:
19.4 fps, max:
103.9 fps
47 [X] Acemagic AM20 800660
AMD Ryzen 7 7735H 3.2GHz
Radeon 680M
min:
19.8 fps, max:
85.9 fps
48 48.2 51.9 51.9 [X] Aoostar GOD77 800660
AMD Ryzen 7 7735HS 3.2GHz
Radeon 680M
min:
24.8 fps, max:
103.7 fps
53.3 [X] Aoostar GEM10 800660
AMD Ryzen 7 6800H 3.2GHz
Radeon 680M
min:
24.4 fps, max:
152.4 fps
64.9 [X] Asus ROG Zephyrus G14 AMD Ryzen 9 6900HS 3.3GHz
Radeon 680M
min:
51 fps
~ 45 fps
100%
Radeon 680M:
21.2 26.6 26.9 29.8 [X] ACEMagician Ace Magician AM08 Pro 712825
AMD Ryzen 9 6900HX 3.3GHz
Radeon 680M
min:
14.4 fps, max:
67 fps
30.5 [X] ACEMagician Ace Magician AM08 Pro 712825
AMD Ryzen 9 6900HX 3.3GHz
Radeon 680M
min:
14.9 fps, max:
64.7 fps
37.9 38 38.4 [X] Acemagic AM20 800660
AMD Ryzen 7 7735H 3.2GHz
Radeon 680M
min:
18 fps, max:
78.7 fps
38.4 [X] Aoostar GOD77 800660
AMD Ryzen 7 7735HS 3.2GHz
Radeon 680M
min:
10.8 fps, max:
213 fps
40.6 41.7 [X] Aoostar GEM10 800660
AMD Ryzen 7 6800H 3.2GHz
Radeon 680M
min:
17.8 fps, max:
80.3 fps
46.3 [X] Asus ROG Zephyrus G14 AMD Ryzen 9 6900HS 3.3GHz
Radeon 680M
min:
33 fps
~ 35 fps
100%
Radeon 680M:
52.7 [X] Asus ROG Zephyrus G14 AMD Ryzen 9 6900HS 3.3GHz
Radeon 680M
min:
22.3 fps, P0.1:
23.9 fps, P1:
32.1 fps, max:
82.3 fps
fps
100%
Radeon 680M:
41.5 [X] Asus ROG Zephyrus G14 AMD Ryzen 9 6900HS 3.3GHz
Radeon 680M
min:
18.1 fps, P0.1:
19.8 fps, P1:
27.8 fps, max:
61.3 fps
fps
100%
Radeon 680M:
37.2 [X] Asus ROG Zephyrus G14 AMD Ryzen 9 6900HS 3.3GHz
Radeon 680M
min:
18.8 fps, P0.1:
19.9 fps, P1:
24.7 fps, max:
61.8 fps
fps
100%
Radeon 680M:
31.5 [X] Asus ROG Zephyrus G14 AMD Ryzen 9 6900HS 3.3GHz
Radeon 680M
min:
15.7 fps, P0.1:
15.9 fps, P1:
20.9 fps, max:
68.6 fps
fps
100%
Radeon 680M:
29.4 [X] Asus ROG Zephyrus G14 AMD Ryzen 9 6900HS 3.3GHz
Radeon 680M
min:
23.1 fps, P0.1:
23.4 fps, P1:
24.8 fps, max:
42.1 fps
fps
100%
Radeon 680M:
23.9 [X] Asus ROG Zephyrus G14 AMD Ryzen 9 6900HS 3.3GHz
Radeon 680M
min:
17.9 fps, P0.1:
18.3 fps, P1:
20 fps, max:
33.4 fps
fps
100%
Radeon 680M:
20.4 [X] Asus ROG Zephyrus G14 AMD Ryzen 9 6900HS 3.3GHz
Radeon 680M
min:
15.2 fps, P0.1:
15.7 fps, P1:
17.4 fps, max:
27.4 fps
fps
100%
Radeon 680M:
53 115 [X] Asus ROG Zephyrus G14 AMD Ryzen 9 6900HS 3.3GHz
Radeon 680M
min:
89 fps
~ 84 fps
100%
Radeon 680M:
39 105 [X] Asus ROG Zephyrus G14 AMD Ryzen 9 6900HS 3.3GHz
Radeon 680M
min:
82 fps
~ 72 fps
100%
Radeon 680M:
37 102 [X] Asus ROG Zephyrus G14 AMD Ryzen 9 6900HS 3.3GHz
Radeon 680M
min:
81 fps
~ 70 fps
100%
Radeon 680M:
28 87 [X] Asus ROG Zephyrus G14 AMD Ryzen 9 6900HS 3.3GHz
Radeon 680M
min:
65 fps
~ 58 fps
100%
Radeon 680M:
19.5 [X] Maxtang MTN-FP750 AMD Ryzen 7 7735HS 3.2GHz
Radeon 680M
min:
15.1 fps, P0.1:
15.5 fps, P1:
16.2 fps, max:
23.3 fps
20.2 [X] ACEMagician Ace Magician AM08 Pro AMD Ryzen 9 6900HX 3.3GHz
Radeon 680M
min:
17.2 fps, P0.1:
17.4 fps, P1:
18.1 fps, max:
24.9 fps
20.4 24.9 25.2 33.4 [X] Aoostar GOD77 AMD Ryzen 7 7735HS 3.2GHz
Radeon 680M
min:
27.6 fps, P0.1:
27.8 fps, P1:
29.1 fps, max:
41.5 fps
34 35.9 [X] ACEMagician Ace Magician AM08 Pro AMD Ryzen 9 6900HX 3.3GHz
Radeon 680M
min:
21.1 fps, P0.1:
24.2 fps, P1:
30.7 fps, max:
45.7 fps
37.5 [X] Aoostar GEM10 AMD Ryzen 7 6800H 3.2GHz
Radeon 680M
min:
26.5 fps, P0.1:
26.9 fps, P1:
31.1 fps, max:
48.7 fps
37.6 [X] Acemagic AM20 AMD Ryzen 7 7735H 3.2GHz
Radeon 680M
min:
28.5 fps, P0.1:
28.7 fps, P1:
32 fps, max:
105.2 fps
37.9 [X] Asus ROG Zephyrus G14 AMD Ryzen 9 6900HS 3.3GHz
Radeon 680M
min:
28.1 fps, P0.1:
30.8 fps, P1:
32.7 fps, max:
48.1 fps
48.6 ~ 31 fps
100%
Radeon 680M:
15.9 [X] Maxtang MTN-FP750 AMD Ryzen 7 7735HS 3.2GHz
Radeon 680M
min:
12.1 fps, P0.1:
12.2 fps, P1:
13.1 fps, max:
23.6 fps
16.1 [X] ACEMagician Ace Magician AM08 Pro AMD Ryzen 9 6900HX 3.3GHz
Radeon 680M
min:
14 fps, P0.1:
14.1 fps, P1:
14.3 fps, max:
18.6 fps
16.5 18.6 [X] ACEMagician Ace Magician AM08 Pro AMD Ryzen 9 6900HX 3.3GHz
Radeon 680M
min:
14.7 fps, P0.1:
14.8 fps, P1:
15.2 fps, max:
36.1 fps
20.3 22 23.6 [X] Aoostar GOD77 AMD Ryzen 7 7735HS 3.2GHz
Radeon 680M
min:
14.2 fps, P0.1:
14.4 fps, P1:
15.1 fps, max:
30.5 fps
27.6 27.9 30.5 [X] Acemagic AM20 AMD Ryzen 7 7735H 3.2GHz
Radeon 680M
min:
14.1 fps, P0.1:
16.1 fps, P1:
25.2 fps, max:
76.6 fps
30.6 [X] Asus ROG Zephyrus G14 AMD Ryzen 9 6900HS 3.3GHz
Radeon 680M
min:
25.5 fps, P0.1:
25.7 fps, P1:
26.9 fps, max:
35.8 fps
30.6 [X] Aoostar GEM10 AMD Ryzen 7 6800H 3.2GHz
Radeon 680M
min:
22.1 fps, P0.1:
24.5 fps, P1:
26.7 fps, max:
36.6 fps
~ 23 fps
100%
Radeon 680M:
11.7 [X] Maxtang MTN-FP750 AMD Ryzen 7 7735HS 3.2GHz
Radeon 680M
min:
5.92 fps, P0.1:
7.12 fps, P1:
10.2 fps, max:
14.9 fps
11.9 [X] ACEMagician Ace Magician AM08 Pro AMD Ryzen 9 6900HX 3.3GHz
Radeon 680M
min:
4.04 fps, P0.1:
5.29 fps, P1:
10 fps, max:
83.1 fps
12.2 12.5 [X] ACEMagician Ace Magician AM08 Pro AMD Ryzen 9 6900HX 3.3GHz
Radeon 680M
min:
4.17 fps, P0.1:
5.46 fps, P1:
9.55 fps, max:
71.2 fps
16.2 18.2 18.4 [X] Aoostar GOD77 AMD Ryzen 7 7735HS 3.2GHz
Radeon 680M
min:
11.5 fps, P0.1:
11.5 fps, P1:
11.7 fps, max:
24.9 fps
21.8 22.9 23.8 [X] Aoostar GEM10 AMD Ryzen 7 6800H 3.2GHz
Radeon 680M
min:
20.4 fps, P0.1:
20.7 fps, P1:
21.2 fps, max:
31 fps
24.2 [X] Acemagic AM20 AMD Ryzen 7 7735H 3.2GHz
Radeon 680M
min:
7.68 fps, P0.1:
8.43 fps, P1:
14.9 fps, max:
107.1 fps
25 [X] Asus ROG Zephyrus G14 AMD Ryzen 9 6900HS 3.3GHz
Radeon 680M
min:
15.5 fps, P0.1:
19 fps, P1:
21.9 fps, max:
29.1 fps
~ 18 fps
100%
Radeon 680M:
8.9 [X] ACEMagician Ace Magician AM08 Pro AMD Ryzen 9 6900HX 3.3GHz
Radeon 680M
min:
7.42 fps, P0.1:
7.47 fps, P1:
7.71 fps, max:
11.8 fps
8.9 [X] ACEMagician Ace Magician AM08 Pro AMD Ryzen 9 6900HX 3.3GHz
Radeon 680M
min:
2.87 fps, P0.1:
3.86 fps, P1:
7.82 fps, max:
49.6 fps
9 11.5 12.2 13.4 [X] Aoostar GOD77 AMD Ryzen 7 7735HS 3.2GHz
Radeon 680M
min:
8.15 fps, P0.1:
8.26 fps, P1:
8.6 fps, max:
17.4 fps
15.1 15.2 16.5 [X] Aoostar GEM10 AMD Ryzen 7 6800H 3.2GHz
Radeon 680M
min:
13.9 fps, P0.1:
13.9 fps, P1:
14.1 fps, max:
20.8 fps
17.5 [X] Asus ROG Zephyrus G14 AMD Ryzen 9 6900HS 3.3GHz
Radeon 680M
min:
13.8 fps, P0.1:
14.1 fps, P1:
14.8 fps, max:
20.6 fps
18.1 [X] Acemagic AM20 AMD Ryzen 7 7735H 3.2GHz
Radeon 680M
min:
10.7 fps, P0.1:
11.3 fps, P1:
15.2 fps, max:
60.4 fps
~ 13 fps
100%
Radeon 680M:
75.3 [X] Asus ROG Zephyrus G14 AMD Ryzen 9 6900HS 3.3GHz
Radeon 680M
min:
18.5 fps, P0.1:
26.3 fps, P1:
48.4 fps, max:
182 fps
fps
100%
Radeon 680M:
37.8 [X] Asus ROG Zephyrus G14 AMD Ryzen 9 6900HS 3.3GHz
Radeon 680M
min:
21.3 fps, P0.1:
22.9 fps, P1:
29.7 fps, max:
124 fps
fps
100%
Radeon 680M:
31.1 [X] Asus ROG Zephyrus G14 AMD Ryzen 9 6900HS 3.3GHz
Radeon 680M
min:
9.59 fps, P0.1:
10.3 fps, P1:
17.6 fps, max:
131 fps
fps
100%
Radeon 680M:
29.3 [X] Asus ROG Zephyrus G14 AMD Ryzen 9 6900HS 3.3GHz
Radeon 680M
min:
10.7 fps, P0.1:
12.3 fps, P1:
17.8 fps, max:
103 fps
fps
100%
Radeon 680M:
86 121 123 145 [X] Asus ROG Zephyrus G14 AMD Ryzen 9 6900HS 3.3GHz
Radeon 680M
min:
0.4648 fps, P0.1:
85 fps, P1:
120 fps, max:
227 fps
~ 119 fps
100%
Radeon 680M:
40 61 62 85.4 [X] Asus ROG Zephyrus G14 AMD Ryzen 9 6900HS 3.3GHz
Radeon 680M
min:
0.4572 fps, P0.1:
18.1 fps, P1:
27.5 fps, max:
141 fps
~ 62 fps
100%
Radeon 680M:
30 48 49 72.5 [X] Asus ROG Zephyrus G14 AMD Ryzen 9 6900HS 3.3GHz
Radeon 680M
min:
14.8 fps, P0.1:
23.2 fps, P1:
57.1 fps, max:
110 fps
~ 50 fps
100%
Radeon 680M:
27 43 44 53 [X] Asus ROG Zephyrus G14 AMD Ryzen 9 6900HS 3.3GHz
Radeon 680M
min:
0.4614 fps, P0.1:
11.8 fps, P1:
19.5 fps, max:
107 fps
~ 42 fps
100%
Radeon 680M:
77.5 [X] Asus ROG Zephyrus G14 AMD Ryzen 9 6900HS 3.3GHz
Radeon 680M
min:
2.37 fps, P0.1:
6.5 fps, P1:
32.5 fps, max:
150 fps
fps
100%
Radeon 680M:
39.4 [X] Asus ROG Zephyrus G14 AMD Ryzen 9 6900HS 3.3GHz
Radeon 680M
min:
17.7 fps, P0.1:
19.3 fps, P1:
22.5 fps, max:
65.9 fps
fps
100%
Radeon 680M:
31.1 [X] Asus ROG Zephyrus G14 AMD Ryzen 9 6900HS 3.3GHz
Radeon 680M
min:
17.1 fps, P0.1:
17.2 fps, P1:
19.2 fps, max:
69.2 fps
fps
100%
Radeon 680M:
26.6 [X] Asus ROG Zephyrus G14 AMD Ryzen 9 6900HS 3.3GHz
Radeon 680M
min:
11.9 fps, P0.1:
12.6 fps, P1:
16.2 fps, max:
43.9 fps
fps
100%
Radeon 680M:
92 148 [X] Asus ROG Zephyrus G14 AMD Ryzen 9 6900HS 3.3GHz
Radeon 680M
min:
121 fps
~ 120 fps
100%
Radeon 680M:
44 60 [X] Asus ROG Zephyrus G14 AMD Ryzen 9 6900HS 3.3GHz
Radeon 680M
min:
53 fps
~ 52 fps
100%
Radeon 680M:
38 53 [X] Asus ROG Zephyrus G14 AMD Ryzen 9 6900HS 3.3GHz
Radeon 680M
min:
47 fps
~ 46 fps
100%
Radeon 680M:
27 [X] Asus ROG Zephyrus G14 AMD Ryzen 9 6900HS 3.3GHz
Radeon 680M
min:
24 fps
fps
100%
Radeon 680M:
55 74 [X] Asus ROG Zephyrus G14 AMD Ryzen 9 6900HS 3.3GHz
Radeon 680M
min:
60 fps
~ 65 fps
100%
Radeon 680M:
33 43 [X] Asus ROG Zephyrus G14 AMD Ryzen 9 6900HS 3.3GHz
Radeon 680M
min:
37 fps
~ 38 fps
100%
Radeon 680M:
25 34 [X] Asus ROG Zephyrus G14 AMD Ryzen 9 6900HS 3.3GHz
Radeon 680M
min:
29 fps
~ 30 fps
100%
Radeon 680M:
23 28 [X] Asus ROG Zephyrus G14 AMD Ryzen 9 6900HS 3.3GHz
Radeon 680M
min:
23 fps
~ 26 fps
Radeon 680M:
0 (!) [X] Asus ROG Zephyrus G14 AMD Ryzen 9 6900HS 3.3GHz
Radeon 680M
fps
Radeon 680M:
0 (!) [X] Asus ROG Zephyrus G14 AMD Ryzen 9 6900HS 3.3GHz
Radeon 680M
fps
Radeon 680M:
0 (!) [X] Asus ROG Zephyrus G14 AMD Ryzen 9 6900HS 3.3GHz
Radeon 680M
fps
Radeon 680M:
0 (!) [X] Asus ROG Zephyrus G14 AMD Ryzen 9 6900HS 3.3GHz
Radeon 680M
fps
100%
Radeon 680M:
167 [X] Asus ROG Zephyrus G14 AMD Ryzen 9 6900HS 3.3GHz
Radeon 680M
min:
79.2 fps, P0.1:
81 fps, P1:
87.9 fps, max:
384 fps
fps
100%
Radeon 680M:
65.2 [X] Asus ROG Zephyrus G14 AMD Ryzen 9 6900HS 3.3GHz
Radeon 680M
min:
27.1 fps, P0.1:
28.2 fps, P1:
29.8 fps, max:
303 fps
fps
100%
Radeon 680M:
54.4 [X] Asus ROG Zephyrus G14 AMD Ryzen 9 6900HS 3.3GHz
Radeon 680M
min:
23.2 fps, P0.1:
23.6 fps, P1:
24.4 fps, max:
323 fps
fps
100%
Radeon 680M:
49.3 [X] Asus ROG Zephyrus G14 AMD Ryzen 9 6900HS 3.3GHz
Radeon 680M
min:
20.8 fps, P0.1:
21.2 fps, P1:
22 fps, max:
298 fps
fps
100%
Radeon 680M:
29.6 55.1 [X] ACEMagician Ace Magician AM08 Pro AMD Ryzen 9 6900HX 3.3GHz
Radeon 680M
min:
41 fps, max:
86 fps
60.6 67.2 [X] ACEMagician Ace Magician AM08 Pro AMD Ryzen 9 6900HX 3.3GHz
Radeon 680M
min:
55 fps, max:
81 fps
69.7 71.8 75.4 77.9 78.4 80.5 [X] Asus ROG Zephyrus Duo 16 GX650RX AMD Ryzen 9 6900HX 3.3GHz
Radeon 680M
min:
69 fps, max:
95 fps
82 [X] Asus ROG Zephyrus G14 AMD Ryzen 9 6900HS 3.3GHz
Radeon 680M
min:
70 fps
~ 68 fps
100%
Radeon 680M:
18.8 32.2 [X] ACEMagician Ace Magician AM08 Pro AMD Ryzen 9 6900HX 3.3GHz
Radeon 680M
min:
23 fps, max:
45 fps
34.7 35.8 [X] ACEMagician Ace Magician AM08 Pro AMD Ryzen 9 6900HX 3.3GHz
Radeon 680M
min:
31 fps, max:
41 fps
38.7 39 40.6 41.8 44 [X] Asus ROG Zephyrus G14 AMD Ryzen 9 6900HS 3.3GHz
Radeon 680M
min:
39 fps
45.2 46 [X] Asus ROG Zephyrus Duo 16 GX650RX AMD Ryzen 9 6900HX 3.3GHz
Radeon 680M
min:
41 fps, max:
52 fps
~ 38 fps
100%
Radeon 680M:
16.1 27.8 30.2 [X] ACEMagician Ace Magician AM08 Pro AMD Ryzen 9 6900HX 3.3GHz
Radeon 680M
min:
26 fps, max:
35 fps
33.1 34.1 34.5 34.8 [X] ACEMagician Ace Magician AM08 Pro AMD Ryzen 9 6900HX 3.3GHz
Radeon 680M
min:
24 fps, max:
41 fps
35.3 37 [X] Asus ROG Zephyrus G14 AMD Ryzen 9 6900HS 3.3GHz
Radeon 680M
min:
32 fps
38 [X] Asus ROG Zephyrus Duo 16 GX650RX AMD Ryzen 9 6900HX 3.3GHz
Radeon 680M
min:
31 fps, max:
42 fps
38.4 ~ 33 fps
100%
Radeon 680M:
13.3 26.3 [X] ACEMagician Ace Magician AM08 Pro AMD Ryzen 9 6900HX 3.3GHz
Radeon 680M
min:
22 fps, max:
30 fps
27.2 [X] ACEMagician Ace Magician AM08 Pro AMD Ryzen 9 6900HX 3.3GHz
Radeon 680M
min:
18 fps, max:
33 fps
28.6 29.7 29.7 31 [X] Asus ROG Zephyrus G14 AMD Ryzen 9 6900HS 3.3GHz
Radeon 680M
min:
25 fps
32 33.2 [X] Asus ROG Zephyrus Duo 16 GX650RX AMD Ryzen 9 6900HX 3.3GHz
Radeon 680M
min:
28 fps, max:
37 fps
~ 28 fps
100%
Radeon 680M:
21.5 [X] Asus ROG Zephyrus Duo 16 GX650RX AMD Ryzen 9 6900HX 3.3GHz
Radeon 680M
min:
20 fps, max:
24 fps
fps
100%
Radeon 680M:
9.6 [X] Asus ROG Zephyrus Duo 16 GX650RX AMD Ryzen 9 6900HX 3.3GHz
Radeon 680M
min:
8 fps, max:
11 fps
fps
100%
Radeon 680M:
64.9 [X] Asus ROG Zephyrus G14 AMD Ryzen 9 6900HS 3.3GHz
Radeon 680M
min:
24.8 fps, P0.1:
38.2 fps, P1:
48.7 fps, max:
110 fps
fps
100%
Radeon 680M:
44.2 [X] Asus ROG Zephyrus G14 AMD Ryzen 9 6900HS 3.3GHz
Radeon 680M
min:
19.9 fps, P0.1:
22 fps, P1:
35.8 fps, max:
83.2 fps
fps
100%
Radeon 680M:
34.7 [X] Asus ROG Zephyrus G14 AMD Ryzen 9 6900HS 3.3GHz
Radeon 680M
min:
14.6 fps, P0.1:
18.4 fps, P1:
28.1 fps, max:
76.9 fps
fps
100%
Radeon 680M:
70.4 [X] Asus ROG Zephyrus G14 AMD Ryzen 9 6900HS 3.3GHz
Radeon 680M
min:
31.5 fps, P0.1:
40 fps, P1:
46.9 fps, max:
138 fps
fps
100%
Radeon 680M:
29.7 [X] Asus ROG Zephyrus G14 AMD Ryzen 9 6900HS 3.3GHz
Radeon 680M
min:
12.3 fps, P0.1:
18.9 fps, P1:
22.7 fps, max:
90.7 fps
fps
100%
Radeon 680M:
28.3 [X] Asus ROG Zephyrus G14 AMD Ryzen 9 6900HS 3.3GHz
Radeon 680M
min:
18.4 fps, P0.1:
19.2 fps, P1:
21.5 fps, max:
90.5 fps
fps
100%
Radeon 680M:
22.9 [X] Asus ROG Zephyrus G14 AMD Ryzen 9 6900HS 3.3GHz
Radeon 680M
min:
11.3 fps, P0.1:
11.4 fps, P1:
15.9 fps, max:
94.7 fps
fps
100%
Radeon 680M:
80.1 [X] Asus ROG Zephyrus G14 AMD Ryzen 9 6900HS 3.3GHz
Radeon 680M
min:
18.2 fps, P0.1:
25.3 fps, P1:
41.3 fps, max:
132 fps
fps
100%
Radeon 680M:
38.1 [X] Asus ROG Zephyrus G14 AMD Ryzen 9 6900HS 3.3GHz
Radeon 680M
min:
12.2 fps, P0.1:
13.2 fps, P1:
22.9 fps, max:
99.8 fps
fps
100%
Radeon 680M:
29.5 [X] Asus ROG Zephyrus G14 AMD Ryzen 9 6900HS 3.3GHz
Radeon 680M
min:
11.9 fps, P0.1:
12.2 fps, P1:
15.2 fps, max:
40.8 fps
fps
100%
Radeon 680M:
24.5 [X] Asus ROG Zephyrus G14 AMD Ryzen 9 6900HS 3.3GHz
Radeon 680M
min:
12.2 fps, P0.1:
12.7 fps, P1:
15.6 fps, max:
33.2 fps
fps
100%
Radeon 680M:
97 [X] Maxtang MTN-FP750 874931
AMD Ryzen 7 7735HS 3.2GHz
Radeon 680M
min:
74 fps, P1:
73 fps, max:
112 fps
99.6 103.2 133.1 133.3 140.5 152.9 155.3 155.7 156.3 [X] Aoostar GOD77 874931
AMD Ryzen 7 7735HS 3.2GHz
Radeon 680M
min:
124 fps, P1:
121 fps, max:
181 fps
156.5 163.8 [X] ACEMagician Ace Magician AM08 Pro 874931
AMD Ryzen 9 6900HX 3.3GHz
Radeon 680M
min:
131 fps, P1:
129 fps, max:
191 fps
168.1 [X] Acemagic AM20 874931
AMD Ryzen 7 7735H 3.2GHz
Radeon 680M
min:
139 fps, P1:
133 fps, max:
195 fps
169.1 [X] Aoostar GEM10 874931
AMD Ryzen 7 6800H 3.2GHz
Radeon 680M
min:
136 fps, P1:
135 fps, max:
200 fps
175.3 184.4 184.5 [X] ACEMagician Ace Magician AM08 Pro 874931
AMD Ryzen 9 6900HX 3.3GHz
Radeon 680M
min:
148 fps, P1:
141 fps, max:
214 fps
186.3 191.6 193 [X] Asus ROG Zephyrus G14 AMD Ryzen 9 6900HS 3.3GHz
Radeon 680M
min:
157 fps
~ 155 fps
100%
Radeon 680M:
49.7 49.8 [X] Maxtang MTN-FP750 874931
AMD Ryzen 7 7735HS 3.2GHz
Radeon 680M
min:
41 fps, P1:
37 fps, max:
58 fps
57.8 67.7 70.8 73.4 [X] ACEMagician Ace Magician AM08 Pro 874931
AMD Ryzen 9 6900HX 3.3GHz
Radeon 680M
min:
50 fps, P1:
45 fps, max:
98 fps
75.1 76.7 77.8 [X] ACEMagician Ace Magician AM08 Pro 874931
AMD Ryzen 9 6900HX 3.3GHz
Radeon 680M
min:
62 fps, P1:
47 fps, max:
93 fps
79.3 [X] Aoostar GOD77 874931
AMD Ryzen 7 7735HS 3.2GHz
Radeon 680M
min:
63 fps, P1:
59 fps, max:
95 fps
82.1 82.1 82.9 83.5 [X] Aoostar GEM10 874931
AMD Ryzen 7 6800H 3.2GHz
Radeon 680M
min:
67 fps, P1:
57 fps, max:
96 fps
85 [X] Acemagic AM20 874931
AMD Ryzen 7 7735H 3.2GHz
Radeon 680M
min:
70 fps, P1:
57 fps, max:
99 fps
86 88.4 90.5 92 [X] Asus ROG Zephyrus G14 AMD Ryzen 9 6900HS 3.3GHz
Radeon 680M
min:
65 fps
92.3 ~ 77 fps
100%
Radeon 680M:
26.8 [X] Acemagic AM20 874931
AMD Ryzen 7 7735H 3.2GHz
Radeon 680M
min:
18 fps, P1:
17 fps, max:
31 fps
36.4 [X] Maxtang MTN-FP750 874931
AMD Ryzen 7 7735HS 3.2GHz
Radeon 680M
min:
31 fps, P1:
27 fps, max:
41 fps
37 45.5 51.6 54.9 55.1 57.7 58.6 [X] Aoostar GOD77 874931
AMD Ryzen 7 7735HS 3.2GHz
Radeon 680M
min:
48 fps, P1:
46 fps, max:
65 fps
58.9 [X] ACEMagician Ace Magician AM08 Pro 874931
AMD Ryzen 9 6900HX 3.3GHz
Radeon 680M
min:
45 fps, P1:
41 fps, max:
65 fps
59.8 [X] ACEMagician Ace Magician AM08 Pro 874931
AMD Ryzen 9 6900HX 3.3GHz
Radeon 680M
min:
38 fps, P1:
37 fps, max:
74 fps
60.3 63.5 63.8 [X] Aoostar GEM10 874931
AMD Ryzen 7 6800H 3.2GHz
Radeon 680M
min:
48 fps, P1:
46 fps, max:
72 fps
63.9 [X] Acemagic AM20 874931
AMD Ryzen 7 7735H 3.2GHz
Radeon 680M
min:
49 fps, P1:
40 fps, max:
72 fps
64.2 64.4 67 67.5 67.5 69 [X] Asus ROG Zephyrus G14 AMD Ryzen 9 6900HS 3.3GHz
Radeon 680M
min:
54 fps
~ 57 fps
100%
Radeon 680M:
16.1 16.7 [X] Maxtang MTN-FP750 874931
AMD Ryzen 7 7735HS 3.2GHz
Radeon 680M
min:
6 fps, P1:
11 fps, max:
19 fps
19.9 20.7 21.2 23 24.5 [X] ACEMagician Ace Magician AM08 Pro 874931
AMD Ryzen 9 6900HX 3.3GHz
Radeon 680M
min:
18 fps, P1:
16 fps, max:
28 fps
24.7 25.6 25.9 [X] Aoostar GOD77 874931
AMD Ryzen 7 7735HS 3.2GHz
Radeon 680M
min:
20 fps, P1:
20 fps, max:
29 fps
26.3 [X] ACEMagician Ace Magician AM08 Pro 874931
AMD Ryzen 9 6900HX 3.3GHz
Radeon 680M
min:
16 fps, P1:
15 fps, max:
32 fps
26.3 26.6 27.1 [X] Aoostar GEM10 874931
AMD Ryzen 7 6800H 3.2GHz
Radeon 680M
min:
19 fps, P1:
19 fps, max:
30 fps
27.3 28 [X] Asus ROG Zephyrus G14 AMD Ryzen 9 6900HS 3.3GHz
Radeon 680M
min:
22 fps
28.9 29.1 ~ 24 fps
100%
Radeon 680M:
75.7 [X] Asus ROG Zephyrus G14 AMD Ryzen 9 6900HS 3.3GHz
Radeon 680M
min:
22.1 fps, P0.1:
31.8 fps, P1:
49.7 fps, max:
179 fps
fps
100%
Radeon 680M:
36.4 [X] Asus ROG Zephyrus G14 AMD Ryzen 9 6900HS 3.3GHz
Radeon 680M
min:
15.9 fps, P0.1:
18.2 fps, P1:
26.2 fps, max:
98.4 fps
fps
100%
Radeon 680M:
32.2 [X] Asus ROG Zephyrus G14 AMD Ryzen 9 6900HS 3.3GHz
Radeon 680M
min:
14.1 fps, P0.1:
16.9 fps, P1:
22.5 fps, max:
122 fps
fps
100%
Radeon 680M:
24.6 [X] Asus ROG Zephyrus G14 AMD Ryzen 9 6900HS 3.3GHz
Radeon 680M
min:
11.5 fps, P0.1:
13.2 fps, P1:
17.9 fps, max:
88.5 fps
fps
100%
Radeon 680M:
91.1 [X] Asus ROG Zephyrus G14 AMD Ryzen 9 6900HS 3.3GHz
Radeon 680M
min:
22.2 fps, P0.1:
41.2 fps, P1:
53.3 fps, max:
209 fps
fps
100%
Radeon 680M:
57.8 [X] Asus ROG Zephyrus G14 AMD Ryzen 9 6900HS 3.3GHz
Radeon 680M
min:
19.3 fps, P0.1:
23.2 fps, P1:
42.6 fps, max:
154 fps
fps
100%
Radeon 680M:
114 [X] Asus ROG Zephyrus G14 AMD Ryzen 9 6900HS 3.3GHz
Radeon 680M
min:
76.8 fps, P0.1:
86.7 fps, P1:
90.3 fps, max:
143 fps
fps
100%
Radeon 680M:
54 [X] Asus ROG Zephyrus G14 AMD Ryzen 9 6900HS 3.3GHz
Radeon 680M
min:
39 fps, P0.1:
42.6 fps, P1:
44.7 fps, max:
69.6 fps
fps
100%
Radeon 680M:
49.7 [X] Asus ROG Zephyrus G14 AMD Ryzen 9 6900HS 3.3GHz
Radeon 680M
min:
29.8 fps, P0.1:
32.6 fps, P1:
41 fps, max:
62.9 fps
fps
100%
Radeon 680M:
44.6 [X] Asus ROG Zephyrus G14 AMD Ryzen 9 6900HS 3.3GHz
Radeon 680M
min:
33.3 fps, P0.1:
34.1 fps, P1:
36.7 fps, max:
56.3 fps
fps
100%
Radeon 680M:
91.9 [X] Asus ROG Zephyrus G14 AMD Ryzen 9 6900HS 3.3GHz
Radeon 680M
min:
21.1 fps, P0.1:
26 fps, P1:
44.3 fps, max:
198 fps
fps
100%
Radeon 680M:
41.4 [X] Asus ROG Zephyrus G14 AMD Ryzen 9 6900HS 3.3GHz
Radeon 680M
min:
21.3 fps, P0.1:
22.7 fps, P1:
24 fps, max:
146 fps
fps
100%
Radeon 680M:
31 [X] Asus ROG Zephyrus G14 AMD Ryzen 9 6900HS 3.3GHz
Radeon 680M
min:
13.1 fps, P0.1:
14.3 fps, P1:
18.5 fps, max:
88.6 fps
fps
100%
Radeon 680M:
29.3 [X] Asus ROG Zephyrus G14 AMD Ryzen 9 6900HS 3.3GHz
Radeon 680M
min:
14.4 fps, P0.1:
14.9 fps, P1:
17 fps, max:
105 fps
fps
100%
Radeon 680M:
134 [X] Asus ROG Zephyrus G14 AMD Ryzen 9 6900HS 3.3GHz
Radeon 680M
137.8 [X] Asus ROG Zephyrus Duo 16 GX650RX AMD Ryzen 9 6900HX 3.3GHz
Radeon 680M
~ 136 fps
100%
Radeon 680M:
55.2 [X] Asus ROG Zephyrus G14 AMD Ryzen 9 6900HS 3.3GHz
Radeon 680M
57 [X] Asus ROG Zephyrus Duo 16 GX650RX AMD Ryzen 9 6900HX 3.3GHz
Radeon 680M
~ 56 fps
100%
Radeon 680M:
48.6 [X] Asus ROG Zephyrus G14 AMD Ryzen 9 6900HS 3.3GHz
Radeon 680M
50.5 [X] Asus ROG Zephyrus Duo 16 GX650RX AMD Ryzen 9 6900HX 3.3GHz
Radeon 680M
~ 50 fps
100%
Radeon 680M:
44.2 [X] Asus ROG Zephyrus G14 AMD Ryzen 9 6900HS 3.3GHz
Radeon 680M
45.9 [X] Asus ROG Zephyrus Duo 16 GX650RX AMD Ryzen 9 6900HX 3.3GHz
Radeon 680M
~ 45 fps
100%
Radeon 680M:
27.8 [X] Asus ROG Zephyrus Duo 16 GX650RX AMD Ryzen 9 6900HX 3.3GHz
Radeon 680M
fps
100%
Radeon 680M:
14.4 [X] Asus ROG Zephyrus Duo 16 GX650RX AMD Ryzen 9 6900HX 3.3GHz
Radeon 680M
fps
100%
Radeon 680M:
89.1 [X] Asus ROG Zephyrus G14 AMD Ryzen 9 6900HS 3.3GHz
Radeon 680M
min:
40.4 fps, P0.1:
52.7 fps, P1:
64.2 fps, max:
132 fps
fps
100%
Radeon 680M:
32.1 [X] Asus ROG Zephyrus G14 AMD Ryzen 9 6900HS 3.3GHz
Radeon 680M
min:
22.9 fps, P0.1:
23.4 fps, P1:
26.6 fps, max:
45 fps
fps
100%
Radeon 680M:
30.1 [X] Asus ROG Zephyrus G14 AMD Ryzen 9 6900HS 3.3GHz
Radeon 680M
min:
19.3 fps, P0.1:
20.4 fps, P1:
22.4 fps, max:
38.2 fps
fps
100%
Radeon 680M:
27 [X] Asus ROG Zephyrus G14 AMD Ryzen 9 6900HS 3.3GHz
Radeon 680M
min:
20.6 fps, P0.1:
21.4 fps, P1:
23 fps, max:
33.7 fps
fps
100%
Radeon 680M:
74 [X] Asus ROG Zephyrus G14 AMD Ryzen 9 6900HS 3.3GHz
Radeon 680M
min:
29 fps
fps
100%
Radeon 680M:
38 [X] Asus ROG Zephyrus G14 AMD Ryzen 9 6900HS 3.3GHz
Radeon 680M
min:
19 fps
fps
100%
Radeon 680M:
31 [X] Asus ROG Zephyrus G14 AMD Ryzen 9 6900HS 3.3GHz
Radeon 680M
min:
19 fps
fps
100%
Radeon 680M:
27 [X] Asus ROG Zephyrus G14 AMD Ryzen 9 6900HS 3.3GHz
Radeon 680M
min:
17 fps
fps
100%
Radeon 680M:
103 [X] Asus ROG Zephyrus G14 AMD Ryzen 9 6900HS 3.3GHz
Radeon 680M
min:
43 fps
fps
100%
Radeon 680M:
45.1 [X] Asus ROG Zephyrus G14 AMD Ryzen 9 6900HS 3.3GHz
Radeon 680M
min:
34 fps
fps
100%
Radeon 680M:
34.2 [X] Asus ROG Zephyrus G14 AMD Ryzen 9 6900HS 3.3GHz
Radeon 680M
min:
24 fps
fps
100%
Radeon 680M:
27.3 [X] Asus ROG Zephyrus G14 AMD Ryzen 9 6900HS 3.3GHz
Radeon 680M
min:
17 fps
fps
100%
Radeon 680M:
60 [X] Asus ROG Zephyrus G14 AMD Ryzen 9 6900HS 3.3GHz
Radeon 680M
min:
16 fps
fps
100%
Radeon 680M:
39 [X] Asus ROG Zephyrus G14 AMD Ryzen 9 6900HS 3.3GHz
Radeon 680M
min:
14 fps
fps
100%
Radeon 680M:
33 [X] Asus ROG Zephyrus G14 AMD Ryzen 9 6900HS 3.3GHz
Radeon 680M
min:
13 fps
fps
100%
Radeon 680M:
18 [X] Asus ROG Zephyrus G14 AMD Ryzen 9 6900HS 3.3GHz
Radeon 680M
min:
12 fps
fps
100%
Radeon 680M:
191 [X] Asus ROG Zephyrus G14 AMD Ryzen 9 6900HS 3.3GHz
Radeon 680M
min:
69.8 fps, P0.1:
115 fps, P1:
133 fps, max:
285 fps
fps
100%
Radeon 680M:
91 [X] Asus ROG Zephyrus G14 AMD Ryzen 9 6900HS 3.3GHz
Radeon 680M
min:
55.5 fps, P0.1:
68.2 fps, P1:
73.2 fps, max:
116 fps
fps
100%
Radeon 680M:
79.2 [X] Asus ROG Zephyrus G14 AMD Ryzen 9 6900HS 3.3GHz
Radeon 680M
min:
37.6 fps, P0.1:
50.4 fps, P1:
56.3 fps, max:
115 fps
fps
100%
Radeon 680M:
69.3 [X] Asus ROG Zephyrus G14 AMD Ryzen 9 6900HS 3.3GHz
Radeon 680M
min:
44.7 fps, P0.1:
48.6 fps, P1:
52.5 fps, max:
90 fps
fps
100%
Radeon 680M:
64.3 [X] Asus ROG Zephyrus G14 AMD Ryzen 9 6900HS 3.3GHz
Radeon 680M
min:
39.9 fps, P0.1:
41.3 fps, P1:
44.3 fps, max:
114 fps
fps
100%
Radeon 680M:
29.1 [X] Asus ROG Zephyrus G14 AMD Ryzen 9 6900HS 3.3GHz
Radeon 680M
min:
16.3 fps, P0.1:
16.9 fps, P1:
19.2 fps, max:
96.1 fps
fps
100%
Radeon 680M:
26.7 [X] Asus ROG Zephyrus G14 AMD Ryzen 9 6900HS 3.3GHz
Radeon 680M
min:
14 fps, P0.1:
15.4 fps, P1:
17.2 fps, max:
75.5 fps
fps
100%
Radeon 680M:
106 [X] Asus ROG Zephyrus G14 AMD Ryzen 9 6900HS 3.3GHz
Radeon 680M
fps
100%
Radeon 680M:
108 [X] Asus ROG Zephyrus G14 AMD Ryzen 9 6900HS 3.3GHz
Radeon 680M
min:
43 fps, P0.1:
51.4 fps, P1:
56.3 fps, max:
203 fps
fps
100%
Radeon 680M:
50.4 [X] Asus ROG Zephyrus G14 AMD Ryzen 9 6900HS 3.3GHz
Radeon 680M
min:
24.7 fps, P0.1:
26.7 fps, P1:
33.1 fps, max:
124 fps
fps
100%
Radeon 680M:
12.9 [X] Asus ROG Zephyrus G14 AMD Ryzen 9 6900HS 3.3GHz
Radeon 680M
min:
7.04 fps, P0.1:
7.05 fps, P1:
7.17 fps, max:
58.4 fps
fps
100%
Radeon 680M:
11.9 [X] Asus ROG Zephyrus G14 AMD Ryzen 9 6900HS 3.3GHz
Radeon 680M
min:
4.59 fps, P0.1:
4.82 fps, P1:
5.82 fps, max:
110 fps
fps
GeForce GTX 1660 Ti Max-Q:
55.1 fps
GeForce GTX 1660 Ti Max-Q:
49.4 fps
GeForce GTX 1660 Ti Max-Q:
37.1 fps
GeForce GTX 1660 Ti Max-Q:
25.3 fps
153%
GeForce GTX 1660 Ti Max-Q:
119 fps
211%
GeForce GTX 1660 Ti Max-Q:
78 fps
203%
GeForce GTX 1660 Ti Max-Q:
65 fps
189%
GeForce GTX 1660 Ti Max-Q:
51 fps
100%
Radeon 680M:
88.6 [X] Asus ROG Zephyrus G14 AMD Ryzen 9 6900HS 3.3GHz
Radeon 680M
min:
62.6 fps, P0.1:
68.1 fps, P1:
73.7 fps, max:
121 fps
fps
154%
GeForce GTX 1660 Ti Max-Q:
136.1 fps
100%
Radeon 680M:
49.4 [X] Asus ROG Zephyrus G14 AMD Ryzen 9 6900HS 3.3GHz
Radeon 680M
min:
13.9 fps, P0.1:
39 fps, P1:
43.1 fps, max:
56.8 fps
fps
178%
GeForce GTX 1660 Ti Max-Q:
87.7 fps
100%
Radeon 680M:
44.7 [X] Asus ROG Zephyrus G14 AMD Ryzen 9 6900HS 3.3GHz
Radeon 680M
min:
15.7 fps, P0.1:
28.1 fps, P1:
38.7 fps, max:
73.4 fps
fps
182%
GeForce GTX 1660 Ti Max-Q:
81.3 fps
100%
Radeon 680M:
44.1 [X] Asus ROG Zephyrus G14 AMD Ryzen 9 6900HS 3.3GHz
Radeon 680M
min:
37.1 fps, P0.1:
37.5 fps, P1:
38.6 fps, max:
52.3 fps
fps
178%
GeForce GTX 1660 Ti Max-Q:
78.4 fps
100%
Radeon 680M:
92.3 96.9 137.4 140.4 152.2 154.1 [X] ACEMagician Ace Magician AM08 Pro 759689
AMD Ryzen 9 6900HX 3.3GHz
Radeon 680M
min:
141 fps, max:
173 fps
157.2 [X] Aoostar GOD77 759689
AMD Ryzen 7 7735HS 3.2GHz
Radeon 680M
min:
142 fps, max:
176 fps
158 [X] Acemagic AM20 759689
AMD Ryzen 7 7735H 3.2GHz
Radeon 680M
min:
147 fps, max:
174 fps
164 [X] Aoostar GEM10 759689
AMD Ryzen 7 6800H 3.2GHz
Radeon 680M
min:
150 fps, max:
185 fps
165.3 [X] ACEMagician Ace Magician AM08 Pro 759689
AMD Ryzen 9 6900HX 3.3GHz
Radeon 680M
min:
153 fps, max:
184 fps
166.9 174.3 177 ~ 149 fps
147%
GeForce GTX 1660 Ti Max-Q:
219 fps
100%
Radeon 680M:
49.8 52.4 66.3 67 73.8 [X] ACEMagician Ace Magician AM08 Pro 759689
AMD Ryzen 9 6900HX 3.3GHz
Radeon 680M
min:
63 fps, max:
84 fps
78.3 [X] Aoostar GOD77 759689
AMD Ryzen 7 7735HS 3.2GHz
Radeon 680M
min:
68 fps, max:
88 fps
79.2 [X] ACEMagician Ace Magician AM08 Pro 759689
AMD Ryzen 9 6900HX 3.3GHz
Radeon 680M
min:
53 fps, max:
95 fps
80.5 [X] Acemagic AM20 759689
AMD Ryzen 7 7735H 3.2GHz
Radeon 680M
min:
70 fps, max:
93 fps
80.9 82.5 [X] Aoostar GEM10 759689
AMD Ryzen 7 6800H 3.2GHz
Radeon 680M
min:
66 fps, max:
95 fps
84.6 86.3 87.4 ~ 75 fps
173%
GeForce GTX 1660 Ti Max-Q:
130 fps
100%
Radeon 680M:
39.1 44.5 49.7 52.7 57.8 [X] ACEMagician Ace Magician AM08 Pro 759689
AMD Ryzen 9 6900HX 3.3GHz
Radeon 680M
min:
48 fps, max:
67 fps
60.1 [X] ACEMagician Ace Magician AM08 Pro 759689
AMD Ryzen 9 6900HX 3.3GHz
Radeon 680M
min:
41 fps, max:
75 fps
60.9 [X] Aoostar GOD77 759689
AMD Ryzen 7 7735HS 3.2GHz
Radeon 680M
min:
49 fps, max:
70 fps
62.4 [X] Acemagic AM20 759689
AMD Ryzen 7 7735H 3.2GHz
Radeon 680M
min:
51 fps, max:
73 fps
63.7 64.5 [X] Aoostar GEM10 759689
AMD Ryzen 7 6800H 3.2GHz
Radeon 680M
min:
51 fps, max:
74 fps
66.4 67.2 67.6 ~ 58 fps
193%
GeForce GTX 1660 Ti Max-Q:
112 fps
100%
Radeon 680M:
27.5 31.4 32.5 36 38.7 [X] ACEMagician Ace Magician AM08 Pro 759689
AMD Ryzen 9 6900HX 3.3GHz
Radeon 680M
min:
30 fps, max:
49 fps
40.5 [X] ACEMagician Ace Magician AM08 Pro 759689
AMD Ryzen 9 6900HX 3.3GHz
Radeon 680M
min:
28 fps, max:
55 fps
42.8 [X] Acemagic AM20 759689
AMD Ryzen 7 7735H 3.2GHz
Radeon 680M
min:
32 fps, max:
54 fps
43 [X] Aoostar GOD77 759689
AMD Ryzen 7 7735HS 3.2GHz
Radeon 680M
min:
33 fps, max:
53 fps
43.9 44.7 [X] Aoostar GEM10 759689
AMD Ryzen 7 6800H 3.2GHz
Radeon 680M
min:
34 fps, max:
55 fps
45.4 46.4 46.7 ~ 40 fps
198%
GeForce GTX 1660 Ti Max-Q:
79 fps
100%
Radeon 680M:
136.2 197 [X] Asus ROG Zephyrus G14 AMD Ryzen 9 6900HS 3.3GHz
Radeon 680M
~ 167 fps
129%
GeForce GTX 1660 Ti Max-Q:
214.7 fps
100%
Radeon 680M:
53.9 68.1 [X] Asus ROG Zephyrus G14 AMD Ryzen 9 6900HS 3.3GHz
Radeon 680M
~ 61 fps
213%
GeForce GTX 1660 Ti Max-Q:
130.2 fps
100%
Radeon 680M:
33.3 45.8 [X] Asus ROG Zephyrus G14 AMD Ryzen 9 6900HS 3.3GHz
Radeon 680M
~ 40 fps
200%
GeForce GTX 1660 Ti Max-Q:
79.9 fps
100%
Radeon 680M:
21.2 31.3 [X] Asus ROG Zephyrus G14 AMD Ryzen 9 6900HS 3.3GHz
Radeon 680M
~ 26 fps
216%
GeForce GTX 1660 Ti Max-Q:
56.1 fps
100%
Radeon 680M:
293 [X] Asus ROG Zephyrus G14 AMD Ryzen 9 6900HS 3.3GHz
Radeon 680M
min:
152 fps, P0.1:
177 fps, P1:
193 fps, max:
476 fps
fps
58%
GeForce GTX 1660 Ti Max-Q:
168.9 fps
100%
Radeon 680M:
161 [X] Asus ROG Zephyrus G14 AMD Ryzen 9 6900HS 3.3GHz
Radeon 680M
min:
114 fps, P0.1:
117 fps, P1:
122 fps, max:
240 fps
fps
63%
GeForce GTX 1660 Ti Max-Q:
101.7 fps
100%
Radeon 680M:
147 [X] Asus ROG Zephyrus G14 AMD Ryzen 9 6900HS 3.3GHz
Radeon 680M
min:
102 fps, P0.1:
107 fps, P1:
112 fps, max:
222 fps
fps
65%
GeForce GTX 1660 Ti Max-Q:
95.4 fps
100%
Radeon 680M:
146 [X] Asus ROG Zephyrus G14 AMD Ryzen 9 6900HS 3.3GHz
Radeon 680M
min:
103 fps, P0.1:
105 fps, P1:
110 fps, max:
213 fps
fps
64%
GeForce GTX 1660 Ti Max-Q:
93.4 fps
100%
Radeon 680M:
95.8 [X] Asus ROG Zephyrus G14 AMD Ryzen 9 6900HS 3.3GHz
Radeon 680M
min:
32.6 fps, P0.1:
63 fps, P1:
75.6 fps, max:
141 fps
fps
185%
GeForce GTX 1660 Ti Max-Q:
176.8 fps
100%
Radeon 680M:
38 [X] Asus ROG Zephyrus G14 AMD Ryzen 9 6900HS 3.3GHz
Radeon 680M
min:
23.3 fps, P0.1:
27.2 fps, P1:
33.5 fps, max:
42.4 fps
fps
214%
GeForce GTX 1660 Ti Max-Q:
81.2 fps
100%
Radeon 680M:
29.5 [X] Asus ROG Zephyrus G14 AMD Ryzen 9 6900HS 3.3GHz
Radeon 680M
min:
21.3 fps, P0.1:
22.4 fps, P1:
26.2 fps, max:
31.5 fps
fps
215%
GeForce GTX 1660 Ti Max-Q:
63.3 fps
GeForce GTX 1660 Ti Max-Q:
121.2 fps
GeForce GTX 1660 Ti Max-Q:
98.3 fps
GeForce GTX 1660 Ti Max-Q:
90.5 fps
GeForce GTX 1660 Ti Max-Q:
87.7 fps
GeForce GTX 1660 Ti Max-Q:
115.1 fps
GeForce GTX 1660 Ti Max-Q:
71.7 fps
GeForce GTX 1660 Ti Max-Q:
47.2 fps
GeForce GTX 1660 Ti Max-Q:
29.4 fps
GeForce GTX 1660 Ti Max-Q:
91.5 fps
GeForce GTX 1660 Ti Max-Q:
78.1 fps
GeForce GTX 1660 Ti Max-Q:
72.4 fps
GeForce GTX 1660 Ti Max-Q:
95.8 fps
GeForce GTX 1660 Ti Max-Q:
83 fps
GeForce GTX 1660 Ti Max-Q:
73.9 fps
GeForce GTX 1660 Ti Max-Q:
66.9 fps
GeForce GTX 1660 Ti Max-Q:
135.2 fps
GeForce GTX 1660 Ti Max-Q:
88 fps
GeForce GTX 1660 Ti Max-Q:
72.6 fps
GeForce GTX 1660 Ti Max-Q:
62.6 fps
GeForce GTX 1660 Ti Max-Q:
112.9 fps
GeForce GTX 1660 Ti Max-Q:
86.5 fps
GeForce GTX 1660 Ti Max-Q:
72 fps
GeForce GTX 1660 Ti Max-Q:
58.7 fps
GeForce GTX 1660 Ti Max-Q:
83 114 ~ 99 fps
GeForce GTX 1660 Ti Max-Q:
68 72 ~ 70 fps
GeForce GTX 1660 Ti Max-Q:
65 66 ~ 66 fps
GeForce GTX 1660 Ti Max-Q:
48 51 ~ 50 fps
GeForce GTX 1660 Ti Max-Q:
147.9 fps
GeForce GTX 1660 Ti Max-Q:
145.4 fps
GeForce GTX 1660 Ti Max-Q:
141 fps
GeForce GTX 1660 Ti Max-Q:
139.3 fps
100%
Radeon 680M:
38.3 53.7 58.2 66.4 78.8 [X] ACEMagician Ace Magician AM08 Pro AMD Ryzen 9 6900HX 3.3GHz
Radeon 680M
78.8 82.1 83.6 [X] Aoostar GEM10 AMD Ryzen 7 6800H 3.2GHz
Radeon 680M
84.9 85.5 [X] ACEMagician Ace Magician AM08 Pro AMD Ryzen 9 6900HX 3.3GHz
Radeon 680M
85.9 [X] Asus ROG Zephyrus Duo 16 GX650RX AMD Ryzen 9 6900HX 3.3GHz
Radeon 680M
86.6 90.7 ~ 75 fps
136%
GeForce GTX 1660 Ti Max-Q:
87 116.5 ~ 102 fps
100%
Radeon 680M:
23.8 24.8 27.6 [X] ACEMagician Ace Magician AM08 Pro AMD Ryzen 9 6900HX 3.3GHz
Radeon 680M
28 28.7 [X] ACEMagician Ace Magician AM08 Pro AMD Ryzen 9 6900HX 3.3GHz
Radeon 680M
30.7 34.8 38.5 38.7 39.6 40 [X] Aoostar GEM10 AMD Ryzen 7 6800H 3.2GHz
Radeon 680M
42.5 45.6 [X] Asus ROG Zephyrus Duo 16 GX650RX AMD Ryzen 9 6900HX 3.3GHz
Radeon 680M
~ 34 fps
226%
GeForce GTX 1660 Ti Max-Q:
72.1 81.5 ~ 77 fps
100%
Radeon 680M:
15.7 16.9 [X] ACEMagician Ace Magician AM08 Pro AMD Ryzen 9 6900HX 3.3GHz
Radeon 680M
17.7 17.8 18 [X] ACEMagician Ace Magician AM08 Pro AMD Ryzen 9 6900HX 3.3GHz
Radeon 680M
20.2 24.1 24.5 25.6 26.2 26.4 [X] Aoostar GEM10 AMD Ryzen 7 6800H 3.2GHz
Radeon 680M
26.5 28.4 [X] Asus ROG Zephyrus Duo 16 GX650RX AMD Ryzen 9 6900HX 3.3GHz
Radeon 680M
~ 22 fps
245%
GeForce GTX 1660 Ti Max-Q:
52.9 54.9 ~ 54 fps
100%
Radeon 680M:
12.5 13.7 [X] ACEMagician Ace Magician AM08 Pro AMD Ryzen 9 6900HX 3.3GHz
Radeon 680M
14.5 14.5 14.9 15.9 [X] ACEMagician Ace Magician AM08 Pro AMD Ryzen 9 6900HX 3.3GHz
Radeon 680M
19.3 19.6 20.1 20.3 20.8 [X] Aoostar GEM10 AMD Ryzen 7 6800H 3.2GHz
Radeon 680M
21.9 22.4 [X] Asus ROG Zephyrus Duo 16 GX650RX AMD Ryzen 9 6900HX 3.3GHz
Radeon 680M
~ 18 fps
233%
GeForce GTX 1660 Ti Max-Q:
41.5 42.3 ~ 42 fps
100%
Radeon 680M:
14.3 [X] Asus ROG Zephyrus Duo 16 GX650RX AMD Ryzen 9 6900HX 3.3GHz
Radeon 680M
fps
100%
Radeon 680M:
6.8 [X] Asus ROG Zephyrus Duo 16 GX650RX AMD Ryzen 9 6900HX 3.3GHz
Radeon 680M
fps
100%
Radeon 680M:
79.9 fps
198%
GeForce GTX 1660 Ti Max-Q:
158.3 fps
100%
Radeon 680M:
28.2 fps
226%
GeForce GTX 1660 Ti Max-Q:
63.7 fps
100%
Radeon 680M:
20.5 fps
230%
GeForce GTX 1660 Ti Max-Q:
47.1 fps
100%
Radeon 680M:
13.3 fps
GeForce GTX 1660 Ti Max-Q:
155 183 ~ 169 fps
GeForce GTX 1660 Ti Max-Q:
119 140 ~ 130 fps
GeForce GTX 1660 Ti Max-Q:
106 117 ~ 112 fps
GeForce GTX 1660 Ti Max-Q:
71 77 ~ 74 fps
100%
Radeon 680M:
118.2 [X] Aoostar GEM10 AMD Ryzen 7 6800H 3.2GHz
Radeon 680M
fps
150%
GeForce GTX 1660 Ti Max-Q:
144.1 209.4 ~ 177 fps
100%
Radeon 680M:
54.5 [X] Aoostar GEM10 AMD Ryzen 7 6800H 3.2GHz
Radeon 680M
fps
156%
GeForce GTX 1660 Ti Max-Q:
76.5 93.1 ~ 85 fps
100%
Radeon 680M:
45.3 [X] Aoostar GEM10 AMD Ryzen 7 6800H 3.2GHz
Radeon 680M
fps
124%
GeForce GTX 1660 Ti Max-Q:
54.7 57.1 ~ 56 fps
100%
Radeon 680M:
37.1 [X] Aoostar GEM10 AMD Ryzen 7 6800H 3.2GHz
Radeon 680M
fps
111%
GeForce GTX 1660 Ti Max-Q:
41.1 41.6 ~ 41 fps
GeForce GTX 1660 Ti Max-Q:
70.9 76.2 ~ 74 fps
GeForce GTX 1660 Ti Max-Q:
58.7 65.8 ~ 62 fps
GeForce GTX 1660 Ti Max-Q:
58.2 64.8 ~ 62 fps
GeForce GTX 1660 Ti Max-Q:
59.6 87.9 ~ 74 fps
GeForce GTX 1660 Ti Max-Q:
58.7 83.2 ~ 71 fps
GeForce GTX 1660 Ti Max-Q:
45.3 64.1 ~ 55 fps
GeForce GTX 1660 Ti Max-Q:
26 33.2 ~ 30 fps
156%
GeForce GTX 1660 Ti Max-Q:
110 142 ~ 126 fps
240%
GeForce GTX 1660 Ti Max-Q:
80 87 ~ 84 fps
234%
GeForce GTX 1660 Ti Max-Q:
66 69 ~ 68 fps
227%
GeForce GTX 1660 Ti Max-Q:
49 50 ~ 50 fps
GeForce GTX 1660 Ti Max-Q:
88.7 103.2 ~ 96 fps
GeForce GTX 1660 Ti Max-Q:
57.3 59.2 ~ 58 fps
GeForce GTX 1660 Ti Max-Q:
53.6 fps
GeForce GTX 1660 Ti Max-Q:
48.9 fps
GeForce GTX 1660 Ti Max-Q:
48.8 fps
GeForce GTX 1660 Ti Max-Q:
46.4 fps
100%
Radeon 680M:
36 40 52 58 [X] ACEMagician Ace Magician AM08 Pro AMD Ryzen 9 6900HX 3.3GHz
Radeon 680M
min:
45 fps, max:
76 fps
58 60 61 62 [X] Aoostar GEM10 AMD Ryzen 7 6800H 3.2GHz
Radeon 680M
min:
50 fps, max:
80 fps
63 [X] ACEMagician Ace Magician AM08 Pro AMD Ryzen 9 6900HX 3.3GHz
Radeon 680M
min:
50 fps, max:
81 fps
64 65 66 ~ 57 fps
170%
GeForce GTX 1660 Ti Max-Q:
97 fps
100%
Radeon 680M:
23 25 30 31 [X] ACEMagician Ace Magician AM08 Pro AMD Ryzen 9 6900HX 3.3GHz
Radeon 680M
min:
19 fps, max:
48 fps
34 [X] ACEMagician Ace Magician AM08 Pro AMD Ryzen 9 6900HX 3.3GHz
Radeon 680M
min:
28 fps, max:
42 fps
38 39 39 39 39 41 42 [X] Aoostar GEM10 AMD Ryzen 7 6800H 3.2GHz
Radeon 680M
min:
34 fps, max:
53 fps
~ 35 fps
231%
GeForce GTX 1660 Ti Max-Q:
81 fps
100%
Radeon 680M:
21 23 29 32 [X] ACEMagician Ace Magician AM08 Pro AMD Ryzen 9 6900HX 3.3GHz
Radeon 680M
min:
19 fps, max:
40 fps
35 36 37 37 37 [X] ACEMagician Ace Magician AM08 Pro AMD Ryzen 9 6900HX 3.3GHz
Radeon 680M
min:
22 fps, max:
48 fps
37 39 40 [X] Aoostar GEM10 AMD Ryzen 7 6800H 3.2GHz
Radeon 680M
min:
33 fps, max:
49 fps
~ 34 fps
229%
GeForce GTX 1660 Ti Max-Q:
78 fps
100%
Radeon 680M:
20 21 26 [X] ACEMagician Ace Magician AM08 Pro AMD Ryzen 9 6900HX 3.3GHz
Radeon 680M
min:
15 fps, max:
37 fps
26 32 [X] ACEMagician Ace Magician AM08 Pro AMD Ryzen 9 6900HX 3.3GHz
Radeon 680M
min:
17 fps, max:
46 fps
33 34 34 34 34 36 37 [X] Aoostar GEM10 AMD Ryzen 7 6800H 3.2GHz
Radeon 680M
min:
28 fps, max:
49 fps
~ 31 fps
229%
GeForce GTX 1660 Ti Max-Q:
71 fps
100%
Radeon 680M:
41.9 43.1 52.8 [X] ACEMagician Ace Magician AM08 Pro AMD Ryzen 9 6900HX 3.3GHz
Radeon 680M
min:
31.99 fps, max:
67.95 fps
54.5 57.6 57.8 57.8 [X] Aoostar GOD77 AMD Ryzen 7 7735HS 3.2GHz
Radeon 680M
min:
44.05 fps, max:
68.79 fps
65.8 69.8 72.2 [X] Acemagic AM20 AMD Ryzen 7 7735H 3.2GHz
Radeon 680M
min:
41.79 fps, max:
106.81 fps
72.3 [X] ACEMagician Ace Magician AM08 Pro AMD Ryzen 9 6900HX 3.3GHz
Radeon 680M
min:
42.04 fps, max:
112.04 fps
73 76.2 [X] Aoostar GEM10 AMD Ryzen 7 6800H 3.2GHz
Radeon 680M
min:
47.16 fps, max:
110.72 fps
~ 61 fps
100%
Radeon 680M:
17.6 24.3 24.7 25.2 26 [X] ACEMagician Ace Magician AM08 Pro AMD Ryzen 9 6900HX 3.3GHz
Radeon 680M
min:
12.96 fps, max:
39.06 fps
27.2 28.2 [X] Aoostar GOD77 AMD Ryzen 7 7735HS 3.2GHz
Radeon 680M
min:
13.65 fps, max:
42.22 fps
29.2 29.3 [X] Aoostar GEM10 AMD Ryzen 7 6800H 3.2GHz
Radeon 680M
min:
14.76 fps, max:
41.62 fps
29.8 30.4 [X] ACEMagician Ace Magician AM08 Pro AMD Ryzen 9 6900HX 3.3GHz
Radeon 680M
min:
14.07 fps, max:
46.33 fps
30.6 [X] Acemagic AM20 AMD Ryzen 7 7735H 3.2GHz
Radeon 680M
min:
14.51 fps, max:
46.22 fps
31 ~ 27 fps
222%
GeForce GTX 1660 Ti Max-Q:
53.9 60 66.5 ~ 60 fps
100%
Radeon 680M:
13.8 18.7 18.8 19.2 19.9 [X] ACEMagician Ace Magician AM08 Pro AMD Ryzen 9 6900HX 3.3GHz
Radeon 680M
min:
9.84 fps, max:
32.05 fps
20.2 22.1 [X] Aoostar GOD77 AMD Ryzen 7 7735HS 3.2GHz
Radeon 680M
min:
10.92 fps, max:
32.79 fps
22.3 22.9 23.2 [X] ACEMagician Ace Magician AM08 Pro AMD Ryzen 9 6900HX 3.3GHz
Radeon 680M
min:
11.23 fps, max:
35.8 fps
23.4 23.4 [X] Acemagic AM20 AMD Ryzen 7 7735H 3.2GHz
Radeon 680M
min:
11.62 fps, max:
35.15 fps
24.1 [X] Aoostar GEM10 AMD Ryzen 7 6800H 3.2GHz
Radeon 680M
min:
11.39 fps, max:
36.99 fps
~ 21 fps
100%
Radeon 680M:
11.7 15.1 15.5 15.5 16.4 17.4 [X] ACEMagician Ace Magician AM08 Pro AMD Ryzen 9 6900HX 3.3GHz
Radeon 680M
min:
9.52 fps, max:
25.53 fps
18 18.1 [X] Aoostar GOD77 AMD Ryzen 7 7735HS 3.2GHz
Radeon 680M
min:
9.66 fps, max:
25.87 fps
18.8 [X] Acemagic AM20 AMD Ryzen 7 7735H 3.2GHz
Radeon 680M
min:
9.65 fps, max:
27.78 fps
19 [X] ACEMagician Ace Magician AM08 Pro AMD Ryzen 9 6900HX 3.3GHz
Radeon 680M
min:
9.59 fps, max:
28.39 fps
19.4 [X] Aoostar GEM10 AMD Ryzen 7 6800H 3.2GHz
Radeon 680M
min:
9.8 fps, max:
28.38 fps
19.5 19.8 ~ 17 fps
GeForce GTX 1660 Ti Max-Q:
144 144 ~ 144 fps
GeForce GTX 1660 Ti Max-Q:
90.1 99.6 ~ 95 fps
GeForce GTX 1660 Ti Max-Q:
89 99.6 ~ 94 fps
GeForce GTX 1660 Ti Max-Q:
135.6 fps
GeForce GTX 1660 Ti Max-Q:
85.8 fps
GeForce GTX 1660 Ti Max-Q:
77.4 fps
GeForce GTX 1660 Ti Max-Q:
72.8 fps
GeForce GTX 1660 Ti Max-Q:
61 73 85 ~ 73 fps
GeForce GTX 1660 Ti Max-Q:
37.9 fps
GeForce GTX 1660 Ti Max-Q:
115.2 fps
GeForce GTX 1660 Ti Max-Q:
87.9 fps
GeForce GTX 1660 Ti Max-Q:
84.6 fps
GeForce GTX 1660 Ti Max-Q:
83.1 fps
GeForce GTX 1660 Ti Max-Q:
48 64 90 ~ 67 fps
GeForce GTX 1660 Ti Max-Q:
43 56 71 ~ 57 fps
GeForce GTX 1660 Ti Max-Q:
39 51 60 ~ 50 fps
GeForce GTX 1660 Ti Max-Q:
33 42 44 ~ 40 fps
100%
Radeon 680M:
53.3 53.6 56.9 [X] ACEMagician Ace Magician AM08 Pro AMD Ryzen 9 6900HX 3.3GHz
Radeon 680M
max:
111.6 fps
70.6 81 85.7 85.9 90 91.3 [X] Aoostar GEM10 AMD Ryzen 7 6800H 3.2GHz
Radeon 680M
max:
138.5 fps
92 92.7 92.9 [X] ACEMagician Ace Magician AM08 Pro AMD Ryzen 9 6900HX 3.3GHz
Radeon 680M
max:
144.5 fps
~ 79 fps
122%
GeForce GTX 1660 Ti Max-Q:
62 82 113 126 ~ 96 fps
100%
Radeon 680M:
20.7 [X] ACEMagician Ace Magician AM08 Pro AMD Ryzen 9 6900HX 3.3GHz
Radeon 680M
max:
42.6 fps
21.8 23.9 [X] ACEMagician Ace Magician AM08 Pro AMD Ryzen 9 6900HX 3.3GHz
Radeon 680M
max:
57.4 fps
26.4 29.8 30.8 33 36.1 38.8 39.2 39.8 40.5 [X] Aoostar GEM10 AMD Ryzen 7 6800H 3.2GHz
Radeon 680M
max:
91.3 fps
~ 32 fps
219%
GeForce GTX 1660 Ti Max-Q:
53 57 83 85 ~ 70 fps
100%
Radeon 680M:
18.7 [X] ACEMagician Ace Magician AM08 Pro AMD Ryzen 9 6900HX 3.3GHz
Radeon 680M
max:
37.7 fps
19.8 20.6 [X] ACEMagician Ace Magician AM08 Pro AMD Ryzen 9 6900HX 3.3GHz
Radeon 680M
max:
39.1 fps
25.2 27.5 28 30 33.9 35.2 35.4 35.6 36.9 [X] Aoostar GEM10 AMD Ryzen 7 6800H 3.2GHz
Radeon 680M
max:
67.8 fps
~ 29 fps
221%
GeForce GTX 1660 Ti Max-Q:
52 53 74 75 ~ 64 fps
100%
Radeon 680M:
16.4 [X] ACEMagician Ace Magician AM08 Pro AMD Ryzen 9 6900HX 3.3GHz
Radeon 680M
max:
41.3 fps
16.4 17.3 [X] ACEMagician Ace Magician AM08 Pro AMD Ryzen 9 6900HX 3.3GHz
Radeon 680M
max:
37.9 fps
22.9 23.3 24.4 25 28.8 29.8 29.9 30.5 31.9 [X] Aoostar GEM10 AMD Ryzen 7 6800H 3.2GHz
Radeon 680M
max:
49.9 fps
~ 25 fps
228%
GeForce GTX 1660 Ti Max-Q:
49 49 64 67 ~ 57 fps
100%
Radeon 680M:
72.9 [X] HP EliteBook 865 G9 1.47.22.14 D3D12
AMD Ryzen 7 PRO 6850U 2.7GHz
Radeon 680M
min:
53.9 fps, P1:
63.8 fps, max:
99.5 fps
78.2 78.4 [X] Maxtang MTN-FP750 1.47.22.14 D3D12
AMD Ryzen 7 7735HS 3.2GHz
Radeon 680M
min:
57.8 fps, P1:
65.5 fps, max:
104.8 fps
84.5 106.8 115.6 [X] HP EliteBook 835 G9 1.47.22.14 D3D12
AMD Ryzen 7 PRO 6850U 2.7GHz
Radeon 680M
min:
19.1 fps, P1:
97.6 fps, max:
317 fps
125.1 128.9 131.3 132.2 133.5 133.7 135.7 [X] ACEMagician Ace Magician AM08 Pro 1.47.22.14 D3D12
AMD Ryzen 9 6900HX 3.3GHz
Radeon 680M
min:
74.4 fps, P1:
113.8 fps, max:
199.2 fps
137.5 [X] Aoostar GOD77 1.47.22.14 D3D12
AMD Ryzen 7 7735HS 3.2GHz
Radeon 680M
min:
81.3 fps, P1:
118.1 fps, max:
222 fps
137.8 139 140.4 [X] Morefine M600, 6900HX 1.47.22.14 D3D12
AMD Ryzen 9 6900HX 3.3GHz
Radeon 680M
min:
67.6 fps, P1:
120.3 fps, max:
183.8 fps
140.5 140.6 140.9 [X] ACEMagician Ace Magician AM08 Pro 1.47.22.14 D3D12
AMD Ryzen 9 6900HX 3.3GHz
Radeon 680M
min:
83.6 fps, P1:
113.1 fps, max:
195.1 fps
141.9 [X] Beelink SER6 Pro 1.47.22.14 D3D12
AMD Ryzen 7 6800H 3.2GHz
Radeon 680M
min:
78.6 fps, P1:
116.6 fps, max:
209 fps
142.4 [X] Beelink GTR6 1.47.22.14 D3D12
AMD Ryzen 9 6900HX 3.3GHz
Radeon 680M
min:
86.5 fps, P1:
118 fps, max:
207 fps
143 [X] Asus ROG Zephyrus G14 AMD Ryzen 9 6900HS 3.3GHz
Radeon 680M
143.5 [X] One Netbook XPlayer 2 1.47.22.14 D3D12
AMD Ryzen 7 6800U 2.7GHz
Radeon 680M
min:
84.4 fps, P1:
110.5 fps, max:
225 fps
145.7 [X] GPD Win 4 1.47.22.14 D3D12
AMD Ryzen 7 6800U 2.7GHz
Radeon 680M
min:
66.5 fps, P1:
114.1 fps, max:
227 fps
146.2 [X] Aokzoe A1 1.47.22.14 D3D12
AMD Ryzen 7 6800U 2.7GHz
Radeon 680M
min:
90.2 fps, P1:
115 fps, max:
217 fps
147.3 [X] GMK NucBox K2 1.47.22.14 D3D12
AMD Ryzen 7 7735HS 3.2GHz
Radeon 680M
min:
85.9 fps, P1:
124 fps, max:
206 fps
148.3 [X] Aoostar GEM10 1.47.22.14 D3D12
AMD Ryzen 7 6800H 3.2GHz
Radeon 680M
min:
94.8 fps, P1:
128.6 fps, max:
229 fps
148.9 [X] Acemagic AM20 1.47.22.14 D3D12
AMD Ryzen 7 7735H 3.2GHz
Radeon 680M
min:
66.1 fps, P1:
117.4 fps, max:
232 fps
149.9 155.8 [X] HP Dragonfly Pro 2023 1.47.22.14 D3D12
AMD Ryzen 7 7736U 2.7GHz
Radeon 680M
min:
57.1 fps, P1:
120.1 fps, max:
231 fps
167.5 ~ 132 fps
100%
Radeon 680M:
30 [X] HP EliteBook 865 G9 1.47.22.14 D3D12
AMD Ryzen 7 PRO 6850U 2.7GHz
Radeon 680M
min:
25 fps, P1:
26.2 fps, max:
40.8 fps
31.1 31.4 [X] Maxtang MTN-FP750 1.47.22.14 D3D12
AMD Ryzen 7 7735HS 3.2GHz
Radeon 680M
min:
26.4 fps, P1:
27.4 fps, max:
41.4 fps
46.2 49 [X] HP EliteBook 835 G9 1.47.22.14 D3D12
AMD Ryzen 7 PRO 6850U 2.7GHz
Radeon 680M
min:
11.8 fps, P1:
43.7 fps, max:
229 fps
49.1 54.2 [X] ACEMagician Ace Magician AM08 Pro 1.47.22.14 D3D12
AMD Ryzen 9 6900HX 3.3GHz
Radeon 680M
min:
43.1 fps, P1:
48.2 fps, max:
72 fps
54.2 [X] Aoostar GOD77 1.47.22.14 D3D12
AMD Ryzen 7 7735HS 3.2GHz
Radeon 680M
min:
43.3 fps, P1:
47.6 fps, max:
83.8 fps
54.3 54.4 54.7 54.7 55.2 55.3 55.8 56 [X] GMK NucBox K2 1.47.22.14 D3D12
AMD Ryzen 7 7735HS 3.2GHz
Radeon 680M
min:
46.4 fps, P1:
49.2 fps, max:
71.6 fps
56.4 56.4 [X] ACEMagician Ace Magician AM08 Pro 1.47.22.14 D3D12
AMD Ryzen 9 6900HX 3.3GHz
Radeon 680M
min:
27.7 fps, P1:
30 fps, max:
75.1 fps
56.7 [X] One Netbook XPlayer 2 1.47.22.14 D3D12
AMD Ryzen 7 6800U 2.7GHz
Radeon 680M
min:
45.2 fps, P1:
47.9 fps, max:
78.2 fps
57 [X] Asus ROG Zephyrus G14 AMD Ryzen 9 6900HS 3.3GHz
Radeon 680M
57.4 [X] Beelink GTR6 1.47.22.14 D3D12
AMD Ryzen 9 6900HX 3.3GHz
Radeon 680M
min:
43.4 fps, P1:
51 fps, max:
83.4 fps
57.5 [X] GPD Win 4 1.47.22.14 D3D12
AMD Ryzen 7 6800U 2.7GHz
Radeon 680M
min:
44.8 fps, P1:
50.9 fps, max:
79.2 fps
57.7 [X] HP Dragonfly Pro 2023 1.47.22.14 D3D12
AMD Ryzen 7 7736U 2.7GHz
Radeon 680M
min:
33.3 fps, P1:
50.4 fps, max:
159.7 fps
57.8 [X] Beelink SER6 Pro 1.47.22.14 D3D12
AMD Ryzen 7 6800H 3.2GHz
Radeon 680M
min:
43.1 fps, P1:
50.8 fps, max:
82.9 fps
57.8 58 58.4 59 59.7 [X] Aoostar GEM10 1.47.22.14 D3D12
AMD Ryzen 7 6800H 3.2GHz
Radeon 680M
min:
48.3 fps, P1:
52.5 fps, max:
85.4 fps
60.5 [X] Acemagic AM20 1.47.22.14 D3D12
AMD Ryzen 7 7735H 3.2GHz
Radeon 680M
min:
41.9 fps, P1:
54.2 fps, max:
86.2 fps
61.7 [X] Aokzoe A1 1.47.22.14 D3D12
AMD Ryzen 7 6800U 2.7GHz
Radeon 680M
min:
40.8 fps, P1:
54.1 fps, max:
95.7 fps
63 ~ 54 fps
100%
Radeon 680M:
25.3 [X] HP EliteBook 865 G9 1.47.22.14 D3D12
AMD Ryzen 7 PRO 6850U 2.7GHz
Radeon 680M
min:
15.7 fps, P1:
19.4 fps, max:
80.5 fps
26.4 26.7 [X] Maxtang MTN-FP750 1.47.22.14 D3D12
AMD Ryzen 7 7735HS 3.2GHz
Radeon 680M
min:
16.9 fps, P1:
20.7 fps, max:
76.6 fps
39.4 39.9 40.9 [X] HP EliteBook 835 G9 1.47.22.14 D3D12
AMD Ryzen 7 PRO 6850U 2.7GHz
Radeon 680M
min:
7.7 fps, P1:
28.8 fps, max:
290 fps
41.8 [X] ACEMagician Ace Magician AM08 Pro 1.47.22.14 D3D12
AMD Ryzen 9 6900HX 3.3GHz
Radeon 680M
min:
21.5 fps, P1:
22.2 fps, max:
64.4 fps
43.2 [X] ACEMagician Ace Magician AM08 Pro 1.47.22.14 D3D12
AMD Ryzen 9 6900HX 3.3GHz
Radeon 680M
min:
21 fps, P1:
23.2 fps, max:
69.6 fps
44.8 44.9 45 [X] Aoostar GOD77 1.47.22.14 D3D12
AMD Ryzen 7 7735HS 3.2GHz
Radeon 680M
min:
34.5 fps, P1:
35.8 fps, max:
86.5 fps
45.1 45.4 45.9 [X] GMK NucBox K2 1.47.22.14 D3D12
AMD Ryzen 7 7735HS 3.2GHz
Radeon 680M
min:
25.6 fps, P1:
35.7 fps, max:
140.8 fps
46 46.5 46.6 46.8 47 [X] One Netbook XPlayer 2 1.47.22.14 D3D12
AMD Ryzen 7 6800U 2.7GHz
Radeon 680M
min:
35.1 fps, P1:
37.5 fps, max:
71.5 fps
47.1 47.8 [X] GPD Win 4 1.47.22.14 D3D12
AMD Ryzen 7 6800U 2.7GHz
Radeon 680M
min:
34.2 fps, P1:
37.7 fps, max:
65.9 fps
47.9 48 [X] Asus ROG Zephyrus G14 AMD Ryzen 9 6900HS 3.3GHz
Radeon 680M
48 48.1 48.5 [X] Beelink GTR6 1.47.22.14 D3D12
AMD Ryzen 9 6900HX 3.3GHz
Radeon 680M
min:
35.1 fps, P1:
38.2 fps, max:
66 fps
48.6 [X] Beelink SER6 Pro 1.47.22.14 D3D12
AMD Ryzen 7 6800H 3.2GHz
Radeon 680M
min:
34.2 fps, P1:
38.3 fps, max:
86.4 fps
49.1 49.5 [X] Acemagic AM20 1.47.22.14 D3D12
AMD Ryzen 7 7735H 3.2GHz
Radeon 680M
min:
29.9 fps, P1:
38 fps, max:
105.8 fps
50 [X] Aoostar GEM10 1.47.22.14 D3D12
AMD Ryzen 7 6800H 3.2GHz
Radeon 680M
min:
20.4 fps, P1:
38.8 fps, max:
191 fps
50.6 [X] Aokzoe A1 1.47.22.14 D3D12
AMD Ryzen 7 6800U 2.7GHz
Radeon 680M
min:
31 fps, P1:
39.2 fps, max:
80.4 fps
53.1 ~ 44 fps
100%
Radeon 680M:
22 [X] HP EliteBook 865 G9 1.47.22.14 D3D12
AMD Ryzen 7 PRO 6850U 2.7GHz
Radeon 680M
min:
14 fps, P1:
15.9 fps, max:
43.9 fps
22.6 23.1 [X] Maxtang MTN-FP750 1.47.22.14 D3D12
AMD Ryzen 7 7735HS 3.2GHz
Radeon 680M
min:
5.3 fps, P1:
7.5 fps, max:
262 fps
33.2 [X] ACEMagician Ace Magician AM08 Pro 1.47.22.14 D3D12
AMD Ryzen 9 6900HX 3.3GHz
Radeon 680M
min:
18.2 fps, P1:
19.5 fps, max:
84 fps
34.1 34.1 [X] ACEMagician Ace Magician AM08 Pro 1.47.22.14 D3D12
AMD Ryzen 9 6900HX 3.3GHz
Radeon 680M
min:
17.7 fps, P1:
19.4 fps, max:
59.3 fps
34.2 34.3 [X] HP EliteBook 835 G9 1.47.22.14 D3D12
AMD Ryzen 7 PRO 6850U 2.7GHz
Radeon 680M
min:
6.5 fps, P1:
8.29 fps, max:
298 fps
36.4 38.3 38.9 39.1 [X] Aoostar GOD77 1.47.22.14 D3D12
AMD Ryzen 7 7735HS 3.2GHz
Radeon 680M
min:
19 fps, P1:
24.6 fps, max:
169.6 fps
39.2 39.9 40.1 40.2 40.4 40.7 40.9 [X] One Netbook XPlayer 2 1.47.22.14 D3D12
AMD Ryzen 7 6800U 2.7GHz
Radeon 680M
min:
31.9 fps, P1:
32.9 fps, max:
56.5 fps
41 [X] Asus ROG Zephyrus G14 AMD Ryzen 9 6900HS 3.3GHz
Radeon 680M
41 41.3 41.5 [X] GPD Win 4 1.47.22.14 D3D12
AMD Ryzen 7 6800U 2.7GHz
Radeon 680M
min:
29 fps, P1:
31.8 fps, max:
63.3 fps
41.6 [X] Beelink GTR6 1.47.22.14 D3D12
AMD Ryzen 9 6900HX 3.3GHz
Radeon 680M
min:
26.5 fps, P1:
33 fps, max:
91.3 fps
41.8 41.9 [X] Beelink SER6 Pro 1.47.22.14 D3D12
AMD Ryzen 7 6800H 3.2GHz
Radeon 680M
min:
32.6 fps, P1:
33.4 fps, max:
69.2 fps
42.5 [X] GMK NucBox K2 1.47.22.14 D3D12
AMD Ryzen 7 7735HS 3.2GHz
Radeon 680M
min:
15.8 fps, P1:
22.3 fps, max:
206 fps
42.5 [X] Acemagic AM20 1.47.22.14 D3D12
AMD Ryzen 7 7735H 3.2GHz
Radeon 680M
min:
28.1 fps, P1:
30.2 fps, max:
102.4 fps
42.7 43 [X] Aoostar GEM10 1.47.22.14 D3D12
AMD Ryzen 7 6800H 3.2GHz
Radeon 680M
min:
20 fps, P1:
25.4 fps, max:
179.3 fps
43.4 [X] Aokzoe A1 1.47.22.14 D3D12
AMD Ryzen 7 6800U 2.7GHz
Radeon 680M
min:
18.1 fps, P1:
25.6 fps, max:
83.5 fps
44.2 ~ 38 fps
100%
Radeon 680M:
14.4 fps
GeForce GTX 1660 Ti Max-Q:
66.9 fps
GeForce GTX 1660 Ti Max-Q:
59.3 fps
GeForce GTX 1660 Ti Max-Q:
59.5 fps
GeForce GTX 1660 Ti Max-Q:
50.8 fps
100%
Radeon 680M:
37 39 41 46 53 [X] ACEMagician Ace Magician AM08 Pro AMD Ryzen 9 6900HX 3.3GHz
Radeon 680M
min:
45 fps, max:
61 fps
55 56 57 58 59 60 62 [X] Aokzoe A1 AMD Ryzen 7 6800U 2.7GHz
Radeon 680M
min:
51 fps, max:
72 fps
66 67 67 68 69 70 71 72 [X] ACEMagician Ace Magician AM08 Pro AMD Ryzen 9 6900HX 3.3GHz
Radeon 680M
min:
65 fps, max:
82 fps
72 [X] Aoostar GEM10 AMD Ryzen 7 6800H 3.2GHz
Radeon 680M
min:
63 fps, max:
87 fps
73 75 77 82 [X] Asus ROG Zephyrus G14 AMD Ryzen 9 6900HS 3.3GHz
Radeon 680M
min:
71 fps
~ 62 fps
139%
GeForce GTX 1660 Ti Max-Q:
68 103 ~ 86 fps
100%
Radeon 680M:
21 23 25 [X] ACEMagician Ace Magician AM08 Pro AMD Ryzen 9 6900HX 3.3GHz
Radeon 680M
min:
17 fps, max:
41 fps
25 26 33 33 34 36 36 38 38 38 [X] Aokzoe A1 AMD Ryzen 7 6800U 2.7GHz
Radeon 680M
min:
17 fps, max:
47 fps
39 41 41 41 41 41 43 43 43 [X] ACEMagician Ace Magician AM08 Pro AMD Ryzen 9 6900HX 3.3GHz
Radeon 680M
min:
36 fps, max:
49 fps
44 [X] Aoostar GEM10 AMD Ryzen 7 6800H 3.2GHz
Radeon 680M
min:
39 fps, max:
53 fps
45 [X] Asus ROG Zephyrus G14 AMD Ryzen 9 6900HS 3.3GHz
Radeon 680M
min:
39 fps
45 ~ 37 fps
186%
GeForce GTX 1660 Ti Max-Q:
54 84 ~ 69 fps
100%
Radeon 680M:
18 21 22 24 26 [X] ACEMagician Ace Magician AM08 Pro AMD Ryzen 9 6900HX 3.3GHz
Radeon 680M
min:
22 fps, max:
35 fps
30 31 31 33 34 34 35 35 [X] Aokzoe A1 AMD Ryzen 7 6800U 2.7GHz
Radeon 680M
min:
21 fps, max:
43 fps
35 36 37 [X] ACEMagician Ace Magician AM08 Pro AMD Ryzen 9 6900HX 3.3GHz
Radeon 680M
min:
27 fps, max:
47 fps
38 38 38 38 38 [X] Aoostar GEM10 AMD Ryzen 7 6800H 3.2GHz
Radeon 680M
min:
31 fps, max:
44 fps
39 40 41 [X] Asus ROG Zephyrus G14 AMD Ryzen 9 6900HS 3.3GHz
Radeon 680M
min:
36 fps
41 ~ 33 fps
200%
GeForce GTX 1660 Ti Max-Q:
53 79 ~ 66 fps
100%
Radeon 680M:
20 21 23 24 [X] ACEMagician Ace Magician AM08 Pro AMD Ryzen 9 6900HX 3.3GHz
Radeon 680M
min:
18 fps, max:
32 fps
28 28 29 31 31 [X] ACEMagician Ace Magician AM08 Pro AMD Ryzen 9 6900HX 3.3GHz
Radeon 680M
min:
22 fps, max:
43 fps
32 33 33 [X] Aoostar GEM10 AMD Ryzen 7 6800H 3.2GHz
Radeon 680M
min:
29 fps, max:
42 fps
34 [X] Aokzoe A1 AMD Ryzen 7 6800U 2.7GHz
Radeon 680M
min:
28 fps, max:
41 fps
34 35 36 36 36 36 36 37 38 39 [X] Asus ROG Zephyrus G14 AMD Ryzen 9 6900HS 3.3GHz
Radeon 680M
min:
34 fps
40 ~ 32 fps
194%
GeForce GTX 1660 Ti Max-Q:
50 74 ~ 62 fps
GeForce GTX 1660 Ti Max-Q:
30 fps
GeForce GTX 1660 Ti Max-Q:
376.8 fps
GeForce GTX 1660 Ti Max-Q:
215.9 fps
GeForce GTX 1660 Ti Max-Q:
117.3 fps
100%
Radeon 680M:
26.3 [X] Lenovo ThinkPad T16 G1 21CHCTO1WW AMD Ryzen 7 PRO 6850U 2.7GHz
Radeon 680M
35.9 [X] Geekom AS 6, R7 6800H AMD Ryzen 7 6800H 3.2GHz
Radeon 680M
~ 31 fps
GeForce GTX 1660 Ti Max-Q:
125.6 fps
GeForce GTX 1660 Ti Max-Q:
91.7 fps
GeForce GTX 1660 Ti Max-Q:
77.3 fps
GeForce GTX 1660 Ti Max-Q:
53.7 fps
227%
GeForce GTX 1660 Ti Max-Q:
44.9 50 54.6 ~ 50 fps
GeForce GTX 1660 Ti Max-Q:
138 fps
GeForce GTX 1660 Ti Max-Q:
92.2 fps
GeForce GTX 1660 Ti Max-Q:
89.5 fps
GeForce GTX 1660 Ti Max-Q:
78.6 fps
GeForce GTX 1660 Ti Max-Q:
91 fps
GeForce GTX 1660 Ti Max-Q:
82 fps
GeForce GTX 1660 Ti Max-Q:
72 fps
GeForce GTX 1660 Ti Max-Q:
61 fps
GeForce GTX 1660 Ti Max-Q:
130.4 fps
GeForce GTX 1660 Ti Max-Q:
78.1 fps
GeForce GTX 1660 Ti Max-Q:
72.4 fps
GeForce GTX 1660 Ti Max-Q:
41.5 fps
GeForce GTX 1660 Ti Max-Q:
193.7 fps
GeForce GTX 1660 Ti Max-Q:
140.7 fps
GeForce GTX 1660 Ti Max-Q:
116 fps
GeForce GTX 1660 Ti Max-Q:
42.4 fps
GeForce GTX 1660 Ti Max-Q:
40.7 fps
GeForce GTX 1660 Ti Max-Q:
93.7 fps
GeForce GTX 1660 Ti Max-Q:
72.7 fps
GeForce GTX 1660 Ti Max-Q:
64.5 fps
GeForce GTX 1660 Ti Max-Q:
232.8 fps
GeForce GTX 1660 Ti Max-Q:
200.1 fps
GeForce GTX 1660 Ti Max-Q:
163.6 fps
GeForce GTX 1660 Ti Max-Q:
148.8 fps
GeForce GTX 1660 Ti Max-Q:
60 fps
GeForce GTX 1660 Ti Max-Q:
60 fps
GeForce GTX 1660 Ti Max-Q:
60 fps
100%
Radeon 680M:
34.4 [X] Lenovo ThinkPad T16 G1 21CHCTO1WW AMD Ryzen 7 PRO 6850U 2.7GHz
Radeon 680M
min:
33 fps, max:
-1 fps
37.2 62.4 90.2 93.7 107.7 108.3 [X] Aokzoe A1 AMD Ryzen 7 6800U 2.7GHz
Radeon 680M
min:
95.6 fps, max:
-1 fps
108.9 109.1 110.2 110.3 [X] Asus ZenBook 13 OLED UM5302T AMD Ryzen 7 6800U 2.7GHz
Radeon 680M
min:
94.8 fps, max:
-1 fps
110.5 111.2 111.4 112.9 113.1 [X] Geekom AS 6, R7 6800H AMD Ryzen 7 6800H 3.2GHz
Radeon 680M
min:
94 fps, max:
-1 fps
114.6 115.8 116.5 118.8 119.9 120.2 [X] GPD Win 4 AMD Ryzen 7 6800U 2.7GHz
Radeon 680M
min:
104.3 fps, max:
-1 fps
124 [X] Aoostar GEM10 AMD Ryzen 7 6800H 3.2GHz
Radeon 680M
min:
8.9 fps, max:
-1 fps
125.7 [X] Acemagic AM20 AMD Ryzen 7 7735H 3.2GHz
Radeon 680M
min:
106.9 fps, max:
-1 fps
132.9 [X] ACEMagician Ace Magician AM08 Pro AMD Ryzen 9 6900HX 3.3GHz
Radeon 680M
min:
110 fps, max:
-1 fps
133.4 136.8 137.9 [X] ACEMagician Ace Magician AM08 Pro AMD Ryzen 9 6900HX 3.3GHz
Radeon 680M
min:
122.9 fps, max:
-1 fps
140.9 [X] Aoostar GOD77 AMD Ryzen 7 7735HS 3.2GHz
Radeon 680M
min:
120.9 fps, max:
-1 fps
141.2 [X] GMK NucBox K2 AMD Ryzen 7 7735HS 3.2GHz
Radeon 680M
min:
122.4 fps, max:
-1 fps
141.9 [X] Beelink GTR6 AMD Ryzen 9 6900HX 3.3GHz
Radeon 680M
min:
121.4 fps, max:
-1 fps
142.2 143 143.3 ~ 114 fps
95%
GeForce GTX 1660 Ti Max-Q:
93.3 113 119 ~ 108 fps
100%
Radeon 680M:
33.3 [X] Lenovo ThinkPad T16 G1 21CHCTO1WW AMD Ryzen 7 PRO 6850U 2.7GHz
Radeon 680M
min:
31.8 fps, max:
-1 fps
36.7 57.3 82.5 83.5 84.7 86.7 87.4 89.6 [X] Geekom AS 6, R7 6800H AMD Ryzen 7 6800H 3.2GHz
Radeon 680M
min:
75.6 fps, max:
-1 fps
90.4 91.4 91.8 93.6 [X] Asus ZenBook 13 OLED UM5302T AMD Ryzen 7 6800U 2.7GHz
Radeon 680M
min:
77.6 fps, max:
-1 fps
96 96.3 [X] Aokzoe A1 AMD Ryzen 7 6800U 2.7GHz
Radeon 680M
min:
83.8 fps, max:
-1 fps
96.9 97.2 97.6 98 100.1 [X] GPD Win 4 AMD Ryzen 7 6800U 2.7GHz
Radeon 680M
min:
86.2 fps, max:
-1 fps
101.7 102.8 104 [X] Aoostar GEM10 AMD Ryzen 7 6800H 3.2GHz
Radeon 680M
min:
89 fps, max:
-1 fps
104.5 104.7 [X] ACEMagician Ace Magician AM08 Pro AMD Ryzen 9 6900HX 3.3GHz
Radeon 680M
min:
88.3 fps, max:
-1 fps
110.4 111.3 [X] ACEMagician Ace Magician AM08 Pro AMD Ryzen 9 6900HX 3.3GHz
Radeon 680M
min:
96.8 fps, max:
-1 fps
112.7 [X] Beelink GTR6 AMD Ryzen 9 6900HX 3.3GHz
Radeon 680M
min:
95 fps, max:
-1 fps
113.4 113.5 113.5 [X] GMK NucBox K2 AMD Ryzen 7 7735HS 3.2GHz
Radeon 680M
min:
96.1 fps, max:
-1 fps
114.6 115.1 [X] Aoostar GOD77 AMD Ryzen 7 7735HS 3.2GHz
Radeon 680M
min:
100.7 fps, max:
-1 fps
121.4 ~ 95 fps
100%
Radeon 680M:
33.2 [X] Lenovo ThinkPad T16 G1 21CHCTO1WW AMD Ryzen 7 PRO 6850U 2.7GHz
Radeon 680M
min:
31.8 fps, max:
-1 fps
36.2 44.8 54.9 55 60.5 66.3 66.8 [X] Geekom AS 6, R7 6800H AMD Ryzen 7 6800H 3.2GHz
Radeon 680M
min:
56.9 fps, max:
-1 fps
67.4 69.2 69.6 69.7 69.8 [X] Asus ZenBook 13 OLED UM5302T AMD Ryzen 7 6800U 2.7GHz
Radeon 680M
min:
59.9 fps, max:
-1 fps
71.7 72.2 72.3 72.8 73 [X] Aokzoe A1 AMD Ryzen 7 6800U 2.7GHz
Radeon 680M
min:
67.5 fps, max:
-1 fps
73.3 [X] ACEMagician Ace Magician AM08 Pro AMD Ryzen 9 6900HX 3.3GHz
Radeon 680M
min:
63.4 fps, max:
-1 fps
74 76.4 [X] GPD Win 4 AMD Ryzen 7 6800U 2.7GHz
Radeon 680M
min:
67.4 fps, max:
-1 fps
76.6 78.6 [X] ACEMagician Ace Magician AM08 Pro AMD Ryzen 9 6900HX 3.3GHz
Radeon 680M
min:
69 fps, max:
-1 fps
79.5 80.9 [X] Beelink GTR6 AMD Ryzen 9 6900HX 3.3GHz
Radeon 680M
min:
71.6 fps, max:
-1 fps
81.3 81.6 [X] Aoostar GEM10 AMD Ryzen 7 6800H 3.2GHz
Radeon 680M
min:
72.3 fps, max:
-1 fps
82.2 83.9 84.2 [X] GMK NucBox K2 AMD Ryzen 7 7735HS 3.2GHz
Radeon 680M
min:
74.4 fps, max:
-1 fps
84.3 85.3 89.1 89.1 [X] Aoostar GOD77 AMD Ryzen 7 7735HS 3.2GHz
Radeon 680M
min:
81.8 fps, max:
-1 fps
~ 71 fps
100%
Radeon 680M:
33.2 [X] Lenovo ThinkPad T16 G1 21CHCTO1WW AMD Ryzen 7 PRO 6850U 2.7GHz
Radeon 680M
min:
31.8 fps, max:
-1 fps
36 42 47.4 48 53.1 56.6 57.7 [X] Asus ZenBook 13 OLED UM5302T AMD Ryzen 7 6800U 2.7GHz
Radeon 680M
min:
50 fps, max:
-1 fps
57.8 60.2 [X] Geekom AS 6, R7 6800H AMD Ryzen 7 6800H 3.2GHz
Radeon 680M
min:
51.5 fps, max:
-1 fps
60.5 60.6 61 62.2 62.7 63.1 63.1 64.2 65 [X] ACEMagician Ace Magician AM08 Pro AMD Ryzen 9 6900HX 3.3GHz
Radeon 680M
min:
57.1 fps, max:
-1 fps
65.7 67.2 [X] GPD Win 4 AMD Ryzen 7 6800U 2.7GHz
Radeon 680M
min:
58.9 fps, max:
-1 fps
69.2 69.7 [X] Aokzoe A1 AMD Ryzen 7 6800U 2.7GHz
Radeon 680M
min:
64 fps, max:
-1 fps
70.2 [X] ACEMagician Ace Magician AM08 Pro AMD Ryzen 9 6900HX 3.3GHz
Radeon 680M
min:
62 fps, max:
-1 fps
70.2 [X] Aoostar GEM10 AMD Ryzen 7 6800H 3.2GHz
Radeon 680M
min:
61.6 fps, max:
-1 fps
70.9 71.4 [X] Beelink GTR6 AMD Ryzen 9 6900HX 3.3GHz
Radeon 680M
min:
62.3 fps, max:
-1 fps
71.8 72.8 73.1 73.6 73.7 [X] GMK NucBox K2 AMD Ryzen 7 7735HS 3.2GHz
Radeon 680M
min:
65.4 fps, max:
-1 fps
75.2 84.9 [X] Aoostar GOD77 AMD Ryzen 7 7735HS 3.2GHz
Radeon 680M
min:
77.4 fps, max:
-1 fps
~ 63 fps
100%
Radeon 680M:
9.8 9.8 [X] Geekom AS 6, R7 6800H AMD Ryzen 7 6800H 3.2GHz
Radeon 680M
min:
6.6 fps, max:
-1 fps
26.5 [X] Lenovo ThinkPad T16 G1 21CHCTO1WW AMD Ryzen 7 PRO 6850U 2.7GHz
Radeon 680M
min:
25.1 fps, max:
-1 fps
~ 15 fps
GeForce GTX 1660 Ti Max-Q:
89 fps
GeForce GTX 1660 Ti Max-Q:
69 fps
GeForce GTX 1660 Ti Max-Q:
51 fps
100%
Radeon 680M:
67.4 73 [X] Maxtang MTN-FP750 AMD Ryzen 7 7735HS 3.2GHz
Radeon 680M
min:
13.3 fps, P0.1:
24.8 fps, P1:
40.9 fps, max:
306 fps
74 94.2 [X] ACEMagician Ace Magician AM08 Pro AMD Ryzen 9 6900HX 3.3GHz
Radeon 680M
94.3 [X] GPD Win 4 AMD Ryzen 7 6800U 2.7GHz
Radeon 680M
min:
68 fps, max:
104 fps
97.3 [X] ACEMagician Ace Magician AM08 Pro AMD Ryzen 9 6900HX 3.3GHz
Radeon 680M
104.3 107.7 108 [X] HP EliteBook 835 G9 AMD Ryzen 7 PRO 6850U 2.7GHz
Radeon 680M
min:
10.3 fps, P0.1:
32.8 fps, P1:
68.8 fps, max:
195.9 fps
108.2 [X] Aokzoe A1 AMD Ryzen 7 6800U 2.7GHz
Radeon 680M
min:
66 fps, max:
133 fps
111.1 113.9 115.6 116.4 [X] Acemagic AM20 AMD Ryzen 7 7735H 3.2GHz
Radeon 680M
min:
10.1 fps, P0.1:
21.9 fps, P1:
75.6 fps, max:
321 fps
117 119.3 [X] Aoostar GOD77 AMD Ryzen 7 7735HS 3.2GHz
Radeon 680M
min:
5.54 fps, P0.1:
30 fps, P1:
77.7 fps, max:
421 fps
119.6 [X] Aoostar GEM10 AMD Ryzen 7 6800H 3.2GHz
Radeon 680M
min:
6.3 fps, P0.1:
25 fps, P1:
75.7 fps, max:
314 fps
119.7 121.6 123 125 126 130.7 131 131.8 132.8 133 [X] Asus ROG Zephyrus G14 AMD Ryzen 9 6900HS 3.3GHz
Radeon 680M
min:
114 fps
138.1 139.2 [X] Beelink GTR6 AMD Ryzen 9 6900HX 3.3GHz
Radeon 680M
min:
119 fps, max:
149 fps
150 ~ 115 fps
100%
Radeon 680M:
44.5 46.7 [X] Maxtang MTN-FP750 AMD Ryzen 7 7735HS 3.2GHz
Radeon 680M
min:
8.69 fps, P0.1:
18.5 fps, P1:
37 fps, max:
106.1 fps
47.2 [X] ACEMagician Ace Magician AM08 Pro AMD Ryzen 9 6900HX 3.3GHz
Radeon 680M
47.7 51.4 [X] Acemagic AM20 AMD Ryzen 7 7735H 3.2GHz
Radeon 680M
min:
16.6 fps, P0.1:
27.5 fps, P1:
43.3 fps, max:
149.4 fps
58.5 [X] ACEMagician Ace Magician AM08 Pro AMD Ryzen 9 6900HX 3.3GHz
Radeon 680M
63.8 [X] GPD Win 4 AMD Ryzen 7 6800U 2.7GHz
Radeon 680M
min:
51 fps, max:
71 fps
65.8 66 [X] HP EliteBook 835 G9 AMD Ryzen 7 PRO 6850U 2.7GHz
Radeon 680M
min:
20.2 fps, P0.1:
26.3 fps, P1:
44.8 fps, max:
162.7 fps
72.7 75.9 76 76.6 [X] Aoostar GOD77 AMD Ryzen 7 7735HS 3.2GHz
Radeon 680M
min:
20.1 fps, P0.1:
52.2 fps, P1:
62.8 fps, max:
181.9 fps
77 78 79 79.8 81.4 82.9 84 [X] Beelink GTR6 AMD Ryzen 9 6900HX 3.3GHz
Radeon 680M
min:
77 fps, max:
90 fps
85 [X] Asus ROG Zephyrus G14 AMD Ryzen 9 6900HS 3.3GHz
Radeon 680M
min:
76 fps
85.1 85.3 [X] Aoostar GEM10 AMD Ryzen 7 6800H 3.2GHz
Radeon 680M
min:
27.9 fps, P0.1:
47.1 fps, P1:
65.3 fps, max:
160 fps
~ 70 fps
100%
Radeon 680M:
22.3 23 23.7 [X] Maxtang MTN-FP750 AMD Ryzen 7 7735HS 3.2GHz
Radeon 680M
min:
12.8 fps, P0.1:
13.7 fps, P1:
19 fps, max:
78.4 fps
24.2 [X] ACEMagician Ace Magician AM08 Pro AMD Ryzen 9 6900HX 3.3GHz
Radeon 680M
29.3 [X] ACEMagician Ace Magician AM08 Pro AMD Ryzen 9 6900HX 3.3GHz
Radeon 680M
32.1 32.7 33 35.1 [X] HP EliteBook 835 G9 AMD Ryzen 7 PRO 6850U 2.7GHz
Radeon 680M
min:
12.8 fps, P0.1:
15.6 fps, P1:
25.4 fps, max:
117.8 fps
36 36.3 [X] Aoostar GOD77 AMD Ryzen 7 7735HS 3.2GHz
Radeon 680M
min:
14.7 fps, P0.1:
17.9 fps, P1:
30.9 fps, max:
146.6 fps
37.5 [X] GPD Win 4 AMD Ryzen 7 6800U 2.7GHz
Radeon 680M
min:
30 fps, max:
42 fps
37.9 39.3 39.4 40 40 40.1 [X] Aokzoe A1 AMD Ryzen 7 6800U 2.7GHz
Radeon 680M
min:
21 fps, max:
45 fps
40.2 [X] Acemagic AM20 AMD Ryzen 7 7735H 3.2GHz
Radeon 680M
min:
12.2 fps, P0.1:
17.8 fps, P1:
30.7 fps, max:
143.9 fps
40.5 41 41 41.2 [X] Asus ROG Zephyrus G14 AMD Ryzen 9 6900HS 3.3GHz
Radeon 680M
min:
34 fps
41.3 41.7 [X] Aoostar GEM10 AMD Ryzen 7 6800H 3.2GHz
Radeon 680M
min:
8.33 fps, P0.1:
17.3 fps, P1:
31.2 fps, max:
149.6 fps
42.4 42.6 42.6 43 43.3 46 [X] Beelink GTR6 AMD Ryzen 9 6900HX 3.3GHz
Radeon 680M
min:
41 fps, max:
51 fps
48 ~ 37 fps
100%
Radeon 680M:
14.3 14.6 14.9 [X] Maxtang MTN-FP750 AMD Ryzen 7 7735HS 3.2GHz
Radeon 680M
min:
9.2 fps, P0.1:
9.5 fps, P1:
12.3 fps, max:
28.8 fps
15.6 [X] ACEMagician Ace Magician AM08 Pro AMD Ryzen 9 6900HX 3.3GHz
Radeon 680M
18.3 19.9 [X] ACEMagician Ace Magician AM08 Pro AMD Ryzen 9 6900HX 3.3GHz
Radeon 680M
20.1 20.3 22 [X] HP EliteBook 835 G9 AMD Ryzen 7 PRO 6850U 2.7GHz
Radeon 680M
min:
11 fps, P0.1:
12.3 fps, P1:
16 fps, max:
62.9 fps
22.7 22.7 [X] Aoostar GOD77 AMD Ryzen 7 7735HS 3.2GHz
Radeon 680M
min:
14.2 fps, P0.1:
14.3 fps, P1:
14.6 fps, max:
45.2 fps
22.8 [X] GPD Win 4 AMD Ryzen 7 6800U 2.7GHz
Radeon 680M
min:
21 fps, max:
25 fps
23 23.1 23.5 23.9 24 24.5 24.5 [X] Aokzoe A1 AMD Ryzen 7 6800U 2.7GHz
Radeon 680M
min:
23 fps, max:
27 fps
24.8 25 25.2 25.4 25.5 [X] Asus ROG Zephyrus G14 AMD Ryzen 9 6900HS 3.3GHz
Radeon 680M
min:
21 fps
25.8 26.3 [X] Acemagic AM20 AMD Ryzen 7 7735H 3.2GHz
Radeon 680M
min:
13.4 fps, P0.1:
14.2 fps, P1:
16.7 fps, max:
70.2 fps
26.8 27 27 27.1 [X] Beelink GTR6 AMD Ryzen 9 6900HX 3.3GHz
Radeon 680M
min:
24 fps, max:
30 fps
27.1 27.1 [X] Aoostar GEM10 AMD Ryzen 7 6800H 3.2GHz
Radeon 680M
min:
13.6 fps, P0.1:
15.7 fps, P1:
17.4 fps, max:
113.7 fps
~ 23 fps
100%
Radeon 680M:
16.7 fps
100%
Radeon 680M:
12.8 fps
241%
GeForce GTX 1660 Ti Max-Q:
30.9 fps
100%
Radeon 680M:
67.7 87.7 95.5 106.6 122.2 123.2 125.5 131.1 131.3 133.6 136.1 136.6 [X] Aokzoe A1 AMD Ryzen 7 6800U 2.7GHz
Radeon 680M
min:
16.8 fps, P1:
90.9 fps, max:
256 fps
136.9 138.5 138.6 140.3 [X] GPD Win 4 AMD Ryzen 7 6800U 2.7GHz
Radeon 680M
min:
7.08 fps, P1:
83.3 fps, max:
273 fps
142.8 [X] ACEMagician Ace Magician AM08 Pro AMD Ryzen 9 6900HX 3.3GHz
Radeon 680M
min:
1.614 fps, P1:
83.3 fps, max:
324 fps
144.2 [X] Acemagic AM20 AMD Ryzen 7 7735H 3.2GHz
Radeon 680M
min:
9.88 fps, P1:
90.9 fps, max:
272 fps
145.3 [X] Aoostar GEM10 AMD Ryzen 7 6800H 3.2GHz
Radeon 680M
min:
5.31 fps, P1:
100 fps, max:
264 fps
145.8 147.3 [X] Aoostar GOD77 AMD Ryzen 7 7735HS 3.2GHz
Radeon 680M
min:
5.71 fps, P1:
100 fps, max:
281 fps
147.5 149.3 151.6 [X] ACEMagician Ace Magician AM08 Pro AMD Ryzen 9 6900HX 3.3GHz
Radeon 680M
min:
5.47 fps, P1:
100 fps, max:
305 fps
152.1 152.3 [X] Beelink SER6 Pro AMD Ryzen 7 6800H 3.2GHz
Radeon 680M
min:
4.42 fps, P1:
100 fps, max:
264 fps
152.3 [X] GMK NucBox K2 AMD Ryzen 7 7735HS 3.2GHz
Radeon 680M
min:
5.63 fps, P1:
100 fps, max:
317 fps
152.6 [X] Beelink GTR6 AMD Ryzen 9 6900HX 3.3GHz
Radeon 680M
min:
4.69 fps, P1:
100 fps, max:
362 fps
155.4 ~ 134 fps
120%
GeForce GTX 1660 Ti Max-Q:
161.3 fps
100%
Radeon 680M:
60.7 61.7 78.3 85.7 108.3 110.2 115.4 116.4 119.6 119.7 120.1 120.4 122.7 127.6 [X] GPD Win 4 AMD Ryzen 7 6800U 2.7GHz
Radeon 680M
min:
6.6 fps, P1:
76.9 fps, max:
231 fps
130.4 [X] ACEMagician Ace Magician AM08 Pro AMD Ryzen 9 6900HX 3.3GHz
Radeon 680M
min:
6.94 fps, P1:
76.9 fps, max:
233 fps
130.5 [X] Acemagic AM20 AMD Ryzen 7 7735H 3.2GHz
Radeon 680M
min:
10.5 fps, P1:
83.3 fps, max:
232 fps
131.4 [X] Aoostar GEM10 AMD Ryzen 7 6800H 3.2GHz
Radeon 680M
min:
16.8 fps, P1:
83.3 fps, max:
271 fps
134.5 [X] Aoostar GOD77 AMD Ryzen 7 7735HS 3.2GHz
Radeon 680M
min:
8.19 fps, P1:
90.9 fps, max:
264 fps
136.8 138 [X] Beelink GTR6 AMD Ryzen 9 6900HX 3.3GHz
Radeon 680M
min:
28 fps, P1:
90.9 fps, max:
262 fps
138.1 139.1 [X] ACEMagician Ace Magician AM08 Pro AMD Ryzen 9 6900HX 3.3GHz
Radeon 680M
min:
4.42 fps, P1:
90.9 fps, max:
277 fps
139.1 [X] GMK NucBox K2 AMD Ryzen 7 7735HS 3.2GHz
Radeon 680M
min:
7.31 fps, P1:
90.9 fps, max:
260 fps
139.7 [X] Beelink SER6 Pro AMD Ryzen 7 6800H 3.2GHz
Radeon 680M
min:
5.95 fps, P1:
90.9 fps, max:
270 fps
140.4 143.9 ~ 120 fps
126%
GeForce GTX 1660 Ti Max-Q:
151.5 fps
100%
Radeon 680M:
25.9 28.2 [X] Maxtang MTN-FP750 AMD Ryzen 7 7735HS 3.2GHz
Radeon 680M
min:
4.09 fps, P1:
18.5 fps, max:
77.9 fps
34 44.1 44.2 46.4 [X] ACEMagician Ace Magician AM08 Pro AMD Ryzen 9 6900HX 3.3GHz
Radeon 680M
min:
1.402 fps, P1:
22.7 fps, max:
219 fps
46.8 47 47.5 [X] ACEMagician Ace Magician AM08 Pro AMD Ryzen 9 6900HX 3.3GHz
Radeon 680M
min:
12.1 fps, P1:
23.8 fps, max:
186.6 fps
47.6 47.6 48.7 48.7 [X] Aoostar GOD77 AMD Ryzen 7 7735HS 3.2GHz
Radeon 680M
min:
9.22 fps, P1:
34.5 fps, max:
205 fps
49.2 49.3 49.5 49.6 50.5 [X] Aokzoe A1 AMD Ryzen 7 6800U 2.7GHz
Radeon 680M
min:
8.33 fps, P1:
32.3 fps, max:
101 fps
51.4 [X] GPD Win 4 AMD Ryzen 7 6800U 2.7GHz
Radeon 680M
min:
1.467 fps, P1:
27 fps, max:
107.1 fps
51.8 [X] Beelink GTR6 AMD Ryzen 9 6900HX 3.3GHz
Radeon 680M
min:
9.91 fps, P1:
35.7 fps, max:
90.4 fps
51.9 [X] Beelink SER6 Pro AMD Ryzen 7 6800H 3.2GHz
Radeon 680M
min:
14.3 fps, P1:
37 fps, max:
143.3 fps
51.9 [X] GMK NucBox K2 AMD Ryzen 7 7735HS 3.2GHz
Radeon 680M
min:
5.75 fps, P1:
35.7 fps, max:
128.5 fps
52.2 52.9 [X] Acemagic AM20 AMD Ryzen 7 7735H 3.2GHz
Radeon 680M
min:
4 fps, P1:
35.7 fps, max:
173.6 fps
53 53.4 53.5 53.9 [X] Aoostar GEM10 AMD Ryzen 7 6800H 3.2GHz
Radeon 680M
min:
3.82 fps, P1:
38.5 fps, max:
224 fps
99.1 ~ 49 fps
234%
GeForce GTX 1660 Ti Max-Q:
114.6 fps
100%
Radeon 680M:
11.3 12.7 18.8 19 [X] ACEMagician Ace Magician AM08 Pro AMD Ryzen 9 6900HX 3.3GHz
Radeon 680M
min:
7.53 fps, P1:
12 fps, max:
60.6 fps
19.4 19.6 20 20.4 [X] Aoostar GOD77 AMD Ryzen 7 7735HS 3.2GHz
Radeon 680M
min:
4.1 fps, P1:
14.7 fps, max:
46.8 fps
20.5 [X] ACEMagician Ace Magician AM08 Pro AMD Ryzen 9 6900HX 3.3GHz
Radeon 680M
min:
2.3 fps, P1:
11.9 fps, max:
81.9 fps
20.6 20.9 21.3 21.7 22.2 22.3 22.7 22.8 23.1 [X] Aoostar GEM10 AMD Ryzen 7 6800H 3.2GHz
Radeon 680M
min:
5.23 fps, P1:
16.7 fps, max:
77 fps
23.2 [X] Acemagic AM20 AMD Ryzen 7 7735H 3.2GHz
Radeon 680M
min:
3.58 fps, P1:
16.4 fps, max:
69.3 fps
23.5 23.5 [X] Aokzoe A1 AMD Ryzen 7 6800U 2.7GHz
Radeon 680M
min:
3.24 fps, P1:
15.2 fps, max:
47.3 fps
23.7 [X] Beelink GTR6 AMD Ryzen 9 6900HX 3.3GHz
Radeon 680M
min:
7.88 fps, P1:
16.4 fps, max:
114.6 fps
23.7 [X] Beelink SER6 Pro AMD Ryzen 7 6800H 3.2GHz
Radeon 680M
min:
9.52 fps, P1:
16.4 fps, max:
95.2 fps
23.8 24 [X] GMK NucBox K2 AMD Ryzen 7 7735HS 3.2GHz
Radeon 680M
min:
5.07 fps, P1:
15.9 fps, max:
83.4 fps
24.1 24.2 24.5 24.8 [X] GPD Win 4 AMD Ryzen 7 6800U 2.7GHz
Radeon 680M
min:
3 fps, P1:
15.4 fps, max:
56.5 fps
~ 21 fps
284%
GeForce GTX 1660 Ti Max-Q:
59.6 fps
GeForce GTX 1660 Ti Max-Q:
343.8 fps
GeForce GTX 1660 Ti Max-Q:
322.9 fps
GeForce GTX 1660 Ti Max-Q:
296.9 fps
GeForce GTX 1660 Ti Max-Q:
166.1 fps
Average Gaming AMD Radeon 680M → 100% Average Gaming 30-70 fps → 100%
Average Gaming NVIDIA GeForce GTX 1660 Ti Max-Q → 182% Average Gaming 30-70 fps → 212%
For more games that might be playable and a list of all games and graphics cards visit our Gaming List
v1.26
log 02. 14:03:41
#0 checking url part for id 11124 +0s ... 0s
#1 checking url part for id 9832 +0s ... 0s
#2 not redirecting to Ajax server +0s ... 0s
#3 did not recreate cache, as it is less than 5 days old! Created at Sat, 01 Jun 2024 05:39:27 +0200 +0.001s ... 0.001s
#4 composed specs +0.102s ... 0.103s
#5 did output specs +0s ... 0.103s
#6 start showIntegratedCPUs +0s ... 0.103s
#7 getting avg benchmarks for device 11124 +0.048s ... 0.151s
#8 got single benchmarks 11124 +0.129s ... 0.28s
#9 getting avg benchmarks for device 9832 +0.018s ... 0.297s
#10 got single benchmarks 9832 +0.035s ... 0.333s
#11 got avg benchmarks for devices +0s ... 0.333s
#12 min, max, avg, median took s +0.487s ... 0.82s
#13 before gaming benchmark output +0s ... 0.82s
#14 Got 2290 rows for game benchmarks. +0.391s ... 1.211s
#15 composed SQL query for gamebenchmarks +0s ... 1.211s
#16 got data and put it in $dataArray +0.096s ... 1.306s
#17 benchmarks composed for output. +0.31s ... 1.616s
#18 calculated avg scores. +0s ... 1.616s
#19 return log +0.05s ... 1.667s
Please share our article, every link counts!
Redaktion, 2017-09- 8 (Update: 2023-07- 1)
 Deutsch
 English
 Español
 Français
 Italiano
 Nederlands
 Polski
 Português
 Русский
 Türkçe
 Svenska
 Chinese
 Magyar