Samsung PM9A1 MZVL21T0HCLR vs Samsung SSD 980 Pro 1TB MZ-V8P1T0BW vs 2x Samsung PM9A1 MZVL21T0HCLR (RAID 0)
Samsung PM9A1 MZVL21T0HCLR
► remove from comparison
The Samsung OEM Client SSD PM9A1 1TB, M.2 (MZVL21T0HCLR, OEM variant of the 980 Pro) is a fast M.2 2280 SSD which supports PCIe 4.0 x4. It uses the Samsung Elpis (S4LV003) Controller with 8 channels and 512 MB LPDDR4. The memory modules are from Samsung (3D-NAND TLC 136 layers). The 1TB version is specified at 7000 MB/s and 5100 MB/s write (SLC cached). The power consumption is specified at 0.005 W (sleep) and 0.035W (idle).
Samsung SSD 980 Pro 1TB MZ-V8P1T0BW
► remove from comparison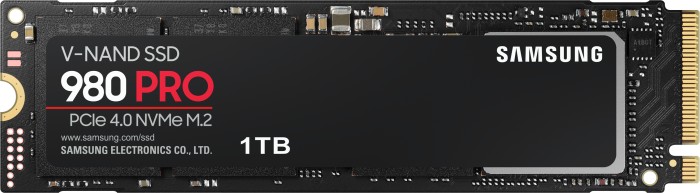
The Samsung SSD 980 PRO 1TB (MZ-V8P1T0BW) is a fast high end PCIe 4.0 x4 M.2 2280 SSD. It uses the Samsung Elpis controller with 8 channels, 1 GB LPDDR4 cache, SLC-Cache and 3D-NAND TLC memory modules from Samsung (V-NAND v6). Samsung specifies the drive with 7000 MB/s read and 5000 MB/s write (SLC cached, 2000 MB/s TLC). The power consumption is between 0.035W (idle) 8.9 W.
2x Samsung PM9A1 MZVL21T0HCLR (RAID 0)
► remove from comparisonTwo Samsung OEM Client SSD PM9A1 1TB in RAID 0 combination offer 2 TB of storage and a higher performance than a single drive but at the cost of a higher power consumption and a higher risk of data loss (data lost if one drive has a failure). Each drive uses the Samsung Elpis (S4LV003) Controller with 8 channels and 512 MB LPDDR4. The memory modules are from Samsung (3D-NAND TLC 136 layers). The 1TB version is specified at 7000 MB/s and 5100 MB/s write (SLC cached). The power consumption is specified at 0.005 W (sleep) and 0.035W (idle) for each drive.
| Samsung PM9A1 MZVL21T0HCLR | Samsung SSD 980 Pro 1TB MZ-V8P1T0BW | 2x Samsung PM9A1 MZVL21T0HCLR (RAID 0) | |
| Type | SSD | SSD | SSD |
| Size | M.2 2280 | M.2 2280 | M.2 2280 |
| Capacity | 1024 GB | 1024 GB | 2048 GB |
| Interface | NVMe | NVMe | NVMe |
| Announced | 26.02.2021 | 30.08.2020 | 26.02.2021 |
| Controller | Samsung Elpis S4LV003 |
Benchmarks
| Model | CPU | GPU | RAM | Value |
|---|---|---|---|---|
| Lenovo Legion 5 Pro 16IAH7H | i7-12700H 120 W / 100 W | GeForce RTX 3060 Laptop GPU 115 W 1702 / 1750 MHz 6 GB | 16 GB | 1199 |
| Asus ROG Strix Scar 18 2023 G834JY-N6005W | i9-13980HX 0 W / 65 W | GeForce RTX 4090 Laptop GPU 175 W 2090 MHz 16 GB | 32 GB | 1302 |
| Model | CPU | GPU | RAM | Value |
|---|---|---|---|---|
| Lenovo Legion 5 Pro 16IAH7H | i7-12700H 120 W / 100 W | GeForce RTX 3060 Laptop GPU 115 W 1702 / 1750 MHz 6 GB | 16 GB | 428 |
| Asus ROG Strix Scar 18 2023 G834JY-N6005W | i9-13980HX 0 W / 65 W | GeForce RTX 4090 Laptop GPU 175 W 2090 MHz 16 GB | 32 GB | 437 |
| Model | CPU | GPU | RAM | Value |
|---|---|---|---|---|
| Asus ROG Strix Scar 18 2023 G834JY-N6005W | i9-13980HX 0 W / 65 W | GeForce RTX 4090 Laptop GPU 175 W 2090 MHz 16 GB | 32 GB | 2582 |
| Lenovo Legion 5 Pro 16IAH7H | i7-12700H 120 W / 100 W | GeForce RTX 3060 Laptop GPU 115 W 1702 / 1750 MHz 6 GB | 16 GB | 2622 |
| Model | CPU | GPU | RAM | Value |
|---|---|---|---|---|
| Asus ROG Strix Scar 18 2023 G834JY-N6005W 2.0.7316.34247 | i9-13980HX 0 W / 65 W | GeForce RTX 4090 Laptop GPU 175 W 2090 MHz 16 GB | 32 GB | 4119 |
| Asus ROG Strix Scar 18 2023 G834JY-N6005W 2.0.7316.34247 | i9-13980HX 175 W / 170 W | GeForce RTX 4090 Laptop GPU 175 W 2090 / 2250 MHz 16 GB | 32 GB | 4364 |
| Lenovo Legion 5 Pro 16IAH7H 2.0.7316.34247 | i7-12700H 120 W / 100 W | GeForce RTX 3060 Laptop GPU 115 W 1702 / 1750 MHz 6 GB | 16 GB | 6691 |
| Model | CPU | GPU | RAM | Value |
|---|---|---|---|---|
| Asus ROG Strix Scar 18 2023 G834JY-N6005W 2.0.7316.34247 | i9-13980HX 0 W / 65 W | GeForce RTX 4090 Laptop GPU 175 W 2090 MHz 16 GB | 32 GB | 1656 |
| Asus ROG Strix Scar 18 2023 G834JY-N6005W 2.0.7316.34247 | i9-13980HX 175 W / 170 W | GeForce RTX 4090 Laptop GPU 175 W 2090 / 2250 MHz 16 GB | 32 GB | 1691 |
| Lenovo Legion 5 Pro 16IAH7H 2.0.7316.34247 | i7-12700H 120 W / 100 W | GeForce RTX 3060 Laptop GPU 115 W 1702 / 1750 MHz 6 GB | 16 GB | 2631 |
| Model | CPU | GPU | RAM | Value |
|---|---|---|---|---|
| Asus ROG Strix Scar 18 2023 G834JY-N6005W 2.0.7316.34247 | i9-13980HX 0 W / 65 W | GeForce RTX 4090 Laptop GPU 175 W 2090 MHz 16 GB | 32 GB | 1715 |
| Asus ROG Strix Scar 18 2023 G834JY-N6005W 2.0.7316.34247 | i9-13980HX 175 W / 170 W | GeForce RTX 4090 Laptop GPU 175 W 2090 / 2250 MHz 16 GB | 32 GB | 1858 |
| Lenovo Legion 5 Pro 16IAH7H 2.0.7316.34247 | i7-12700H 120 W / 100 W | GeForce RTX 3060 Laptop GPU 115 W 1702 / 1750 MHz 6 GB | 16 GB | 2728 |
| Model | CPU | GPU | RAM | Value |
|---|---|---|---|---|
| Lenovo Legion 5 Pro 16IAH7H 2.0.7316.34247 | i7-12700H 120 W / 100 W | GeForce RTX 3060 Laptop GPU 115 W 1702 / 1750 MHz 6 GB | 16 GB | 0.021 |
| Asus ROG Strix Scar 18 2023 G834JY-N6005W 2.0.7316.34247 | i9-13980HX 175 W / 170 W | GeForce RTX 4090 Laptop GPU 175 W 2090 / 2250 MHz 16 GB | 32 GB | 0.035 |
| Asus ROG Strix Scar 18 2023 G834JY-N6005W 2.0.7316.34247 | i9-13980HX 0 W / 65 W | GeForce RTX 4090 Laptop GPU 175 W 2090 MHz 16 GB | 32 GB | 0.036 |
| Model | CPU | GPU | RAM | Value |
|---|---|---|---|---|
| Lenovo Legion 5 Pro 16IAH7H 2.0.7316.34247 | i7-12700H 120 W / 100 W | GeForce RTX 3060 Laptop GPU 115 W 1702 / 1750 MHz 6 GB | 16 GB | 0.021 |
| Asus ROG Strix Scar 18 2023 G834JY-N6005W 2.0.7316.34247 | i9-13980HX 0 W / 65 W | GeForce RTX 4090 Laptop GPU 175 W 2090 MHz 16 GB | 32 GB | 0.036 |
| Asus ROG Strix Scar 18 2023 G834JY-N6005W 2.0.7316.34247 | i9-13980HX 175 W / 170 W | GeForce RTX 4090 Laptop GPU 175 W 2090 / 2250 MHz 16 GB | 32 GB | 0.044 |
| Model | CPU | GPU | RAM | Value |
|---|---|---|---|---|
| Asus ROG Strix Scar 18 2023 G834JY-N6005W 2.0.7316.34247 | i9-13980HX 175 W / 170 W | GeForce RTX 4090 Laptop GPU 175 W 2090 / 2250 MHz 16 GB | 32 GB | 1072 |
| Asus ROG Strix Scar 18 2023 G834JY-N6005W 2.0.7316.34247 | i9-13980HX 0 W / 65 W | GeForce RTX 4090 Laptop GPU 175 W 2090 MHz 16 GB | 32 GB | 1134 |
| Lenovo Legion 5 Pro 16IAH7H 2.0.7316.34247 | i7-12700H 120 W / 100 W | GeForce RTX 3060 Laptop GPU 115 W 1702 / 1750 MHz 6 GB | 16 GB | 1613.52 |
| Model | CPU | GPU | RAM | Value |
|---|---|---|---|---|
| Asus ROG Strix Scar 18 2023 G834JY-N6005W 2.0.7316.34247 | i9-13980HX 0 W / 65 W | GeForce RTX 4090 Laptop GPU 175 W 2090 MHz 16 GB | 32 GB | 974 |
| Asus ROG Strix Scar 18 2023 G834JY-N6005W 2.0.7316.34247 | i9-13980HX 175 W / 170 W | GeForce RTX 4090 Laptop GPU 175 W 2090 / 2250 MHz 16 GB | 32 GB | 1011 |
| Lenovo Legion 5 Pro 16IAH7H 2.0.7316.34247 | i7-12700H 120 W / 100 W | GeForce RTX 3060 Laptop GPU 115 W 1702 / 1750 MHz 6 GB | 16 GB | 1679.76 |
| Model | CPU | GPU | RAM | Value |
|---|---|---|---|---|
| Asus ROG Strix Scar 18 2023 G834JY-N6005W 2.0.7316.34247 | i9-13980HX 0 W / 65 W | GeForce RTX 4090 Laptop GPU 175 W 2090 MHz 16 GB | 32 GB | 112.8 |
| Asus ROG Strix Scar 18 2023 G834JY-N6005W 2.0.7316.34247 | i9-13980HX 175 W / 170 W | GeForce RTX 4090 Laptop GPU 175 W 2090 / 2250 MHz 16 GB | 32 GB | 114.7 |
| Lenovo Legion 5 Pro 16IAH7H 2.0.7316.34247 | i7-12700H 120 W / 100 W | GeForce RTX 3060 Laptop GPU 115 W 1702 / 1750 MHz 6 GB | 16 GB | 197.41 |
| Model | CPU | GPU | RAM | Value |
|---|---|---|---|---|
| Asus ROG Strix Scar 18 2023 G834JY-N6005W 2.0.7316.34247 | i9-13980HX 0 W / 65 W | GeForce RTX 4090 Laptop GPU 175 W 2090 MHz 16 GB | 32 GB | 56.4 |
| Asus ROG Strix Scar 18 2023 G834JY-N6005W 2.0.7316.34247 | i9-13980HX 175 W / 170 W | GeForce RTX 4090 Laptop GPU 175 W 2090 / 2250 MHz 16 GB | 32 GB | 58 |
| Lenovo Legion 5 Pro 16IAH7H 2.0.7316.34247 | i7-12700H 120 W / 100 W | GeForce RTX 3060 Laptop GPU 115 W 1702 / 1750 MHz 6 GB | 16 GB | 80.52 |
| Model | CPU | GPU | RAM | Value |
|---|---|---|---|---|
| Asus ROG Strix Scar 18 2023 G834JY-N6005W 2.0.7316.34247 | i9-13980HX 0 W / 65 W | GeForce RTX 4090 Laptop GPU 175 W 2090 MHz 16 GB | 32 GB | 4091 |
| Asus ROG Strix Scar 18 2023 G834JY-N6005W 2.0.7316.34247 | i9-13980HX 175 W / 170 W | GeForce RTX 4090 Laptop GPU 175 W 2090 / 2250 MHz 16 GB | 32 GB | 5041 |
| Lenovo Legion 5 Pro 16IAH7H 2.0.7316.34247 | i7-12700H 120 W / 100 W | GeForce RTX 3060 Laptop GPU 115 W 1702 / 1750 MHz 6 GB | 16 GB | 8205.5 |
| Model | CPU | GPU | RAM | Value |
|---|---|---|---|---|
| Asus ROG Strix Scar 18 2023 G834JY-N6005W 2.0.7316.34247 | i9-13980HX 0 W / 65 W | GeForce RTX 4090 Laptop GPU 175 W 2090 MHz 16 GB | 32 GB | 6844 |
| Asus ROG Strix Scar 18 2023 G834JY-N6005W 2.0.7316.34247 | i9-13980HX 175 W / 170 W | GeForce RTX 4090 Laptop GPU 175 W 2090 / 2250 MHz 16 GB | 32 GB | 7888 |
| Lenovo Legion 5 Pro 16IAH7H 2.0.7316.34247 | i7-12700H 120 W / 100 W | GeForce RTX 3060 Laptop GPU 115 W 1702 / 1750 MHz 6 GB | 16 GB | 9681.3 |
| Model | CPU | GPU | RAM | Value |
|---|---|---|---|---|
| Schenker XMG Neo 17 M22 | R9 6900HX 85 W / 45 W | GeForce RTX 3080 Ti Laptop GPU 175 W 1590 / 2000 MHz 16 GB | 32 GB | 418 |
| Model | CPU | GPU | RAM | Value |
|---|---|---|---|---|
| Schenker XMG Neo 17 M22 | R9 6900HX 85 W / 45 W | GeForce RTX 3080 Ti Laptop GPU 175 W 1590 / 2000 MHz 16 GB | 32 GB | 572 |
| Model | CPU | GPU | RAM | Value |
|---|---|---|---|---|
| Schenker XMG Neo 17 M22 | R9 6900HX 85 W / 45 W | GeForce RTX 3080 Ti Laptop GPU 175 W 1590 / 2000 MHz 16 GB | 32 GB | 190.8 |
| Model | CPU | GPU | RAM | Value |
|---|---|---|---|---|
| Schenker XMG Neo 17 M22 | R9 6900HX 85 W / 45 W | GeForce RTX 3080 Ti Laptop GPU 175 W 1590 / 2000 MHz 16 GB | 32 GB | 76.06 |
| Model | CPU | GPU | RAM | Value |
|---|---|---|---|---|
| Schenker XMG Neo 17 M22 | R9 6900HX 85 W / 45 W | GeForce RTX 3080 Ti Laptop GPU 175 W 1590 / 2000 MHz 16 GB | 32 GB | 3765 |
| Model | CPU | GPU | RAM | Value |
|---|---|---|---|---|
| Schenker XMG Neo 17 M22 | R9 6900HX 85 W / 45 W | GeForce RTX 3080 Ti Laptop GPU 175 W 1590 / 2000 MHz 16 GB | 32 GB | 3013 |
| Model | CPU | GPU | RAM | Value |
|---|---|---|---|---|
| Schenker XMG Neo 17 M22 | R9 6900HX 85 W / 45 W | GeForce RTX 3080 Ti Laptop GPU 175 W 1590 / 2000 MHz 16 GB | 32 GB | 4099 |
| Model | CPU | GPU | RAM | Value |
|---|---|---|---|---|
| Schenker XMG Neo 17 M22 | R9 6900HX 85 W / 45 W | GeForce RTX 3080 Ti Laptop GPU 175 W 1590 / 2000 MHz 16 GB | 32 GB | 3973 |
| Model | CPU | GPU | RAM | Value |
|---|---|---|---|---|
| Dell XPS 14 2024 OLED 6.0.1 x64 1024 MiB [C: 9.2% (85.1/925.7 GiB)] (x5) [Interval=5 sec] | Ultra 7 155H 64 W / 30 W | GeForce RTX 4050 Laptop GPU 30 W 1605 / 2000 MHz 4 GB | 32 GB | 113 |
| Lenovo Slim 7 Pro X 14ARH7 | R9 6900HS 65 W / 54 W | GeForce RTX 3050 4GB Laptop GPU 55 W 1057 / 1375 MHz 4 GB | 32 GB | 117.6 |
| Lenovo Yoga Pro 7 14ARP G8 6.0.1 x64 1024 MiB [C: 3.8% (36.3/953.1 GiB)] (x5) [Interval=5 sec] | R7 7735HS 60 W / 54 W | Radeon 680M | 16 GB | 120.9 |
| LG Gram 16Z90Q | i7-1260P 43 W / 25 W | Iris Xe G7 96EUs 1400 / 2600 MHz | 16 GB | 123.4 |
| Eluktronics Mech-17 GP2 | i9-13900HX 160 W / 99 W | GeForce RTX 4090 Laptop GPU 175 W 2140 / 2375 MHz 16 GB | 32 GB | 130.1 |
| Lenovo Yoga Pro 7 14IRH G8 6.0.1 x64 1024 MiB [C: 13.8% (130.9/951.6 GiB)] (x5) [Interval=5 sec] | i7-13700H 80 W / 53 W | GeForce RTX 4050 Laptop GPU 55 W 1905 / 2000 MHz 6 GB | 16 GB | 134 |
| Lenovo Yoga Slim 7 14APU G8 6.0.1 x64 1024 MiB [C: 7.6% (72.4/951.6 GiB)] (x5) [Interval=5 sec] | R7 7840S 52 W / 42 W | Radeon 780M ? / 800 MHz | 32 GB | 135.3 |
| Lenovo Yoga Slim 7 Carbon 13IAP7-82U9005FGE 6.0.1 x64 1024 MiB [C: 19.6% (186.5/951.6 GiB)] (x5) [Interval=5 sec] | i7-1260P 46 W / 28 W | Iris Xe G7 96EUs 1400 / 2400 MHz | 16 GB | 135.59 |
| Asus ROG Zephyrus G14 GA402XY 6.0.1 x64 1024 MiB [C: 8.2% (76.2/926.6 GiB)] (x5) [Interval=5 sec] | R9 7940HS 80 W / 80 W | GeForce RTX 4090 Laptop GPU 125 W 1455 / 2250 MHz 16 GB | 32 GB | 138.4 |
| Lenovo Yoga Pro 9-14IRP G8 6.0.1 x64 1024 MiB [C: 8.6% (81.6/951.6 GiB)] (x5) [Interval=5 sec] | i7-13705H 104 W / 75 W | GeForce RTX 4050 Laptop GPU 80 W 2055 / 2000 MHz 6 GB | 32 GB | 138.6 |
| Lenovo Yoga Pro 9 16-IRP G8 6.0.1 x64 1024 MiB [C: 7.1% (67.9/951.6 GiB)] (x5) [Interval=5 sec] | i7-13705H 125 W / 80 W | GeForce RTX 4060 Laptop GPU 100 W 8 GB | 16 GB | 138.7 |
| Lenovo Yoga Pro 7 14APH G8 6.0.1 x64 1024 MiB [C: 15.9% (151.5/951.6 GiB)] (x5) [Interval=5 sec] | R7 7840HS 60 W / 54 W | Radeon 780M | 32 GB | 138.8 |
| Uniwell Technology GM7AG8N Liquid Cooling Box | i9-12900H 140 W / 98 W | GeForce RTX 3080 Ti Laptop GPU 175 W 1590 / 2000 MHz 16 GB | 16 GB | 139.7 |
| Asus Zenbook 17 Fold UX9702 6.0.1 x64 1024 MiB [C: 5.2% (49.4/952.5 GiB)] (x5) [Interval=5 sec] | i7-1250U 29 W / 16 W | Iris Xe G7 80EUs 950 MHz | 16 GB | 140.52 |
| Asus ZenBook S13 OLED UX5304 6.0.1 x64 1024 MiB [C: 5.5% (52.1/952.4 GiB)] (x5) [Interval=5 sec] | i7-1355U 44 W / 17 W | Iris Xe G7 96EUs 1300 MHz | 16 GB | 141.4 |
| Dell Precision 5480 | i9-13900H 88 W / 51 W | RTX 3000 Ada Generation Laptop 50 W 1530 / 2000 MHz 8 GB | 64 GB | 142.6 |
| HP Omen 16-n0033dx | R7 6800H 93 W / 64 W | Radeon RX 6650M 105 W ? / 2000 MHz 8 GB | 16 GB | 142.9 |
| HP ZBook Firefly 16 G9-6B897EA 6.0.1 x64 1024 MiB [C: 7.0% (66.5/952.7 GiB)] (x5) [Interval=5 sec] | i7-1265U 51 W / 12 W | T550 Laptop GPU 20 W 1665 / 1500 MHz 4 GB | 32 GB | 143.95 |
| Lenovo Slim Pro 9i 16IRP8 | i9-13905H 123 W / 85 W | GeForce RTX 4050 Laptop GPU 100 W 2055 / 2000 MHz 6 GB | 32 GB | 145.9 |
| Dell XPS 13 Plus 9320 4K 6.0.1 x64 1024 MiB [C: 15.9% (148.3/934.4 GiB)] (x5) [Interval=5 sec] | i7-1260P 64 W / 34 W | Iris Xe G7 96EUs 1400 MHz | 32 GB | 146.7 |
| Lenovo ThinkPad T14 G3-21AJS00400 6.0.1 x64 1024 MiB [C: 6.0% (57.5/951.6 GiB)] (x5) [Interval=5 sec] | i7-1260P 58 W / 42 W | GeForce MX550 30 W 1710 / 1500 MHz 2 GB | 16 GB | 148.8 |
| Asus Zenbook S 13 OLED 6.0.1 x64 1024 MiB [C: 4.9% (46.8/952.2 GiB)] (x5) [Interval=5 sec] | R7 6800U 30 W / 25 W | Radeon 680M 2200DC MHz | 16 GB | 152.69 |
| Dell Precision 5000 5470 | i9-12900H 91 W / 20 W | RTX A1000 Laptop GPU 40 W 1140 / 1375 MHz 4 GB | 32 GB | 153.8 |
| HP ZBook Power 15 G9 6B8C4EA 6.0.1 x64 1024 MiB [C: 7.2% (68.3/952.7 GiB)] (x5) [Interval=5 sec] | i7-12700H 90 W / 55 W | RTX A2000 Laptop GPU 45 W 1335 / 1368 MHz 8 GB | 32 GB | 156.27 |
| Acer Nitro 16 AN16-41 | R7 7735HS 100 W / 75 W | GeForce RTX 4070 Laptop GPU 140 W 1980 / 2000 MHz 8 GB | 16 GB | 163.4 |
| LG Gram 15Z90Q | i5-1240P 43 W / 13 W | Iris Xe G7 80EUs 1300 / 2600 MHz | 16 GB | 164.3 |
| Acer Nitro 17 AN17-41-R9LN | R7 7735HS 100 W / 65 W | GeForce RTX 4070 Laptop GPU 140 W 1980 / 1963 MHz 8 GB | 16 GB | 165 |
| Lenovo ThinkPad X1 Carbon G9-20XWCTO1WW | i7-1165G7 36 W / 28 W | Iris Xe G7 96EUs | 32 GB | 171.3 |
| Dell XPS 17 9720 RTX 3060 | i7-12700H 155 W / 55 W | GeForce RTX 3060 Laptop GPU 65 W 1282 / 1500 MHz 6 GB | 32 GB | 179.9 |
| Asus ProArt StudioBook 16 H7600ZW | i9-12900H 115 W / 110 W | GeForce RTX 3070 Ti Laptop GPU 115 W 8 GB | 32 GB | 179.9 |
| Alienware x15 R2 P111F | i9-12900H 140 W / 140 W | GeForce RTX 3080 Ti Laptop GPU 140 W 16 GB | 32 GB | 187.2 |
| Lenovo Legion 5 Pro 16ARH7H RTX 3070 Ti | R7 6800H 90 W / 90 W | GeForce RTX 3070 Ti Laptop GPU 150 W 1510 / 1800 MHz 8 GB | 32 GB | 194.3 |
| Razer Blade 14 Ryzen 9 6900HX | R9 6900HX 90 W / 75 W | GeForce RTX 3070 Ti Laptop GPU 100 W 1035 / 1500 MHz 8 GB | 16 GB | 197.4 |
| Razer Blade 14 RZ09-0508 | R9 8945HS 90 W / 75 W | GeForce RTX 4070 Laptop GPU 140 W 1605 / 2000 MHz 8 GB | 32 GB | 201.6 |
| Alienware m16 R2 | Ultra 7 155H 121 W / 102 W | GeForce RTX 4070 Laptop GPU 140 W 2005 / 2013 MHz 8 GB | 16 GB | 201.9 |
| Razer Blade 14 RTX 4070 | R9 7940HS 88 W / 80 W | GeForce RTX 4070 Laptop GPU 140 W 1980 / 2000 MHz 8 GB | 16 GB | 202.6 |
| MSI Prestige 13 AI Evo 6.0.1 x64 1024 MiB [C: 14.6% (135.6/931.1 GiB)] (x5) [Interval=5 sec] | Ultra 7 155H | Arc 8-Core | 32 GB | 205 |
| Razer Blade 16 RTX 5080 | Ryzen AI 9 365 80 W / 75 W | GeForce RTX 5080 Laptop 160 W 1500 / 1750 MHz 16 GB | 32 GB | 207.2 |
| Medion Erazer Beast X30 | i9-12900HK 120 W / 120 W | GeForce RTX 3080 Ti Laptop GPU 175 W 1590 / 2000 MHz 16 GB | 32 GB | 209 |
| Lenovo Yoga 9i 14 2022 i7-1260P 6.0.1 x64 1024 MiB [C: 8.3% (79.4/951.6 GiB)] (x5) [Interval=5 sec] | i7-1260P 64 W / 38 W | Iris Xe G7 96EUs 1400 / 2600 MHz | 16 GB | 210.14 |
| Nubia RedMagic Titan 16 Pro | i9-14900HX 140 W / 45 W | GeForce RTX 4060 Laptop GPU 140 W 2250 / 2000 MHz 8 GB | 16 GB | 211.6 |
| Razer Blade 15 OLED (Early 2022) | i9-12900H 160 W / 65 W | GeForce RTX 3070 Ti Laptop GPU 110 W 1035 / 1500 MHz 8 GB | 16 GB | 213.2 |
| Asus ExpertBook B7 Flip B7402FEA | i7-1195G7 51 W / 35 W | Iris Xe G7 96EUs 1400 MHz | 16 GB | 219.3 |
| Razer Blade 17 (i7-12800H, RTX 3070 Ti) 6.0.0 x64 1024 MiB [C: 13.7% (127.7/934.5 GiB)] (x5) [Interval=5 sec] | i7-12800H 110 W / 60 W | GeForce RTX 3070 Ti Laptop GPU 150 W 8 GB | 16 GB | 220.27 |
| Razer Blade 14 2025 6.0.1 x64 1024 MiB [C: 9.7% (90.3/927.8 GiB)] (x5) [Interval=5 sec] | Ryzen AI 9 365 70 W / 60 W | GeForce RTX 5070 Laptop 115 W 2632 / 1500 MHz | 32 GB | 222 |
| Razer Blade 17 RTX 3080 Ti | i7-12800H 107 W / 61 W | GeForce RTX 3080 Ti Laptop GPU 165 W 1395 / 2000 MHz 16 GB | 32 GB | 222.4 |
| LG Gram 17 (2023) | i7-1360P 43 W / 26 W | Iris Xe G7 96EUs 1400 MHz | 16 GB | 223.1 |
| Alienware m15 R6, i7-11800H RTX 3080 | i7-11800H 90 W / 50 W | GeForce RTX 3080 Laptop GPU 125 W 8 GB | 32 GB | 225.7 |
| Maingear Vector Pro MG-VCP17 | i7-11800H 120 W / 120 W | GeForce RTX 3080 Laptop GPU 165 W 1605 / 1750 MHz 16 GB | 32 GB | 227.2 |
| Acer Predator Helios 300 (i7-12700H, RTX 3070 Ti) 6.0.0 x64 1024 MiB [C: 37.2% (354.4/952.6 GiB)] (x5) [Interval=5 sec] | i7-12700H 115 W / 115 W | GeForce RTX 3070 Ti Laptop GPU 150 W 8 GB | 32 GB | 227.49 |
| MSI Summit E14 Flip Evo A12MT | i7-1260P 72 W / 28 W | Iris Xe G7 96EUs 1400 / 2400 MHz | 32 GB | 227.9 |
| Razer Blade 17 Early 2022 | i9-12900H 160 W / 65 W | GeForce RTX 3080 Ti Laptop GPU 165 W 1395 / 2000 MHz 16 GB | 32 GB | 228.2 |
| Aorus 15P YD | i7-11800H 109 W / 45 W | GeForce RTX 3080 Laptop GPU 130 W 1545 / 1750 MHz 8 GB | 16 GB | 230.4 |
| Gigabyte Aero 15 OLED XD | i7-11800H @4.6 GHz 109 W / 62 W | GeForce RTX 3070 Laptop GPU 105 W 1290 / 1500 MHz 8 GB | 32 GB | 231.4 |
| Acer Nitro 5 AN515-58-72QR | i7-12700H 115 W / 80 W | GeForce RTX 3070 Ti Laptop GPU 150 W 1410 / 1750 MHz 8 GB | 16 GB | 232.7 |
| Lenovo Legion Pro 5 16ARX8 | R7 7745HX 110 W / 97 W | GeForce RTX 4070 Laptop GPU 140 W 1755 / 2050 MHz 8 GB | 16 GB | 233.3 |
| Razer Blade 17 RTX 3070 | i7-11800H 160 W / 65 W | GeForce RTX 3070 Laptop GPU 130 W 1410 / 1500 MHz 8 GB | 16 GB | 233.5 |
| MSI Stealth 14 Studio A13V 6.0.1 x64 1024 MiB [C: 38.8% (358.9/926.3 GiB)] (x5) [Interval=5 sec] | i7-13700H 110 W / 85 W | GeForce RTX 4050 Laptop GPU 90 W 2370 / 2000 MHz 6 GB | 16 GB | 238 |
| MSI CreatorPro Z16P B12UKST 6.0.1 x64 1024 MiB [C: 9.7% (90.5/934.1 GiB)] (x5) [Interval=5 sec] | i7-12700H 74 W / 64 W | RTX A3000 Laptop GPU 90 W 1440 / 1750 MHz 12 GB | 32 GB | 238.39 |
| MSI GE76 Raider 11UH-472US | i9-11980HK 200 W / 91.75 W | GeForce RTX 3080 Laptop GPU 165 W 1710 / 1750 MHz 16 GB | 64 GB | 238.8 |
| Lenovo Legion 5 16IRX G9 6.0.1 x64 1024 MiB [C: 7.7% (73.7/951.6 GiB)] (x5) [Interval=5 sec] | i7-14650HX 140 W / 100 W | GeForce RTX 4060 Laptop GPU 125 W 2430 / 2050 MHz 8 GB | 16 GB | 241 |
| Lenovo ThinkPad X1 Yoga G6-20Y0S00200 5.2.1 x64 1024 MiB [C: 9.3% (88.3/953.3 GiB)] (x5) [Interval=5 sec] | i7-1165G7 48 W / 28 W | Iris Xe G7 96EUs | 32 GB | 241.9 |
| Razer Blade 15 Advanced Model Early 2022 5.2.0 x64 1024 MiB [C: 51.4% (480.7/934.5 GiB)] (x5) [Interval=5 sec] | i7-12800H 160 W / 65 W | GeForce RTX 3080 Ti Laptop GPU 110 W 1125 / 1750 MHz 16 GB | 32 GB | 242.96 |
| MSI Titan GT77 12UHS | i9-12900HX 200 W / 125 W | GeForce RTX 3080 Ti Laptop GPU 175 W 16 GB | 64 GB | 243.5 |
| Lenovo Legion Pro 7 RTX4090 | i9-13900HX 185 W / 130 W | GeForce RTX 4090 Laptop GPU 175 W 1455 / 2250 MHz 16 GB | 32 GB | 244.3 |
| Lenovo Legion Pro 5 16IRX9 G9 6.0.0 x64 1024 MiB [C: 27.0% (257.1/951.6 GiB)] (x5) [Interval=5 sec] | i7-14700HX 190 W / 130 W | GeForce RTX 4060 Laptop GPU 140 W 8 GB | 32 GB | 245 |
| Lenovo Legion Pro 7 16IRX8H | i9-13900HX 185 W / 130 W | GeForce RTX 4080 Laptop GPU 175 W 1665 / 2250 MHz 12 GB | 32 GB | 246.2 |
| Lenovo Legion Slim 7i 16 Gen 8 | i9-13900H 107 W / 81 W | GeForce RTX 4070 Laptop GPU 140 W 1845 / 2050 MHz 8 GB | 16 GB | 247.4 |
| Lenovo Legion Pro 5 16IRX9 | i9-14900HX 187 W / 104 W | GeForce RTX 4070 Laptop GPU 140 W 1705 / 2050 MHz 8 GB | 32 GB | 251.7 |
| Lenovo Legion 5 Pro 16 G7 i7 RTX 3070Ti 6.0.1 x64 1024 MiB [C: 9.5% (90.8/951.6 GiB)] (x5) [Interval=5 sec] | i7-12700H 124 W / 108 W | GeForce RTX 3070 Ti Laptop GPU 150 W 1702 / 1750 MHz 8 GB | 16 GB | 263.4 |
| Asus ExpertBook B2 Flip B2502FBA-N80141X | i7-1260P 64 W / 28 W | Iris Xe G7 96EUs 1400 MHz | 32 GB | 267.2 |
| MSI GE67 HX 12UGS | i7-12800HX 190 W / 110 W | GeForce RTX 3070 Ti Laptop GPU 150 W 1555 / 1750 MHz 8 GB | 16 GB | 269.4 |
| Acer Swift X SFX14-71G 6.0.1 x64 1024 MiB [C: 6.5% (61.6/952.6 GiB)] (x5) [Interval=5 sec] | i7-13700H 80 W / 40 W | GeForce RTX 4050 Laptop GPU 50 W 1605 / 2000 MHz 6 GB | 16 GB | 270 |
| Model | CPU | GPU | RAM | Value |
|---|---|---|---|---|
| Schenker Vision 16 Pro RTX 3070 Ti 6.0.1 x64 1024 MiB [C: 7.6% (71.1/930.4 GiB)] (x5) [Interval=5 sec] | i7-12700H 45 W / 45 W | GeForce RTX 3070 Ti Laptop GPU 95 W 1035 / 1500 MHz 8 GB | 32 GB | 142.48 |
| Schenker XMG Neo 15 (i7-12700H, RTX 3080 Ti) 6.0.0 x64 1024 MiB [C: 42.4% (394.2/930.4 GiB)] (x5) [Interval=5 sec] | i7-12700H 95 W / 95 W | GeForce RTX 3080 Ti Laptop GPU 175 W 16 GB | 32 GB | 147.71 |
| Schenker XMG Neo 15 Tiger Lake 5.2.0 x64 1024 MiB [C: 10.3% (96.1/930.9 GiB)] (x5) [Interval=5 sec] | i7-11800H 120 W / 120 W | GeForce RTX 3080 Laptop GPU 165 W 1605 / 1750 MHz 16 GB | 32 GB | 162.7 |
| Eurocom Nightsky ARX315 | R9 5900X | GeForce RTX 3070 Laptop GPU 115 W 1560 / 1750 MHz 8 GB | 32 GB | 189.4 |
| Schenker XMG Neo 17 M22 | R9 6900HX 85 W / 45 W | GeForce RTX 3080 Ti Laptop GPU 175 W 1590 / 2000 MHz 16 GB | 32 GB | 196.8 |
| Schenker XMG Apex 15 Max | R9 5900X | GeForce RTX 3070 Laptop GPU 115 W 1560 / 1750 MHz 8 GB | 32 GB | 214.6 |
| Schenker XMG Pro 15 (i7-12700H, RTX 3080 Ti) 6.0.0 x64 1024 MiB [C: 39.7% (369.3/930.4 GiB)] (x5) [Interval=5 sec] | i7-12700H 115 W / 45 W | GeForce RTX 3080 Ti Laptop GPU 155 W 16 GB | 32 GB | 218.06 |
| Schenker Vision 14 2022 RTX 3050 Ti 6.0.2 x64 1024 MiB [C: 7.6% (71.0/930.4 GiB)] (x5) [Interval=5 sec] | i7-12700H 60 W / 40 W | GeForce RTX 3050 Ti Laptop GPU 45 W 1635 / 1375 MHz 4 GB | 32 GB | 221.94 |
| Schenker XMG NEO 17 GM7TG8S 5.2.1 x64 1024 MiB [C: 11.0% (102.0/926.1 GiB)] (x5) [Interval=5 sec] | i7-11800H 75 W / 75 W | GeForce RTX 3080 Laptop GPU 165 W 16 GB | 32 GB | 225.9 |
| Eurocom RX315 NH57AF1 | i7-11800H 95 W / 54 W | GeForce RTX 3070 Laptop GPU 1290 / 1500 MHz 8 GB | 32 GB | 227.1 |
| Schenker Vision 15 5.2.1 x64 1024 MiB [C: 40.9% (194.7/476.3 GiB)] (x5) [Interval=5 sec] | i7-1165G7 50 W / 40 W | Iris Xe G7 96EUs 1300 / 1600 MHz | 16 GB | 238.1 |
| Schenker XMG Fusion 15 (Mid 22) | i7-11800H 65 W / 45 W | GeForce RTX 3070 Laptop GPU 145 W 1290 / 1500 MHz 8 GB | 32 GB | 239.9 |
| Schenker Vision 14 5.2.1 x64 1024 MiB [C: 15.4% (143.8/930.9 GiB)] (x5) [Interval=5 sec] | i7-1165G7 60 W / 30 W | Iris Xe G7 96EUs 1300 / 2000 MHz | 16 GB | 240 |
| Schenker XMG Pro 15 (Late 2021) | i7-11800H 135 W / 55 W | GeForce RTX 3080 Laptop GPU 105 W 1245 / 1500 MHz 16 GB | 32 GB | 240.9 |
| Eurocom Raptor X15 | i7-12700K 98 W / 70 W | GeForce RTX 3070 Ti Laptop GPU 140 W 1410 / 1750 MHz 8 GB | 32 GB | 242.3 |
| Schenker XMG Pro 17 (Late 2021, RTX 3080) 6.0.0 x64 1024 MiB [C: 36.5% (339.7/930.4 GiB)] (x5) [Interval=5 sec] | i7-11800H 135 W / 55 W | GeForce RTX 3080 Laptop GPU 105 W 16 GB | 32 GB | 243 |
| Schenker Work 17 Tiger Lake-H | i7-11370H 45 W / 35 W | Iris Xe G7 96EUs | 32 GB | 251.2 |
| Schenker Vision 14 6.0.1 x64 1024 MiB [C: 15.9% (148.3/930.4 GiB)] (x5) [Interval=5 sec] | i7-11370H 46 W / 40 W | GeForce RTX 3050 Ti Laptop GPU 35 W 4 GB | 32 GB | 253.4 |
| Schenker Work 15 Tiger Lake-H | i7-11370H 44 W / 35 W | Iris Xe G7 96EUs | 16 GB | 253.4 |
| Eurocom Nightsky TXi317 | i7-12700H 110 W / 76 W | GeForce RTX 3080 Ti Laptop GPU 155 W 1485 / 2000 MHz 16 GB | 64 GB | 256.3 |
| Model | CPU | GPU | RAM | Value |
|---|---|---|---|---|
| HP Omen 16-n0033dx | R7 6800H 93 W / 64 W | Radeon RX 6650M 105 W ? / 2000 MHz 8 GB | 16 GB | 49.29 |
| Alienware x15 R2 P111F | i9-12900H 140 W / 140 W | GeForce RTX 3080 Ti Laptop GPU 140 W 16 GB | 32 GB | 52.41 |
| Lenovo Legion Pro 5 16IRX9 | i9-14900HX 187 W / 104 W | GeForce RTX 4070 Laptop GPU 140 W 1705 / 2050 MHz 8 GB | 32 GB | 58.86 |
| Lenovo Slim 7 Pro X 14ARH7 | R9 6900HS 65 W / 54 W | GeForce RTX 3050 4GB Laptop GPU 55 W 1057 / 1375 MHz 4 GB | 32 GB | 60.23 |
| Lenovo Yoga Pro 7 14ARP G8 6.0.1 x64 1024 MiB [C: 3.8% (36.3/953.1 GiB)] (x5) [Interval=5 sec] | R7 7735HS 60 W / 54 W | Radeon 680M | 16 GB | 60.3 |
| Eluktronics Mech-17 GP2 | i9-13900HX 160 W / 99 W | GeForce RTX 4090 Laptop GPU 175 W 2140 / 2375 MHz 16 GB | 32 GB | 61.83 |
| Asus Zenbook S 13 OLED 6.0.1 x64 1024 MiB [C: 4.9% (46.8/952.2 GiB)] (x5) [Interval=5 sec] | R7 6800U 30 W / 25 W | Radeon 680M 2200DC MHz | 16 GB | 67.08 |
| Lenovo Yoga Slim 7 14APU G8 6.0.1 x64 1024 MiB [C: 7.6% (72.4/951.6 GiB)] (x5) [Interval=5 sec] | R7 7840S 52 W / 42 W | Radeon 780M ? / 800 MHz | 32 GB | 67.7 |
| Dell XPS 14 2024 OLED 6.0.1 x64 1024 MiB [C: 9.2% (85.1/925.7 GiB)] (x5) [Interval=5 sec] | Ultra 7 155H 64 W / 30 W | GeForce RTX 4050 Laptop GPU 30 W 1605 / 2000 MHz 4 GB | 32 GB | 67.9 |
| HP ZBook Firefly 16 G9-6B897EA 6.0.1 x64 1024 MiB [C: 7.0% (66.5/952.7 GiB)] (x5) [Interval=5 sec] | i7-1265U 51 W / 12 W | T550 Laptop GPU 20 W 1665 / 1500 MHz 4 GB | 32 GB | 67.94 |
| Lenovo Yoga Pro 7 14APH G8 6.0.1 x64 1024 MiB [C: 15.9% (151.5/951.6 GiB)] (x5) [Interval=5 sec] | R7 7840HS 60 W / 54 W | Radeon 780M | 32 GB | 68.2 |
| Asus ROG Zephyrus G14 GA402XY 6.0.1 x64 1024 MiB [C: 8.2% (76.2/926.6 GiB)] (x5) [Interval=5 sec] | R9 7940HS 80 W / 80 W | GeForce RTX 4090 Laptop GPU 125 W 1455 / 2250 MHz 16 GB | 32 GB | 69 |
| LG Gram 16Z90Q | i7-1260P 43 W / 25 W | Iris Xe G7 96EUs 1400 / 2600 MHz | 16 GB | 70.34 |
| Lenovo Yoga Pro 7 14IRH G8 6.0.1 x64 1024 MiB [C: 13.8% (130.9/951.6 GiB)] (x5) [Interval=5 sec] | i7-13700H 80 W / 53 W | GeForce RTX 4050 Laptop GPU 55 W 1905 / 2000 MHz 6 GB | 16 GB | 71.8 |
| Uniwell Technology GM7AG8N Liquid Cooling Box | i9-12900H 140 W / 98 W | GeForce RTX 3080 Ti Laptop GPU 175 W 1590 / 2000 MHz 16 GB | 16 GB | 72.42 |
| Dell Precision 5480 | i9-13900H 88 W / 51 W | RTX 3000 Ada Generation Laptop 50 W 1530 / 2000 MHz 8 GB | 64 GB | 72.46 |
| Lenovo Legion 5 Pro 16ARH7H RTX 3070 Ti | R7 6800H 90 W / 90 W | GeForce RTX 3070 Ti Laptop GPU 150 W 1510 / 1800 MHz 8 GB | 32 GB | 72.6 |
| Lenovo Yoga Pro 9-14IRP G8 6.0.1 x64 1024 MiB [C: 8.6% (81.6/951.6 GiB)] (x5) [Interval=5 sec] | i7-13705H 104 W / 75 W | GeForce RTX 4050 Laptop GPU 80 W 2055 / 2000 MHz 6 GB | 32 GB | 72.6 |
| Lenovo Slim Pro 9i 16IRP8 | i9-13905H 123 W / 85 W | GeForce RTX 4050 Laptop GPU 100 W 2055 / 2000 MHz 6 GB | 32 GB | 72.95 |
| Dell Precision 5000 5470 | i9-12900H 91 W / 20 W | RTX A1000 Laptop GPU 40 W 1140 / 1375 MHz 4 GB | 32 GB | 73.28 |
| Lenovo Yoga Pro 9 16-IRP G8 6.0.1 x64 1024 MiB [C: 7.1% (67.9/951.6 GiB)] (x5) [Interval=5 sec] | i7-13705H 125 W / 80 W | GeForce RTX 4060 Laptop GPU 100 W 8 GB | 16 GB | 74 |
| Lenovo ThinkPad T14 G3-21AJS00400 6.0.1 x64 1024 MiB [C: 6.0% (57.5/951.6 GiB)] (x5) [Interval=5 sec] | i7-1260P 58 W / 42 W | GeForce MX550 30 W 1710 / 1500 MHz 2 GB | 16 GB | 74.9 |
| Lenovo Yoga Slim 7 Carbon 13IAP7-82U9005FGE 6.0.1 x64 1024 MiB [C: 19.6% (186.5/951.6 GiB)] (x5) [Interval=5 sec] | i7-1260P 46 W / 28 W | Iris Xe G7 96EUs 1400 / 2400 MHz | 16 GB | 76.14 |
| HP ZBook Power 15 G9 6B8C4EA 6.0.1 x64 1024 MiB [C: 7.2% (68.3/952.7 GiB)] (x5) [Interval=5 sec] | i7-12700H 90 W / 55 W | RTX A2000 Laptop GPU 45 W 1335 / 1368 MHz 8 GB | 32 GB | 76.6 |
| Asus ZenBook S13 OLED UX5304 6.0.1 x64 1024 MiB [C: 5.5% (52.1/952.4 GiB)] (x5) [Interval=5 sec] | i7-1355U 44 W / 17 W | Iris Xe G7 96EUs 1300 MHz | 16 GB | 76.9 |
| Razer Blade 16 RTX 5080 | Ryzen AI 9 365 80 W / 75 W | GeForce RTX 5080 Laptop 160 W 1500 / 1750 MHz 16 GB | 32 GB | 77.25 |
| Dell XPS 13 Plus 9320 4K 6.0.1 x64 1024 MiB [C: 15.9% (148.3/934.4 GiB)] (x5) [Interval=5 sec] | i7-1260P 64 W / 34 W | Iris Xe G7 96EUs 1400 MHz | 32 GB | 77.34 |
| Razer Blade 14 2025 6.0.1 x64 1024 MiB [C: 9.7% (90.3/927.8 GiB)] (x5) [Interval=5 sec] | Ryzen AI 9 365 70 W / 60 W | GeForce RTX 5070 Laptop 115 W 2632 / 1500 MHz | 32 GB | 77.4 |
| Acer Nitro 16 AN16-41 | R7 7735HS 100 W / 75 W | GeForce RTX 4070 Laptop GPU 140 W 1980 / 2000 MHz 8 GB | 16 GB | 78.15 |
| Acer Nitro 17 AN17-41-R9LN | R7 7735HS 100 W / 65 W | GeForce RTX 4070 Laptop GPU 140 W 1980 / 1963 MHz 8 GB | 16 GB | 78.62 |
| LG Gram 15Z90Q | i5-1240P 43 W / 13 W | Iris Xe G7 80EUs 1300 / 2600 MHz | 16 GB | 78.83 |
| Nubia RedMagic Titan 16 Pro | i9-14900HX 140 W / 45 W | GeForce RTX 4060 Laptop GPU 140 W 2250 / 2000 MHz 8 GB | 16 GB | 79.06 |
| Lenovo ThinkPad X1 Carbon G9-20XWCTO1WW | i7-1165G7 36 W / 28 W | Iris Xe G7 96EUs | 32 GB | 80.5 |
| Razer Blade 14 Ryzen 9 6900HX | R9 6900HX 90 W / 75 W | GeForce RTX 3070 Ti Laptop GPU 100 W 1035 / 1500 MHz 8 GB | 16 GB | 80.58 |
| Razer Blade 15 OLED (Early 2022) | i9-12900H 160 W / 65 W | GeForce RTX 3070 Ti Laptop GPU 110 W 1035 / 1500 MHz 8 GB | 16 GB | 80.7 |
| Razer Blade 14 RTX 4070 | R9 7940HS 88 W / 80 W | GeForce RTX 4070 Laptop GPU 140 W 1980 / 2000 MHz 8 GB | 16 GB | 81.48 |
| Dell XPS 17 9720 RTX 3060 | i7-12700H 155 W / 55 W | GeForce RTX 3060 Laptop GPU 65 W 1282 / 1500 MHz 6 GB | 32 GB | 81.97 |
| MSI Titan GT77 12UHS | i9-12900HX 200 W / 125 W | GeForce RTX 3080 Ti Laptop GPU 175 W 16 GB | 64 GB | 82.19 |
| Razer Blade 14 RZ09-0508 | R9 8945HS 90 W / 75 W | GeForce RTX 4070 Laptop GPU 140 W 1605 / 2000 MHz 8 GB | 32 GB | 83.06 |
| Alienware m15 R6, i7-11800H RTX 3080 | i7-11800H 90 W / 50 W | GeForce RTX 3080 Laptop GPU 125 W 8 GB | 32 GB | 83.1 |
| Asus ProArt StudioBook 16 H7600ZW | i9-12900H 115 W / 110 W | GeForce RTX 3070 Ti Laptop GPU 115 W 8 GB | 32 GB | 83.33 |
| Lenovo Legion Pro 5 16ARX8 | R7 7745HX 110 W / 97 W | GeForce RTX 4070 Laptop GPU 140 W 1755 / 2050 MHz 8 GB | 16 GB | 83.67 |
| Lenovo Legion Pro 5 16IRX9 G9 6.0.0 x64 1024 MiB [C: 27.0% (257.1/951.6 GiB)] (x5) [Interval=5 sec] | i7-14700HX 190 W / 130 W | GeForce RTX 4060 Laptop GPU 140 W 8 GB | 32 GB | 83.7 |
| Lenovo Legion Pro 7 16IRX8H | i9-13900HX 185 W / 130 W | GeForce RTX 4080 Laptop GPU 175 W 1665 / 2250 MHz 12 GB | 32 GB | 84.92 |
| Asus Zenbook 17 Fold UX9702 6.0.1 x64 1024 MiB [C: 5.2% (49.4/952.5 GiB)] (x5) [Interval=5 sec] | i7-1250U 29 W / 16 W | Iris Xe G7 80EUs 950 MHz | 16 GB | 85.26 |
| MSI Prestige 13 AI Evo 6.0.1 x64 1024 MiB [C: 14.6% (135.6/931.1 GiB)] (x5) [Interval=5 sec] | Ultra 7 155H | Arc 8-Core | 32 GB | 86.7 |
| Alienware m16 R2 | Ultra 7 155H 121 W / 102 W | GeForce RTX 4070 Laptop GPU 140 W 2005 / 2013 MHz 8 GB | 16 GB | 87.53 |
| Medion Erazer Beast X30 | i9-12900HK 120 W / 120 W | GeForce RTX 3080 Ti Laptop GPU 175 W 1590 / 2000 MHz 16 GB | 32 GB | 87.77 |
| MSI GE76 Raider 11UH-472US | i9-11980HK 200 W / 91.75 W | GeForce RTX 3080 Laptop GPU 165 W 1710 / 1750 MHz 16 GB | 64 GB | 88 |
| Maingear Vector Pro MG-VCP17 | i7-11800H 120 W / 120 W | GeForce RTX 3080 Laptop GPU 165 W 1605 / 1750 MHz 16 GB | 32 GB | 89 |
| Asus ExpertBook B7 Flip B7402FEA | i7-1195G7 51 W / 35 W | Iris Xe G7 96EUs 1400 MHz | 16 GB | 89.2 |
| Lenovo Yoga 9i 14 2022 i7-1260P 6.0.1 x64 1024 MiB [C: 8.3% (79.4/951.6 GiB)] (x5) [Interval=5 sec] | i7-1260P 64 W / 38 W | Iris Xe G7 96EUs 1400 / 2600 MHz | 16 GB | 89.41 |
| Gigabyte Aero 15 OLED XD | i7-11800H @4.6 GHz 109 W / 62 W | GeForce RTX 3070 Laptop GPU 105 W 1290 / 1500 MHz 8 GB | 32 GB | 89.5 |
| Razer Blade 17 (i7-12800H, RTX 3070 Ti) 6.0.0 x64 1024 MiB [C: 13.7% (127.7/934.5 GiB)] (x5) [Interval=5 sec] | i7-12800H 110 W / 60 W | GeForce RTX 3070 Ti Laptop GPU 150 W 8 GB | 16 GB | 89.6 |
| Razer Blade 17 RTX 3080 Ti | i7-12800H 107 W / 61 W | GeForce RTX 3080 Ti Laptop GPU 165 W 1395 / 2000 MHz 16 GB | 32 GB | 89.8 |
| Razer Blade 17 RTX 3070 | i7-11800H 160 W / 65 W | GeForce RTX 3070 Laptop GPU 130 W 1410 / 1500 MHz 8 GB | 16 GB | 90.1 |
| LG Gram 17 (2023) | i7-1360P 43 W / 26 W | Iris Xe G7 96EUs 1400 MHz | 16 GB | 90.18 |
| Razer Blade 17 Early 2022 | i9-12900H 160 W / 65 W | GeForce RTX 3080 Ti Laptop GPU 165 W 1395 / 2000 MHz 16 GB | 32 GB | 90.25 |
| Acer Predator Helios 300 (i7-12700H, RTX 3070 Ti) 6.0.0 x64 1024 MiB [C: 37.2% (354.4/952.6 GiB)] (x5) [Interval=5 sec] | i7-12700H 115 W / 115 W | GeForce RTX 3070 Ti Laptop GPU 150 W 8 GB | 32 GB | 90.69 |
| MSI Summit E14 Flip Evo A12MT | i7-1260P 72 W / 28 W | Iris Xe G7 96EUs 1400 / 2400 MHz | 32 GB | 90.75 |
| Lenovo Legion Pro 7 RTX4090 | i9-13900HX 185 W / 130 W | GeForce RTX 4090 Laptop GPU 175 W 1455 / 2250 MHz 16 GB | 32 GB | 91.26 |
| Acer Nitro 5 AN515-58-72QR | i7-12700H 115 W / 80 W | GeForce RTX 3070 Ti Laptop GPU 150 W 1410 / 1750 MHz 8 GB | 16 GB | 91.58 |
| Aorus 15P YD | i7-11800H 109 W / 45 W | GeForce RTX 3080 Laptop GPU 130 W 1545 / 1750 MHz 8 GB | 16 GB | 91.8 |
| MSI CreatorPro Z16P B12UKST 6.0.1 x64 1024 MiB [C: 9.7% (90.5/934.1 GiB)] (x5) [Interval=5 sec] | i7-12700H 74 W / 64 W | RTX A3000 Laptop GPU 90 W 1440 / 1750 MHz 12 GB | 32 GB | 92.21 |
| Razer Blade 15 Advanced Model Early 2022 5.2.0 x64 1024 MiB [C: 51.4% (480.7/934.5 GiB)] (x5) [Interval=5 sec] | i7-12800H 160 W / 65 W | GeForce RTX 3080 Ti Laptop GPU 110 W 1125 / 1750 MHz 16 GB | 32 GB | 92.87 |
| Lenovo ThinkPad X1 Yoga G6-20Y0S00200 5.2.1 x64 1024 MiB [C: 9.3% (88.3/953.3 GiB)] (x5) [Interval=5 sec] | i7-1165G7 48 W / 28 W | Iris Xe G7 96EUs | 32 GB | 93 |
| Lenovo Legion Slim 7i 16 Gen 8 | i9-13900H 107 W / 81 W | GeForce RTX 4070 Laptop GPU 140 W 1845 / 2050 MHz 8 GB | 16 GB | 93.35 |
| Lenovo Legion 5 16IRX G9 6.0.1 x64 1024 MiB [C: 7.7% (73.7/951.6 GiB)] (x5) [Interval=5 sec] | i7-14650HX 140 W / 100 W | GeForce RTX 4060 Laptop GPU 125 W 2430 / 2050 MHz 8 GB | 16 GB | 93.5 |
| MSI Stealth 14 Studio A13V 6.0.1 x64 1024 MiB [C: 38.8% (358.9/926.3 GiB)] (x5) [Interval=5 sec] | i7-13700H 110 W / 85 W | GeForce RTX 4050 Laptop GPU 90 W 2370 / 2000 MHz 6 GB | 16 GB | 93.7 |
| Asus ExpertBook B2 Flip B2502FBA-N80141X | i7-1260P 64 W / 28 W | Iris Xe G7 96EUs 1400 MHz | 32 GB | 95.81 |
| Lenovo Legion 5 Pro 16 G7 i7 RTX 3070Ti 6.0.1 x64 1024 MiB [C: 9.5% (90.8/951.6 GiB)] (x5) [Interval=5 sec] | i7-12700H 124 W / 108 W | GeForce RTX 3070 Ti Laptop GPU 150 W 1702 / 1750 MHz 8 GB | 16 GB | 95.9 |
| Acer Swift X SFX14-71G 6.0.1 x64 1024 MiB [C: 6.5% (61.6/952.6 GiB)] (x5) [Interval=5 sec] | i7-13700H 80 W / 40 W | GeForce RTX 4050 Laptop GPU 50 W 1605 / 2000 MHz 6 GB | 16 GB | 96 |
| MSI GE67 HX 12UGS | i7-12800HX 190 W / 110 W | GeForce RTX 3070 Ti Laptop GPU 150 W 1555 / 1750 MHz 8 GB | 16 GB | 96.32 |
| Model | CPU | GPU | RAM | Value |
|---|---|---|---|---|
| Schenker XMG Pro 15 (Late 2021) | i7-11800H 135 W / 55 W | GeForce RTX 3080 Laptop GPU 105 W 1245 / 1500 MHz 16 GB | 32 GB | 64.5 |
| Schenker XMG Neo 15 (i7-12700H, RTX 3080 Ti) 6.0.0 x64 1024 MiB [C: 42.4% (394.2/930.4 GiB)] (x5) [Interval=5 sec] | i7-12700H 95 W / 95 W | GeForce RTX 3080 Ti Laptop GPU 175 W 16 GB | 32 GB | 74.47 |
| Schenker Vision 16 Pro RTX 3070 Ti 6.0.1 x64 1024 MiB [C: 7.6% (71.1/930.4 GiB)] (x5) [Interval=5 sec] | i7-12700H 45 W / 45 W | GeForce RTX 3070 Ti Laptop GPU 95 W 1035 / 1500 MHz 8 GB | 32 GB | 74.83 |
| Schenker XMG Pro 15 (i7-12700H, RTX 3080 Ti) 6.0.0 x64 1024 MiB [C: 39.7% (369.3/930.4 GiB)] (x5) [Interval=5 sec] | i7-12700H 115 W / 45 W | GeForce RTX 3080 Ti Laptop GPU 155 W 16 GB | 32 GB | 77.03 |
| Schenker XMG Neo 17 M22 | R9 6900HX 85 W / 45 W | GeForce RTX 3080 Ti Laptop GPU 175 W 1590 / 2000 MHz 16 GB | 32 GB | 77.84 |
| Schenker XMG Neo 15 Tiger Lake 5.2.0 x64 1024 MiB [C: 10.3% (96.1/930.9 GiB)] (x5) [Interval=5 sec] | i7-11800H 120 W / 120 W | GeForce RTX 3080 Laptop GPU 165 W 1605 / 1750 MHz 16 GB | 32 GB | 79 |
| Schenker Vision 15 5.2.1 x64 1024 MiB [C: 40.9% (194.7/476.3 GiB)] (x5) [Interval=5 sec] | i7-1165G7 50 W / 40 W | Iris Xe G7 96EUs 1300 / 1600 MHz | 16 GB | 79.2 |
| Eurocom Raptor X15 | i7-12700K 98 W / 70 W | GeForce RTX 3070 Ti Laptop GPU 140 W 1410 / 1750 MHz 8 GB | 32 GB | 84.47 |
| Eurocom Nightsky ARX315 | R9 5900X | GeForce RTX 3070 Laptop GPU 115 W 1560 / 1750 MHz 8 GB | 32 GB | 85.7 |
| Schenker XMG Apex 15 Max | R9 5900X | GeForce RTX 3070 Laptop GPU 115 W 1560 / 1750 MHz 8 GB | 32 GB | 87.92 |
| Schenker Vision 14 2022 RTX 3050 Ti 6.0.2 x64 1024 MiB [C: 7.6% (71.0/930.4 GiB)] (x5) [Interval=5 sec] | i7-12700H 60 W / 40 W | GeForce RTX 3050 Ti Laptop GPU 45 W 1635 / 1375 MHz 4 GB | 32 GB | 88.59 |
| Schenker XMG NEO 17 GM7TG8S 5.2.1 x64 1024 MiB [C: 11.0% (102.0/926.1 GiB)] (x5) [Interval=5 sec] | i7-11800H 75 W / 75 W | GeForce RTX 3080 Laptop GPU 165 W 16 GB | 32 GB | 90.3 |
| Eurocom RX315 NH57AF1 | i7-11800H 95 W / 54 W | GeForce RTX 3070 Laptop GPU 1290 / 1500 MHz 8 GB | 32 GB | 90.7 |
| Schenker Vision 14 5.2.1 x64 1024 MiB [C: 15.4% (143.8/930.9 GiB)] (x5) [Interval=5 sec] | i7-1165G7 60 W / 30 W | Iris Xe G7 96EUs 1300 / 2000 MHz | 16 GB | 90.9 |
| Schenker XMG Fusion 15 (Mid 22) | i7-11800H 65 W / 45 W | GeForce RTX 3070 Laptop GPU 145 W 1290 / 1500 MHz 8 GB | 32 GB | 90.92 |
| Schenker Work 15 Tiger Lake-H | i7-11370H 44 W / 35 W | Iris Xe G7 96EUs | 16 GB | 92.8 |
| Schenker Work 17 Tiger Lake-H | i7-11370H 45 W / 35 W | Iris Xe G7 96EUs | 32 GB | 92.8 |
| Schenker XMG Pro 17 (Late 2021, RTX 3080) 6.0.0 x64 1024 MiB [C: 36.5% (339.7/930.4 GiB)] (x5) [Interval=5 sec] | i7-11800H 135 W / 55 W | GeForce RTX 3080 Laptop GPU 105 W 16 GB | 32 GB | 93.2 |
| Eurocom Nightsky TXi317 | i7-12700H 110 W / 76 W | GeForce RTX 3080 Ti Laptop GPU 155 W 1485 / 2000 MHz 16 GB | 64 GB | 93.31 |
| Schenker Vision 14 6.0.1 x64 1024 MiB [C: 15.9% (148.3/930.4 GiB)] (x5) [Interval=5 sec] | i7-11370H 46 W / 40 W | GeForce RTX 3050 Ti Laptop GPU 35 W 4 GB | 32 GB | 94.1 |
| Model | CPU | GPU | RAM | Value |
|---|---|---|---|---|
| Schenker XMG Pro 15 (Late 2021) | i7-11800H 135 W / 55 W | GeForce RTX 3080 Laptop GPU 105 W 1245 / 1500 MHz 16 GB | 32 GB | 2223 |
| Schenker XMG Neo 15 Tiger Lake 5.2.0 x64 1024 MiB [C: 10.3% (96.1/930.9 GiB)] (x5) [Interval=5 sec] | i7-11800H 120 W / 120 W | GeForce RTX 3080 Laptop GPU 165 W 1605 / 1750 MHz 16 GB | 32 GB | 2865 |
| Eurocom Nightsky ARX315 | R9 5900X | GeForce RTX 3070 Laptop GPU 115 W 1560 / 1750 MHz 8 GB | 32 GB | 2871 |
| Schenker XMG Neo 17 M22 | R9 6900HX 85 W / 45 W | GeForce RTX 3080 Ti Laptop GPU 175 W 1590 / 2000 MHz 16 GB | 32 GB | 4080 |
| Schenker Vision 15 5.2.1 x64 1024 MiB [C: 40.9% (194.7/476.3 GiB)] (x5) [Interval=5 sec] | i7-1165G7 50 W / 40 W | Iris Xe G7 96EUs 1300 / 1600 MHz | 16 GB | 4139 |
| Eurocom Raptor X15 | i7-12700K 98 W / 70 W | GeForce RTX 3070 Ti Laptop GPU 140 W 1410 / 1750 MHz 8 GB | 32 GB | 4226 |
| Schenker Vision 14 5.2.1 x64 1024 MiB [C: 15.4% (143.8/930.9 GiB)] (x5) [Interval=5 sec] | i7-1165G7 60 W / 30 W | Iris Xe G7 96EUs 1300 / 2000 MHz | 16 GB | 4236 |
| Schenker Work 15 Tiger Lake-H | i7-11370H 44 W / 35 W | Iris Xe G7 96EUs | 16 GB | 4276 |
| Schenker XMG NEO 17 GM7TG8S 5.2.1 x64 1024 MiB [C: 11.0% (102.0/926.1 GiB)] (x5) [Interval=5 sec] | i7-11800H 75 W / 75 W | GeForce RTX 3080 Laptop GPU 165 W 16 GB | 32 GB | 4289 |
| Schenker Work 17 Tiger Lake-H | i7-11370H 45 W / 35 W | Iris Xe G7 96EUs | 32 GB | 4289 |
| Schenker XMG Fusion 15 (Mid 22) | i7-11800H 65 W / 45 W | GeForce RTX 3070 Laptop GPU 145 W 1290 / 1500 MHz 8 GB | 32 GB | 4294 |
| Schenker XMG Apex 15 Max | R9 5900X | GeForce RTX 3070 Laptop GPU 115 W 1560 / 1750 MHz 8 GB | 32 GB | 4301 |
| Eurocom RX315 NH57AF1 | i7-11800H 95 W / 54 W | GeForce RTX 3070 Laptop GPU 1290 / 1500 MHz 8 GB | 32 GB | 4306 |
| Eurocom Nightsky TXi317 | i7-12700H 110 W / 76 W | GeForce RTX 3080 Ti Laptop GPU 155 W 1485 / 2000 MHz 16 GB | 64 GB | 4357 |
| Model | CPU | GPU | RAM | Value |
|---|---|---|---|---|
| Eurocom Nightsky ARX315 | R9 5900X | GeForce RTX 3070 Laptop GPU 115 W 1560 / 1750 MHz 8 GB | 32 GB | 2696 |
| Schenker XMG Neo 15 Tiger Lake 5.2.0 x64 1024 MiB [C: 10.3% (96.1/930.9 GiB)] (x5) [Interval=5 sec] | i7-11800H 120 W / 120 W | GeForce RTX 3080 Laptop GPU 165 W 1605 / 1750 MHz 16 GB | 32 GB | 3411 |
| Schenker XMG Pro 15 (Late 2021) | i7-11800H 135 W / 55 W | GeForce RTX 3080 Laptop GPU 105 W 1245 / 1500 MHz 16 GB | 32 GB | 3910 |
| Schenker XMG Neo 17 M22 | R9 6900HX 85 W / 45 W | GeForce RTX 3080 Ti Laptop GPU 175 W 1590 / 2000 MHz 16 GB | 32 GB | 3954 |
| Schenker Vision 14 5.2.1 x64 1024 MiB [C: 15.4% (143.8/930.9 GiB)] (x5) [Interval=5 sec] | i7-1165G7 60 W / 30 W | Iris Xe G7 96EUs 1300 / 2000 MHz | 16 GB | 4101 |
| Schenker Vision 15 5.2.1 x64 1024 MiB [C: 40.9% (194.7/476.3 GiB)] (x5) [Interval=5 sec] | i7-1165G7 50 W / 40 W | Iris Xe G7 96EUs 1300 / 1600 MHz | 16 GB | 4133 |
| Schenker XMG Apex 15 Max | R9 5900X | GeForce RTX 3070 Laptop GPU 115 W 1560 / 1750 MHz 8 GB | 32 GB | 4169 |
| Schenker XMG Fusion 15 (Mid 22) | i7-11800H 65 W / 45 W | GeForce RTX 3070 Laptop GPU 145 W 1290 / 1500 MHz 8 GB | 32 GB | 4176 |
| Eurocom Raptor X15 | i7-12700K 98 W / 70 W | GeForce RTX 3070 Ti Laptop GPU 140 W 1410 / 1750 MHz 8 GB | 32 GB | 4199 |
| Eurocom Nightsky TXi317 | i7-12700H 110 W / 76 W | GeForce RTX 3080 Ti Laptop GPU 155 W 1485 / 2000 MHz 16 GB | 64 GB | 4208 |
| Schenker XMG NEO 17 GM7TG8S 5.2.1 x64 1024 MiB [C: 11.0% (102.0/926.1 GiB)] (x5) [Interval=5 sec] | i7-11800H 75 W / 75 W | GeForce RTX 3080 Laptop GPU 165 W 16 GB | 32 GB | 4228 |
| Schenker Work 15 Tiger Lake-H | i7-11370H 44 W / 35 W | Iris Xe G7 96EUs | 16 GB | 4262 |
| Schenker Work 17 Tiger Lake-H | i7-11370H 45 W / 35 W | Iris Xe G7 96EUs | 32 GB | 4263 |
| Eurocom RX315 NH57AF1 | i7-11800H 95 W / 54 W | GeForce RTX 3070 Laptop GPU 1290 / 1500 MHz 8 GB | 32 GB | 4272 |
| Model | CPU | GPU | RAM | Value |
|---|---|---|---|---|
| HP ZBook Firefly 16 G9-6B897EA 6.0.1 x64 1024 MiB [C: 7.0% (66.5/952.7 GiB)] (x5) [Interval=5 sec] | i7-1265U 51 W / 12 W | T550 Laptop GPU 20 W 1665 / 1500 MHz 4 GB | 32 GB | 315.45 |
| Lenovo Slim 7 Pro X 14ARH7 | R9 6900HS 65 W / 54 W | GeForce RTX 3050 4GB Laptop GPU 55 W 1057 / 1375 MHz 4 GB | 32 GB | 325.8 |
| Uniwell Technology GM7AG8N Liquid Cooling Box | i9-12900H 140 W / 98 W | GeForce RTX 3080 Ti Laptop GPU 175 W 1590 / 2000 MHz 16 GB | 16 GB | 341.5 |
| Asus Zenbook 17 Fold UX9702 6.0.1 x64 1024 MiB [C: 5.2% (49.4/952.5 GiB)] (x5) [Interval=5 sec] | i7-1250U 29 W / 16 W | Iris Xe G7 80EUs 950 MHz | 16 GB | 348.19 |
| LG Gram 16Z90Q | i7-1260P 43 W / 25 W | Iris Xe G7 96EUs 1400 / 2600 MHz | 16 GB | 352.9 |
| Asus ZenBook S13 OLED UX5304 6.0.1 x64 1024 MiB [C: 5.5% (52.1/952.4 GiB)] (x5) [Interval=5 sec] | i7-1355U 44 W / 17 W | Iris Xe G7 96EUs 1300 MHz | 16 GB | 355 |
| Lenovo Yoga Pro 7 14ARP G8 6.0.1 x64 1024 MiB [C: 3.8% (36.3/953.1 GiB)] (x5) [Interval=5 sec] | R7 7735HS 60 W / 54 W | Radeon 680M | 16 GB | 356 |
| Lenovo Yoga Slim 7 Carbon 13IAP7-82U9005FGE 6.0.1 x64 1024 MiB [C: 19.6% (186.5/951.6 GiB)] (x5) [Interval=5 sec] | i7-1260P 46 W / 28 W | Iris Xe G7 96EUs 1400 / 2400 MHz | 16 GB | 361.36 |
| Lenovo ThinkPad T14 G3-21AJS00400 6.0.1 x64 1024 MiB [C: 6.0% (57.5/951.6 GiB)] (x5) [Interval=5 sec] | i7-1260P 58 W / 42 W | GeForce MX550 30 W 1710 / 1500 MHz 2 GB | 16 GB | 375 |
| Dell XPS 13 Plus 9320 4K 6.0.1 x64 1024 MiB [C: 15.9% (148.3/934.4 GiB)] (x5) [Interval=5 sec] | i7-1260P 64 W / 34 W | Iris Xe G7 96EUs 1400 MHz | 32 GB | 375.49 |
| Dell XPS 14 2024 OLED 6.0.1 x64 1024 MiB [C: 9.2% (85.1/925.7 GiB)] (x5) [Interval=5 sec] | Ultra 7 155H 64 W / 30 W | GeForce RTX 4050 Laptop GPU 30 W 1605 / 2000 MHz 4 GB | 32 GB | 378 |
| MSI Prestige 13 AI Evo 6.0.1 x64 1024 MiB [C: 14.6% (135.6/931.1 GiB)] (x5) [Interval=5 sec] | Ultra 7 155H | Arc 8-Core | 32 GB | 385 |
| Razer Blade 14 RZ09-0508 | R9 8945HS 90 W / 75 W | GeForce RTX 4070 Laptop GPU 140 W 1605 / 2000 MHz 8 GB | 32 GB | 391.8 |
| Dell Precision 5000 5470 | i9-12900H 91 W / 20 W | RTX A1000 Laptop GPU 40 W 1140 / 1375 MHz 4 GB | 32 GB | 395.7 |
| Lenovo Yoga Pro 7 14IRH G8 6.0.1 x64 1024 MiB [C: 13.8% (130.9/951.6 GiB)] (x5) [Interval=5 sec] | i7-13700H 80 W / 53 W | GeForce RTX 4050 Laptop GPU 55 W 1905 / 2000 MHz 6 GB | 16 GB | 397 |
| Alienware m16 R2 | Ultra 7 155H 121 W / 102 W | GeForce RTX 4070 Laptop GPU 140 W 2005 / 2013 MHz 8 GB | 16 GB | 398.8 |
| HP ZBook Power 15 G9 6B8C4EA 6.0.1 x64 1024 MiB [C: 7.2% (68.3/952.7 GiB)] (x5) [Interval=5 sec] | i7-12700H 90 W / 55 W | RTX A2000 Laptop GPU 45 W 1335 / 1368 MHz 8 GB | 32 GB | 400.34 |
| Acer Predator Helios 300 (i7-12700H, RTX 3070 Ti) 6.0.0 x64 1024 MiB [C: 37.2% (354.4/952.6 GiB)] (x5) [Interval=5 sec] | i7-12700H 115 W / 115 W | GeForce RTX 3070 Ti Laptop GPU 150 W 8 GB | 32 GB | 403.78 |
| Acer Nitro 17 AN17-41-R9LN | R7 7735HS 100 W / 65 W | GeForce RTX 4070 Laptop GPU 140 W 1980 / 1963 MHz 8 GB | 16 GB | 405.5 |
| Lenovo Yoga 9i 14 2022 i7-1260P 6.0.1 x64 1024 MiB [C: 8.3% (79.4/951.6 GiB)] (x5) [Interval=5 sec] | i7-1260P 64 W / 38 W | Iris Xe G7 96EUs 1400 / 2600 MHz | 16 GB | 420.37 |
| Lenovo Yoga Slim 7 14APU G8 6.0.1 x64 1024 MiB [C: 7.6% (72.4/951.6 GiB)] (x5) [Interval=5 sec] | R7 7840S 52 W / 42 W | Radeon 780M ? / 800 MHz | 32 GB | 421 |
| Medion Erazer Beast X30 | i9-12900HK 120 W / 120 W | GeForce RTX 3080 Ti Laptop GPU 175 W 1590 / 2000 MHz 16 GB | 32 GB | 421.8 |
| LG Gram 15Z90Q | i5-1240P 43 W / 13 W | Iris Xe G7 80EUs 1300 / 2600 MHz | 16 GB | 425.2 |
| Lenovo Yoga Pro 7 14APH G8 6.0.1 x64 1024 MiB [C: 15.9% (151.5/951.6 GiB)] (x5) [Interval=5 sec] | R7 7840HS 60 W / 54 W | Radeon 780M | 32 GB | 427 |
| Acer Nitro 5 AN515-58-72QR | i7-12700H 115 W / 80 W | GeForce RTX 3070 Ti Laptop GPU 150 W 1410 / 1750 MHz 8 GB | 16 GB | 428.2 |
| Acer Nitro 16 AN16-41 | R7 7735HS 100 W / 75 W | GeForce RTX 4070 Laptop GPU 140 W 1980 / 2000 MHz 8 GB | 16 GB | 442.5 |
| Lenovo Yoga Pro 9-14IRP G8 6.0.1 x64 1024 MiB [C: 8.6% (81.6/951.6 GiB)] (x5) [Interval=5 sec] | i7-13705H 104 W / 75 W | GeForce RTX 4050 Laptop GPU 80 W 2055 / 2000 MHz 6 GB | 32 GB | 448 |
| Asus ROG Zephyrus G14 GA402XY 6.0.1 x64 1024 MiB [C: 8.2% (76.2/926.6 GiB)] (x5) [Interval=5 sec] | R9 7940HS 80 W / 80 W | GeForce RTX 4090 Laptop GPU 125 W 1455 / 2250 MHz 16 GB | 32 GB | 450 |
| Razer Blade 15 OLED (Early 2022) | i9-12900H 160 W / 65 W | GeForce RTX 3070 Ti Laptop GPU 110 W 1035 / 1500 MHz 8 GB | 16 GB | 454.2 |
| Lenovo Yoga Pro 9 16-IRP G8 6.0.1 x64 1024 MiB [C: 7.1% (67.9/951.6 GiB)] (x5) [Interval=5 sec] | i7-13705H 125 W / 80 W | GeForce RTX 4060 Laptop GPU 100 W 8 GB | 16 GB | 459 |
| MSI Summit E14 Flip Evo A12MT | i7-1260P 72 W / 28 W | Iris Xe G7 96EUs 1400 / 2400 MHz | 32 GB | 460.3 |
| Razer Blade 17 (i7-12800H, RTX 3070 Ti) 6.0.0 x64 1024 MiB [C: 13.7% (127.7/934.5 GiB)] (x5) [Interval=5 sec] | i7-12800H 110 W / 60 W | GeForce RTX 3070 Ti Laptop GPU 150 W 8 GB | 16 GB | 463.71 |
| Dell Precision 5480 | i9-13900H 88 W / 51 W | RTX 3000 Ada Generation Laptop 50 W 1530 / 2000 MHz 8 GB | 64 GB | 464.2 |
| Lenovo Slim Pro 9i 16IRP8 | i9-13905H 123 W / 85 W | GeForce RTX 4050 Laptop GPU 100 W 2055 / 2000 MHz 6 GB | 32 GB | 471.5 |
| Razer Blade 17 RTX 3080 Ti | i7-12800H 107 W / 61 W | GeForce RTX 3080 Ti Laptop GPU 165 W 1395 / 2000 MHz 16 GB | 32 GB | 475.2 |
| Razer Blade 17 Early 2022 | i9-12900H 160 W / 65 W | GeForce RTX 3080 Ti Laptop GPU 165 W 1395 / 2000 MHz 16 GB | 32 GB | 479.8 |
| Alienware x15 R2 P111F | i9-12900H 140 W / 140 W | GeForce RTX 3080 Ti Laptop GPU 140 W 16 GB | 32 GB | 482 |
| Eluktronics Mech-17 GP2 | i9-13900HX 160 W / 99 W | GeForce RTX 4090 Laptop GPU 175 W 2140 / 2375 MHz 16 GB | 32 GB | 494.9 |
| Razer Blade 14 RTX 4070 | R9 7940HS 88 W / 80 W | GeForce RTX 4070 Laptop GPU 140 W 1980 / 2000 MHz 8 GB | 16 GB | 497.7 |
| Lenovo Legion Pro 5 16IRX9 G9 6.0.0 x64 1024 MiB [C: 27.0% (257.1/951.6 GiB)] (x5) [Interval=5 sec] | i7-14700HX 190 W / 130 W | GeForce RTX 4060 Laptop GPU 140 W 8 GB | 32 GB | 498 |
| Lenovo Legion 5 Pro 16ARH7H RTX 3070 Ti | R7 6800H 90 W / 90 W | GeForce RTX 3070 Ti Laptop GPU 150 W 1510 / 1800 MHz 8 GB | 32 GB | 504.8 |
| Lenovo ThinkPad X1 Carbon G9-20XWCTO1WW | i7-1165G7 36 W / 28 W | Iris Xe G7 96EUs | 32 GB | 513 |
| Asus Zenbook S 13 OLED 6.0.1 x64 1024 MiB [C: 4.9% (46.8/952.2 GiB)] (x5) [Interval=5 sec] | R7 6800U 30 W / 25 W | Radeon 680M 2200DC MHz | 16 GB | 515.54 |
| Lenovo Legion 5 16IRX G9 6.0.1 x64 1024 MiB [C: 7.7% (73.7/951.6 GiB)] (x5) [Interval=5 sec] | i7-14650HX 140 W / 100 W | GeForce RTX 4060 Laptop GPU 125 W 2430 / 2050 MHz 8 GB | 16 GB | 517 |
| Razer Blade 14 Ryzen 9 6900HX | R9 6900HX 90 W / 75 W | GeForce RTX 3070 Ti Laptop GPU 100 W 1035 / 1500 MHz 8 GB | 16 GB | 517.1 |
| Lenovo Legion Pro 5 16IRX9 | i9-14900HX 187 W / 104 W | GeForce RTX 4070 Laptop GPU 140 W 1705 / 2050 MHz 8 GB | 32 GB | 524.8 |
| Dell XPS 17 9720 RTX 3060 | i7-12700H 155 W / 55 W | GeForce RTX 3060 Laptop GPU 65 W 1282 / 1500 MHz 6 GB | 32 GB | 536.8 |
| HP Omen 16-n0033dx | R7 6800H 93 W / 64 W | Radeon RX 6650M 105 W ? / 2000 MHz 8 GB | 16 GB | 537 |
| Razer Blade 17 RTX 3070 | i7-11800H 160 W / 65 W | GeForce RTX 3070 Laptop GPU 130 W 1410 / 1500 MHz 8 GB | 16 GB | 538 |
| Lenovo Legion Pro 7 16IRX8H | i9-13900HX 185 W / 130 W | GeForce RTX 4080 Laptop GPU 175 W 1665 / 2250 MHz 12 GB | 32 GB | 538 |
| Asus ProArt StudioBook 16 H7600ZW | i9-12900H 115 W / 110 W | GeForce RTX 3070 Ti Laptop GPU 115 W 8 GB | 32 GB | 540.4 |
| Alienware m15 R6, i7-11800H RTX 3080 | i7-11800H 90 W / 50 W | GeForce RTX 3080 Laptop GPU 125 W 8 GB | 32 GB | 544 |
| Razer Blade 16 RTX 5080 | Ryzen AI 9 365 80 W / 75 W | GeForce RTX 5080 Laptop 160 W 1500 / 1750 MHz 16 GB | 32 GB | 544.1 |
| Razer Blade 14 2025 6.0.1 x64 1024 MiB [C: 9.7% (90.3/927.8 GiB)] (x5) [Interval=5 sec] | Ryzen AI 9 365 70 W / 60 W | GeForce RTX 5070 Laptop 115 W 2632 / 1500 MHz | 32 GB | 549 |
| LG Gram 17 (2023) | i7-1360P 43 W / 26 W | Iris Xe G7 96EUs 1400 MHz | 16 GB | 559.2 |
| Asus ExpertBook B7 Flip B7402FEA | i7-1195G7 51 W / 35 W | Iris Xe G7 96EUs 1400 MHz | 16 GB | 560 |
| Lenovo Legion Pro 5 16ARX8 | R7 7745HX 110 W / 97 W | GeForce RTX 4070 Laptop GPU 140 W 1755 / 2050 MHz 8 GB | 16 GB | 562.5 |
| MSI Stealth 14 Studio A13V 6.0.1 x64 1024 MiB [C: 38.8% (358.9/926.3 GiB)] (x5) [Interval=5 sec] | i7-13700H 110 W / 85 W | GeForce RTX 4050 Laptop GPU 90 W 2370 / 2000 MHz 6 GB | 16 GB | 582 |
| Asus ExpertBook B2 Flip B2502FBA-N80141X | i7-1260P 64 W / 28 W | Iris Xe G7 96EUs 1400 MHz | 32 GB | 611.9 |
| Maingear Vector Pro MG-VCP17 | i7-11800H 120 W / 120 W | GeForce RTX 3080 Laptop GPU 165 W 1605 / 1750 MHz 16 GB | 32 GB | 614 |
| Razer Blade 15 Advanced Model Early 2022 5.2.0 x64 1024 MiB [C: 51.4% (480.7/934.5 GiB)] (x5) [Interval=5 sec] | i7-12800H 160 W / 65 W | GeForce RTX 3080 Ti Laptop GPU 110 W 1125 / 1750 MHz 16 GB | 32 GB | 631.75 |
| Lenovo Legion Slim 7i 16 Gen 8 | i9-13900H 107 W / 81 W | GeForce RTX 4070 Laptop GPU 140 W 1845 / 2050 MHz 8 GB | 16 GB | 641.1 |
| Gigabyte Aero 15 OLED XD | i7-11800H @4.6 GHz 109 W / 62 W | GeForce RTX 3070 Laptop GPU 105 W 1290 / 1500 MHz 8 GB | 32 GB | 648 |
| Lenovo Legion Pro 7 RTX4090 | i9-13900HX 185 W / 130 W | GeForce RTX 4090 Laptop GPU 175 W 1455 / 2250 MHz 16 GB | 32 GB | 652.7 |
| Aorus 15P YD | i7-11800H 109 W / 45 W | GeForce RTX 3080 Laptop GPU 130 W 1545 / 1750 MHz 8 GB | 16 GB | 656 |
| Lenovo Legion 5 Pro 16 G7 i7 RTX 3070Ti 6.0.1 x64 1024 MiB [C: 9.5% (90.8/951.6 GiB)] (x5) [Interval=5 sec] | i7-12700H 124 W / 108 W | GeForce RTX 3070 Ti Laptop GPU 150 W 1702 / 1750 MHz 8 GB | 16 GB | 661 |
| Lenovo ThinkPad X1 Yoga G6-20Y0S00200 5.2.1 x64 1024 MiB [C: 9.3% (88.3/953.3 GiB)] (x5) [Interval=5 sec] | i7-1165G7 48 W / 28 W | Iris Xe G7 96EUs | 32 GB | 672 |
| MSI CreatorPro Z16P B12UKST 6.0.1 x64 1024 MiB [C: 9.7% (90.5/934.1 GiB)] (x5) [Interval=5 sec] | i7-12700H 74 W / 64 W | RTX A3000 Laptop GPU 90 W 1440 / 1750 MHz 12 GB | 32 GB | 677.66 |
| MSI GE76 Raider 11UH-472US | i9-11980HK 200 W / 91.75 W | GeForce RTX 3080 Laptop GPU 165 W 1710 / 1750 MHz 16 GB | 64 GB | 699 |
| MSI GE67 HX 12UGS | i7-12800HX 190 W / 110 W | GeForce RTX 3070 Ti Laptop GPU 150 W 1555 / 1750 MHz 8 GB | 16 GB | 716.9 |
| MSI Titan GT77 12UHS | i9-12900HX 200 W / 125 W | GeForce RTX 3080 Ti Laptop GPU 175 W 16 GB | 64 GB | 744.5 |
| Nubia RedMagic Titan 16 Pro | i9-14900HX 140 W / 45 W | GeForce RTX 4060 Laptop GPU 140 W 2250 / 2000 MHz 8 GB | 16 GB | 747.9 |
| Acer Swift X SFX14-71G 6.0.1 x64 1024 MiB [C: 6.5% (61.6/952.6 GiB)] (x5) [Interval=5 sec] | i7-13700H 80 W / 40 W | GeForce RTX 4050 Laptop GPU 50 W 1605 / 2000 MHz 6 GB | 16 GB | 777 |
| Model | CPU | GPU | RAM | Value |
|---|---|---|---|---|
| Schenker XMG Neo 15 (i7-12700H, RTX 3080 Ti) 6.0.0 x64 1024 MiB [C: 42.4% (394.2/930.4 GiB)] (x5) [Interval=5 sec] | i7-12700H 95 W / 95 W | GeForce RTX 3080 Ti Laptop GPU 175 W 16 GB | 32 GB | 372.34 |
| Schenker XMG Pro 15 (i7-12700H, RTX 3080 Ti) 6.0.0 x64 1024 MiB [C: 39.7% (369.3/930.4 GiB)] (x5) [Interval=5 sec] | i7-12700H 115 W / 45 W | GeForce RTX 3080 Ti Laptop GPU 155 W 16 GB | 32 GB | 372.73 |
| Schenker Vision 16 Pro RTX 3070 Ti 6.0.1 x64 1024 MiB [C: 7.6% (71.1/930.4 GiB)] (x5) [Interval=5 sec] | i7-12700H 45 W / 45 W | GeForce RTX 3070 Ti Laptop GPU 95 W 1035 / 1500 MHz 8 GB | 32 GB | 384.91 |
| Schenker XMG Apex 15 Max | R9 5900X | GeForce RTX 3070 Laptop GPU 115 W 1560 / 1750 MHz 8 GB | 32 GB | 431.3 |
| Schenker Vision 14 2022 RTX 3050 Ti 6.0.2 x64 1024 MiB [C: 7.6% (71.0/930.4 GiB)] (x5) [Interval=5 sec] | i7-12700H 60 W / 40 W | GeForce RTX 3050 Ti Laptop GPU 45 W 1635 / 1375 MHz 4 GB | 32 GB | 466.39 |
| Eurocom Nightsky ARX315 | R9 5900X | GeForce RTX 3070 Laptop GPU 115 W 1560 / 1750 MHz 8 GB | 32 GB | 515 |
| Schenker XMG Neo 17 M22 | R9 6900HX 85 W / 45 W | GeForce RTX 3080 Ti Laptop GPU 175 W 1590 / 2000 MHz 16 GB | 32 GB | 515.8 |
| Schenker XMG Neo 15 Tiger Lake 5.2.0 x64 1024 MiB [C: 10.3% (96.1/930.9 GiB)] (x5) [Interval=5 sec] | i7-11800H 120 W / 120 W | GeForce RTX 3080 Laptop GPU 165 W 1605 / 1750 MHz 16 GB | 32 GB | 522 |
| Schenker Vision 14 6.0.1 x64 1024 MiB [C: 15.9% (148.3/930.4 GiB)] (x5) [Interval=5 sec] | i7-11370H 46 W / 40 W | GeForce RTX 3050 Ti Laptop GPU 35 W 4 GB | 32 GB | 538 |
| Schenker Work 17 Tiger Lake-H | i7-11370H 45 W / 35 W | Iris Xe G7 96EUs | 32 GB | 555 |
| Schenker XMG Pro 15 (Late 2021) | i7-11800H 135 W / 55 W | GeForce RTX 3080 Laptop GPU 105 W 1245 / 1500 MHz 16 GB | 32 GB | 576 |
| Schenker Work 15 Tiger Lake-H | i7-11370H 44 W / 35 W | Iris Xe G7 96EUs | 16 GB | 579 |
| Schenker XMG Pro 17 (Late 2021, RTX 3080) 6.0.0 x64 1024 MiB [C: 36.5% (339.7/930.4 GiB)] (x5) [Interval=5 sec] | i7-11800H 135 W / 55 W | GeForce RTX 3080 Laptop GPU 105 W 16 GB | 32 GB | 580 |
| Eurocom RX315 NH57AF1 | i7-11800H 95 W / 54 W | GeForce RTX 3070 Laptop GPU 1290 / 1500 MHz 8 GB | 32 GB | 589 |
| Schenker XMG Fusion 15 (Mid 22) | i7-11800H 65 W / 45 W | GeForce RTX 3070 Laptop GPU 145 W 1290 / 1500 MHz 8 GB | 32 GB | 590.9 |
| Schenker XMG NEO 17 GM7TG8S 5.2.1 x64 1024 MiB [C: 11.0% (102.0/926.1 GiB)] (x5) [Interval=5 sec] | i7-11800H 75 W / 75 W | GeForce RTX 3080 Laptop GPU 165 W 16 GB | 32 GB | 626 |
| Schenker Vision 14 5.2.1 x64 1024 MiB [C: 15.4% (143.8/930.9 GiB)] (x5) [Interval=5 sec] | i7-1165G7 60 W / 30 W | Iris Xe G7 96EUs 1300 / 2000 MHz | 16 GB | 662 |
| Schenker Vision 15 5.2.1 x64 1024 MiB [C: 40.9% (194.7/476.3 GiB)] (x5) [Interval=5 sec] | i7-1165G7 50 W / 40 W | Iris Xe G7 96EUs 1300 / 1600 MHz | 16 GB | 697 |
| Eurocom Nightsky TXi317 | i7-12700H 110 W / 76 W | GeForce RTX 3080 Ti Laptop GPU 155 W 1485 / 2000 MHz 16 GB | 64 GB | 701.3 |
| Eurocom Raptor X15 | i7-12700K 98 W / 70 W | GeForce RTX 3070 Ti Laptop GPU 140 W 1410 / 1750 MHz 8 GB | 32 GB | 742.8 |
| Model | CPU | GPU | RAM | Value |
|---|---|---|---|---|
| HP ZBook Firefly 16 G9-6B897EA 6.0.1 x64 1024 MiB [C: 7.0% (66.5/952.7 GiB)] (x5) [Interval=5 sec] | i7-1265U 51 W / 12 W | T550 Laptop GPU 20 W 1665 / 1500 MHz 4 GB | 32 GB | 347.81 |
| Lenovo Slim 7 Pro X 14ARH7 | R9 6900HS 65 W / 54 W | GeForce RTX 3050 4GB Laptop GPU 55 W 1057 / 1375 MHz 4 GB | 32 GB | 349.9 |
| Dell XPS 14 2024 OLED 6.0.1 x64 1024 MiB [C: 9.2% (85.1/925.7 GiB)] (x5) [Interval=5 sec] | Ultra 7 155H 64 W / 30 W | GeForce RTX 4050 Laptop GPU 30 W 1605 / 2000 MHz 4 GB | 32 GB | 355 |
| Lenovo Yoga Pro 7 14ARP G8 6.0.1 x64 1024 MiB [C: 3.8% (36.3/953.1 GiB)] (x5) [Interval=5 sec] | R7 7735HS 60 W / 54 W | Radeon 680M | 16 GB | 362 |
| Dell XPS 13 Plus 9320 4K 6.0.1 x64 1024 MiB [C: 15.9% (148.3/934.4 GiB)] (x5) [Interval=5 sec] | i7-1260P 64 W / 34 W | Iris Xe G7 96EUs 1400 MHz | 32 GB | 371.42 |
| Asus Zenbook 17 Fold UX9702 6.0.1 x64 1024 MiB [C: 5.2% (49.4/952.5 GiB)] (x5) [Interval=5 sec] | i7-1250U 29 W / 16 W | Iris Xe G7 80EUs 950 MHz | 16 GB | 373.69 |
| LG Gram 16Z90Q | i7-1260P 43 W / 25 W | Iris Xe G7 96EUs 1400 / 2600 MHz | 16 GB | 415.1 |
| Lenovo ThinkPad T14 G3-21AJS00400 6.0.1 x64 1024 MiB [C: 6.0% (57.5/951.6 GiB)] (x5) [Interval=5 sec] | i7-1260P 58 W / 42 W | GeForce MX550 30 W 1710 / 1500 MHz 2 GB | 16 GB | 423 |
| Lenovo Yoga Pro 7 14APH G8 6.0.1 x64 1024 MiB [C: 15.9% (151.5/951.6 GiB)] (x5) [Interval=5 sec] | R7 7840HS 60 W / 54 W | Radeon 780M | 32 GB | 428 |
| Lenovo Yoga Slim 7 Carbon 13IAP7-82U9005FGE 6.0.1 x64 1024 MiB [C: 19.6% (186.5/951.6 GiB)] (x5) [Interval=5 sec] | i7-1260P 46 W / 28 W | Iris Xe G7 96EUs 1400 / 2400 MHz | 16 GB | 428.09 |
| Asus ZenBook S13 OLED UX5304 6.0.1 x64 1024 MiB [C: 5.5% (52.1/952.4 GiB)] (x5) [Interval=5 sec] | i7-1355U 44 W / 17 W | Iris Xe G7 96EUs 1300 MHz | 16 GB | 435 |
| Lenovo Yoga Slim 7 14APU G8 6.0.1 x64 1024 MiB [C: 7.6% (72.4/951.6 GiB)] (x5) [Interval=5 sec] | R7 7840S 52 W / 42 W | Radeon 780M ? / 800 MHz | 32 GB | 436 |
| HP ZBook Power 15 G9 6B8C4EA 6.0.1 x64 1024 MiB [C: 7.2% (68.3/952.7 GiB)] (x5) [Interval=5 sec] | i7-12700H 90 W / 55 W | RTX A2000 Laptop GPU 45 W 1335 / 1368 MHz 8 GB | 32 GB | 438.24 |
| Dell Precision 5000 5470 | i9-12900H 91 W / 20 W | RTX A1000 Laptop GPU 40 W 1140 / 1375 MHz 4 GB | 32 GB | 448.3 |
| Asus Zenbook S 13 OLED 6.0.1 x64 1024 MiB [C: 4.9% (46.8/952.2 GiB)] (x5) [Interval=5 sec] | R7 6800U 30 W / 25 W | Radeon 680M 2200DC MHz | 16 GB | 449.11 |
| Uniwell Technology GM7AG8N Liquid Cooling Box | i9-12900H 140 W / 98 W | GeForce RTX 3080 Ti Laptop GPU 175 W 1590 / 2000 MHz 16 GB | 16 GB | 452 |
| Dell Precision 5480 | i9-13900H 88 W / 51 W | RTX 3000 Ada Generation Laptop 50 W 1530 / 2000 MHz 8 GB | 64 GB | 456 |
| Lenovo Yoga Pro 7 14IRH G8 6.0.1 x64 1024 MiB [C: 13.8% (130.9/951.6 GiB)] (x5) [Interval=5 sec] | i7-13700H 80 W / 53 W | GeForce RTX 4050 Laptop GPU 55 W 1905 / 2000 MHz 6 GB | 16 GB | 457 |
| HP Omen 16-n0033dx | R7 6800H 93 W / 64 W | Radeon RX 6650M 105 W ? / 2000 MHz 8 GB | 16 GB | 458.9 |
| Asus ROG Zephyrus G14 GA402XY 6.0.1 x64 1024 MiB [C: 8.2% (76.2/926.6 GiB)] (x5) [Interval=5 sec] | R9 7940HS 80 W / 80 W | GeForce RTX 4090 Laptop GPU 125 W 1455 / 2250 MHz 16 GB | 32 GB | 459 |
| Lenovo Yoga Pro 9-14IRP G8 6.0.1 x64 1024 MiB [C: 8.6% (81.6/951.6 GiB)] (x5) [Interval=5 sec] | i7-13705H 104 W / 75 W | GeForce RTX 4050 Laptop GPU 80 W 2055 / 2000 MHz 6 GB | 32 GB | 461 |
| Lenovo Yoga Pro 9 16-IRP G8 6.0.1 x64 1024 MiB [C: 7.1% (67.9/951.6 GiB)] (x5) [Interval=5 sec] | i7-13705H 125 W / 80 W | GeForce RTX 4060 Laptop GPU 100 W 8 GB | 16 GB | 465 |
| Lenovo ThinkPad X1 Carbon G9-20XWCTO1WW | i7-1165G7 36 W / 28 W | Iris Xe G7 96EUs | 32 GB | 478.4 |
| Lenovo Slim Pro 9i 16IRP8 | i9-13905H 123 W / 85 W | GeForce RTX 4050 Laptop GPU 100 W 2055 / 2000 MHz 6 GB | 32 GB | 479.6 |
| LG Gram 15Z90Q | i5-1240P 43 W / 13 W | Iris Xe G7 80EUs 1300 / 2600 MHz | 16 GB | 505.5 |
| Acer Predator Helios 300 (i7-12700H, RTX 3070 Ti) 6.0.0 x64 1024 MiB [C: 37.2% (354.4/952.6 GiB)] (x5) [Interval=5 sec] | i7-12700H 115 W / 115 W | GeForce RTX 3070 Ti Laptop GPU 150 W 8 GB | 32 GB | 515.11 |
| Acer Nitro 17 AN17-41-R9LN | R7 7735HS 100 W / 65 W | GeForce RTX 4070 Laptop GPU 140 W 1980 / 1963 MHz 8 GB | 16 GB | 522.7 |
| Acer Nitro 16 AN16-41 | R7 7735HS 100 W / 75 W | GeForce RTX 4070 Laptop GPU 140 W 1980 / 2000 MHz 8 GB | 16 GB | 528 |
| Acer Nitro 5 AN515-58-72QR | i7-12700H 115 W / 80 W | GeForce RTX 3070 Ti Laptop GPU 150 W 1410 / 1750 MHz 8 GB | 16 GB | 530.5 |
| Alienware x15 R2 P111F | i9-12900H 140 W / 140 W | GeForce RTX 3080 Ti Laptop GPU 140 W 16 GB | 32 GB | 549 |
| Alienware m16 R2 | Ultra 7 155H 121 W / 102 W | GeForce RTX 4070 Laptop GPU 140 W 2005 / 2013 MHz 8 GB | 16 GB | 557.9 |
| Razer Blade 14 RZ09-0508 | R9 8945HS 90 W / 75 W | GeForce RTX 4070 Laptop GPU 140 W 1605 / 2000 MHz 8 GB | 32 GB | 570.1 |
| Medion Erazer Beast X30 | i9-12900HK 120 W / 120 W | GeForce RTX 3080 Ti Laptop GPU 175 W 1590 / 2000 MHz 16 GB | 32 GB | 598.5 |
| Dell XPS 17 9720 RTX 3060 | i7-12700H 155 W / 55 W | GeForce RTX 3060 Laptop GPU 65 W 1282 / 1500 MHz 6 GB | 32 GB | 605.6 |
| Razer Blade 14 RTX 4070 | R9 7940HS 88 W / 80 W | GeForce RTX 4070 Laptop GPU 140 W 1980 / 2000 MHz 8 GB | 16 GB | 607.3 |
| MSI Prestige 13 AI Evo 6.0.1 x64 1024 MiB [C: 14.6% (135.6/931.1 GiB)] (x5) [Interval=5 sec] | Ultra 7 155H | Arc 8-Core | 32 GB | 611 |
| MSI Stealth 14 Studio A13V 6.0.1 x64 1024 MiB [C: 38.8% (358.9/926.3 GiB)] (x5) [Interval=5 sec] | i7-13700H 110 W / 85 W | GeForce RTX 4050 Laptop GPU 90 W 2370 / 2000 MHz 6 GB | 16 GB | 628 |
| Lenovo Legion 5 Pro 16ARH7H RTX 3070 Ti | R7 6800H 90 W / 90 W | GeForce RTX 3070 Ti Laptop GPU 150 W 1510 / 1800 MHz 8 GB | 32 GB | 629.3 |
| MSI Summit E14 Flip Evo A12MT | i7-1260P 72 W / 28 W | Iris Xe G7 96EUs 1400 / 2400 MHz | 32 GB | 638.4 |
| Asus ProArt StudioBook 16 H7600ZW | i9-12900H 115 W / 110 W | GeForce RTX 3070 Ti Laptop GPU 115 W 8 GB | 32 GB | 640.4 |
| Razer Blade 14 Ryzen 9 6900HX | R9 6900HX 90 W / 75 W | GeForce RTX 3070 Ti Laptop GPU 100 W 1035 / 1500 MHz 8 GB | 16 GB | 642.7 |
| Razer Blade 15 OLED (Early 2022) | i9-12900H 160 W / 65 W | GeForce RTX 3070 Ti Laptop GPU 110 W 1035 / 1500 MHz 8 GB | 16 GB | 643.1 |
| Razer Blade 17 (i7-12800H, RTX 3070 Ti) 6.0.0 x64 1024 MiB [C: 13.7% (127.7/934.5 GiB)] (x5) [Interval=5 sec] | i7-12800H 110 W / 60 W | GeForce RTX 3070 Ti Laptop GPU 150 W 8 GB | 16 GB | 651.74 |
| Razer Blade 14 2025 6.0.1 x64 1024 MiB [C: 9.7% (90.3/927.8 GiB)] (x5) [Interval=5 sec] | Ryzen AI 9 365 70 W / 60 W | GeForce RTX 5070 Laptop 115 W 2632 / 1500 MHz | 32 GB | 658 |
| Maingear Vector Pro MG-VCP17 | i7-11800H 120 W / 120 W | GeForce RTX 3080 Laptop GPU 165 W 1605 / 1750 MHz 16 GB | 32 GB | 659 |
| Razer Blade 16 RTX 5080 | Ryzen AI 9 365 80 W / 75 W | GeForce RTX 5080 Laptop 160 W 1500 / 1750 MHz 16 GB | 32 GB | 662.1 |
| Lenovo Yoga 9i 14 2022 i7-1260P 6.0.1 x64 1024 MiB [C: 8.3% (79.4/951.6 GiB)] (x5) [Interval=5 sec] | i7-1260P 64 W / 38 W | Iris Xe G7 96EUs 1400 / 2600 MHz | 16 GB | 664.35 |
| Eluktronics Mech-17 GP2 | i9-13900HX 160 W / 99 W | GeForce RTX 4090 Laptop GPU 175 W 2140 / 2375 MHz 16 GB | 32 GB | 669.8 |
| Razer Blade 17 RTX 3080 Ti | i7-12800H 107 W / 61 W | GeForce RTX 3080 Ti Laptop GPU 165 W 1395 / 2000 MHz 16 GB | 32 GB | 672 |
| LG Gram 17 (2023) | i7-1360P 43 W / 26 W | Iris Xe G7 96EUs 1400 MHz | 16 GB | 675.1 |
| Lenovo Legion Pro 5 16ARX8 | R7 7745HX 110 W / 97 W | GeForce RTX 4070 Laptop GPU 140 W 1755 / 2050 MHz 8 GB | 16 GB | 678.5 |
| Lenovo Legion Pro 5 16IRX9 G9 6.0.0 x64 1024 MiB [C: 27.0% (257.1/951.6 GiB)] (x5) [Interval=5 sec] | i7-14700HX 190 W / 130 W | GeForce RTX 4060 Laptop GPU 140 W 8 GB | 32 GB | 687 |
| Gigabyte Aero 15 OLED XD | i7-11800H @4.6 GHz 109 W / 62 W | GeForce RTX 3070 Laptop GPU 105 W 1290 / 1500 MHz 8 GB | 32 GB | 691 |
| Razer Blade 17 Early 2022 | i9-12900H 160 W / 65 W | GeForce RTX 3080 Ti Laptop GPU 165 W 1395 / 2000 MHz 16 GB | 32 GB | 691.7 |
| Razer Blade 17 RTX 3070 | i7-11800H 160 W / 65 W | GeForce RTX 3070 Laptop GPU 130 W 1410 / 1500 MHz 8 GB | 16 GB | 703 |
| Asus ExpertBook B7 Flip B7402FEA | i7-1195G7 51 W / 35 W | Iris Xe G7 96EUs 1400 MHz | 16 GB | 710 |
| Lenovo Legion 5 16IRX G9 6.0.1 x64 1024 MiB [C: 7.7% (73.7/951.6 GiB)] (x5) [Interval=5 sec] | i7-14650HX 140 W / 100 W | GeForce RTX 4060 Laptop GPU 125 W 2430 / 2050 MHz 8 GB | 16 GB | 712 |
| Aorus 15P YD | i7-11800H 109 W / 45 W | GeForce RTX 3080 Laptop GPU 130 W 1545 / 1750 MHz 8 GB | 16 GB | 722 |
| Lenovo Legion Pro 7 16IRX8H | i9-13900HX 185 W / 130 W | GeForce RTX 4080 Laptop GPU 175 W 1665 / 2250 MHz 12 GB | 32 GB | 724.7 |
| Lenovo Legion Pro 5 16IRX9 | i9-14900HX 187 W / 104 W | GeForce RTX 4070 Laptop GPU 140 W 1705 / 2050 MHz 8 GB | 32 GB | 727.6 |
| Lenovo Legion Slim 7i 16 Gen 8 | i9-13900H 107 W / 81 W | GeForce RTX 4070 Laptop GPU 140 W 1845 / 2050 MHz 8 GB | 16 GB | 731.8 |
| Lenovo Legion Pro 7 RTX4090 | i9-13900HX 185 W / 130 W | GeForce RTX 4090 Laptop GPU 175 W 1455 / 2250 MHz 16 GB | 32 GB | 741.4 |
| Lenovo ThinkPad X1 Yoga G6-20Y0S00200 5.2.1 x64 1024 MiB [C: 9.3% (88.3/953.3 GiB)] (x5) [Interval=5 sec] | i7-1165G7 48 W / 28 W | Iris Xe G7 96EUs | 32 GB | 750 |
| MSI GE76 Raider 11UH-472US | i9-11980HK 200 W / 91.75 W | GeForce RTX 3080 Laptop GPU 165 W 1710 / 1750 MHz 16 GB | 64 GB | 752 |
| Alienware m15 R6, i7-11800H RTX 3080 | i7-11800H 90 W / 50 W | GeForce RTX 3080 Laptop GPU 125 W 8 GB | 32 GB | 755 |
| Razer Blade 15 Advanced Model Early 2022 5.2.0 x64 1024 MiB [C: 51.4% (480.7/934.5 GiB)] (x5) [Interval=5 sec] | i7-12800H 160 W / 65 W | GeForce RTX 3080 Ti Laptop GPU 110 W 1125 / 1750 MHz 16 GB | 32 GB | 863.75 |
| MSI CreatorPro Z16P B12UKST 6.0.1 x64 1024 MiB [C: 9.7% (90.5/934.1 GiB)] (x5) [Interval=5 sec] | i7-12700H 74 W / 64 W | RTX A3000 Laptop GPU 90 W 1440 / 1750 MHz 12 GB | 32 GB | 884.83 |
| Lenovo Legion 5 Pro 16 G7 i7 RTX 3070Ti 6.0.1 x64 1024 MiB [C: 9.5% (90.8/951.6 GiB)] (x5) [Interval=5 sec] | i7-12700H 124 W / 108 W | GeForce RTX 3070 Ti Laptop GPU 150 W 1702 / 1750 MHz 8 GB | 16 GB | 890 |
| Asus ExpertBook B2 Flip B2502FBA-N80141X | i7-1260P 64 W / 28 W | Iris Xe G7 96EUs 1400 MHz | 32 GB | 891.9 |
| Acer Swift X SFX14-71G 6.0.1 x64 1024 MiB [C: 6.5% (61.6/952.6 GiB)] (x5) [Interval=5 sec] | i7-13700H 80 W / 40 W | GeForce RTX 4050 Laptop GPU 50 W 1605 / 2000 MHz 6 GB | 16 GB | 897 |
| MSI GE67 HX 12UGS | i7-12800HX 190 W / 110 W | GeForce RTX 3070 Ti Laptop GPU 150 W 1555 / 1750 MHz 8 GB | 16 GB | 929 |
| MSI Titan GT77 12UHS | i9-12900HX 200 W / 125 W | GeForce RTX 3080 Ti Laptop GPU 175 W 16 GB | 64 GB | 948.9 |
| Nubia RedMagic Titan 16 Pro | i9-14900HX 140 W / 45 W | GeForce RTX 4060 Laptop GPU 140 W 2250 / 2000 MHz 8 GB | 16 GB | 997.2 |
| Model | CPU | GPU | RAM | Value |
|---|---|---|---|---|
| Schenker Vision 16 Pro RTX 3070 Ti 6.0.1 x64 1024 MiB [C: 7.6% (71.1/930.4 GiB)] (x5) [Interval=5 sec] | i7-12700H 45 W / 45 W | GeForce RTX 3070 Ti Laptop GPU 95 W 1035 / 1500 MHz 8 GB | 32 GB | 445.32 |
| Schenker XMG Neo 15 (i7-12700H, RTX 3080 Ti) 6.0.0 x64 1024 MiB [C: 42.4% (394.2/930.4 GiB)] (x5) [Interval=5 sec] | i7-12700H 95 W / 95 W | GeForce RTX 3080 Ti Laptop GPU 175 W 16 GB | 32 GB | 449.67 |
| Schenker XMG Neo 15 Tiger Lake 5.2.0 x64 1024 MiB [C: 10.3% (96.1/930.9 GiB)] (x5) [Interval=5 sec] | i7-11800H 120 W / 120 W | GeForce RTX 3080 Laptop GPU 165 W 1605 / 1750 MHz 16 GB | 32 GB | 508 |
| Schenker XMG Pro 15 (i7-12700H, RTX 3080 Ti) 6.0.0 x64 1024 MiB [C: 39.7% (369.3/930.4 GiB)] (x5) [Interval=5 sec] | i7-12700H 115 W / 45 W | GeForce RTX 3080 Ti Laptop GPU 155 W 16 GB | 32 GB | 611.39 |
| Eurocom Nightsky ARX315 | R9 5900X | GeForce RTX 3070 Laptop GPU 115 W 1560 / 1750 MHz 8 GB | 32 GB | 619 |
| Schenker XMG Neo 17 M22 | R9 6900HX 85 W / 45 W | GeForce RTX 3080 Ti Laptop GPU 175 W 1590 / 2000 MHz 16 GB | 32 GB | 633.3 |
| Schenker Vision 14 2022 RTX 3050 Ti 6.0.2 x64 1024 MiB [C: 7.6% (71.0/930.4 GiB)] (x5) [Interval=5 sec] | i7-12700H 60 W / 40 W | GeForce RTX 3050 Ti Laptop GPU 45 W 1635 / 1375 MHz 4 GB | 32 GB | 651.75 |
| Schenker XMG NEO 17 GM7TG8S 5.2.1 x64 1024 MiB [C: 11.0% (102.0/926.1 GiB)] (x5) [Interval=5 sec] | i7-11800H 75 W / 75 W | GeForce RTX 3080 Laptop GPU 165 W 16 GB | 32 GB | 685 |
| Schenker Vision 14 5.2.1 x64 1024 MiB [C: 15.4% (143.8/930.9 GiB)] (x5) [Interval=5 sec] | i7-1165G7 60 W / 30 W | Iris Xe G7 96EUs 1300 / 2000 MHz | 16 GB | 720 |
| Eurocom RX315 NH57AF1 | i7-11800H 95 W / 54 W | GeForce RTX 3070 Laptop GPU 1290 / 1500 MHz 8 GB | 32 GB | 726 |
| Schenker Work 17 Tiger Lake-H | i7-11370H 45 W / 35 W | Iris Xe G7 96EUs | 32 GB | 739 |
| Schenker XMG Pro 15 (Late 2021) | i7-11800H 135 W / 55 W | GeForce RTX 3080 Laptop GPU 105 W 1245 / 1500 MHz 16 GB | 32 GB | 753 |
| Schenker XMG Pro 17 (Late 2021, RTX 3080) 6.0.0 x64 1024 MiB [C: 36.5% (339.7/930.4 GiB)] (x5) [Interval=5 sec] | i7-11800H 135 W / 55 W | GeForce RTX 3080 Laptop GPU 105 W 16 GB | 32 GB | 754 |
| Schenker XMG Fusion 15 (Mid 22) | i7-11800H 65 W / 45 W | GeForce RTX 3070 Laptop GPU 145 W 1290 / 1500 MHz 8 GB | 32 GB | 757.7 |
| Schenker Vision 15 5.2.1 x64 1024 MiB [C: 40.9% (194.7/476.3 GiB)] (x5) [Interval=5 sec] | i7-1165G7 50 W / 40 W | Iris Xe G7 96EUs 1300 / 1600 MHz | 16 GB | 758 |
| Schenker Work 15 Tiger Lake-H | i7-11370H 44 W / 35 W | Iris Xe G7 96EUs | 16 GB | 764 |
| Schenker Vision 14 6.0.1 x64 1024 MiB [C: 15.9% (148.3/930.4 GiB)] (x5) [Interval=5 sec] | i7-11370H 46 W / 40 W | GeForce RTX 3050 Ti Laptop GPU 35 W 4 GB | 32 GB | 798 |
| Eurocom Nightsky TXi317 | i7-12700H 110 W / 76 W | GeForce RTX 3080 Ti Laptop GPU 155 W 1485 / 2000 MHz 16 GB | 64 GB | 879.4 |
| Eurocom Raptor X15 | i7-12700K 98 W / 70 W | GeForce RTX 3070 Ti Laptop GPU 140 W 1410 / 1750 MHz 8 GB | 32 GB | 951.3 |
| Schenker XMG Apex 15 Max | R9 5900X | GeForce RTX 3070 Laptop GPU 115 W 1560 / 1750 MHz 8 GB | 32 GB | 6332 |
| Model | CPU | GPU | RAM | Value |
|---|---|---|---|---|
| Alienware x15 R2 P111F | i9-12900H 140 W / 140 W | GeForce RTX 3080 Ti Laptop GPU 140 W 16 GB | 32 GB | 2186.8 |
| HP Omen 16-n0033dx | R7 6800H 93 W / 64 W | Radeon RX 6650M 105 W ? / 2000 MHz 8 GB | 16 GB | 2222 |
| Razer Blade 15 OLED (Early 2022) | i9-12900H 160 W / 65 W | GeForce RTX 3070 Ti Laptop GPU 110 W 1035 / 1500 MHz 8 GB | 16 GB | 2442 |
| HP ZBook Firefly 16 G9-6B897EA 6.0.1 x64 1024 MiB [C: 7.0% (66.5/952.7 GiB)] (x5) [Interval=5 sec] | i7-1265U 51 W / 12 W | T550 Laptop GPU 20 W 1665 / 1500 MHz 4 GB | 32 GB | 2669.7 |
| Alienware m15 R6, i7-11800H RTX 3080 | i7-11800H 90 W / 50 W | GeForce RTX 3080 Laptop GPU 125 W 8 GB | 32 GB | 3174 |
| Asus Zenbook 17 Fold UX9702 6.0.1 x64 1024 MiB [C: 5.2% (49.4/952.5 GiB)] (x5) [Interval=5 sec] | i7-1250U 29 W / 16 W | Iris Xe G7 80EUs 950 MHz | 16 GB | 3231.4 |
| Asus ExpertBook B7 Flip B7402FEA | i7-1195G7 51 W / 35 W | Iris Xe G7 96EUs 1400 MHz | 16 GB | 3460 |
| Asus ZenBook S13 OLED UX5304 6.0.1 x64 1024 MiB [C: 5.5% (52.1/952.4 GiB)] (x5) [Interval=5 sec] | i7-1355U 44 W / 17 W | Iris Xe G7 96EUs 1300 MHz | 16 GB | 3931 |
| Lenovo ThinkPad T14 G3-21AJS00400 6.0.1 x64 1024 MiB [C: 6.0% (57.5/951.6 GiB)] (x5) [Interval=5 sec] | i7-1260P 58 W / 42 W | GeForce MX550 30 W 1710 / 1500 MHz 2 GB | 16 GB | 4443 |
| Lenovo ThinkPad X1 Carbon G9-20XWCTO1WW | i7-1165G7 36 W / 28 W | Iris Xe G7 96EUs | 32 GB | 4524 |
| Dell XPS 13 Plus 9320 4K 6.0.1 x64 1024 MiB [C: 15.9% (148.3/934.4 GiB)] (x5) [Interval=5 sec] | i7-1260P 64 W / 34 W | Iris Xe G7 96EUs 1400 MHz | 32 GB | 4646 |
| Dell XPS 14 2024 OLED 6.0.1 x64 1024 MiB [C: 9.2% (85.1/925.7 GiB)] (x5) [Interval=5 sec] | Ultra 7 155H 64 W / 30 W | GeForce RTX 4050 Laptop GPU 30 W 1605 / 2000 MHz 4 GB | 32 GB | 4820 |
| HP ZBook Power 15 G9 6B8C4EA 6.0.1 x64 1024 MiB [C: 7.2% (68.3/952.7 GiB)] (x5) [Interval=5 sec] | i7-12700H 90 W / 55 W | RTX A2000 Laptop GPU 45 W 1335 / 1368 MHz 8 GB | 32 GB | 4842.9 |
| Lenovo ThinkPad X1 Yoga G6-20Y0S00200 5.2.1 x64 1024 MiB [C: 9.3% (88.3/953.3 GiB)] (x5) [Interval=5 sec] | i7-1165G7 48 W / 28 W | Iris Xe G7 96EUs | 32 GB | 4931 |
| Acer Swift X SFX14-71G 6.0.1 x64 1024 MiB [C: 6.5% (61.6/952.6 GiB)] (x5) [Interval=5 sec] | i7-13700H 80 W / 40 W | GeForce RTX 4050 Laptop GPU 50 W 1605 / 2000 MHz 6 GB | 16 GB | 5031 |
| Eluktronics Mech-17 GP2 | i9-13900HX 160 W / 99 W | GeForce RTX 4090 Laptop GPU 175 W 2140 / 2375 MHz 16 GB | 32 GB | 5040 |
| Uniwell Technology GM7AG8N Liquid Cooling Box | i9-12900H 140 W / 98 W | GeForce RTX 3080 Ti Laptop GPU 175 W 1590 / 2000 MHz 16 GB | 16 GB | 5058 |
| LG Gram 16Z90Q | i7-1260P 43 W / 25 W | Iris Xe G7 96EUs 1400 / 2600 MHz | 16 GB | 5076 |
| Lenovo Legion Pro 7 RTX4090 | i9-13900HX 185 W / 130 W | GeForce RTX 4090 Laptop GPU 175 W 1455 / 2250 MHz 16 GB | 32 GB | 5082 |
| Dell Precision 5000 5470 | i9-12900H 91 W / 20 W | RTX A1000 Laptop GPU 40 W 1140 / 1375 MHz 4 GB | 32 GB | 5086 |
| Razer Blade 17 RTX 3070 | i7-11800H 160 W / 65 W | GeForce RTX 3070 Laptop GPU 130 W 1410 / 1500 MHz 8 GB | 16 GB | 5097 |
| Dell XPS 17 9720 RTX 3060 | i7-12700H 155 W / 55 W | GeForce RTX 3060 Laptop GPU 65 W 1282 / 1500 MHz 6 GB | 32 GB | 5100 |
| Gigabyte Aero 15 OLED XD | i7-11800H @4.6 GHz 109 W / 62 W | GeForce RTX 3070 Laptop GPU 105 W 1290 / 1500 MHz 8 GB | 32 GB | 5111 |
| MSI GE76 Raider 11UH-472US | i9-11980HK 200 W / 91.75 W | GeForce RTX 3080 Laptop GPU 165 W 1710 / 1750 MHz 16 GB | 64 GB | 5119 |
| Razer Blade 16 RTX 5080 | Ryzen AI 9 365 80 W / 75 W | GeForce RTX 5080 Laptop 160 W 1500 / 1750 MHz 16 GB | 32 GB | 5125 |
| Lenovo Yoga Pro 9-14IRP G8 6.0.1 x64 1024 MiB [C: 8.6% (81.6/951.6 GiB)] (x5) [Interval=5 sec] | i7-13705H 104 W / 75 W | GeForce RTX 4050 Laptop GPU 80 W 2055 / 2000 MHz 6 GB | 32 GB | 5126 |
| MSI GE67 HX 12UGS | i7-12800HX 190 W / 110 W | GeForce RTX 3070 Ti Laptop GPU 150 W 1555 / 1750 MHz 8 GB | 16 GB | 5127 |
| Asus ExpertBook B2 Flip B2502FBA-N80141X | i7-1260P 64 W / 28 W | Iris Xe G7 96EUs 1400 MHz | 32 GB | 5133 |
| Lenovo Slim Pro 9i 16IRP8 | i9-13905H 123 W / 85 W | GeForce RTX 4050 Laptop GPU 100 W 2055 / 2000 MHz 6 GB | 32 GB | 5135 |
| MSI Summit E14 Flip Evo A12MT | i7-1260P 72 W / 28 W | Iris Xe G7 96EUs 1400 / 2400 MHz | 32 GB | 5147 |
| Acer Nitro 17 AN17-41-R9LN | R7 7735HS 100 W / 65 W | GeForce RTX 4070 Laptop GPU 140 W 1980 / 1963 MHz 8 GB | 16 GB | 5147 |
| Asus ProArt StudioBook 16 H7600ZW | i9-12900H 115 W / 110 W | GeForce RTX 3070 Ti Laptop GPU 115 W 8 GB | 32 GB | 5150.8 |
| Lenovo Slim 7 Pro X 14ARH7 | R9 6900HS 65 W / 54 W | GeForce RTX 3050 4GB Laptop GPU 55 W 1057 / 1375 MHz 4 GB | 32 GB | 5156 |
| MSI Titan GT77 12UHS | i9-12900HX 200 W / 125 W | GeForce RTX 3080 Ti Laptop GPU 175 W 16 GB | 64 GB | 5157.6 |
| Acer Nitro 5 AN515-58-72QR | i7-12700H 115 W / 80 W | GeForce RTX 3070 Ti Laptop GPU 150 W 1410 / 1750 MHz 8 GB | 16 GB | 5161 |
| Acer Nitro 16 AN16-41 | R7 7735HS 100 W / 75 W | GeForce RTX 4070 Laptop GPU 140 W 1980 / 2000 MHz 8 GB | 16 GB | 5161 |
| Lenovo Yoga Pro 7 14IRH G8 6.0.1 x64 1024 MiB [C: 13.8% (130.9/951.6 GiB)] (x5) [Interval=5 sec] | i7-13700H 80 W / 53 W | GeForce RTX 4050 Laptop GPU 55 W 1905 / 2000 MHz 6 GB | 16 GB | 5162 |
| Lenovo Yoga Slim 7 Carbon 13IAP7-82U9005FGE 6.0.1 x64 1024 MiB [C: 19.6% (186.5/951.6 GiB)] (x5) [Interval=5 sec] | i7-1260P 46 W / 28 W | Iris Xe G7 96EUs 1400 / 2400 MHz | 16 GB | 5163.3 |
| Lenovo Yoga Pro 9 16-IRP G8 6.0.1 x64 1024 MiB [C: 7.1% (67.9/951.6 GiB)] (x5) [Interval=5 sec] | i7-13705H 125 W / 80 W | GeForce RTX 4060 Laptop GPU 100 W 8 GB | 16 GB | 5167 |
| Lenovo Legion Pro 5 16IRX9 | i9-14900HX 187 W / 104 W | GeForce RTX 4070 Laptop GPU 140 W 1705 / 2050 MHz 8 GB | 32 GB | 5178 |
| LG Gram 15Z90Q | i5-1240P 43 W / 13 W | Iris Xe G7 80EUs 1300 / 2600 MHz | 16 GB | 5179 |
| Lenovo Yoga 9i 14 2022 i7-1260P 6.0.1 x64 1024 MiB [C: 8.3% (79.4/951.6 GiB)] (x5) [Interval=5 sec] | i7-1260P 64 W / 38 W | Iris Xe G7 96EUs 1400 / 2600 MHz | 16 GB | 5190.9 |
| Aorus 15P YD | i7-11800H 109 W / 45 W | GeForce RTX 3080 Laptop GPU 130 W 1545 / 1750 MHz 8 GB | 16 GB | 5198 |
| MSI Prestige 13 AI Evo 6.0.1 x64 1024 MiB [C: 14.6% (135.6/931.1 GiB)] (x5) [Interval=5 sec] | Ultra 7 155H | Arc 8-Core | 32 GB | 5200 |
| Nubia RedMagic Titan 16 Pro | i9-14900HX 140 W / 45 W | GeForce RTX 4060 Laptop GPU 140 W 2250 / 2000 MHz 8 GB | 16 GB | 5205 |
| Alienware m16 R2 | Ultra 7 155H 121 W / 102 W | GeForce RTX 4070 Laptop GPU 140 W 2005 / 2013 MHz 8 GB | 16 GB | 5207 |
| Dell Precision 5480 | i9-13900H 88 W / 51 W | RTX 3000 Ada Generation Laptop 50 W 1530 / 2000 MHz 8 GB | 64 GB | 5209 |
| Lenovo Yoga Pro 7 14ARP G8 6.0.1 x64 1024 MiB [C: 3.8% (36.3/953.1 GiB)] (x5) [Interval=5 sec] | R7 7735HS 60 W / 54 W | Radeon 680M | 16 GB | 5210 |
| Lenovo Legion 5 16IRX G9 6.0.1 x64 1024 MiB [C: 7.7% (73.7/951.6 GiB)] (x5) [Interval=5 sec] | i7-14650HX 140 W / 100 W | GeForce RTX 4060 Laptop GPU 125 W 2430 / 2050 MHz 8 GB | 16 GB | 5212 |
| Medion Erazer Beast X30 | i9-12900HK 120 W / 120 W | GeForce RTX 3080 Ti Laptop GPU 175 W 1590 / 2000 MHz 16 GB | 32 GB | 5215 |
| Maingear Vector Pro MG-VCP17 | i7-11800H 120 W / 120 W | GeForce RTX 3080 Laptop GPU 165 W 1605 / 1750 MHz 16 GB | 32 GB | 5216 |
| Lenovo Legion Slim 7i 16 Gen 8 | i9-13900H 107 W / 81 W | GeForce RTX 4070 Laptop GPU 140 W 1845 / 2050 MHz 8 GB | 16 GB | 5223 |
| Razer Blade 17 RTX 3080 Ti | i7-12800H 107 W / 61 W | GeForce RTX 3080 Ti Laptop GPU 165 W 1395 / 2000 MHz 16 GB | 32 GB | 5226 |
| Razer Blade 14 2025 6.0.1 x64 1024 MiB [C: 9.7% (90.3/927.8 GiB)] (x5) [Interval=5 sec] | Ryzen AI 9 365 70 W / 60 W | GeForce RTX 5070 Laptop 115 W 2632 / 1500 MHz | 32 GB | 5229 |
| Asus Zenbook S 13 OLED 6.0.1 x64 1024 MiB [C: 4.9% (46.8/952.2 GiB)] (x5) [Interval=5 sec] | R7 6800U 30 W / 25 W | Radeon 680M 2200DC MHz | 16 GB | 5233.3 |
| Razer Blade 17 Early 2022 | i9-12900H 160 W / 65 W | GeForce RTX 3080 Ti Laptop GPU 165 W 1395 / 2000 MHz 16 GB | 32 GB | 5235 |
| Acer Predator Helios 300 (i7-12700H, RTX 3070 Ti) 6.0.0 x64 1024 MiB [C: 37.2% (354.4/952.6 GiB)] (x5) [Interval=5 sec] | i7-12700H 115 W / 115 W | GeForce RTX 3070 Ti Laptop GPU 150 W 8 GB | 32 GB | 5243.9 |
| Lenovo Yoga Pro 7 14APH G8 6.0.1 x64 1024 MiB [C: 15.9% (151.5/951.6 GiB)] (x5) [Interval=5 sec] | R7 7840HS 60 W / 54 W | Radeon 780M | 32 GB | 5245 |
| Razer Blade 15 Advanced Model Early 2022 5.2.0 x64 1024 MiB [C: 51.4% (480.7/934.5 GiB)] (x5) [Interval=5 sec] | i7-12800H 160 W / 65 W | GeForce RTX 3080 Ti Laptop GPU 110 W 1125 / 1750 MHz 16 GB | 32 GB | 5251.3 |
| Razer Blade 14 RZ09-0508 | R9 8945HS 90 W / 75 W | GeForce RTX 4070 Laptop GPU 140 W 1605 / 2000 MHz 8 GB | 32 GB | 5252 |
| MSI CreatorPro Z16P B12UKST 6.0.1 x64 1024 MiB [C: 9.7% (90.5/934.1 GiB)] (x5) [Interval=5 sec] | i7-12700H 74 W / 64 W | RTX A3000 Laptop GPU 90 W 1440 / 1750 MHz 12 GB | 32 GB | 5255.8 |
| Lenovo Legion Pro 5 16ARX8 | R7 7745HX 110 W / 97 W | GeForce RTX 4070 Laptop GPU 140 W 1755 / 2050 MHz 8 GB | 16 GB | 5259 |
| Lenovo Yoga Slim 7 14APU G8 6.0.1 x64 1024 MiB [C: 7.6% (72.4/951.6 GiB)] (x5) [Interval=5 sec] | R7 7840S 52 W / 42 W | Radeon 780M ? / 800 MHz | 32 GB | 5260 |
| LG Gram 17 (2023) | i7-1360P 43 W / 26 W | Iris Xe G7 96EUs 1400 MHz | 16 GB | 5262 |
| Lenovo Legion Pro 5 16IRX9 G9 6.0.0 x64 1024 MiB [C: 27.0% (257.1/951.6 GiB)] (x5) [Interval=5 sec] | i7-14700HX 190 W / 130 W | GeForce RTX 4060 Laptop GPU 140 W 8 GB | 32 GB | 5263 |
| Asus ROG Zephyrus G14 GA402XY 6.0.1 x64 1024 MiB [C: 8.2% (76.2/926.6 GiB)] (x5) [Interval=5 sec] | R9 7940HS 80 W / 80 W | GeForce RTX 4090 Laptop GPU 125 W 1455 / 2250 MHz 16 GB | 32 GB | 5265 |
| Razer Blade 17 (i7-12800H, RTX 3070 Ti) 6.0.0 x64 1024 MiB [C: 13.7% (127.7/934.5 GiB)] (x5) [Interval=5 sec] | i7-12800H 110 W / 60 W | GeForce RTX 3070 Ti Laptop GPU 150 W 8 GB | 16 GB | 5265.3 |
| Razer Blade 14 RTX 4070 | R9 7940HS 88 W / 80 W | GeForce RTX 4070 Laptop GPU 140 W 1980 / 2000 MHz 8 GB | 16 GB | 5267 |
| Razer Blade 14 Ryzen 9 6900HX | R9 6900HX 90 W / 75 W | GeForce RTX 3070 Ti Laptop GPU 100 W 1035 / 1500 MHz 8 GB | 16 GB | 5272 |
| Lenovo Legion 5 Pro 16 G7 i7 RTX 3070Ti 6.0.1 x64 1024 MiB [C: 9.5% (90.8/951.6 GiB)] (x5) [Interval=5 sec] | i7-12700H 124 W / 108 W | GeForce RTX 3070 Ti Laptop GPU 150 W 1702 / 1750 MHz 8 GB | 16 GB | 5277 |
| Lenovo Legion Pro 7 16IRX8H | i9-13900HX 185 W / 130 W | GeForce RTX 4080 Laptop GPU 175 W 1665 / 2250 MHz 12 GB | 32 GB | 5278 |
| Lenovo Legion 5 Pro 16ARH7H RTX 3070 Ti | R7 6800H 90 W / 90 W | GeForce RTX 3070 Ti Laptop GPU 150 W 1510 / 1800 MHz 8 GB | 32 GB | 5280 |
| MSI Stealth 14 Studio A13V 6.0.1 x64 1024 MiB [C: 38.8% (358.9/926.3 GiB)] (x5) [Interval=5 sec] | i7-13700H 110 W / 85 W | GeForce RTX 4050 Laptop GPU 90 W 2370 / 2000 MHz 6 GB | 16 GB | 5284 |
| Model | CPU | GPU | RAM | Value |
|---|---|---|---|---|
| Schenker XMG Pro 15 (Late 2021) | i7-11800H 135 W / 55 W | GeForce RTX 3080 Laptop GPU 105 W 1245 / 1500 MHz 16 GB | 32 GB | 2236 |
| Eurocom Nightsky ARX315 | R9 5900X | GeForce RTX 3070 Laptop GPU 115 W 1560 / 1750 MHz 8 GB | 32 GB | 3183 |
| Schenker XMG Neo 15 Tiger Lake 5.2.0 x64 1024 MiB [C: 10.3% (96.1/930.9 GiB)] (x5) [Interval=5 sec] | i7-11800H 120 W / 120 W | GeForce RTX 3080 Laptop GPU 165 W 1605 / 1750 MHz 16 GB | 32 GB | 4765 |
| Schenker XMG Neo 17 M22 | R9 6900HX 85 W / 45 W | GeForce RTX 3080 Ti Laptop GPU 175 W 1590 / 2000 MHz 16 GB | 32 GB | 5138.2 |
| Schenker Vision 16 Pro RTX 3070 Ti 6.0.1 x64 1024 MiB [C: 7.6% (71.1/930.4 GiB)] (x5) [Interval=5 sec] | i7-12700H 45 W / 45 W | GeForce RTX 3070 Ti Laptop GPU 95 W 1035 / 1500 MHz 8 GB | 32 GB | 5173.5 |
| Schenker XMG Neo 15 (i7-12700H, RTX 3080 Ti) 6.0.0 x64 1024 MiB [C: 42.4% (394.2/930.4 GiB)] (x5) [Interval=5 sec] | i7-12700H 95 W / 95 W | GeForce RTX 3080 Ti Laptop GPU 175 W 16 GB | 32 GB | 5179.6 |
| Schenker Work 17 Tiger Lake-H | i7-11370H 45 W / 35 W | Iris Xe G7 96EUs | 32 GB | 5180 |
| Schenker XMG NEO 17 GM7TG8S 5.2.1 x64 1024 MiB [C: 11.0% (102.0/926.1 GiB)] (x5) [Interval=5 sec] | i7-11800H 75 W / 75 W | GeForce RTX 3080 Laptop GPU 165 W 16 GB | 32 GB | 5184 |
| Schenker Vision 15 5.2.1 x64 1024 MiB [C: 40.9% (194.7/476.3 GiB)] (x5) [Interval=5 sec] | i7-1165G7 50 W / 40 W | Iris Xe G7 96EUs 1300 / 1600 MHz | 16 GB | 5187 |
| Schenker XMG Pro 15 (i7-12700H, RTX 3080 Ti) 6.0.0 x64 1024 MiB [C: 39.7% (369.3/930.4 GiB)] (x5) [Interval=5 sec] | i7-12700H 115 W / 45 W | GeForce RTX 3080 Ti Laptop GPU 155 W 16 GB | 32 GB | 5187.2 |
| Schenker XMG Pro 17 (Late 2021, RTX 3080) 6.0.0 x64 1024 MiB [C: 36.5% (339.7/930.4 GiB)] (x5) [Interval=5 sec] | i7-11800H 135 W / 55 W | GeForce RTX 3080 Laptop GPU 105 W 16 GB | 32 GB | 5188 |
| Eurocom Nightsky TXi317 | i7-12700H 110 W / 76 W | GeForce RTX 3080 Ti Laptop GPU 155 W 1485 / 2000 MHz 16 GB | 64 GB | 5189 |
| Eurocom Raptor X15 | i7-12700K 98 W / 70 W | GeForce RTX 3070 Ti Laptop GPU 140 W 1410 / 1750 MHz 8 GB | 32 GB | 5190 |
| Schenker Vision 14 5.2.1 x64 1024 MiB [C: 15.4% (143.8/930.9 GiB)] (x5) [Interval=5 sec] | i7-1165G7 60 W / 30 W | Iris Xe G7 96EUs 1300 / 2000 MHz | 16 GB | 5222 |
| Schenker Vision 14 6.0.1 x64 1024 MiB [C: 15.9% (148.3/930.4 GiB)] (x5) [Interval=5 sec] | i7-11370H 46 W / 40 W | GeForce RTX 3050 Ti Laptop GPU 35 W 4 GB | 32 GB | 5224 |
| Schenker Work 15 Tiger Lake-H | i7-11370H 44 W / 35 W | Iris Xe G7 96EUs | 16 GB | 5237 |
| Eurocom RX315 NH57AF1 | i7-11800H 95 W / 54 W | GeForce RTX 3070 Laptop GPU 1290 / 1500 MHz 8 GB | 32 GB | 5241 |
| Schenker XMG Apex 15 Max | R9 5900X | GeForce RTX 3070 Laptop GPU 115 W 1560 / 1750 MHz 8 GB | 32 GB | 5245 |
| Schenker Vision 14 2022 RTX 3050 Ti 6.0.2 x64 1024 MiB [C: 7.6% (71.0/930.4 GiB)] (x5) [Interval=5 sec] | i7-12700H 60 W / 40 W | GeForce RTX 3050 Ti Laptop GPU 45 W 1635 / 1375 MHz 4 GB | 32 GB | 5245.6 |
| Schenker XMG Fusion 15 (Mid 22) | i7-11800H 65 W / 45 W | GeForce RTX 3070 Laptop GPU 145 W 1290 / 1500 MHz 8 GB | 32 GB | 5248 |
| Model | CPU | GPU | RAM | Value |
|---|---|---|---|---|
| Acer Nitro 17 AN17-41-R9LN | R7 7735HS 100 W / 65 W | GeForce RTX 4070 Laptop GPU 140 W 1980 / 1963 MHz 8 GB | 16 GB | 1771 |
| MSI Summit E14 Flip Evo A12MT | i7-1260P 72 W / 28 W | Iris Xe G7 96EUs 1400 / 2400 MHz | 32 GB | 2088 |
| Asus ExpertBook B7 Flip B7402FEA | i7-1195G7 51 W / 35 W | Iris Xe G7 96EUs 1400 MHz | 16 GB | 2794 |
| Alienware m15 R6, i7-11800H RTX 3080 | i7-11800H 90 W / 50 W | GeForce RTX 3080 Laptop GPU 125 W 8 GB | 32 GB | 3552 |
| Acer Predator Helios 300 (i7-12700H, RTX 3070 Ti) 6.0.0 x64 1024 MiB [C: 37.2% (354.4/952.6 GiB)] (x5) [Interval=5 sec] | i7-12700H 115 W / 115 W | GeForce RTX 3070 Ti Laptop GPU 150 W 8 GB | 32 GB | 6648.9 |
| Asus Zenbook 17 Fold UX9702 6.0.1 x64 1024 MiB [C: 5.2% (49.4/952.5 GiB)] (x5) [Interval=5 sec] | i7-1250U 29 W / 16 W | Iris Xe G7 80EUs 950 MHz | 16 GB | 6667.7 |
| Acer Swift X SFX14-71G 6.0.1 x64 1024 MiB [C: 6.5% (61.6/952.6 GiB)] (x5) [Interval=5 sec] | i7-13700H 80 W / 40 W | GeForce RTX 4050 Laptop GPU 50 W 1605 / 2000 MHz 6 GB | 16 GB | 6691 |
| Asus ExpertBook B2 Flip B2502FBA-N80141X | i7-1260P 64 W / 28 W | Iris Xe G7 96EUs 1400 MHz | 32 GB | 6786 |
| Alienware x15 R2 P111F | i9-12900H 140 W / 140 W | GeForce RTX 3080 Ti Laptop GPU 140 W 16 GB | 32 GB | 6796.5 |
| Lenovo Legion Pro 5 16IRX9 | i9-14900HX 187 W / 104 W | GeForce RTX 4070 Laptop GPU 140 W 1705 / 2050 MHz 8 GB | 32 GB | 6809 |
| Dell Precision 5000 5470 | i9-12900H 91 W / 20 W | RTX A1000 Laptop GPU 40 W 1140 / 1375 MHz 4 GB | 32 GB | 6817 |
| HP Omen 16-n0033dx | R7 6800H 93 W / 64 W | Radeon RX 6650M 105 W ? / 2000 MHz 8 GB | 16 GB | 6821 |
| Lenovo Legion Slim 7i 16 Gen 8 | i9-13900H 107 W / 81 W | GeForce RTX 4070 Laptop GPU 140 W 1845 / 2050 MHz 8 GB | 16 GB | 6821 |
| Lenovo Legion Pro 7 RTX4090 | i9-13900HX 185 W / 130 W | GeForce RTX 4090 Laptop GPU 175 W 1455 / 2250 MHz 16 GB | 32 GB | 6903 |
| Dell XPS 17 9720 RTX 3060 | i7-12700H 155 W / 55 W | GeForce RTX 3060 Laptop GPU 65 W 1282 / 1500 MHz 6 GB | 32 GB | 6941 |
| Uniwell Technology GM7AG8N Liquid Cooling Box | i9-12900H 140 W / 98 W | GeForce RTX 3080 Ti Laptop GPU 175 W 1590 / 2000 MHz 16 GB | 16 GB | 6947 |
| Dell XPS 13 Plus 9320 4K 6.0.1 x64 1024 MiB [C: 15.9% (148.3/934.4 GiB)] (x5) [Interval=5 sec] | i7-1260P 64 W / 34 W | Iris Xe G7 96EUs 1400 MHz | 32 GB | 6947.9 |
| Lenovo Slim 7 Pro X 14ARH7 | R9 6900HS 65 W / 54 W | GeForce RTX 3050 4GB Laptop GPU 55 W 1057 / 1375 MHz 4 GB | 32 GB | 6951 |
| HP ZBook Power 15 G9 6B8C4EA 6.0.1 x64 1024 MiB [C: 7.2% (68.3/952.7 GiB)] (x5) [Interval=5 sec] | i7-12700H 90 W / 55 W | RTX A2000 Laptop GPU 45 W 1335 / 1368 MHz 8 GB | 32 GB | 6958.9 |
| Lenovo Yoga Slim 7 Carbon 13IAP7-82U9005FGE 6.0.1 x64 1024 MiB [C: 19.6% (186.5/951.6 GiB)] (x5) [Interval=5 sec] | i7-1260P 46 W / 28 W | Iris Xe G7 96EUs 1400 / 2400 MHz | 16 GB | 6972.5 |
| Lenovo ThinkPad T14 G3-21AJS00400 6.0.1 x64 1024 MiB [C: 6.0% (57.5/951.6 GiB)] (x5) [Interval=5 sec] | i7-1260P 58 W / 42 W | GeForce MX550 30 W 1710 / 1500 MHz 2 GB | 16 GB | 6974 |
| Lenovo Yoga 9i 14 2022 i7-1260P 6.0.1 x64 1024 MiB [C: 8.3% (79.4/951.6 GiB)] (x5) [Interval=5 sec] | i7-1260P 64 W / 38 W | Iris Xe G7 96EUs 1400 / 2600 MHz | 16 GB | 6984.4 |
| Lenovo Slim Pro 9i 16IRP8 | i9-13905H 123 W / 85 W | GeForce RTX 4050 Laptop GPU 100 W 2055 / 2000 MHz 6 GB | 32 GB | 6992 |
| Lenovo Yoga Pro 9-14IRP G8 6.0.1 x64 1024 MiB [C: 8.6% (81.6/951.6 GiB)] (x5) [Interval=5 sec] | i7-13705H 104 W / 75 W | GeForce RTX 4050 Laptop GPU 80 W 2055 / 2000 MHz 6 GB | 32 GB | 6998 |
| Nubia RedMagic Titan 16 Pro | i9-14900HX 140 W / 45 W | GeForce RTX 4060 Laptop GPU 140 W 2250 / 2000 MHz 8 GB | 16 GB | 7001 |
| Gigabyte Aero 15 OLED XD | i7-11800H @4.6 GHz 109 W / 62 W | GeForce RTX 3070 Laptop GPU 105 W 1290 / 1500 MHz 8 GB | 32 GB | 7002 |
| Asus ZenBook S13 OLED UX5304 6.0.1 x64 1024 MiB [C: 5.5% (52.1/952.4 GiB)] (x5) [Interval=5 sec] | i7-1355U 44 W / 17 W | Iris Xe G7 96EUs 1300 MHz | 16 GB | 7025 |
| LG Gram 17 (2023) | i7-1360P 43 W / 26 W | Iris Xe G7 96EUs 1400 MHz | 16 GB | 7026 |
| Eluktronics Mech-17 GP2 | i9-13900HX 160 W / 99 W | GeForce RTX 4090 Laptop GPU 175 W 2140 / 2375 MHz 16 GB | 32 GB | 7030 |
| MSI Prestige 13 AI Evo 6.0.1 x64 1024 MiB [C: 14.6% (135.6/931.1 GiB)] (x5) [Interval=5 sec] | Ultra 7 155H | Arc 8-Core | 32 GB | 7035 |
| Lenovo Yoga Pro 7 14IRH G8 6.0.1 x64 1024 MiB [C: 13.8% (130.9/951.6 GiB)] (x5) [Interval=5 sec] | i7-13700H 80 W / 53 W | GeForce RTX 4050 Laptop GPU 55 W 1905 / 2000 MHz 6 GB | 16 GB | 7040 |
| HP ZBook Firefly 16 G9-6B897EA 6.0.1 x64 1024 MiB [C: 7.0% (66.5/952.7 GiB)] (x5) [Interval=5 sec] | i7-1265U 51 W / 12 W | T550 Laptop GPU 20 W 1665 / 1500 MHz 4 GB | 32 GB | 7050.7 |
| LG Gram 15Z90Q | i5-1240P 43 W / 13 W | Iris Xe G7 80EUs 1300 / 2600 MHz | 16 GB | 7056 |
| MSI Titan GT77 12UHS | i9-12900HX 200 W / 125 W | GeForce RTX 3080 Ti Laptop GPU 175 W 16 GB | 64 GB | 7058.7 |
| Aorus 15P YD | i7-11800H 109 W / 45 W | GeForce RTX 3080 Laptop GPU 130 W 1545 / 1750 MHz 8 GB | 16 GB | 7065 |
| Razer Blade 17 RTX 3070 | i7-11800H 160 W / 65 W | GeForce RTX 3070 Laptop GPU 130 W 1410 / 1500 MHz 8 GB | 16 GB | 7065 |
| LG Gram 16Z90Q | i7-1260P 43 W / 25 W | Iris Xe G7 96EUs 1400 / 2600 MHz | 16 GB | 7066 |
| Lenovo Yoga Pro 9 16-IRP G8 6.0.1 x64 1024 MiB [C: 7.1% (67.9/951.6 GiB)] (x5) [Interval=5 sec] | i7-13705H 125 W / 80 W | GeForce RTX 4060 Laptop GPU 100 W 8 GB | 16 GB | 7066 |
| Dell Precision 5480 | i9-13900H 88 W / 51 W | RTX 3000 Ada Generation Laptop 50 W 1530 / 2000 MHz 8 GB | 64 GB | 7070 |
| Razer Blade 16 RTX 5080 | Ryzen AI 9 365 80 W / 75 W | GeForce RTX 5080 Laptop 160 W 1500 / 1750 MHz 16 GB | 32 GB | 7071 |
| Maingear Vector Pro MG-VCP17 | i7-11800H 120 W / 120 W | GeForce RTX 3080 Laptop GPU 165 W 1605 / 1750 MHz 16 GB | 32 GB | 7073 |
| Razer Blade 17 Early 2022 | i9-12900H 160 W / 65 W | GeForce RTX 3080 Ti Laptop GPU 165 W 1395 / 2000 MHz 16 GB | 32 GB | 7076 |
| MSI Stealth 14 Studio A13V 6.0.1 x64 1024 MiB [C: 38.8% (358.9/926.3 GiB)] (x5) [Interval=5 sec] | i7-13700H 110 W / 85 W | GeForce RTX 4050 Laptop GPU 90 W 2370 / 2000 MHz 6 GB | 16 GB | 7077 |
| Acer Nitro 16 AN16-41 | R7 7735HS 100 W / 75 W | GeForce RTX 4070 Laptop GPU 140 W 1980 / 2000 MHz 8 GB | 16 GB | 7079 |
| Asus ProArt StudioBook 16 H7600ZW | i9-12900H 115 W / 110 W | GeForce RTX 3070 Ti Laptop GPU 115 W 8 GB | 32 GB | 7084.8 |
| MSI GE76 Raider 11UH-472US | i9-11980HK 200 W / 91.75 W | GeForce RTX 3080 Laptop GPU 165 W 1710 / 1750 MHz 16 GB | 64 GB | 7086 |
| Lenovo Legion 5 16IRX G9 6.0.1 x64 1024 MiB [C: 7.7% (73.7/951.6 GiB)] (x5) [Interval=5 sec] | i7-14650HX 140 W / 100 W | GeForce RTX 4060 Laptop GPU 125 W 2430 / 2050 MHz 8 GB | 16 GB | 7086 |
| Lenovo Legion Pro 5 16IRX9 G9 6.0.0 x64 1024 MiB [C: 27.0% (257.1/951.6 GiB)] (x5) [Interval=5 sec] | i7-14700HX 190 W / 130 W | GeForce RTX 4060 Laptop GPU 140 W 8 GB | 32 GB | 7087 |
| Razer Blade 17 (i7-12800H, RTX 3070 Ti) 6.0.0 x64 1024 MiB [C: 13.7% (127.7/934.5 GiB)] (x5) [Interval=5 sec] | i7-12800H 110 W / 60 W | GeForce RTX 3070 Ti Laptop GPU 150 W 8 GB | 16 GB | 7087.4 |
| Dell XPS 14 2024 OLED 6.0.1 x64 1024 MiB [C: 9.2% (85.1/925.7 GiB)] (x5) [Interval=5 sec] | Ultra 7 155H 64 W / 30 W | GeForce RTX 4050 Laptop GPU 30 W 1605 / 2000 MHz 4 GB | 32 GB | 7089 |
| Lenovo Yoga Pro 7 14ARP G8 6.0.1 x64 1024 MiB [C: 3.8% (36.3/953.1 GiB)] (x5) [Interval=5 sec] | R7 7735HS 60 W / 54 W | Radeon 680M | 16 GB | 7091 |
| MSI GE67 HX 12UGS | i7-12800HX 190 W / 110 W | GeForce RTX 3070 Ti Laptop GPU 150 W 1555 / 1750 MHz 8 GB | 16 GB | 7092 |
| Razer Blade 17 RTX 3080 Ti | i7-12800H 107 W / 61 W | GeForce RTX 3080 Ti Laptop GPU 165 W 1395 / 2000 MHz 16 GB | 32 GB | 7093 |
| Medion Erazer Beast X30 | i9-12900HK 120 W / 120 W | GeForce RTX 3080 Ti Laptop GPU 175 W 1590 / 2000 MHz 16 GB | 32 GB | 7095 |
| Alienware m16 R2 | Ultra 7 155H 121 W / 102 W | GeForce RTX 4070 Laptop GPU 140 W 2005 / 2013 MHz 8 GB | 16 GB | 7095 |
| Razer Blade 15 Advanced Model Early 2022 5.2.0 x64 1024 MiB [C: 51.4% (480.7/934.5 GiB)] (x5) [Interval=5 sec] | i7-12800H 160 W / 65 W | GeForce RTX 3080 Ti Laptop GPU 110 W 1125 / 1750 MHz 16 GB | 32 GB | 7096.4 |
| MSI CreatorPro Z16P B12UKST 6.0.1 x64 1024 MiB [C: 9.7% (90.5/934.1 GiB)] (x5) [Interval=5 sec] | i7-12700H 74 W / 64 W | RTX A3000 Laptop GPU 90 W 1440 / 1750 MHz 12 GB | 32 GB | 7097.1 |
| Lenovo ThinkPad X1 Carbon G9-20XWCTO1WW | i7-1165G7 36 W / 28 W | Iris Xe G7 96EUs | 32 GB | 7098 |
| Razer Blade 15 OLED (Early 2022) | i9-12900H 160 W / 65 W | GeForce RTX 3070 Ti Laptop GPU 110 W 1035 / 1500 MHz 8 GB | 16 GB | 7098 |
| Lenovo Legion Pro 7 16IRX8H | i9-13900HX 185 W / 130 W | GeForce RTX 4080 Laptop GPU 175 W 1665 / 2250 MHz 12 GB | 32 GB | 7098 |
| Razer Blade 14 2025 6.0.1 x64 1024 MiB [C: 9.7% (90.3/927.8 GiB)] (x5) [Interval=5 sec] | Ryzen AI 9 365 70 W / 60 W | GeForce RTX 5070 Laptop 115 W 2632 / 1500 MHz | 32 GB | 7098 |
| Acer Nitro 5 AN515-58-72QR | i7-12700H 115 W / 80 W | GeForce RTX 3070 Ti Laptop GPU 150 W 1410 / 1750 MHz 8 GB | 16 GB | 7102 |
| Lenovo ThinkPad X1 Yoga G6-20Y0S00200 5.2.1 x64 1024 MiB [C: 9.3% (88.3/953.3 GiB)] (x5) [Interval=5 sec] | i7-1165G7 48 W / 28 W | Iris Xe G7 96EUs | 32 GB | 7103 |
| Lenovo Legion 5 Pro 16 G7 i7 RTX 3070Ti 6.0.1 x64 1024 MiB [C: 9.5% (90.8/951.6 GiB)] (x5) [Interval=5 sec] | i7-12700H 124 W / 108 W | GeForce RTX 3070 Ti Laptop GPU 150 W 1702 / 1750 MHz 8 GB | 16 GB | 7110 |
| Lenovo Legion Pro 5 16ARX8 | R7 7745HX 110 W / 97 W | GeForce RTX 4070 Laptop GPU 140 W 1755 / 2050 MHz 8 GB | 16 GB | 7110 |
| Asus Zenbook S 13 OLED 6.0.1 x64 1024 MiB [C: 4.9% (46.8/952.2 GiB)] (x5) [Interval=5 sec] | R7 6800U 30 W / 25 W | Radeon 680M 2200DC MHz | 16 GB | 7112.5 |
| Lenovo Legion 5 Pro 16ARH7H RTX 3070 Ti | R7 6800H 90 W / 90 W | GeForce RTX 3070 Ti Laptop GPU 150 W 1510 / 1800 MHz 8 GB | 32 GB | 7113 |
| Asus ROG Zephyrus G14 GA402XY 6.0.1 x64 1024 MiB [C: 8.2% (76.2/926.6 GiB)] (x5) [Interval=5 sec] | R9 7940HS 80 W / 80 W | GeForce RTX 4090 Laptop GPU 125 W 1455 / 2250 MHz 16 GB | 32 GB | 7113 |
| Lenovo Yoga Slim 7 14APU G8 6.0.1 x64 1024 MiB [C: 7.6% (72.4/951.6 GiB)] (x5) [Interval=5 sec] | R7 7840S 52 W / 42 W | Radeon 780M ? / 800 MHz | 32 GB | 7113 |
| Lenovo Yoga Pro 7 14APH G8 6.0.1 x64 1024 MiB [C: 15.9% (151.5/951.6 GiB)] (x5) [Interval=5 sec] | R7 7840HS 60 W / 54 W | Radeon 780M | 32 GB | 7115 |
| Razer Blade 14 RZ09-0508 | R9 8945HS 90 W / 75 W | GeForce RTX 4070 Laptop GPU 140 W 1605 / 2000 MHz 8 GB | 32 GB | 7117 |
| Razer Blade 14 Ryzen 9 6900HX | R9 6900HX 90 W / 75 W | GeForce RTX 3070 Ti Laptop GPU 100 W 1035 / 1500 MHz 8 GB | 16 GB | 7118 |
| Razer Blade 14 RTX 4070 | R9 7940HS 88 W / 80 W | GeForce RTX 4070 Laptop GPU 140 W 1980 / 2000 MHz 8 GB | 16 GB | 7124 |
| Model | CPU | GPU | RAM | Value |
|---|---|---|---|---|
| Eurocom Nightsky ARX315 | R9 5900X | GeForce RTX 3070 Laptop GPU 115 W 1560 / 1750 MHz 8 GB | 32 GB | 3262 |
| Schenker XMG Neo 17 M22 | R9 6900HX 85 W / 45 W | GeForce RTX 3080 Ti Laptop GPU 175 W 1590 / 2000 MHz 16 GB | 32 GB | 6877.8 |
| Schenker XMG Neo 15 (i7-12700H, RTX 3080 Ti) 6.0.0 x64 1024 MiB [C: 42.4% (394.2/930.4 GiB)] (x5) [Interval=5 sec] | i7-12700H 95 W / 95 W | GeForce RTX 3080 Ti Laptop GPU 175 W 16 GB | 32 GB | 6935.1 |
| Schenker XMG Pro 15 (Late 2021) | i7-11800H 135 W / 55 W | GeForce RTX 3080 Laptop GPU 105 W 1245 / 1500 MHz 16 GB | 32 GB | 6939 |
| Schenker Vision 16 Pro RTX 3070 Ti 6.0.1 x64 1024 MiB [C: 7.6% (71.1/930.4 GiB)] (x5) [Interval=5 sec] | i7-12700H 45 W / 45 W | GeForce RTX 3070 Ti Laptop GPU 95 W 1035 / 1500 MHz 8 GB | 32 GB | 6967.6 |
| Schenker XMG Pro 15 (i7-12700H, RTX 3080 Ti) 6.0.0 x64 1024 MiB [C: 39.7% (369.3/930.4 GiB)] (x5) [Interval=5 sec] | i7-12700H 115 W / 45 W | GeForce RTX 3080 Ti Laptop GPU 155 W 16 GB | 32 GB | 6970.4 |
| Schenker XMG Apex 15 Max | R9 5900X | GeForce RTX 3070 Laptop GPU 115 W 1560 / 1750 MHz 8 GB | 32 GB | 6978 |
| Eurocom Nightsky TXi317 | i7-12700H 110 W / 76 W | GeForce RTX 3080 Ti Laptop GPU 155 W 1485 / 2000 MHz 16 GB | 64 GB | 6979 |
| Schenker XMG Fusion 15 (Mid 22) | i7-11800H 65 W / 45 W | GeForce RTX 3070 Laptop GPU 145 W 1290 / 1500 MHz 8 GB | 32 GB | 6993 |
| Schenker Vision 14 2022 RTX 3050 Ti 6.0.2 x64 1024 MiB [C: 7.6% (71.0/930.4 GiB)] (x5) [Interval=5 sec] | i7-12700H 60 W / 40 W | GeForce RTX 3050 Ti Laptop GPU 45 W 1635 / 1375 MHz 4 GB | 32 GB | 7004 |
| Schenker Vision 14 6.0.1 x64 1024 MiB [C: 15.9% (148.3/930.4 GiB)] (x5) [Interval=5 sec] | i7-11370H 46 W / 40 W | GeForce RTX 3050 Ti Laptop GPU 35 W 4 GB | 32 GB | 7031 |
| Schenker XMG Neo 15 Tiger Lake 5.2.0 x64 1024 MiB [C: 10.3% (96.1/930.9 GiB)] (x5) [Interval=5 sec] | i7-11800H 120 W / 120 W | GeForce RTX 3080 Laptop GPU 165 W 1605 / 1750 MHz 16 GB | 32 GB | 7083 |
| Schenker XMG NEO 17 GM7TG8S 5.2.1 x64 1024 MiB [C: 11.0% (102.0/926.1 GiB)] (x5) [Interval=5 sec] | i7-11800H 75 W / 75 W | GeForce RTX 3080 Laptop GPU 165 W 16 GB | 32 GB | 7088 |
| Schenker Work 17 Tiger Lake-H | i7-11370H 45 W / 35 W | Iris Xe G7 96EUs | 32 GB | 7090 |
| Schenker Vision 14 5.2.1 x64 1024 MiB [C: 15.4% (143.8/930.9 GiB)] (x5) [Interval=5 sec] | i7-1165G7 60 W / 30 W | Iris Xe G7 96EUs 1300 / 2000 MHz | 16 GB | 7102 |
| Eurocom RX315 NH57AF1 | i7-11800H 95 W / 54 W | GeForce RTX 3070 Laptop GPU 1290 / 1500 MHz 8 GB | 32 GB | 7105 |
| Schenker Work 15 Tiger Lake-H | i7-11370H 44 W / 35 W | Iris Xe G7 96EUs | 16 GB | 7106 |
| Schenker XMG Pro 17 (Late 2021, RTX 3080) 6.0.0 x64 1024 MiB [C: 36.5% (339.7/930.4 GiB)] (x5) [Interval=5 sec] | i7-11800H 135 W / 55 W | GeForce RTX 3080 Laptop GPU 105 W 16 GB | 32 GB | 7109 |
| Eurocom Raptor X15 | i7-12700K 98 W / 70 W | GeForce RTX 3070 Ti Laptop GPU 140 W 1410 / 1750 MHz 8 GB | 32 GB | 7110 |
| Schenker Vision 15 5.2.1 x64 1024 MiB [C: 40.9% (194.7/476.3 GiB)] (x5) [Interval=5 sec] | i7-1165G7 50 W / 40 W | Iris Xe G7 96EUs 1300 / 1600 MHz | 16 GB | 7117 |
| Model | CPU | GPU | RAM | Value |
|---|---|---|---|---|
| HP ZBook Firefly 16 G9-6B897EA 6.0.1 x64 1024 MiB [C: 7.0% (66.5/952.7 GiB)] (x5) [Interval=5 sec] | i7-1265U 51 W / 12 W | T550 Laptop GPU 20 W 1665 / 1500 MHz 4 GB | 32 GB | 276.62 |
| Lenovo ThinkPad T14 G3-21AJS00400 6.0.1 x64 1024 MiB [C: 6.0% (57.5/951.6 GiB)] (x5) [Interval=5 sec] | i7-1260P 58 W / 42 W | GeForce MX550 30 W 1710 / 1500 MHz 2 GB | 16 GB | 326 |
| Lenovo Yoga Slim 7 Carbon 13IAP7-82U9005FGE 6.0.1 x64 1024 MiB [C: 19.6% (186.5/951.6 GiB)] (x5) [Interval=5 sec] | i7-1260P 46 W / 28 W | Iris Xe G7 96EUs 1400 / 2400 MHz | 16 GB | 343.55 |
| Asus ZenBook S13 OLED UX5304 6.0.1 x64 1024 MiB [C: 5.5% (52.1/952.4 GiB)] (x5) [Interval=5 sec] | i7-1355U 44 W / 17 W | Iris Xe G7 96EUs 1300 MHz | 16 GB | 348 |
| Dell XPS 14 2024 OLED 6.0.1 x64 1024 MiB [C: 9.2% (85.1/925.7 GiB)] (x5) [Interval=5 sec] | Ultra 7 155H 64 W / 30 W | GeForce RTX 4050 Laptop GPU 30 W 1605 / 2000 MHz 4 GB | 32 GB | 348 |
| Asus Zenbook 17 Fold UX9702 6.0.1 x64 1024 MiB [C: 5.2% (49.4/952.5 GiB)] (x5) [Interval=5 sec] | i7-1250U 29 W / 16 W | Iris Xe G7 80EUs 950 MHz | 16 GB | 354.92 |
| Lenovo Yoga Pro 7 14ARP G8 6.0.1 x64 1024 MiB [C: 3.8% (36.3/953.1 GiB)] (x5) [Interval=5 sec] | R7 7735HS 60 W / 54 W | Radeon 680M | 16 GB | 364 |
| Dell XPS 13 Plus 9320 4K 6.0.1 x64 1024 MiB [C: 15.9% (148.3/934.4 GiB)] (x5) [Interval=5 sec] | i7-1260P 64 W / 34 W | Iris Xe G7 96EUs 1400 MHz | 32 GB | 370.02 |
| HP ZBook Power 15 G9 6B8C4EA 6.0.1 x64 1024 MiB [C: 7.2% (68.3/952.7 GiB)] (x5) [Interval=5 sec] | i7-12700H 90 W / 55 W | RTX A2000 Laptop GPU 45 W 1335 / 1368 MHz 8 GB | 32 GB | 409.28 |
| Lenovo Yoga Pro 7 14IRH G8 6.0.1 x64 1024 MiB [C: 13.8% (130.9/951.6 GiB)] (x5) [Interval=5 sec] | i7-13700H 80 W / 53 W | GeForce RTX 4050 Laptop GPU 55 W 1905 / 2000 MHz 6 GB | 16 GB | 413 |
| Lenovo Yoga Pro 9 16-IRP G8 6.0.1 x64 1024 MiB [C: 7.1% (67.9/951.6 GiB)] (x5) [Interval=5 sec] | i7-13705H 125 W / 80 W | GeForce RTX 4060 Laptop GPU 100 W 8 GB | 16 GB | 431 |
| Lenovo Yoga Pro 7 14APH G8 6.0.1 x64 1024 MiB [C: 15.9% (151.5/951.6 GiB)] (x5) [Interval=5 sec] | R7 7840HS 60 W / 54 W | Radeon 780M | 32 GB | 433 |
| Lenovo Yoga Slim 7 14APU G8 6.0.1 x64 1024 MiB [C: 7.6% (72.4/951.6 GiB)] (x5) [Interval=5 sec] | R7 7840S 52 W / 42 W | Radeon 780M ? / 800 MHz | 32 GB | 436 |
| Lenovo Yoga Pro 9-14IRP G8 6.0.1 x64 1024 MiB [C: 8.6% (81.6/951.6 GiB)] (x5) [Interval=5 sec] | i7-13705H 104 W / 75 W | GeForce RTX 4050 Laptop GPU 80 W 2055 / 2000 MHz 6 GB | 32 GB | 437 |
| Asus ROG Zephyrus G14 GA402XY 6.0.1 x64 1024 MiB [C: 8.2% (76.2/926.6 GiB)] (x5) [Interval=5 sec] | R9 7940HS 80 W / 80 W | GeForce RTX 4090 Laptop GPU 125 W 1455 / 2250 MHz 16 GB | 32 GB | 452 |
| Asus Zenbook S 13 OLED 6.0.1 x64 1024 MiB [C: 4.9% (46.8/952.2 GiB)] (x5) [Interval=5 sec] | R7 6800U 30 W / 25 W | Radeon 680M 2200DC MHz | 16 GB | 517.14 |
| Alienware x15 R2 P111F | i9-12900H 140 W / 140 W | GeForce RTX 3080 Ti Laptop GPU 140 W 16 GB | 32 GB | 527.8 |
| Asus ProArt StudioBook 16 H7600ZW | i9-12900H 115 W / 110 W | GeForce RTX 3070 Ti Laptop GPU 115 W 8 GB | 32 GB | 591.7 |
| MSI Prestige 13 AI Evo 6.0.1 x64 1024 MiB [C: 14.6% (135.6/931.1 GiB)] (x5) [Interval=5 sec] | Ultra 7 155H | Arc 8-Core | 32 GB | 1267 |
| Alienware m15 R6, i7-11800H RTX 3080 | i7-11800H 90 W / 50 W | GeForce RTX 3080 Laptop GPU 125 W 8 GB | 32 GB | 1414 |
| Acer Predator Helios 300 (i7-12700H, RTX 3070 Ti) 6.0.0 x64 1024 MiB [C: 37.2% (354.4/952.6 GiB)] (x5) [Interval=5 sec] | i7-12700H 115 W / 115 W | GeForce RTX 3070 Ti Laptop GPU 150 W 8 GB | 32 GB | 1758.31 |
| Lenovo Yoga 9i 14 2022 i7-1260P 6.0.1 x64 1024 MiB [C: 8.3% (79.4/951.6 GiB)] (x5) [Interval=5 sec] | i7-1260P 64 W / 38 W | Iris Xe G7 96EUs 1400 / 2600 MHz | 16 GB | 1910.38 |
| Razer Blade 17 (i7-12800H, RTX 3070 Ti) 6.0.0 x64 1024 MiB [C: 13.7% (127.7/934.5 GiB)] (x5) [Interval=5 sec] | i7-12800H 110 W / 60 W | GeForce RTX 3070 Ti Laptop GPU 150 W 8 GB | 16 GB | 2137.38 |
| Lenovo Legion 5 16IRX G9 6.0.1 x64 1024 MiB [C: 7.7% (73.7/951.6 GiB)] (x5) [Interval=5 sec] | i7-14650HX 140 W / 100 W | GeForce RTX 4060 Laptop GPU 125 W 2430 / 2050 MHz 8 GB | 16 GB | 2299 |
| Lenovo Legion Pro 5 16IRX9 G9 6.0.0 x64 1024 MiB [C: 27.0% (257.1/951.6 GiB)] (x5) [Interval=5 sec] | i7-14700HX 190 W / 130 W | GeForce RTX 4060 Laptop GPU 140 W 8 GB | 32 GB | 2402 |
| MSI Stealth 14 Studio A13V 6.0.1 x64 1024 MiB [C: 38.8% (358.9/926.3 GiB)] (x5) [Interval=5 sec] | i7-13700H 110 W / 85 W | GeForce RTX 4050 Laptop GPU 90 W 2370 / 2000 MHz 6 GB | 16 GB | 2571 |
| Lenovo Legion 5 Pro 16 G7 i7 RTX 3070Ti 6.0.1 x64 1024 MiB [C: 9.5% (90.8/951.6 GiB)] (x5) [Interval=5 sec] | i7-12700H 124 W / 108 W | GeForce RTX 3070 Ti Laptop GPU 150 W 1702 / 1750 MHz 8 GB | 16 GB | 2614 |
| MSI CreatorPro Z16P B12UKST 6.0.1 x64 1024 MiB [C: 9.7% (90.5/934.1 GiB)] (x5) [Interval=5 sec] | i7-12700H 74 W / 64 W | RTX A3000 Laptop GPU 90 W 1440 / 1750 MHz 12 GB | 32 GB | 2830.34 |
| MSI Titan GT77 12UHS | i9-12900HX 200 W / 125 W | GeForce RTX 3080 Ti Laptop GPU 175 W 16 GB | 64 GB | 3017.8 |
| Acer Swift X SFX14-71G 6.0.1 x64 1024 MiB [C: 6.5% (61.6/952.6 GiB)] (x5) [Interval=5 sec] | i7-13700H 80 W / 40 W | GeForce RTX 4050 Laptop GPU 50 W 1605 / 2000 MHz 6 GB | 16 GB | 3112 |
| Razer Blade 14 2025 6.0.1 x64 1024 MiB [C: 9.7% (90.3/927.8 GiB)] (x5) [Interval=5 sec] | Ryzen AI 9 365 70 W / 60 W | GeForce RTX 5070 Laptop 115 W 2632 / 1500 MHz | 32 GB | 3528 |
| Model | CPU | GPU | RAM | Value |
|---|---|---|---|---|
| Schenker Vision 16 Pro RTX 3070 Ti 6.0.1 x64 1024 MiB [C: 7.6% (71.1/930.4 GiB)] (x5) [Interval=5 sec] | i7-12700H 45 W / 45 W | GeForce RTX 3070 Ti Laptop GPU 95 W 1035 / 1500 MHz 8 GB | 32 GB | 389.83 |
| Schenker XMG Neo 15 (i7-12700H, RTX 3080 Ti) 6.0.0 x64 1024 MiB [C: 42.4% (394.2/930.4 GiB)] (x5) [Interval=5 sec] | i7-12700H 95 W / 95 W | GeForce RTX 3080 Ti Laptop GPU 175 W 16 GB | 32 GB | 393.82 |
| Schenker XMG Pro 15 (i7-12700H, RTX 3080 Ti) 6.0.0 x64 1024 MiB [C: 39.7% (369.3/930.4 GiB)] (x5) [Interval=5 sec] | i7-12700H 115 W / 45 W | GeForce RTX 3080 Ti Laptop GPU 155 W 16 GB | 32 GB | 1071.21 |
| Schenker Vision 14 6.0.1 x64 1024 MiB [C: 15.9% (148.3/930.4 GiB)] (x5) [Interval=5 sec] | i7-11370H 46 W / 40 W | GeForce RTX 3050 Ti Laptop GPU 35 W 4 GB | 32 GB | 1399 |
| Schenker XMG Pro 17 (Late 2021, RTX 3080) 6.0.0 x64 1024 MiB [C: 36.5% (339.7/930.4 GiB)] (x5) [Interval=5 sec] | i7-11800H 135 W / 55 W | GeForce RTX 3080 Laptop GPU 105 W 16 GB | 32 GB | 1666 |
| Schenker Vision 14 2022 RTX 3050 Ti 6.0.2 x64 1024 MiB [C: 7.6% (71.0/930.4 GiB)] (x5) [Interval=5 sec] | i7-12700H 60 W / 40 W | GeForce RTX 3050 Ti Laptop GPU 45 W 1635 / 1375 MHz 4 GB | 32 GB | 2296.79 |
| Schenker XMG Neo 17 M22 | R9 6900HX 85 W / 45 W | GeForce RTX 3080 Ti Laptop GPU 175 W 1590 / 2000 MHz 16 GB | 32 GB | 2513.2 |
| Model | CPU | GPU | RAM | Value |
|---|---|---|---|---|
| HP ZBook Firefly 16 G9-6B897EA 6.0.1 x64 1024 MiB [C: 7.0% (66.5/952.7 GiB)] (x5) [Interval=5 sec] | i7-1265U 51 W / 12 W | T550 Laptop GPU 20 W 1665 / 1500 MHz 4 GB | 32 GB | 457.5 |
| Asus ZenBook S13 OLED UX5304 6.0.1 x64 1024 MiB [C: 5.5% (52.1/952.4 GiB)] (x5) [Interval=5 sec] | i7-1355U 44 W / 17 W | Iris Xe G7 96EUs 1300 MHz | 16 GB | 566 |
| Asus Zenbook 17 Fold UX9702 6.0.1 x64 1024 MiB [C: 5.2% (49.4/952.5 GiB)] (x5) [Interval=5 sec] | i7-1250U 29 W / 16 W | Iris Xe G7 80EUs 950 MHz | 16 GB | 567.96 |
| Lenovo Yoga Slim 7 Carbon 13IAP7-82U9005FGE 6.0.1 x64 1024 MiB [C: 19.6% (186.5/951.6 GiB)] (x5) [Interval=5 sec] | i7-1260P 46 W / 28 W | Iris Xe G7 96EUs 1400 / 2400 MHz | 16 GB | 720.43 |
| Dell XPS 13 Plus 9320 4K 6.0.1 x64 1024 MiB [C: 15.9% (148.3/934.4 GiB)] (x5) [Interval=5 sec] | i7-1260P 64 W / 34 W | Iris Xe G7 96EUs 1400 MHz | 32 GB | 764.6 |
| Lenovo ThinkPad T14 G3-21AJS00400 6.0.1 x64 1024 MiB [C: 6.0% (57.5/951.6 GiB)] (x5) [Interval=5 sec] | i7-1260P 58 W / 42 W | GeForce MX550 30 W 1710 / 1500 MHz 2 GB | 16 GB | 826 |
| Lenovo Yoga Pro 7 14IRH G8 6.0.1 x64 1024 MiB [C: 13.8% (130.9/951.6 GiB)] (x5) [Interval=5 sec] | i7-13700H 80 W / 53 W | GeForce RTX 4050 Laptop GPU 55 W 1905 / 2000 MHz 6 GB | 16 GB | 859 |
| Lenovo Yoga Pro 9-14IRP G8 6.0.1 x64 1024 MiB [C: 8.6% (81.6/951.6 GiB)] (x5) [Interval=5 sec] | i7-13705H 104 W / 75 W | GeForce RTX 4050 Laptop GPU 80 W 2055 / 2000 MHz 6 GB | 32 GB | 882 |
| Lenovo Yoga Pro 9 16-IRP G8 6.0.1 x64 1024 MiB [C: 7.1% (67.9/951.6 GiB)] (x5) [Interval=5 sec] | i7-13705H 125 W / 80 W | GeForce RTX 4060 Laptop GPU 100 W 8 GB | 16 GB | 943 |
| Lenovo Yoga Pro 7 14ARP G8 6.0.1 x64 1024 MiB [C: 3.8% (36.3/953.1 GiB)] (x5) [Interval=5 sec] | R7 7735HS 60 W / 54 W | Radeon 680M | 16 GB | 1009 |
| Dell XPS 14 2024 OLED 6.0.1 x64 1024 MiB [C: 9.2% (85.1/925.7 GiB)] (x5) [Interval=5 sec] | Ultra 7 155H 64 W / 30 W | GeForce RTX 4050 Laptop GPU 30 W 1605 / 2000 MHz 4 GB | 32 GB | 1028 |
| HP ZBook Power 15 G9 6B8C4EA 6.0.1 x64 1024 MiB [C: 7.2% (68.3/952.7 GiB)] (x5) [Interval=5 sec] | i7-12700H 90 W / 55 W | RTX A2000 Laptop GPU 45 W 1335 / 1368 MHz 8 GB | 32 GB | 1041.79 |
| Lenovo Yoga Slim 7 14APU G8 6.0.1 x64 1024 MiB [C: 7.6% (72.4/951.6 GiB)] (x5) [Interval=5 sec] | R7 7840S 52 W / 42 W | Radeon 780M ? / 800 MHz | 32 GB | 1116 |
| Lenovo Yoga Pro 7 14APH G8 6.0.1 x64 1024 MiB [C: 15.9% (151.5/951.6 GiB)] (x5) [Interval=5 sec] | R7 7840HS 60 W / 54 W | Radeon 780M | 32 GB | 1203 |
| Asus ROG Zephyrus G14 GA402XY 6.0.1 x64 1024 MiB [C: 8.2% (76.2/926.6 GiB)] (x5) [Interval=5 sec] | R9 7940HS 80 W / 80 W | GeForce RTX 4090 Laptop GPU 125 W 1455 / 2250 MHz 16 GB | 32 GB | 1322 |
| Alienware x15 R2 P111F | i9-12900H 140 W / 140 W | GeForce RTX 3080 Ti Laptop GPU 140 W 16 GB | 32 GB | 1373.5 |
| Asus ProArt StudioBook 16 H7600ZW | i9-12900H 115 W / 110 W | GeForce RTX 3070 Ti Laptop GPU 115 W 8 GB | 32 GB | 1390.3 |
| Asus Zenbook S 13 OLED 6.0.1 x64 1024 MiB [C: 4.9% (46.8/952.2 GiB)] (x5) [Interval=5 sec] | R7 6800U 30 W / 25 W | Radeon 680M 2200DC MHz | 16 GB | 1559.86 |
| MSI Prestige 13 AI Evo 6.0.1 x64 1024 MiB [C: 14.6% (135.6/931.1 GiB)] (x5) [Interval=5 sec] | Ultra 7 155H | Arc 8-Core | 32 GB | 2098 |
| Acer Predator Helios 300 (i7-12700H, RTX 3070 Ti) 6.0.0 x64 1024 MiB [C: 37.2% (354.4/952.6 GiB)] (x5) [Interval=5 sec] | i7-12700H 115 W / 115 W | GeForce RTX 3070 Ti Laptop GPU 150 W 8 GB | 32 GB | 2262.05 |
| Lenovo Yoga 9i 14 2022 i7-1260P 6.0.1 x64 1024 MiB [C: 8.3% (79.4/951.6 GiB)] (x5) [Interval=5 sec] | i7-1260P 64 W / 38 W | Iris Xe G7 96EUs 1400 / 2600 MHz | 16 GB | 2478.22 |
| Razer Blade 17 (i7-12800H, RTX 3070 Ti) 6.0.0 x64 1024 MiB [C: 13.7% (127.7/934.5 GiB)] (x5) [Interval=5 sec] | i7-12800H 110 W / 60 W | GeForce RTX 3070 Ti Laptop GPU 150 W 8 GB | 16 GB | 2680.19 |
| MSI Stealth 14 Studio A13V 6.0.1 x64 1024 MiB [C: 38.8% (358.9/926.3 GiB)] (x5) [Interval=5 sec] | i7-13700H 110 W / 85 W | GeForce RTX 4050 Laptop GPU 90 W 2370 / 2000 MHz 6 GB | 16 GB | 2777 |
| Alienware m15 R6, i7-11800H RTX 3080 | i7-11800H 90 W / 50 W | GeForce RTX 3080 Laptop GPU 125 W 8 GB | 32 GB | 2823 |
| Lenovo Legion 5 16IRX G9 6.0.1 x64 1024 MiB [C: 7.7% (73.7/951.6 GiB)] (x5) [Interval=5 sec] | i7-14650HX 140 W / 100 W | GeForce RTX 4060 Laptop GPU 125 W 2430 / 2050 MHz 8 GB | 16 GB | 2836 |
| Lenovo Legion Pro 5 16IRX9 G9 6.0.0 x64 1024 MiB [C: 27.0% (257.1/951.6 GiB)] (x5) [Interval=5 sec] | i7-14700HX 190 W / 130 W | GeForce RTX 4060 Laptop GPU 140 W 8 GB | 32 GB | 2842 |
| MSI Titan GT77 12UHS | i9-12900HX 200 W / 125 W | GeForce RTX 3080 Ti Laptop GPU 175 W 16 GB | 64 GB | 2927.6 |
| MSI CreatorPro Z16P B12UKST 6.0.1 x64 1024 MiB [C: 9.7% (90.5/934.1 GiB)] (x5) [Interval=5 sec] | i7-12700H 74 W / 64 W | RTX A3000 Laptop GPU 90 W 1440 / 1750 MHz 12 GB | 32 GB | 3031.56 |
| Acer Swift X SFX14-71G 6.0.1 x64 1024 MiB [C: 6.5% (61.6/952.6 GiB)] (x5) [Interval=5 sec] | i7-13700H 80 W / 40 W | GeForce RTX 4050 Laptop GPU 50 W 1605 / 2000 MHz 6 GB | 16 GB | 3035 |
| Lenovo Legion 5 Pro 16 G7 i7 RTX 3070Ti 6.0.1 x64 1024 MiB [C: 9.5% (90.8/951.6 GiB)] (x5) [Interval=5 sec] | i7-12700H 124 W / 108 W | GeForce RTX 3070 Ti Laptop GPU 150 W 1702 / 1750 MHz 8 GB | 16 GB | 3047 |
| Razer Blade 14 2025 6.0.1 x64 1024 MiB [C: 9.7% (90.3/927.8 GiB)] (x5) [Interval=5 sec] | Ryzen AI 9 365 70 W / 60 W | GeForce RTX 5070 Laptop 115 W 2632 / 1500 MHz | 32 GB | 3075 |
| Model | CPU | GPU | RAM | Value |
|---|---|---|---|---|
| Schenker XMG Neo 15 (i7-12700H, RTX 3080 Ti) 6.0.0 x64 1024 MiB [C: 42.4% (394.2/930.4 GiB)] (x5) [Interval=5 sec] | i7-12700H 95 W / 95 W | GeForce RTX 3080 Ti Laptop GPU 175 W 16 GB | 32 GB | 1053.42 |
| Schenker Vision 16 Pro RTX 3070 Ti 6.0.1 x64 1024 MiB [C: 7.6% (71.1/930.4 GiB)] (x5) [Interval=5 sec] | i7-12700H 45 W / 45 W | GeForce RTX 3070 Ti Laptop GPU 95 W 1035 / 1500 MHz 8 GB | 32 GB | 1064.92 |
| Schenker XMG Pro 15 (i7-12700H, RTX 3080 Ti) 6.0.0 x64 1024 MiB [C: 39.7% (369.3/930.4 GiB)] (x5) [Interval=5 sec] | i7-12700H 115 W / 45 W | GeForce RTX 3080 Ti Laptop GPU 155 W 16 GB | 32 GB | 1675.99 |
| Schenker Vision 14 6.0.1 x64 1024 MiB [C: 15.9% (148.3/930.4 GiB)] (x5) [Interval=5 sec] | i7-11370H 46 W / 40 W | GeForce RTX 3050 Ti Laptop GPU 35 W 4 GB | 32 GB | 2563 |
| Schenker Vision 14 2022 RTX 3050 Ti 6.0.2 x64 1024 MiB [C: 7.6% (71.0/930.4 GiB)] (x5) [Interval=5 sec] | i7-12700H 60 W / 40 W | GeForce RTX 3050 Ti Laptop GPU 45 W 1635 / 1375 MHz 4 GB | 32 GB | 2826.12 |
| Schenker XMG Pro 17 (Late 2021, RTX 3080) 6.0.0 x64 1024 MiB [C: 36.5% (339.7/930.4 GiB)] (x5) [Interval=5 sec] | i7-11800H 135 W / 55 W | GeForce RTX 3080 Laptop GPU 105 W 16 GB | 32 GB | 2849 |
| Schenker XMG Neo 17 M22 | R9 6900HX 85 W / 45 W | GeForce RTX 3080 Ti Laptop GPU 175 W 1590 / 2000 MHz 16 GB | 32 GB | 2905.1 |

| Model | CPU | GPU | RAM | Value |
|---|---|---|---|---|
| Asus ROG Strix Scar 18 2023 G834JY-N6005W | i9-13980HX 0 W / 65 W | GeForce RTX 4090 Laptop GPU 175 W 2090 MHz 16 GB | 32 GB | 102.4 |
| Asus ROG Strix Scar 18 2023 G834JY-N6005W | i9-13980HX 175 W / 170 W | GeForce RTX 4090 Laptop GPU 175 W 2090 / 2250 MHz 16 GB | 32 GB | 103.7 |
| Lenovo Legion 5 Pro 16IAH7H | i7-12700H 120 W / 100 W | GeForce RTX 3060 Laptop GPU 115 W 1702 / 1750 MHz 6 GB | 16 GB | 237 |
| Model | CPU | GPU | RAM | Value |
|---|---|---|---|---|
| Asus ROG Strix Scar 18 2023 G834JY-N6005W | i9-13980HX 0 W / 65 W | GeForce RTX 4090 Laptop GPU 175 W 2090 MHz 16 GB | 32 GB | 56.9 |
| Asus ROG Strix Scar 18 2023 G834JY-N6005W | i9-13980HX 175 W / 170 W | GeForce RTX 4090 Laptop GPU 175 W 2090 / 2250 MHz 16 GB | 32 GB | 57.5 |
| Lenovo Legion 5 Pro 16IAH7H | i7-12700H 120 W / 100 W | GeForce RTX 3060 Laptop GPU 115 W 1702 / 1750 MHz 6 GB | 16 GB | 90.6 |
| Model | CPU | GPU | RAM | Value |
|---|---|---|---|---|
| Asus ROG Strix Scar 18 2023 G834JY-N6005W | i9-13980HX 0 W / 65 W | GeForce RTX 4090 Laptop GPU 175 W 2090 MHz 16 GB | 32 GB | 342 |
| Asus ROG Strix Scar 18 2023 G834JY-N6005W | i9-13980HX 175 W / 170 W | GeForce RTX 4090 Laptop GPU 175 W 2090 / 2250 MHz 16 GB | 32 GB | 350 |
| Lenovo Legion 5 Pro 16IAH7H | i7-12700H 120 W / 100 W | GeForce RTX 3060 Laptop GPU 115 W 1702 / 1750 MHz 6 GB | 16 GB | 1842 |
| Model | CPU | GPU | RAM | Value |
|---|---|---|---|---|
| Asus ROG Strix Scar 18 2023 G834JY-N6005W | i9-13980HX 0 W / 65 W | GeForce RTX 4090 Laptop GPU 175 W 2090 MHz 16 GB | 32 GB | 706 |
| Asus ROG Strix Scar 18 2023 G834JY-N6005W | i9-13980HX 175 W / 170 W | GeForce RTX 4090 Laptop GPU 175 W 2090 / 2250 MHz 16 GB | 32 GB | 711 |
| Lenovo Legion 5 Pro 16IAH7H | i7-12700H 120 W / 100 W | GeForce RTX 3060 Laptop GPU 115 W 1702 / 1750 MHz 6 GB | 16 GB | 1982 |
| Model | CPU | GPU | RAM | Value |
|---|---|---|---|---|
| Asus ROG Strix Scar 18 2023 G834JY-N6005W | i9-13980HX 0 W / 65 W | GeForce RTX 4090 Laptop GPU 175 W 2090 MHz 16 GB | 32 GB | 3988 |
| Asus ROG Strix Scar 18 2023 G834JY-N6005W | i9-13980HX 175 W / 170 W | GeForce RTX 4090 Laptop GPU 175 W 2090 / 2250 MHz 16 GB | 32 GB | 4199 |
| Lenovo Legion 5 Pro 16IAH7H | i7-12700H 120 W / 100 W | GeForce RTX 3060 Laptop GPU 115 W 1702 / 1750 MHz 6 GB | 16 GB | 7667 |
| Model | CPU | GPU | RAM | Value |
|---|---|---|---|---|
| Asus ROG Strix Scar 18 2023 G834JY-N6005W | i9-13980HX 0 W / 65 W | GeForce RTX 4090 Laptop GPU 175 W 2090 MHz 16 GB | 32 GB | 4837 |
| Asus ROG Strix Scar 18 2023 G834JY-N6005W | i9-13980HX 175 W / 170 W | GeForce RTX 4090 Laptop GPU 175 W 2090 / 2250 MHz 16 GB | 32 GB | 4842 |
| Lenovo Legion 5 Pro 16IAH7H | i7-12700H 120 W / 100 W | GeForce RTX 3060 Laptop GPU 115 W 1702 / 1750 MHz 6 GB | 16 GB | 5544 |
| Model | CPU | GPU | RAM | Value |
|---|---|---|---|---|
| Asus ROG Strix Scar 18 2023 G834JY-N6005W | i9-13980HX 0 W / 65 W | GeForce RTX 4090 Laptop GPU 175 W 2090 MHz 16 GB | 32 GB | 8297 |
| Asus ROG Strix Scar 18 2023 G834JY-N6005W | i9-13980HX 175 W / 170 W | GeForce RTX 4090 Laptop GPU 175 W 2090 / 2250 MHz 16 GB | 32 GB | 8404 |
| Lenovo Legion 5 Pro 16IAH7H | i7-12700H 120 W / 100 W | GeForce RTX 3060 Laptop GPU 115 W 1702 / 1750 MHz 6 GB | 16 GB | 10203 |
| Model | CPU | GPU | RAM | Value |
|---|---|---|---|---|
| Asus ROG Strix Scar 18 2023 G834JY-N6005W | i9-13980HX 175 W / 170 W | GeForce RTX 4090 Laptop GPU 175 W 2090 / 2250 MHz 16 GB | 32 GB | 10774 |
| Asus ROG Strix Scar 18 2023 G834JY-N6005W | i9-13980HX 0 W / 65 W | GeForce RTX 4090 Laptop GPU 175 W 2090 MHz 16 GB | 32 GB | 11380 |
| Lenovo Legion 5 Pro 16IAH7H | i7-12700H 120 W / 100 W | GeForce RTX 3060 Laptop GPU 115 W 1702 / 1750 MHz 6 GB | 16 GB | 12143 |
| Model | CPU | GPU | RAM | Value |
|---|---|---|---|---|
| Asus ROG Strix Scar 18 2023 G834JY-N6005W | i9-13980HX 0 W / 65 W | GeForce RTX 4090 Laptop GPU 175 W 2090 MHz 16 GB | 32 GB | 7580 |
| Asus ROG Strix Scar 18 2023 G834JY-N6005W | i9-13980HX 175 W / 170 W | GeForce RTX 4090 Laptop GPU 175 W 2090 / 2250 MHz 16 GB | 32 GB | 10730 |
| Lenovo Legion 5 Pro 16IAH7H | i7-12700H 120 W / 100 W | GeForce RTX 3060 Laptop GPU 115 W 1702 / 1750 MHz 6 GB | 16 GB | 12096 |
* Smaller numbers mean a higher performance
Average Benchmarks
Samsung PM9A1 MZVL21T0HCLR → 100% n=23
Samsung SSD 980 Pro 1TB MZ-V8P1T0BW → 101% n=23
2x Samsung PM9A1 MZVL21T0HCLR (RAID 0) → 89% n=23
- $297.50Samsung SSD 1TB PM9A1 NVMe PCIe 3.0 Gen3 x4 MZVL21T0HCLR 00BD1 KG5N3 0KG5N3 Solid State Drive for Dell Alienware HP Lenovo Laptop Desktop
- $294.88Samsung PM9A1 MZ-VL21T100 1TB PCIe 4.0 NVMe 2280 Solid State Drive, 7000MB/s Read, 5200MB/s Write, 1000K IOPS Ran. Read, 850K IOPS Ran. Write - PM9A1
- $109.00Samsung SSD PM9A1 M.2 NVMe 512GB
- $299.50Samsung SSD PM9A1 M.2 NVMe 1TB
- $249.00Samsung 980 PRO 1TB PCIe 4.0 NVME M.2 SSD (MZ-V8P1T0BW)
#0 ran 0s before starting gpusingle class +0s ... 0s
#1 checking url part for id 3657 +0s ... 0s
#2 checking url part for id 3586 +0s ... 0s
#3 checking url part for id 3868 +0s ... 0s
#4 redirected to Ajax server, took 1779724765s time from redirect:0 +0s ... 0s
#5 did not recreate cache, as it is less than 5 days old! Created at Fri, 22 May 2026 22:44:23 +0200 +0s ... 0s
#6 composed specs +0.003s ... 0.003s
#7 did output specs +0s ... 0.003s
#8 getting avg benchmarks for device 3657 +0.003s ... 0.007s
#9 got single benchmarks 3657 +0.061s ... 0.068s
#10 getting avg benchmarks for device 3586 +0.004s ... 0.072s
#11 got single benchmarks 3586 +0.016s ... 0.088s
#12 getting avg benchmarks for device 3868 +0.003s ... 0.091s
#13 got single benchmarks 3868 +0.003s ... 0.094s
#14 got avg benchmarks for devices +0s ... 0.094s
#15 min, max, avg, median took s +0.075s ... 0.169s
#16 return log +0.528s ... 0.698s