Notebookcheck Logo

AMD FX-9830P vs Intel Core i7-7820HK vs Intel Core i7-7700HQ

AMD FX-9830P

► remove from comparison AMD FX-9830P

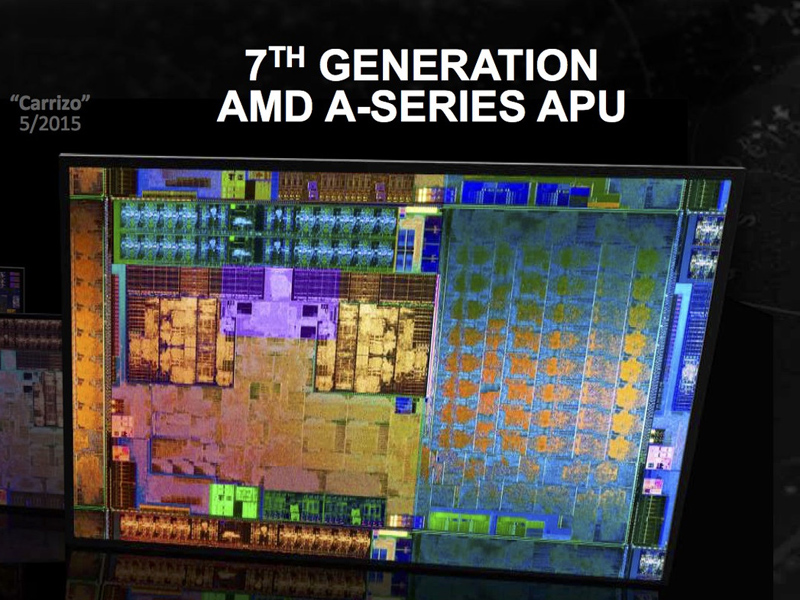
The AMD FX-9830P is a mobile mainstream SoC from the Bristol-Ridge APU series for notebooks (7th APU generation), which was announced mid 2016. The FX-9830P is the fastest Bristol Ridge APU with a 45-Watt TDP and the successor to the 15-35-Watt FX-8800P from the Carrizo generation. The chip has four CPU cores (two Excavator modules = 4 integer and 2 FP units), a Radeon R7 GPU as well as a dual-channel DDR4-1866 memory controller. Carrizo is a full-fledged SoC and is also equipped with an integrated chipset, which provides all I/0 ports.

Architecture

Bristol Ridge is the successor of the Carrizo architecture and the design is almost identical. Thanks to optimized manufacturing processes and more aggressive Boost behavior, however, the clocks are a bit higher at the same power consumption. The memory controller now also supports DDR4-RAM, in this case up to 2400 MHz. More technical details are available in the following articles:

Performance

Thanks to higher clocks, the FX9830P is slightly ahead of the old 35-Watt top model FX-8800P and competes with the entry-level dual-cores from Intel (Skylake and Kaby Lake). Compared to the Intel model, the AMD chip has a small advantage in multi-thread scenarios, but is beaten when you only stress one or two cores.

This means there is sufficient performance for typical office and web applications as well as light multitasking.

Graphics Card

The integrated Radeon R7 (Bristol Ridge) GPU has 512 active shader units (8 compute cores) clocked at up to 900 MHz (compared to 758 MHz for FX-9800P). Thanks to the better utilization of the clock range as well as faster DDR4-RAm, the GPU can slightly beat its predecessors Radeon R7 (Carrizo) and competes with a dedicated GeForce 920MX in the best-case scenario (dual-channel memory). Many games from 2015/2016 can be played smoothly at low settings. 

Power Consumption

AMD specifies the TDP of the FX-9830P with 25-45 Watts, which is comparable to Intel quad-core processors from the H-series. This means the APU is a good choice for big and heavy notebooks with at least 15 inches.

Intel Core i7-7820HK

► remove from comparison Intel i7-7820HK

The Intel Core i7-7820HK is a fast quad-core processor for notebooks based on the Kaby Lake architecture and was announced in January 2017. It is the second fastest model of the consumer series at the time of the announcement. Only the i7-7920HQ and Xeon E3-1535M v6 are faster. Besides four cores including Hyper-Threading support running at 2.9 - 3.9 GHz (4 cores up to 3.5 GHz, 2 cores up to 3.7 GHz), the processor is also equipped with the HD Graphics 630 GPU as well as a dual-channel memory controller (DDR3L-1600/DDR4-2400). It is manufactured in a 14nm process with FinFET transistors.

Compared to the Core i7-7820HQ, the 7820HK lacks business features like vPro or TXT support.

Architecture

Intel basically uses the same micro architecture compared to Skylake, so the per-MHz performance does not differ. The manufacturer only reworked the Speed Shift technology for faster dynamic adjustments of voltages and clocks, and the improved 14nm process allows much higher frequencies combined with better efficiency than before.

Performance

Due to the higher clock speeds, the performance of the i7-7820HK is slightly faster than the old Skylake top model Core i7-6920HQ (2.9 - 3.8 GHz). The performance is sufficient even for very demanding tasks and on par with powerful desktop quad-core processors.

Graphics

The integrated Intel HD Graphics 630 has 24 Execution Units (similar to previous HD Graphics 530) running at 350 - 1100 MHz. The performance depends a lot on the memory configuration; it should be comparable to a dedicated Nvidia GeForce 920M in combination with fast DDR4-2133 dual-channel memory.

Contrary to Skylake, Kaby Lake now supports hardware decoding for H.265/HEVC Main 10 with a 10-bit color depth as well as Google's VP9 codec. The dual-core Kaby Lake processors, which were announced in January, should also support HDCP 2.2.

Power Consumption

The chip is manufactured in an improved 14nm process with FinFET transistors, which improves the efficiency even further. Intel still specifies the TDP with 45 Watts, but it can also be reduced to 35 Watts by the notebook manufacturers (cTDP down). This will obviously affect the performance, because the Turbo Boost cannot be maintained for longer periods.

Intel Core i7-7700HQ

► remove from comparison Intel i7-7700HQ

The Intel Core i7-7700HQ is a fast quad-core processor for notebooks based on the Kaby Lake H architecture (7th generation Core), which was announced in January 2017 at CES. It is the successor to the Core i7-6700HQ from the Skylake generation and is manufactured in an improved 14 nm+ process, so the clocks are 200 MHz higher at the same TDP. The architecture was not changed, only the video engine got an update (see our Kaby Lake article).

The integrated graphics card is called Intel HD Graphics 630, but the architecture does not differ from the 530 GPU from the Skylake generation and only the clocks are slightly higher. 

Performance

Thanks to the 200 MHz higher clocks (5.5-7.6% depending on the Boost), the CPU performance is increased and roughly on par with the Core i7-6970HQ (2.8-3.7 GHz but with 128 MB eDRAM). The TDP can also be reduced to 35 Watts (cTDP down), but this will reduce the performance.

Power Consumption

Due to its 45-Watt TDP, the CPU will be used in bigger notebooks with at least 15 inches most of the time.

ModelAMD FX-9830PIntel Core i7-7820HKIntel Core i7-7700HQ
SeriesAMD Bristol RidgeIntel Kaby LakeIntel Kaby Lake
CodenameBristol RidgeKaby LakeKaby Lake
Series: Kaby Lake Kaby Lake
AMD FX-9830P « 3 - 3.7 GHz4 / 4 cores
AMD PRO A12-9830B3 - 3.7 GHz4 / 4 cores
AMD FX-9800P2.7 - 3.6 GHz4 / 4 cores
AMD PRO A12-9800B2.7 - 3.6 GHz4 / 4 cores
AMD A12-9720P2.7 - 3.6 GHz4 / 4 cores
AMD A12-9700P2.5 - 3.4 GHz4 / 4 cores
AMD A10-9620P2.5 - 3.4 GHz4 / 4 cores
AMD A10-9600P2.4 - 3.3 GHz4 / 4 cores
AMD PRO A8-9600B2.4 - 3.3 GHz4 / 4 cores
Intel Core i7-7700K4.2 - 4.5 GHz4 / 8 cores8 MB L3
Intel Core i7-77003.6 - 4.2 GHz4 / 8 cores8 MB L3
Intel Xeon E3-1535M v63.1 - 4.2 GHz4 / 8 cores8 MB L3
Intel Core i7-7920HQ3.1 - 4.1 GHz4 / 8 cores8 MB L3
Intel Core i7-7700T2.9 - 3.8 GHz4 / 8 cores8 MB L3
Intel Core i5-7600K3.8 - 4.2 GHz4 / 4 cores8 MB L3
Intel Xeon E3-1505M v63 - 4 GHz4 / 8 cores8 MB L3
Intel Core i7-7820HQ2.9 - 3.9 GHz4 / 8 cores8 MB L3
Intel Core i7-7820HK « 2.9 - 3.9 GHz4 / 8 cores8 MB L3
Intel Core i7-7700HQ2.8 - 3.8 GHz4 / 8 cores6 MB L3
Intel Core i5-75003.4 - 3.8 GHz4 / 4 cores6 MB L3
Intel Core i5-7440HQ2.8 - 3.8 GHz4 / 4 cores6 MB L3
Intel Core i7-7567U3.5 - 4 GHz2 / 4 cores4 MB L3
Intel Core i7-7660U2.5 - 4 GHz2 / 4 cores4 MB L3
Intel Core i7-7600U2.8 - 3.9 GHz2 / 4 cores4 MB L3
Intel Core i5-7300HQ2.5 - 3.5 GHz4 / 4 cores6 MB L3
Intel Core i5-7500T2.7 - 3.3 GHz4 / 4 cores6 MB L3
Intel Core i5-7287U3.3 - 3.7 GHz2 / 4 cores4 MB L3
Intel Core i7-7560U2.4 - 3.8 GHz2 / 4 cores4 MB L3
Intel Core i5-7267U3.1 - 3.5 GHz2 / 4 cores4 MB L3
Intel Core i5-7360U2.3 - 3.6 GHz2 / 4 cores4 MB L3
Intel Core i7-7500U2.7 - 3.5 GHz2 / 4 cores4 MB L3
Intel Core i5-7300U2.6 - 3.5 GHz2 / 4 cores3 MB L3
Intel Core i5-7260U2.2 - 3.4 GHz2 / 4 cores4 MB L3
Intel Core i5-7200U2.5 - 3.1 GHz2 / 4 cores3 MB L3
Intel Core i3-7100H3 GHz2 / 4 cores3 MB L3
Intel Core i3-7167U2.8 GHz2 / 4 cores3 MB L3
Intel Core i7-7Y751.3 - 3.6 GHz2 / 4 cores4 MB L3
Intel Core i5-7Y571.2 - 3.3 GHz2 / 4 cores4 MB L3
Intel Core i5-7Y541.2 - 3.2 GHz2 / 4 cores4 MB L3
Intel Core i3-7100U2.4 GHz2 / 4 cores3 MB L3
Intel Core m3-7Y321 - 3 GHz2 / 4 cores4 MB L3
Intel Pentium Gold 4415U2.3 GHz2 / 4 cores2 MB L3
Intel Core m3-7Y301 - 2.6 GHz2 / 4 cores4 MB L3
Intel Celeron 3965U2.2 GHz2 / 2 cores2 MB L3
Intel Core i3-7020U2.3 GHz2 / 4 cores3 MB L3
Intel Celeron 3867U1.8 GHz2 / 2 cores2 MB L3
Intel Celeron 3865U1.8 GHz2 / 2 cores2 MB L3
Intel Pentium Gold 4425Y1.7 GHz2 / 4 cores2 MB L3
Intel Pentium Gold 4415Y1.6 GHz2 / 4 cores2 MB L3
Intel Pentium Gold 4410Y1.5 GHz2 / 4 cores2 MB L3
Intel Celeron 3965Y1.5 GHz2 / 2 cores2 MB L3
Intel Core i7-7700K4.2 - 4.5 GHz4 / 8 cores8 MB L3
Intel Core i7-77003.6 - 4.2 GHz4 / 8 cores8 MB L3
Intel Xeon E3-1535M v63.1 - 4.2 GHz4 / 8 cores8 MB L3
Intel Core i7-7920HQ3.1 - 4.1 GHz4 / 8 cores8 MB L3
Intel Core i7-7700T2.9 - 3.8 GHz4 / 8 cores8 MB L3
Intel Core i5-7600K3.8 - 4.2 GHz4 / 4 cores8 MB L3
Intel Xeon E3-1505M v63 - 4 GHz4 / 8 cores8 MB L3
Intel Core i7-7820HQ2.9 - 3.9 GHz4 / 8 cores8 MB L3
Intel Core i7-7820HK2.9 - 3.9 GHz4 / 8 cores8 MB L3
Intel Core i7-7700HQ « 2.8 - 3.8 GHz4 / 8 cores6 MB L3
Intel Core i5-75003.4 - 3.8 GHz4 / 4 cores6 MB L3
Intel Core i5-7440HQ2.8 - 3.8 GHz4 / 4 cores6 MB L3
Intel Core i7-7567U3.5 - 4 GHz2 / 4 cores4 MB L3
Intel Core i7-7660U2.5 - 4 GHz2 / 4 cores4 MB L3
Intel Core i7-7600U2.8 - 3.9 GHz2 / 4 cores4 MB L3
Intel Core i5-7300HQ2.5 - 3.5 GHz4 / 4 cores6 MB L3
Intel Core i5-7500T2.7 - 3.3 GHz4 / 4 cores6 MB L3
Intel Core i5-7287U3.3 - 3.7 GHz2 / 4 cores4 MB L3
Intel Core i7-7560U2.4 - 3.8 GHz2 / 4 cores4 MB L3
Intel Core i5-7267U3.1 - 3.5 GHz2 / 4 cores4 MB L3
Intel Core i5-7360U2.3 - 3.6 GHz2 / 4 cores4 MB L3
Intel Core i7-7500U2.7 - 3.5 GHz2 / 4 cores4 MB L3
Intel Core i5-7300U2.6 - 3.5 GHz2 / 4 cores3 MB L3
Intel Core i5-7260U2.2 - 3.4 GHz2 / 4 cores4 MB L3
Intel Core i5-7200U2.5 - 3.1 GHz2 / 4 cores3 MB L3
Intel Core i3-7100H3 GHz2 / 4 cores3 MB L3
Intel Core i3-7167U2.8 GHz2 / 4 cores3 MB L3
Intel Core i7-7Y751.3 - 3.6 GHz2 / 4 cores4 MB L3
Intel Core i5-7Y571.2 - 3.3 GHz2 / 4 cores4 MB L3
Intel Core i5-7Y541.2 - 3.2 GHz2 / 4 cores4 MB L3
Intel Core i3-7100U2.4 GHz2 / 4 cores3 MB L3
Intel Core m3-7Y321 - 3 GHz2 / 4 cores4 MB L3
Intel Pentium Gold 4415U2.3 GHz2 / 4 cores2 MB L3
Intel Core m3-7Y301 - 2.6 GHz2 / 4 cores4 MB L3
Intel Celeron 3965U2.2 GHz2 / 2 cores2 MB L3
Intel Core i3-7020U2.3 GHz2 / 4 cores3 MB L3
Intel Celeron 3867U1.8 GHz2 / 2 cores2 MB L3
Intel Celeron 3865U1.8 GHz2 / 2 cores2 MB L3
Intel Pentium Gold 4425Y1.7 GHz2 / 4 cores2 MB L3
Intel Pentium Gold 4415Y1.6 GHz2 / 4 cores2 MB L3
Intel Pentium Gold 4410Y1.5 GHz2 / 4 cores2 MB L3
Intel Celeron 3965Y1.5 GHz2 / 2 cores2 MB L3
Clock3000 - 3700 MHz2900 - 3900 MHz2800 - 3800 MHz
L2 Cache2 MB1 MB1 MB
Cores / Threads4 / 44 / 84 / 8
TDP25-45 Watt45 Watt45 Watt
Transistors3100 Million
Technology28 nm14 nm14 nm
Die Size250 mm2
max. Temp.90 °C100 °C100 °C
FeaturesDual-Channel DDR3/DDR4-1866 Memory Controller, PCIe 3.0 x8Dual-Channel DDR4 Memory Controller, HyperThreading, AVX, AVX2, Quick Sync, Virtualization, AES-NIDual-Channel DDR3L-1600/DDR4-2133 Memory Controller, AVX, AVX2, Quick Sync, Virtualization, AES-NI save
iGPUAMD Radeon R7 (Bristol Ridge) ( - 900 MHz)Intel HD Graphics 630 (300 - 1150 MHz)Intel HD Graphics 630 (350 - 1100 MHz)
Architecturex86x86x86
Announced
Manufacturerproducts.amd.com
L1 Cache256 KB256 KB
L3 Cache8 MB6 MB
$378 U.S.$378 U.S.
SocketBGA

Benchmarks

Performance Rating - CB R15 + R20 + 7-Zip + X265 + Blender + 3DM11 CPU - i7-7700HQ
28.2 pt (39%)
Cinebench R20 - Cinebench R20 CPU (Single Core)
min: 358     avg: 370     median: 370 (41%)     max: 382 Points
Cinebench R20 - Cinebench R20 CPU (Multi Core)
min: 1765     avg: 1774     median: 1774 (4%)     max: 1783 Points
Cinebench R15 - Cinebench R15 CPU Multi 64 Bit
301 Points (2%)
min: 689     avg: 773     median: 770 (5%)     max: 867 Points
min: 603     avg: 727     median: 734 (5%)     max: 747 Points
Cinebench R15 - Cinebench R15 CPU Single 64 Bit
93 Points (28%)
min: 156     avg: 162.7     median: 162 (49%)     max: 171 Points
min: 120     avg: 155.4     median: 159 (48%)     max: 162 Points
Cinebench R11.5 - Cinebench R11.5 CPU Multi 64 Bit
3.6 Points (5%)
min: 8.34     avg: 8.6     median: 8.4 (11%)     max: 9.53 Points
min: 6.67     avg: 8     median: 8.1 (11%)     max: 8.23 Points
Cinebench R11.5 - Cinebench R11.5 CPU Single 64 Bit
1.1 Points (27%)
min: 1.69     avg: 1.8     median: 1.8 (46%)     max: 1.85 Points
min: 1.36     avg: 1.8     median: 1.8 (45%)     max: 1.84 Points
Cinebench R10 - Cinebench R10 Rend. Single (32bit)
3033 Points (18%)
min: 6062     avg: 6231     median: 6182 (37%)     max: 6566 Points
min: 5426     avg: 5882     median: 5910 (36%)     max: 7214 Points
Cinebench R10 - Cinebench R10 Rend. Multi (32bit)
9822 Points (7%)
min: 22793     avg: 23622     median: 23046.5 (17%)     max: 26081 Points
min: 19409     avg: 22384     median: 22152 (16%)     max: 29209 Points
Cinebench R10 - Cinebench R10 Rend. Multi (64bit)
min: 32769     avg: 34129.5     median: 34129.5 (24%)     max: 35490 Points
min: 28341     avg: 28770     median: 28724.5 (20%)     max: 29210 Points
Cinebench R10 - Cinebench R10 Rend. Single (64bit)
min: 8465     avg: 8558.5     median: 8558.5 (10%)     max: 8652 Points
min: 7347     avg: 7559     median: 7584 (9%)     max: 7795 Points
wPrime 2.10 - wPrime 2.0 1024m *
315.9 s (4%)
min: 179.4     avg: 234.7     median: 214.3 (3%)     max: 330.9 s
min: 210.4     avg: 257.2     median: 225.7 (3%)     max: 379 s
wPrime 2.10 - wPrime 2.0 32m *
10.3 s (2%)
min: 6.668     avg: 10.4     median: 8.6 (2%)     max: 17.8 s
min: 6.932     avg: 8.7     median: 7.5 (2%)     max: 20.1 s
wPrime 1.55 - wPrime 1.55 1024m *
215.4 s (1%)
212.2 s (1%)
wPrime 1.55 - wPrime 1.55 32m *
17.8 s (9%)
7.6 s (4%)
WinRAR - WinRAR 4.0
min: 5114     avg: 5135     median: 5134.5 (8%)     max: 5155 Points
min: 3763     avg: 4418     median: 4541.5 (7%)     max: 4903 Points
7-Zip 18.03 - 7-Zip 18.03 Multli Thread 4 runs
min: 18417     avg: 20916     median: 19916 (11%)     max: 25414 MIPS
7-Zip 18.03 - 7-Zip 18.03 Single Thread 4 runs
min: 3986     avg: 4405     median: 4088 (49%)     max: 5457 MIPS
X264 HD Benchmark 4.0 - x264 Pass 2
min: 46     avg: 46.9     median: 46.9 (16%)     max: 47.8 fps
min: 36.55     avg: 44.6     median: 46 (16%)     max: 46.45 fps
X264 HD Benchmark 4.0 - x264 Pass 1
min: 177     avg: 178.8     median: 178.8 (41%)     max: 180.6 fps
min: 156.9     avg: 168.1     median: 168.4 (39%)     max: 175 fps
HWBOT x265 Benchmark v2.2 - HWBOT x265 4k Preset
min: 5.97     avg: 6.2     median: 6 (11%)     max: 6.39 fps
TrueCrypt - TrueCrypt Serpent
0.3 GB/s (0%)
min: 0.416     avg: 0.5     median: 0.4 (0%)     max: 0.609 GB/s
min: 0.361     avg: 0.4     median: 0.4 (0%)     max: 0.6 GB/s
TrueCrypt - TrueCrypt Twofish
0.5 GB/s (8%)
min: 0.71     avg: 0.7     median: 0.7 (13%)     max: 0.831 GB/s
min: 0.529     avg: 0.7     median: 0.7 (12%)     max: 0.724 GB/s
TrueCrypt - TrueCrypt AES
2 GB/s (5%)
min: 3.9     avg: 4.2     median: 4.2 (11%)     max: 4.3 GB/s
min: 2.4     avg: 4     median: 4.1 (11%)     max: 4.2 GB/s
Blender - Blender 2.79 BMW27 CPU *
min: 597     avg: 631     median: 631 (4%)     max: 665 Seconds
R Benchmark 2.5 - R Benchmark 2.5 *
min: 0.7217     avg: 0.7     median: 0.7 (16%)     max: 0.7605 sec
3DMark 06 - CPU - 3DMark 06 - CPU
min: 7957     avg: 8098     median: 8038 (17%)     max: 8360 Points
min: 6876     avg: 7596     median: 7686 (16%)     max: 7839 Points
Super Pi mod 1.5 XS 1M - Super Pi mod 1.5 XS 1M *
18.6 s (4%)
min: 9     avg: 9.6     median: 9.6 (2%)     max: 10.5 s
min: 9     avg: 10.3     median: 10 (2%)     max: 14.8 s
Super Pi mod 1.5 XS 2M - Super Pi mod 1.5 XS 2M *
43.7 s (2%)
min: 20.67     avg: 21.7     median: 21.5 (1%)     max: 23.5 s
min: 22     avg: 23.3     median: 22.7 (1%)     max: 33.4 s
Super Pi Mod 1.5 XS 32M - Super Pi mod 1.5 XS 32M *
870 s (4%)
min: 490.5     avg: 529     median: 535 (2%)     max: 550 s
min: 511     avg: 565     median: 551 (2%)     max: 921 s
3DMark Vantage - 3DM Vant. Perf. CPU no Physx
30280 Points (27%)
min: 22514     avg: 25520     median: 26567 (23%)     max: 26880 Points
3DMark 11 - 3DM11 Performance Physics
min: 3051     avg: 3081     median: 3080.5 (8%)     max: 3110 Points
min: 9542     avg: 10034     median: 10019 (27%)     max: 10523 Points
min: 6007     avg: 8386     median: 8833 (24%)     max: 9653 Points
3DMark - 3DMark Ice Storm Physics
34521 Points (28%)
min: 51307     avg: 53563     median: 52699.5 (43%)     max: 59600 Points
min: 13754     avg: 46073     median: 47945 (39%)     max: 52765 Points
3DMark - 3DMark Ice Storm Extreme Physics
31580 Points (26%)
min: 50796     avg: 53623     median: 52515.5 (43%)     max: 59482 Points
min: 33185     avg: 46275     median: 47639 (39%)     max: 52753 Points
3DMark - 3DMark Ice Storm Unlimited Physics
34398 Points (29%)
min: 51327     avg: 54058     median: 52784.5 (44%)     max: 60127 Points
min: 42156     avg: 50621     median: 50806 (43%)     max: 53642 Points
3DMark - 3DMark Cloud Gate Physics
2945 Points (7%)
min: 7905     avg: 8141     median: 8001.5 (20%)     max: 9050 Points
min: 4328     avg: 7329     median: 7518.5 (19%)     max: 7867 Points
3DMark - 3DMark Fire Strike Standard Physics
min: 3234     avg: 3787     median: 3787 (7%)     max: 4340 Points
min: 11041     avg: 11381     median: 11174 (20%)     max: 12592 Points
min: 6143     avg: 10428     median: 10617.5 (19%)     max: 10953 Points
3DMark - 3DMark Time Spy CPU
min: 4259     avg: 4439     median: 4447 (19%)     max: 4568 Points
min: 2863     avg: 3938     median: 3951 (17%)     max: 4383 Points
Geekbench 5.5 - Geekbench 5.1 - 5.4 64 Bit Single-Core
1004 Points (42%)
Geekbench 5.5 - Geekbench 5.1 - 5.4 64 Bit Multi-Core
3742 Points (7%)
Geekbench 5.0 - Geekbench 5.0 64 Bit Single-Core
1030 Points (4%)
Geekbench 5.0 - Geekbench 5.0 64 Bit Multi-Core
3924 Points (12%)
Geekbench 4.4 - Geekbench 4.1 - 4.4 64 Bit Single-Core
min: 4841     avg: 4897     median: 4896.5 (49%)     max: 4952 Points
min: 4415     avg: 4638     median: 4635 (46%)     max: 4808 Points
Geekbench 4.4 - Geekbench 4.1 - 4.4 64 Bit Multi-Core
min: 15838     avg: 16002     median: 16001.5 (18%)     max: 16165 Points
min: 13053     avg: 14679     median: 14783 (16%)     max: 15111 Points
Geekbench 4.0 - Geekbench 4.0 64 Bit Single-Core
min: 4867     avg: 4905     median: 4904.5 (67%)     max: 4942 Points
min: 4119     avg: 4477     median: 4452.5 (61%)     max: 4740 Points
Geekbench 4.0 - Geekbench 4.0 64 Bit Multi-Core
min: 15042     avg: 15309     median: 15308.5 (37%)     max: 15575 Points
min: 12384     avg: 13663     median: 14009.5 (34%)     max: 14596 Points
Geekbench 3 - Geekbench 3 32 Bit Multi-Core
min: 14323     avg: 15088     median: 14476 (26%)     max: 16465 Points
min: 13290     avg: 13780     median: 13936.5 (25%)     max: 14275 Points
Geekbench 3 - Geekbench 3 32 Bit Single-Core
min: 3718     avg: 4002     median: 3926 (77%)     max: 4361 Points
min: 3256     avg: 3641     median: 3675 (72%)     max: 3843 Points
Geekbench 3 - Geekbench 3 64 Bit Multi-Core
14990 Points (23%)
min: 13753     avg: 14103     median: 14102.5 (22%)     max: 14452 Points
Geekbench 3 - Geekbench 3 64 Bit Single-Core
3885 Points (58%)
min: 3532     avg: 3715     median: 3715 (56%)     max: 3898 Points
Geekbench 2 - 32 Bit - Geekbench Stream
7620 Points (61%)
Geekbench 2 - 32 Bit - Geekbench Memory
7210 Points (65%)
Geekbench 2 - 32 Bit - Geekbench Floating Point
12792 Points (25%)
Geekbench 2 - 32 Bit - Geekbench Integer
13091 Points (26%)
Geekbench 2 - 32 Bit - Geekbench Total Score
11263 Points (29%)
PassMark PerformanceTest 9 - PerformanceTest 9.0 CPU Mark
10003 Points (52%)
Mozilla Kraken 1.1 - Kraken 1.1 Total Score *
min: 901     avg: 2277     median: 984 (1%)     max: 7545 ms
min: 919     avg: 982     median: 965 (1%)     max: 1244 ms
Sunspider - Sunspider 1.0 Total Score *
123.5 ms (1%)
min: 68.3     avg: 138.2     median: 71.1 (1%)     max: 400.9 ms
min: 67.2     avg: 75.1     median: 72.4 (1%)     max: 108.5 ms
Octane V2 - Octane V2 Total Score
min: 35189     avg: 38766     median: 39000 (35%)     max: 40652 Points
min: 30332     avg: 38344     median: 38801 (35%)     max: 41638 Points
WebXPRT 3 - WebXPRT 3 Score
152 Points (32%)
Power Consumption - Prime95 Power Consumption - external Monitor *
min: 70     avg: 76.1     median: 72.5 (12%)     max: 94 Watt
Power Consumption - Cinebench R15 Multi Power Consumption - external Monitor *
min: 60     avg: 64.2     median: 63.5 (12%)     max: 70 Watt
Power Consumption - Cinebench R15 Multi Power Efficiency - external Monitor
min: 10.6     avg: 11.3     median: 11.3 (8%)     max: 11.9 Points per Watt

Average Benchmarks AMD FX-9830P → 100% n=21

Average Benchmarks Intel Core i7-7820HK → 179% n=21

Average Benchmarks Intel Core i7-7700HQ → 171% n=21

- Range of benchmark values for this graphics card
- Average benchmark values for this graphics card
* Smaller numbers mean a higher performance
1 This benchmark is not used for the average calculation

v1.26
log 02. 21:09:36

#0 checking url part for id 8165 +0s ... 0s

#1 checking url part for id 8415 +0s ... 0s

#2 checking url part for id 8400 +0s ... 0s

#3 not redirecting to Ajax server +0s ... 0s

#4 did not recreate cache, as it is less than 5 days old! Created at Wed, 01 May 2024 05:34:47 +0200 +0.001s ... 0.001s

#5 composed specs +0.053s ... 0.054s

#6 did output specs +0s ... 0.054s

#7 getting avg benchmarks for device 8165 +0.003s ... 0.057s

#8 got single benchmarks 8165 +0.01s ... 0.067s

#9 getting avg benchmarks for device 8415 +0.004s ... 0.071s

#10 got single benchmarks 8415 +0.071s ... 0.142s

#11 getting avg benchmarks for device 8400 +0.02s ... 0.162s

#12 got single benchmarks 8400 +0.501s ... 0.663s

#13 got avg benchmarks for devices +0s ... 0.663s

#14 No cached benchmark found, getting uncached values +0.126s ... 0.789s

#15 No cached benchmark found, getting uncached values +0.008s ... 0.797s

#16 No cached benchmark found, getting uncached values +0.165s ... 0.962s

#17 min, max, avg, median took s +0.277s ... 1.239s

#18 return log +0s ... 1.24s

Please share our article, every link counts!
> Expert Reviews and News on Laptops, Smartphones and Tech Innovations > Benchmarks / Tech > Processor Comparison - Head 2 Head
Redaktion, 2017-09- 8 (Update: 2023-07- 1)