

NVIDIA GeForce RTX 3070 vs NVIDIA GeForce RTX 3060 vs NVIDIA GeForce RTX 3080 12 GB
NVIDIA GeForce RTX 3070
► remove from comparison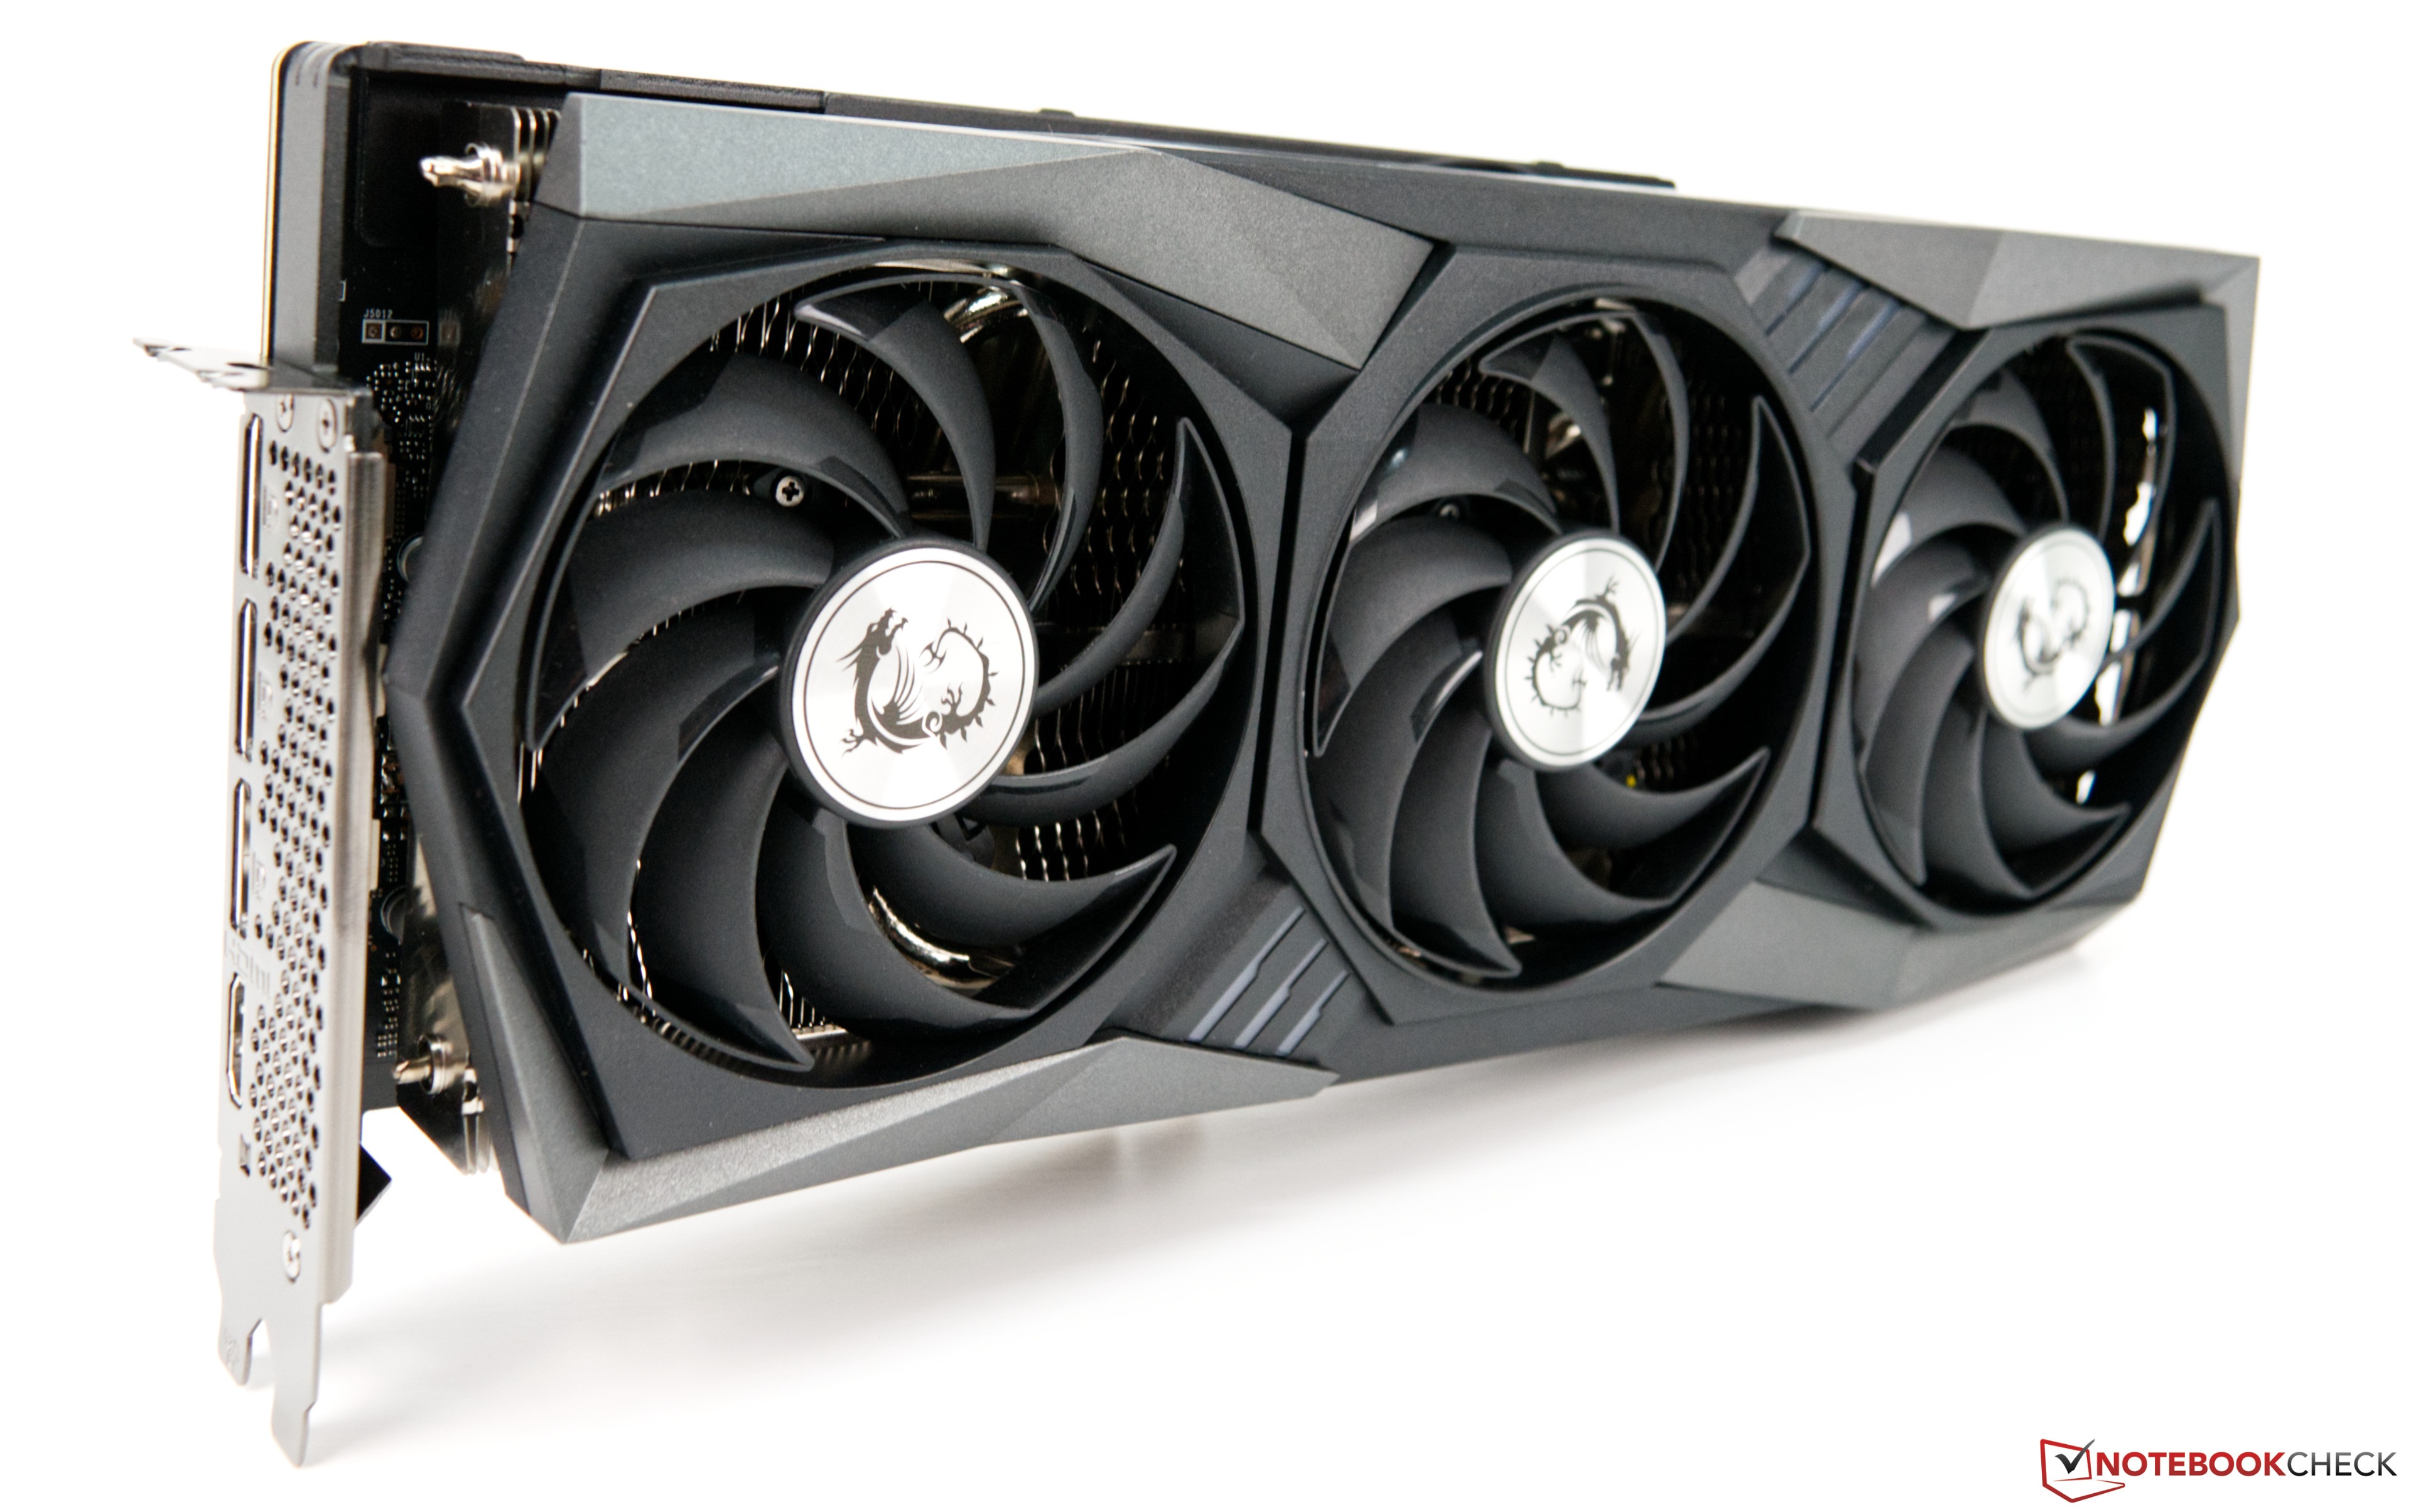
The Nvidia GeForce RTX 3070 is a fast desktop graphics card based on the Ampere architecture. It uses the big GA104 chip and offers 5,888 cores and 8 GB GDDR6 graphics memory.
The performance in games and 4k resolution is slightly below a RTX 2080 Ti but clearly faster then the old RTX 2080 Super. For most games, the performance is sufficient for 4k and maximum details. Enabling raytracing however (without DLSS) will lead to a significant lower performance (although the RTX performance was clearly improved compared to the RTX 2000 series).
The GA104 chip is produced in 8nm at Samsung and the power consumption of the RT 3070 is specified with 220 Watt (RTX 2070 Super - 215 Watt).
NVIDIA GeForce RTX 3060
► remove from comparison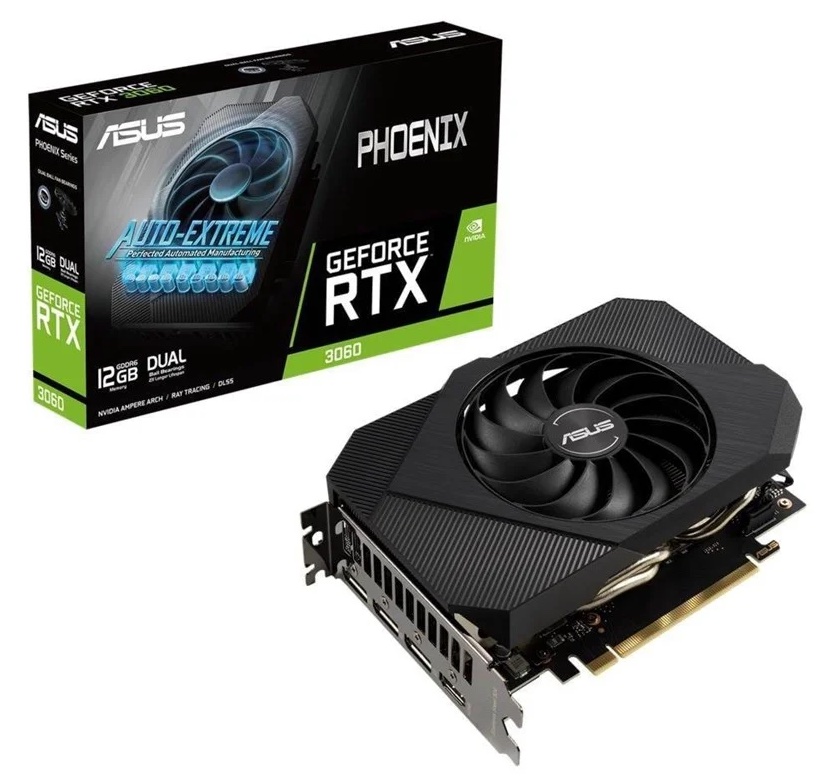
The Nvidia GeForce RTX 3060 is a fast desktop graphics card. It is based on the GA106 Ampere chip and offers 12 GB GDDR6 graphics memory with a 192 Bit memory bus. It offers 3,584 cores and supports PCIe 4.0.
The performance is similar to the older GeForce RTX 2070 and therefore best suited for 1080p gaming of modern and demanding games in high settings (in 2021).
The GA106 chip offers 3,840 FP32 ALUs of which half can also execute INT32 instructions (i.e. 1,920 INT32 ALUs). With Turing all shaders could still execute FP32 or INT32 instructions. The raytracing and tensor cores on the chip were also improved according to Nvidia. The Ampere chips also include an improved 5th generation video encoder (NVENC for H.264 and H.265) and a 7th generation decoder (for various formats now including AV1).
The GA106 chip is manufactured by Samsung in 8nm (8N), which is not quite able to keep up with the 7nm node at TSMC (e.g. used by AMD and also for the professional GA100 Ampere chip). The TDP of the RTX 3060 is specified at 170 Watt and therefore slightly higher than the previous RTX 2060 (160 Watt).
NVIDIA GeForce RTX 3080 12 GB
► remove from comparisonThe Nvidia GeForce RTX 3080 12GB is high-end desktop graphics card based on the Ampere generation. It uses the big GA102 chip and offers 8,704 shaders and 12 GB GDDR6X graphics memory. Compared to the older 10 GB model, the 12 GB model offers more bandwidth and therefore a higher TDP.
The gaming performance in 4k is clearly better than the old GeForce RTX 2080 Ti (approximately 15% faster). Therefore, even demanding games should run with maximum detail settings in 4k. Enabling raytracing will however reduce the framerate and therefore maximum details won't be playable.
The RTX3080 is produced in 8nm at Samsung and rated at 350 Watt.
| NVIDIA GeForce RTX 3070 | NVIDIA GeForce RTX 3060 | NVIDIA GeForce RTX 3080 12 GB | |||||||||||||||||||||||||||||||||||||||||||||||||||||||||||||||||||||||||||||||||||||||||||||||||||||||||||||||||||||||||||||||||||||||||||||||||||||||||||||||||||||||||||||||||||||||||||||||||||||||
| GeForce RTX 3000 Series |
|
|
| ||||||||||||||||||||||||||||||||||||||||||||||||||||||||||||||||||||||||||||||||||||||||||||||||||||||||||||||||||||||||||||||||||||||||||||||||||||||||||||||||||||||||||||||||||||||||||||||||||||||
| Codename | Ampere GA104 | Ampere GA106 | Ampere GA102 | ||||||||||||||||||||||||||||||||||||||||||||||||||||||||||||||||||||||||||||||||||||||||||||||||||||||||||||||||||||||||||||||||||||||||||||||||||||||||||||||||||||||||||||||||||||||||||||||||||||||
| Architecture | Ampere | Ampere | Ampere | ||||||||||||||||||||||||||||||||||||||||||||||||||||||||||||||||||||||||||||||||||||||||||||||||||||||||||||||||||||||||||||||||||||||||||||||||||||||||||||||||||||||||||||||||||||||||||||||||||||||
| Pipelines | 5888 - unified | 3584 - unified | 8960 / Pixel- / Vertexshader | ||||||||||||||||||||||||||||||||||||||||||||||||||||||||||||||||||||||||||||||||||||||||||||||||||||||||||||||||||||||||||||||||||||||||||||||||||||||||||||||||||||||||||||||||||||||||||||||||||||||
| Core Speed | 1500 - 1725 (Boost) MHz | 1320 - 1777 (Boost) MHz | 1260 - 1710 (Boost) MHz | ||||||||||||||||||||||||||||||||||||||||||||||||||||||||||||||||||||||||||||||||||||||||||||||||||||||||||||||||||||||||||||||||||||||||||||||||||||||||||||||||||||||||||||||||||||||||||||||||||||||
| Memory Speed | 14000 MHz | 15000 effective = 1875 MHz | 19000 effective = 1188 MHz | ||||||||||||||||||||||||||||||||||||||||||||||||||||||||||||||||||||||||||||||||||||||||||||||||||||||||||||||||||||||||||||||||||||||||||||||||||||||||||||||||||||||||||||||||||||||||||||||||||||||
| Memory Bus Width | 256 Bit | 192 Bit | 384 Bit | ||||||||||||||||||||||||||||||||||||||||||||||||||||||||||||||||||||||||||||||||||||||||||||||||||||||||||||||||||||||||||||||||||||||||||||||||||||||||||||||||||||||||||||||||||||||||||||||||||||||
| Memory Type | GDDR6 | GDDR6 | GDDR6X | ||||||||||||||||||||||||||||||||||||||||||||||||||||||||||||||||||||||||||||||||||||||||||||||||||||||||||||||||||||||||||||||||||||||||||||||||||||||||||||||||||||||||||||||||||||||||||||||||||||||
| Max. Amount of Memory | 8 GB | 12 GB | 12 GB | ||||||||||||||||||||||||||||||||||||||||||||||||||||||||||||||||||||||||||||||||||||||||||||||||||||||||||||||||||||||||||||||||||||||||||||||||||||||||||||||||||||||||||||||||||||||||||||||||||||||
| Shared Memory | no | no | no | ||||||||||||||||||||||||||||||||||||||||||||||||||||||||||||||||||||||||||||||||||||||||||||||||||||||||||||||||||||||||||||||||||||||||||||||||||||||||||||||||||||||||||||||||||||||||||||||||||||||
| API | DirectX 12_2, Shader 6.7, OpenGL 4.6 | DirectX 12_2, Shader 6.6, OpenGL 4.6 | DirectX 12_2, Shader 6.7, OpenGL 4.6, OpenCL 3.0, Vulkan 1.3 | ||||||||||||||||||||||||||||||||||||||||||||||||||||||||||||||||||||||||||||||||||||||||||||||||||||||||||||||||||||||||||||||||||||||||||||||||||||||||||||||||||||||||||||||||||||||||||||||||||||||
| Power Consumption | 220 Watt | 170 Watt | 350 Watt | ||||||||||||||||||||||||||||||||||||||||||||||||||||||||||||||||||||||||||||||||||||||||||||||||||||||||||||||||||||||||||||||||||||||||||||||||||||||||||||||||||||||||||||||||||||||||||||||||||||||
| Transistors | 17.4 Billion | 12 Billion | 28.3 Billion | ||||||||||||||||||||||||||||||||||||||||||||||||||||||||||||||||||||||||||||||||||||||||||||||||||||||||||||||||||||||||||||||||||||||||||||||||||||||||||||||||||||||||||||||||||||||||||||||||||||||
| technology | 8 nm | 8 nm | 8 nm | ||||||||||||||||||||||||||||||||||||||||||||||||||||||||||||||||||||||||||||||||||||||||||||||||||||||||||||||||||||||||||||||||||||||||||||||||||||||||||||||||||||||||||||||||||||||||||||||||||||||
| Date of Announcement | 16.09.2020 | 12.01.2021 | 11.01.2022 | ||||||||||||||||||||||||||||||||||||||||||||||||||||||||||||||||||||||||||||||||||||||||||||||||||||||||||||||||||||||||||||||||||||||||||||||||||||||||||||||||||||||||||||||||||||||||||||||||||||||
| TMUs | 112 | 280 | |||||||||||||||||||||||||||||||||||||||||||||||||||||||||||||||||||||||||||||||||||||||||||||||||||||||||||||||||||||||||||||||||||||||||||||||||||||||||||||||||||||||||||||||||||||||||||||||||||||||
| ROPs | 48 | 96 | |||||||||||||||||||||||||||||||||||||||||||||||||||||||||||||||||||||||||||||||||||||||||||||||||||||||||||||||||||||||||||||||||||||||||||||||||||||||||||||||||||||||||||||||||||||||||||||||||||||||
| Raytracing Cores | 28 | 70 | |||||||||||||||||||||||||||||||||||||||||||||||||||||||||||||||||||||||||||||||||||||||||||||||||||||||||||||||||||||||||||||||||||||||||||||||||||||||||||||||||||||||||||||||||||||||||||||||||||||||
| Tensor / AI Cores | 112 | 280 | |||||||||||||||||||||||||||||||||||||||||||||||||||||||||||||||||||||||||||||||||||||||||||||||||||||||||||||||||||||||||||||||||||||||||||||||||||||||||||||||||||||||||||||||||||||||||||||||||||||||
| Memory Bandwidth | 360 GB/s | 912.4 GB/s | |||||||||||||||||||||||||||||||||||||||||||||||||||||||||||||||||||||||||||||||||||||||||||||||||||||||||||||||||||||||||||||||||||||||||||||||||||||||||||||||||||||||||||||||||||||||||||||||||||||||
| Die Size | 13250 mm² | 628 mm² | |||||||||||||||||||||||||||||||||||||||||||||||||||||||||||||||||||||||||||||||||||||||||||||||||||||||||||||||||||||||||||||||||||||||||||||||||||||||||||||||||||||||||||||||||||||||||||||||||||||||
| PCIe | 4.0 | 4.0 | |||||||||||||||||||||||||||||||||||||||||||||||||||||||||||||||||||||||||||||||||||||||||||||||||||||||||||||||||||||||||||||||||||||||||||||||||||||||||||||||||||||||||||||||||||||||||||||||||||||||
| Displays | HDMI 2.1, DisplayPort 1.4a | HDMI 2.1, DisplayPort 1.4a | |||||||||||||||||||||||||||||||||||||||||||||||||||||||||||||||||||||||||||||||||||||||||||||||||||||||||||||||||||||||||||||||||||||||||||||||||||||||||||||||||||||||||||||||||||||||||||||||||||||||
| Features | NVIDIA DLSS, NVIDIA Reflex, Resizable BAR, NVIDIA Broadcast, NVIDIA Ansel, NVIDIA ShadowPlay®, NVIDIA G-SYNC®, VR-ready, Nvidia Omniverse | ||||||||||||||||||||||||||||||||||||||||||||||||||||||||||||||||||||||||||||||||||||||||||||||||||||||||||||||||||||||||||||||||||||||||||||||||||||||||||||||||||||||||||||||||||||||||||||||||||||||||
| Link to Manufacturer Page | www.nvidia.com | ||||||||||||||||||||||||||||||||||||||||||||||||||||||||||||||||||||||||||||||||||||||||||||||||||||||||||||||||||||||||||||||||||||||||||||||||||||||||||||||||||||||||||||||||||||||||||||||||||||||||
| Cache | L1: 128 KB, L2: 5 KB |
Benchmarks

3DM Vant. Perf. total + NVIDIA GeForce RTX 3070
specvp12 sw-03 + NVIDIA GeForce RTX 3070
Cinebench R15 OpenGL 64 Bit + NVIDIA GeForce RTX 3070
Average Benchmarks NVIDIA GeForce RTX 3070 → 100% n=45
Average Benchmarks NVIDIA GeForce RTX 3060 → 79% n=45
Average Benchmarks NVIDIA GeForce RTX 3080 12 GB → 123% n=45
* Smaller numbers mean a higher performance
1 This benchmark is not used for the average calculation
Game Benchmarks
The following benchmarks stem from our benchmarks of review laptops. The performance depends on the used graphics memory, clock rate, processor, system settings, drivers, and operating systems. So the results don't have to be representative for all laptops with this GPU. For detailed information on the benchmark results, click on the fps number.

Borderlands 4
2025
F1 25
2025
Doom: The Dark Ages
2025


Civilization 7
2025Monster Hunter Wilds
2025


Stalker 2
2024

Until Dawn
2024
God of War Ragnarök
2024
Final Fantasy XVI
2024
Space Marine 2
2024
Star Wars Outlaws
2024
Black Myth: Wukong
2024
Once Human
2024
The First Descendant
2024
F1 24
2024
Enshrouded
2024
Palworld
2024

Ready or Not
2023
The Finals
2023

EA Sports WRC
2023
Alan Wake 2
2023
Lords of the Fallen
2023
Total War Pharaoh
2023

Counter-Strike 2
2023

Baldur's Gate 3
2023
Lies of P
2023
The Crew Motorfest
2023
Starfield
2023
Armored Core 6
2023
Atlas Fallen
2023

F1 23
2023
The Last of Us
2023

Company of Heroes 3
2023
Sons of the Forest
2023
Atomic Heart
2023
Returnal
2023
Hogwarts Legacy
2023
Dead Space Remake
2023
The Witcher 3 v4
2023
High On Life
2023


FIFA 23
2022
F1 22
2022
Vampire Bloodhunt
2022
Ghostwire Tokyo
2022

Cyberpunk 2077 1.6
2022
Elex 2
2022
GRID Legends
2022
Elden Ring
2022
Dying Light 2
2022

God of War
2022
Halo Infinite
2021
Farming Simulator 22
2021
Battlefield 2042
2021
Forza Horizon 5
2021

Riders Republic
2021

Back 4 Blood
2021
Far Cry 6
2021
Alan Wake Remastered
2021
FIFA 22
2021
New World
2021
Deathloop
2021
F1 2021
2021

Days Gone
2021


Outriders
2021
Hitman 3
2021
Cyberpunk 2077 1.0
2020

Yakuza Like a Dragon
2020


Dirt 5
2020
Watch Dogs Legion
2020
FIFA 21
2020
Star Wars Squadrons
2020

Serious Sam 4
2020
Crysis Remastered
2020

Horizon Zero Dawn
2020
Death Stranding
2020
F1 2020
2020
Gears Tactics
2020
Doom Eternal
2020
Hunt Showdown
2020


Borderlands 3
2019
Control
2019

Rage 2
2019
Anno 1800
2019
The Division 2
2019
Far Cry New Dawn
2019
Metro Exodus
2019
Apex Legends
2019
Battlefield V
2018


Strange Brigade
2018
Far Cry 5
2018
X-Plane 11.11
2018

Doom
2016
Dota 2 Reborn
2015
The Witcher 3
2015
GTA V
2015Average Gaming NVIDIA GeForce RTX 3070 → 100%
Average Gaming 30-70 fps → 100%
Average Gaming NVIDIA GeForce RTX 3060 → 81%
Average Gaming 30-70 fps → 71%
Average Gaming NVIDIA GeForce RTX 3080 12 GB → 127%
Average Gaming 30-70 fps → 126%
| NVIDIA GeForce RTX 3070 | NVIDIA GeForce RTX 3060 | NVIDIA GeForce RTX 3080 12 GB | |||||||||||||||||||
|---|---|---|---|---|---|---|---|---|---|---|---|---|---|---|---|---|---|---|---|---|---|
| low | med. | high | ultra | QHD | 4K | low | med. | high | ultra | QHD | 4K | low | med. | high | ultra | QHD | 4K | ||||
| Borderlands 4 | 42.5 | 34.6 | 26.8 | 19.6 | |||||||||||||||||
| F1 25 | 228 | 183 | 138 | 12 | 7 | 3 | |||||||||||||||
| Doom: The Dark Ages | 61.7 | 54.1 | 49.8 | 47.9 | 32 | ||||||||||||||||
| The Elder Scrolls IV Oblivion Remastered | 107.8 | 70.1 | 47 | 26.6 | 18 | ||||||||||||||||
| Assassin's Creed Shadows | 47 | 40 | 32 | 23 | 19 | ||||||||||||||||
| Civilization 7 | 274 | 192.8 | 116.6 | 69.8 | 32.9 | ||||||||||||||||
| Monster Hunter Wilds | 61.7 | 50.5 | 38.4 | 29.3 | 17.3 | ||||||||||||||||
| Kingdom Come Deliverance 2 | 111.2 | 82 | 67 | 48 | 34.4 | 19.5 | |||||||||||||||
| Indiana Jones and the Great Circle | 97 | 67 | 60 | 46 | 27 | ||||||||||||||||
| Stalker 2 | 64 | 56 | 47 | 39 | 28 | 16 | |||||||||||||||
| Call of Duty Black Ops 6 | 114 | 104 | 69 | 65 | 48 | 30 | |||||||||||||||
| Until Dawn | 119 | 78 | 52 | 37 | 26 | 15 | |||||||||||||||
| God of War Ragnarök | 127 | 102 | 88 | 82 | 61 | 34 | |||||||||||||||
| Final Fantasy XVI | 65 | 64 | 54 | 49 | 33 | 18 | |||||||||||||||
| Space Marine 2 | 96 | 78 | 75 | 67 | 46 | 24 | |||||||||||||||
| Star Wars Outlaws | 49 | 45 | 39 | 32 | 22 | 13 | |||||||||||||||
| Black Myth: Wukong | 75 | 56 | 42 | 22 | 17 | 9 | |||||||||||||||
| Once Human | 202 | 122 | 105.1 | 88 | 56 | 28 | |||||||||||||||
| The First Descendant | 153 | 99 | 81 | 68 | 43 | 23 | |||||||||||||||
| F1 24 | 283 | 248 | 179 | 57 | 37 | 18 | |||||||||||||||
| Alan Wake 2 | 54.1 | 36.2 | 18 | ||||||||||||||||||
| Cyberpunk 2077 2.2 Phantom Liberty | 148.5 | 135 | 117 | 105 | 68 | 32 | 128 | 98 | 83 | 72 | 42 | 18 | 179 | 154 | 140 | 93 | 46.7 | ||||
| Baldur's Gate 3 | 174.5 | 149 | 129 | 127 | 88 | 47 | 131 | 100 | 86.7 | 85 | 59 | 31 | 191.3 | 158.4 | 156.1 | 110 | 60.2 | ||||
| Hogwarts Legacy | 125.2 | 104.6 | 80.9 | 63.3 | 35 | 56.4 | 39.7 | 22 | 178 | 141.3 | 115.2 | 87.5 | 51.1 | ||||||||
| The Witcher 3 v4 | 226 | 188.2 | 151.5 | 109.9 | 61.9 | 211 | 168.8 | 136.4 | 107.5 | 78.1 | 44.8 | ||||||||||
| Vampire Bloodhunt | 299 | 279 | 266 | 181.3 | 95.9 | 341 | 185 | 175.9 | 170.7 | 110.8 | 56.4 | 408 | 300 | 294 | 277 | 214 | 115.8 | ||||
| Ghostwire Tokyo | 200 | 198 | 195.1 | 130.4 | 63.9 | 139.4 | 127.3 | 129.3 | 127.6 | 80.6 | 39 | 206 | 196.3 | 195.4 | 192.5 | 165.8 | 86.7 | ||||
| Tiny Tina's Wonderlands | 258 | 214 | 152 | 119 | 84 | 47 | 165.7 | 134.5 | 92.8 | 72.4 | 52.9 | 28.4 | 276 | 237 | 183.7 | 152.7 | 112.6 | 63.9 | |||
| Cyberpunk 2077 1.6 | 146.7 | 139 | 126 | 102 | 62 | 30 | 79.1 | 78.1 | 74.8 | 64.2 | 39.1 | 17.7 | |||||||||
| Elex 2 | 97 | 87.2 | 82.8 | 74.9 | 44.9 | 95.6 | 89.7 | 79.9 | 72.8 | 53.4 | 30.5 | ||||||||||
| GRID Legends | 249 | 189 | 166 | 137 | 124 | 82 | 198.9 | 160.2 | 134.2 | 97.9 | 79.1 | 51.2 | |||||||||
| Elden Ring | 59.3 | 58.8 | 58.6 | 58.5 | 57.1 | 60 | 60 | 60 | 59.9 | 56.8 | 35.2 | 60 | 60 | 60 | 60 | 60 | 60 | ||||
| Dying Light 2 | 108 | 97.8 | 70.1 | 38.2 | 86 | 68.9 | 59.8 | 42.3 | 22.5 | 157.8 | 132.9 | 116 | 86.5 | 50 | |||||||
| Rainbow Six Extraction | 266 | 259 | 199 | 132 | 68 | 195 | 162 | 157 | 129 | 85 | 44 | 379 | 275 | 273 | 239 | 168 | 96 | ||||
| God of War | 142 | 138 | 117 | 84 | 69 | 49 | 142 | 116 | 93 | 63 | 54 | 39 | 182.7 | 163 | 138.8 | 100.8 | 85.5 | 60.1 | |||
| Halo Infinite | 149 | 129 | 121 | 92.3 | 52.9 | 104 | 87.7 | 82.5 | 69.7 | 67.2 | |||||||||||
| Farming Simulator 22 | 178 | 153 | 137 | 135 | 106 | 269 | 199 | 151 | 125 | 97.7 | 61.5 | 277 | 230 | 197 | 181.5 | 179.4 | 133.4 | ||||
| Battlefield 2042 | 132 | 126 | 116 | 96.8 | 60.2 | 144 | 116 | 96.5 | 84.5 | 64.3 | 38.7 | ||||||||||
| Forza Horizon 5 | 247 | 159 | 148 | 106 | 93 | 68 | 192 | 124 | 110 | 66 | 57 | 41 | 257 | 171 | 159 | 106 | 94 | 71 | |||
| Call of Duty Vanguard | 157 | 144 | 131 | 98.1 | 56.8 | 102 | 113 | 96.3 | 86.8 | 62.2 | 35.6 | ||||||||||
| Riders Republic | 139 | 124 | 118 | 92 | 54 | 198 | 124 | 102 | 79 | 64 | 36 | 236 | 208 | 173 | 162 | 124 | 73 | ||||
| Guardians of the Galaxy | 111 | 100 | 109 | 107 | 69 | 140 | 132 | 131 | 127 | 87 | 47 | 139 | 148 | 147 | 143 | 141 | 100 | ||||
| Back 4 Blood | 295 | 260 | 248 | 179 | 96.4 | 214 | 191 | 178 | 115 | 57.4 | |||||||||||
| Far Cry 6 | 154.9 | 120 | 109 | 103 | 91 | 42 | 156 | 120 | 105 | 93 | 70 | 39 | 150.4 | 113.4 | 104.7 | 100.2 | 92.2 | 57.2 | |||
| Alan Wake Remastered | 104 | 101 | 98.1 | 84.3 | 96.1 | 91.6 | 91.4 | 87 | |||||||||||||
| FIFA 22 | 265 | 264 | 264 | 261 | 259 | 282 | 311 | 306 | 299 | 282 | 201 | ||||||||||
| New World | 166.9 | 109 | 101 | 93 | 81 | 51 | 161 | 112 | 105 | 95.9 | 65.3 | 33.7 | 173.1 | 129.2 | 116.1 | 113.5 | 103.9 | 67.6 | |||
| Deathloop | 119 | 119 | 109 | 82.9 | 49.7 | 120 | 102 | 87.3 | 72 | 51.9 | 28 | ||||||||||
| F1 2021 | 407 | 310 | 277 | 153 | 116 | 66 | 356 | 239 | 192 | 96 | 75 | 43 | 509 | 463 | 379 | 201 | 157.3 | 93.5 | |||
| Monster Hunter Stories 2 | 144 | 144 | 144 | 144 | 144 | 144 | 144 | 144 | 125 | ||||||||||||
| Days Gone | 165 | 158 | 131 | 99.3 | 57.8 | 203 | 137 | 122 | 89.8 | 64.8 | 36.5 | ||||||||||
| Mass Effect Legendary Edition | 129 | 123 | 123 | 105 | 117 | 112 | 114 | 78.8 | |||||||||||||
| Resident Evil Village | 185 | 183 | 183 | 142 | 70.8 | 341 | 176 | 164 | 138 | 91.1 | 47.6 | ||||||||||
| Outriders | 122 | 146 | 125 | 104 | 70.2 | 36.9 | |||||||||||||||
| Cyberpunk 2077 1.0 | 129 | 108 | 93 | 81 | 54 | 27 | 75.7 | 74.9 | 69.5 | 56.3 | 35.5 | 16.4 | |||||||||
| Immortals Fenyx Rising | 132 | 101 | 90 | 85 | 72 | 52 | 142 | 100 | 99 | 91 | 71 | 45 | 142 | 140 | 136 | 129 | 112 | 78 | |||
| Yakuza Like a Dragon | 109 | 109 | 116 | 111 | 96 | 51.7 | 134 | 120 | 116 | 101 | 67.6 | 34.4 | |||||||||
| Call of Duty Black Ops Cold War | 195 | 155 | 124 | 113 | 93 | 56 | 229 | 119 | 106 | 95.2 | 66.5 | 36.6 | |||||||||
| Assassin´s Creed Valhalla | 129 | 101 | 86 | 78 | 66 | 44 | 118 | 102 | 85 | 75 | 60 | 38 | |||||||||
| Dirt 5 | 199 | 144 | 122 | 99 | 83 | 58 | 270 | 136 | 105 | 81 | 65 | 43 | 303 | 227 | 194 | 154 | 125 | 83 | |||
| Watch Dogs Legion | 119 | 117 | 106 | 85 | 66 | 38 | 123 | 108 | 94.7 | 59.1 | 45.1 | 26.8 | 123 | 118.1 | 107.8 | 95.2 | 83.5 | 55.2 | |||
| Star Wars Squadrons | 410 | 330 | 313 | 290 | 218 | 132 | 473 | 274 | 243 | 230 | 160 | 90.2 | |||||||||
| Mafia Definitive Edition | 168 | 134 | 128 | 98 | 56 | 199 | 113 | 103 | 70.3 | 37 | 196.6 | 179.1 | 162.7 | 136 | 79.2 | ||||||
| Crysis Remastered | 221 | 182 | 97.7 | 75.8 | 64.3 | 38.9 | 281 | 123 | 77.9 | 57.5 | 37.4 | 22.7 | 320 | 346 | 176.6 | 162.3 | 123.5 | 72.7 | |||
| Horizon Zero Dawn | 181 | 153 | 135 | 125 | 107 | 69 | 198 | 142 | 118 | 100 | 77 | 42 | 216 | 200 | 175 | 155 | 132 | 80 | |||
| Death Stranding | 224 | 190 | 173 | 170 | 126 | 74.1 | 213 | 144 | 134 | 130 | 92.9 | 51.3 | |||||||||
| F1 2020 | 333 | 286 | 263 | 192 | 150 | 90 | 315 | 223 | 187 | 130 | 106 | 60 | 412 | 351 | 339 | 263 | 206 | 124.6 | |||
| Borderlands 3 | 153 | 136 | 115 | 101 | 78 | 44 | 150 | 131 | 101 | 79 | 60 | 32 | 166.2 | 150 | 139.2 | 128.5 | 104 | 59.9 | |||
| Control | 239 | 155 | 121 | 81 | 41 | 240 | 115 | 84.1 | 54.2 | 26.3 | 240 | 220 | 166.8 | 112.1 | 57.9 | ||||||
| Anno 1800 | 151 | 141 | 105 | 58 | 55 | 37 | 151 | 149 | 105 | 50.7 | 41.5 | 22.8 | 126.6 | 123.7 | 94 | 51.6 | 49.7 | 47.8 | |||
| The Division 2 | 220 | 173 | 142 | 112 | 82 | 49 | 264 | 160 | 125 | 92 | 63 | 34 | |||||||||
| Far Cry New Dawn | 143 | 124 | 121 | 107 | 102 | 72 | 136 | 114 | 109 | 97 | 87 | 50 | 154 | 136 | 131 | 118 | 116 | 98 | |||
| Metro Exodus | 187 | 146 | 117 | 94 | 76 | 49 | 177 | 99 | 74 | 56 | 50 | 32 | 210 | 178 | 145 | 117.7 | 97.9 | 65.2 | |||
| Shadow of the Tomb Raider | 179 | 163 | 159 | 151 | 113 | 62 | 175 | 133 | 125 | 116 | 80 | 43 | 236 | 209 | 207 | 196.1 | 146.7 | 82.7 | |||
| Strange Brigade | 441 | 318 | 262 | 229 | 170 | 99 | 432 | 214 | 171 | 149 | 115 | 67 | 545 | 422 | 356 | 314 | 236 | 141.5 | |||
| Far Cry 5 | 168 | 149 | 142 | 134 | 121 | 71 | 174 | 137 | 128 | 120 | 93 | 48 | 194 | 171 | 162 | 151 | 147 | 102 | |||
| X-Plane 11.11 | 123 | 108 | 89 | 84 | 157 | 141 | 114 | 97 | 159.4 | 143.2 | 114.7 | 98.7 | |||||||||
| Final Fantasy XV Benchmark | 194 | 162 | 123 | 96 | 58 | 194 | 121 | 88 | 66 | 39 | 223 | 196.5 | 156.2 | 125.5 | 76.7 | ||||||
| Rise of the Tomb Raider | 313 | 226 | 179 | 158 | 80 | 435 | 267 | 150 | 128 | 56.8 | 441 | 286 | 232 | 197.4 | 102.2 | ||||||
| Dota 2 Reborn | 154 | 137 | 133 | 124 | 129 | 212 | 191 | 181 | 168 | 118 | 211.4 | 186.6 | 175.8 | 160.95 | 156.4 | ||||||
| The Witcher 3 | 376 | 308 | 201 | 106 | 89 | 405 | 274 | 163 | 80 | 72 | 69 | 425 | 407 | 321 | 165.1 | 131.8 | |||||
| GTA V | 183 | 176 | 168 | 106 | 100 | 119 | 180 | 176 | 165 | 97 | 81 | 82 | 186.9 | 186.1 | 182 | 128.2 | 129.5 | 169.6 | |||
| NVIDIA GeForce RTX 3070 | NVIDIA GeForce RTX 3060 | NVIDIA GeForce RTX 3080 12 GB | |||||||||||||||||||
| low | med. | high | ultra | QHD | 4K | low | med. | high | ultra | QHD | 4K | low | med. | high | ultra | QHD | 4K | < 30 fps < 60 fps < 120 fps ≥ 120 fps | 2 37 | 1 12 46 | 1 20 38 | 2 27 24 | 3 38 15 | 1 30 25 4 | < 30 fps < 60 fps < 120 fps ≥ 120 fps | 3 19 55 | 7 30 41 | 1 10 41 27 | 4 15 38 15 | 9 27 40 3 | 25 40 11 2 | < 30 fps < 60 fps < 120 fps ≥ 120 fps | 1 34 | 3 35 | 7 31 | 1 9 23 | 1 16 17 | 8 24 6 |
For more games that might be playable and a list of all games and graphics cards visit our Gaming List