

Intel Core i7-10510U vs Intel Core i7-8650U vs Intel Core i7-8550U
Intel Core i7-10510U
► remove from comparisonThe Intel Core i7-10510U is a power efficient quad-core SoC for notebooks based on the Comet Lake (CML-U) generation and was announced in August 2019. Compared to the similar Whiskey Lake processors (e.g.& Core i7-8665U), the only difference is support for higher memory speeds (DDR4-2666, LPDDR4-2933) and two additional cores in the top model (not in this i7-10510U). The processor cores are clocked between 1.8 and 4.9 GHz (all 4 cores 4.3 GHz max). Thanks to HyperThreading 8 threads can be used. More information on Comet Lake and all the models and articles on it can be found here.
The integrated graphics adapter however is still the same as in the previous generations. It should be still called Intel HD Graphics 620 and clock from 300 - 1150 MHz in the i7. Furthermore, the SoC integrates a VP9 and H.265 de- and encoder and an integrated dual channel DDR4-2666 / LPDDR4-2933 memory controller.
Performance
The average 10510U in our database proves to be an OK mid-range option, its multi-thread benchmark scores hovering near those of the Ryzen 7 2700U and the Core i5-8259U. While not as impressive as the hexa-core Core i7-10710U, the 10510U will make most customers happy, making for short load times and generally pain-free experience.
Thanks to its decent cooling solution and a long-term CPU power limit of 45 W, the Modern 15 A10RB is among the fastest laptops powered by the 10510U that we know of. It can be more than twice as fast in CPU-bound workloads as the slowest system featuring the same chip in our database, as of August 2023.
Power consumption
This Core i7 series chip has a default TDP (also known as the long-term power limit) of 15 W, a value that laptop makers are free to change to anything between 10 W and 25 W resulting in corresponding performance and clock speed changes. By going for the lowest value, it is possible to build passively cooled tablets, laptops, mini-PCs around the i7. Please note that Comet Lake-U chips can briefly consume up to 90 W when under extreme loads.
Last but not the least, the i7-10510U is built with one of the old 14 nm Intel processes for lower-than-average, as of late 2022, energy efficiency.
Intel Core i7-8650U
► remove from comparisonThe Intel Core i7-8650U is a power efficient quad-core SoC for notebooks and Ultrabooks based on the Kaby Lake Refresh generation and was announced in August 2017. Contrary to its direct predecessor the Core i7-7600U, which were still dual-cores, the i7-8650U is equipped with four cores but at a lower base frequency of 1.9 GHz. The Turbo Boost can go up to 4,2 GHz and therefore also offer good short term single core speeds. The GPU is now named Intel UHD Graphics 620 but otherwise identical to the Intel HD Graphics 620. The integrated memory controller supports DDR4-2400 / LPDDR3-2133 and dual channel memory.
Architecture
Intel basically uses the same micro architecture compared to Skylake, so the per-MHz performance does not differ. The manufacturer only reworked the Speed Shift technology for faster dynamic adjustments of voltages and clocks, and the improved 14nm process allows much higher frequencies combined with better efficiency than before.
Performance
According to Intel, the new quad core models are up to 40% faster than their dual core predecessors. Due to the reduced TDP and the same 14nm+ process, the long term performance and throttling behaviour will be interesting and depending on the laptop design. Therefore, the older 35 Watt quad-core models should be faster in applications that demand longer CPU loads. The performance however is highly depending on the TDP settings and cooling solution of the laptop. Especially, longer loads will show varying results in different laptops.
Graphics
The integrated Intel UHD Graphics 620 (Intel Gen 9.5) is untouched from the 8th Gen Kaby Lake chips. With fast dual-channel memory it can reach the performance of a dedicated GeForce 920M.
Contrary to Skylake, Kaby lake now also supports H.265/HEVC Main 10 with a 10-bit color depth as well as Google's VP9 codec. The dual-core Kaby Lake processors announced in January should also support HDCP 2.2.
Power Consumption
The chip is manufactured in an improved 14nm process with FinFET transistors (14nm+), the same as the 7th Gen Kaby Lake processors. Intel still specifies the TDP with 15 Watts, which is typical for ULV chips. Depending on the usage scenario, the TDP can vary between 7.5 (cTDP Down) and 25 Watts.
Intel Core i7-8550U
► remove from comparison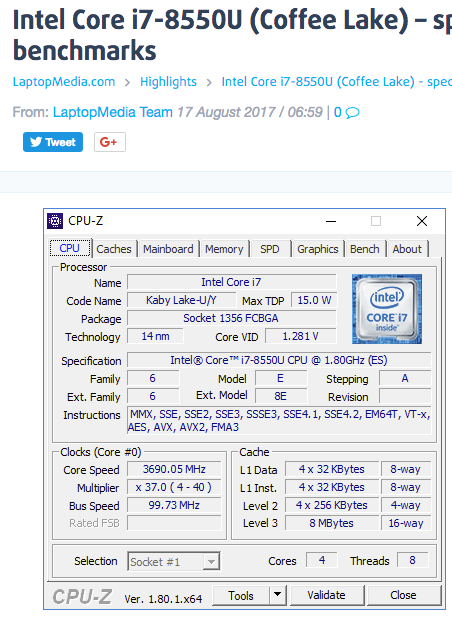
The Intel Core i7-8550U is a power efficient quad-core SoC for notebooks and Ultrabooks based on the Kaby Lake Refresh generation and was announced in August 2017. Contrary to its direct predecessors Core i7-7500U and i5-7260U, respectively, which were still dual-cores, the i7-8550U is equipped with four cores but at a lower base frequency of 1.8 GHz. The Turbo Boost is not specified yet, but should be at least 3.7 - 4 GHz and therefore also offer good short term single core speeds. The GPU is now named Intel UHD Graphics 620 but otherwise identical to the Intel HD Graphics 620. The integrated memory controller supports DDR4-2400 / LPDDR3-2133 and dual channel memory.
Architecture
Intel basically uses the same micro architecture compared to Skylake, so the per-MHz performance does not differ. The manufacturer only reworked the Speed Shift technology for faster dynamic adjustments of voltages and clocks, and the improved 14nm process allows much higher frequencies combined with better efficiency than before.
Performance
The performance of the i7-8550U depends on the cooling solution of the laptop and the defined TDP limits for short and long term performance. This leads to big differences in our benchmark scores ranging from the 15 Watt reference by Intel up to the 23% higher score of the Inspiron 17-7773 in the Cinebench R15 Multi benchmark. Especially when taxing the CPU for longer periods, these differences can be even higher.
In our usual benchmarks, the average i7-8550U is as fast as the 35 Watt rated Core i5-7440HQ. For single thread performance, the high Turbo Boost frequency helps achieving one of the highest scores for mobile CPUs.
Graphics
The integrated Intel UHD Graphics 620 (Intel Gen 9.5) is untouched from the 8th Gen Kaby Lake chips. With fast dual-channel memory it can reach the performance of a dedicated GeForce 920M.
Contrary to Skylake, Kaby lake now also supports H.265/HEVC Main 10 with a 10-bit color depth as well as Google's VP9 codec. The dual-core Kaby Lake processors announced in January should also support HDCP 2.2.
Power Consumption
The chip is manufactured in an improved 14nm process with FinFET transistors (14nm+), the same as the 7th Gen Kaby Lake processors. Intel still specifies the TDP with 15 Watts, which is typical for ULV chips. Depending on the usage scenario, the TDP can vary between 7.5 (cTDP Down) and 25 Watts.
| Model | Intel Core i7-10510U | Intel Core i7-8650U | Intel Core i7-8550U | ||||||||||||||||||||||||||||||||||||||||||||||||||||||||||||||||||||||||||||||||||||||||
| Codename | Comet Lake-U | Kaby Lake Refresh | Kaby Lake Refresh | ||||||||||||||||||||||||||||||||||||||||||||||||||||||||||||||||||||||||||||||||||||||||
| Series | Intel Comet Lake | Intel Kaby Lake Refresh | Intel Kaby Lake Refresh | ||||||||||||||||||||||||||||||||||||||||||||||||||||||||||||||||||||||||||||||||||||||||
| Series: Kaby Lake Refresh Kaby Lake Refresh |
|
|
| ||||||||||||||||||||||||||||||||||||||||||||||||||||||||||||||||||||||||||||||||||||||||
| Clock | 1800 - 4900 MHz | 1900 - 4200 MHz | 1800 - 4000 MHz | ||||||||||||||||||||||||||||||||||||||||||||||||||||||||||||||||||||||||||||||||||||||||
| L1 Cache | 256 KB | 256 KB | 256 KB | ||||||||||||||||||||||||||||||||||||||||||||||||||||||||||||||||||||||||||||||||||||||||
| L2 Cache | 1 MB | 1 MB | 1 MB | ||||||||||||||||||||||||||||||||||||||||||||||||||||||||||||||||||||||||||||||||||||||||
| L3 Cache | 8 MB | 8 MB | 8 MB | ||||||||||||||||||||||||||||||||||||||||||||||||||||||||||||||||||||||||||||||||||||||||
| Cores / Threads | 4 / 8 | 4 / 8 | 4 / 8 | ||||||||||||||||||||||||||||||||||||||||||||||||||||||||||||||||||||||||||||||||||||||||
| TDP | 15 Watt | 15 Watt | 15 Watt | ||||||||||||||||||||||||||||||||||||||||||||||||||||||||||||||||||||||||||||||||||||||||
| Technology | 14 nm | 14 nm | 14 nm | ||||||||||||||||||||||||||||||||||||||||||||||||||||||||||||||||||||||||||||||||||||||||
| max. Temp. | 100 °C | ||||||||||||||||||||||||||||||||||||||||||||||||||||||||||||||||||||||||||||||||||||||||||
| Socket | BGA1528 | BGA1356 | BGA1356 | ||||||||||||||||||||||||||||||||||||||||||||||||||||||||||||||||||||||||||||||||||||||||
| Features | LPDDR3-2133/DDR4-2666/LPDDR4-2933 RAM, PCIe 3, 4 GT/s bus, MMX, SSE, SSE2, SSE3, SSSE3, SSE4.1, SSE4.2, AVX, AVX2, BMI2, ABM, FMA, ADX, VMX, SMEP, SMAP, MPX, EIST, TM1, TM2, Hyper-Threading, Turbo, SST, AES-NI, RDRAND, RDSEED, SGX | Dual-Channel DDR4 Memory Controller, HyperThreading, AVX, AVX2, Quick Sync, Virtualization, AES-NI | Dual-Channel DDR4 Memory Controller, HyperThreading, AVX, AVX2, Quick Sync, Virtualization, AES-NI | ||||||||||||||||||||||||||||||||||||||||||||||||||||||||||||||||||||||||||||||||||||||||
| iGPU | Intel UHD Graphics 620 (300 - 1150 MHz) | Intel UHD Graphics 620 (300 - 1150 MHz) | Intel UHD Graphics 620 (300 - 1150 MHz) | ||||||||||||||||||||||||||||||||||||||||||||||||||||||||||||||||||||||||||||||||||||||||
| Architecture | x86 | x86 | x86 | ||||||||||||||||||||||||||||||||||||||||||||||||||||||||||||||||||||||||||||||||||||||||
| Announced | |||||||||||||||||||||||||||||||||||||||||||||||||||||||||||||||||||||||||||||||||||||||||||
| Manufacturer | ark.intel.com | ark.intel.com | |||||||||||||||||||||||||||||||||||||||||||||||||||||||||||||||||||||||||||||||||||||||||
| $409 U.S. | $409 U.S. |

Benchmarks
| Model | CPU | GPU | RAM | Value |
|---|---|---|---|---|
| Xiaomi Mi NoteBook 14 Horizon Edition | i7-10510U 51 W / 32 W | GeForce MX350 1468 / 1752 MHz 2 GB | 8 GB | 3626 |
| Lenovo Ideapad S540-14IML | i7-10510U 44 W / 24 W | GeForce MX250 1582 / 1750 MHz 2 GB | 12 GB | 3734 |
| Lenovo ThinkPad P14s Gen1 20S40009GE | i7-10510U 51 W / 25 W | Quadro P520 16 W 1493 / 1502 MHz 2 GB | 16 GB | 4239 |
| CPU TDP 24 W | TDP 25 W | TDP 32 W |
|---|---|---|
| 88% | 100% | 86% |
| Model | CPU | GPU | RAM | Value |
|---|---|---|---|---|
| Kuu LeBook 12.6 Core i7-8550U | i5-8550U 18 W / 15 W | UHD Graphics 620 1067 / 1150 MHz | 8 GB | 2914 |
| CPU TDP 15 W | TDP 24 W | TDP 25 W | TDP 32 W |
|---|---|---|---|
| 69% | 88% | 100% | 86% |
| Model | CPU | GPU | RAM | Value |
|---|---|---|---|---|
| Xiaomi Mi NoteBook 14 Horizon Edition | i7-10510U 51 W / 32 W | GeForce MX350 1468 / 1752 MHz 2 GB | 8 GB | 1066 |
| Lenovo Ideapad S540-14IML | i7-10510U 44 W / 24 W | GeForce MX250 1582 / 1750 MHz 2 GB | 12 GB | 1152 |
| Lenovo ThinkPad P14s Gen1 20S40009GE | i7-10510U 51 W / 25 W | Quadro P520 16 W 1493 / 1502 MHz 2 GB | 16 GB | 1207 |
| CPU TDP 24 W | TDP 25 W | TDP 32 W |
|---|---|---|
| 95% | 100% | 88% |
| Model | CPU | GPU | RAM | Value |
|---|---|---|---|---|
| Kuu LeBook 12.6 Core i7-8550U | i5-8550U 18 W / 15 W | UHD Graphics 620 1067 / 1150 MHz | 8 GB | 1021 |
| CPU TDP 15 W | TDP 24 W | TDP 25 W | TDP 32 W |
|---|---|---|---|
| 85% | 95% | 100% | 88% |
| CPU TDP ? | TDP 24 W | TDP 25 W | TDP 32 W |
|---|---|---|---|
| 93% | 97% | 100% | 100% |
| Model | CPU | GPU | RAM | Value |
|---|---|---|---|---|
| Dynabook Portege A30-E-174 | i5-8550U | UHD Graphics 620 1150 / 1200 MHz | 16 GB | 383 |
| Kuu LeBook 12.6 Core i7-8550U | i5-8550U 18 W / 15 W | UHD Graphics 620 1067 / 1150 MHz | 8 GB | 394 |
| CPU TDP ? | TDP 15 W | TDP 24 W | TDP 25 W | TDP 32 W |
|---|---|---|---|---|
| 93% | 85% | 97% | 100% | 100% |
| CPU TDP ? | TDP 24 W | TDP 25 W | TDP 32 W |
|---|---|---|---|
| 86% | 94% | 100% | 89% |
| Model | CPU | GPU | RAM | Value |
|---|---|---|---|---|
| Kuu LeBook 12.6 Core i7-8550U | i5-8550U 18 W / 15 W | UHD Graphics 620 1067 / 1150 MHz | 8 GB | 1118 |
| Dynabook Portege A30-E-174 | i5-8550U | UHD Graphics 620 1150 / 1200 MHz | 16 GB | 1138 |
| CPU TDP ? | TDP 15 W | TDP 24 W | TDP 25 W | TDP 32 W |
|---|---|---|---|---|
| 86% | 69% | 94% | 100% | 89% |
| CPU TDP ? | TDP 24 W | TDP 25 W | TDP 32 W |
|---|---|---|---|
| 93% | 91% | 98% | 100% |
| CPU TDP ? | TDP 24 W | TDP 25 W | TDP 32 W |
|---|---|---|---|
| 90% | 91% | 98% | 100% |
| CPU TDP ? | TDP 15 W | TDP 24 W | TDP 25 W | TDP 32 W |
|---|---|---|---|---|
| 85% | 67% | 91% | 98% | 100% |
| CPU TDP ? | TDP 24 W | TDP 25 W | TDP 32 W |
|---|---|---|---|
| 95% | 100% | 100% | 100% |
| CPU TDP ? | TDP 24 W | TDP 25 W | TDP 32 W |
|---|---|---|---|
| 93% | 100% | 100% | 100% |
| CPU TDP ? | TDP 15 W | TDP 24 W | TDP 25 W | TDP 32 W |
|---|---|---|---|---|
| 89% | 75% | 100% | 100% | 100% |
| Model | CPU | GPU | RAM | Value |
|---|---|---|---|---|
| Lenovo ThinkPad X1 Yoga 2020-20UCS03S00 | i7-10510U | UHD Graphics 620 | 16 GB | 6.69 |
| Model | CPU | GPU | RAM | Value |
|---|---|---|---|---|
| Dell Latitude 5420 Rugged-P85G | i7-8650U | Radeon RX 540 1176 / 1500 MHz 4 GB | 16 GB | 5.04 |
| Dell Latitude 7424 Rugged Extreme | i7-8650U | Radeon RX 540 1176 / 1500 MHz 4 GB | 16 GB | 5.06 |
| Fujitsu LifeBook U758 | i7-8650U | UHD Graphics 620 | 32 GB | 5.77 |
| Dell Latitude 7390 2-in-1 | i7-8650U | UHD Graphics 620 1150 / 1067 MHz | 16 GB | 6.28 |
| Dell Latitude 7390 | i7-8650U | UHD Graphics 620 1150 MHz | 8 GB | 6.82 |
| Dell Latitude 7490 | i7-8650U | UHD Graphics 620 400 / 1197 MHz 1 GB | 8 GB | 6.96 |
| Dell Latitude 5490 | i7-8650U | UHD Graphics 620 1150 MHz | 8 GB | 6.97 |
| Lenovo ThinkPad P52S-20LB001FUS | i7-8650U | Quadro P500 1455 / 1253 MHz 2 GB | 16 GB | 7.01 |
| Microsoft Surface Book 2 | i7-8650U | GeForce GTX 1050 Mobile 1493 / 1752 MHz 2 GB | 8 GB | 7.24 |
| Model | CPU | GPU | RAM | Value |
|---|---|---|---|---|
| Lenovo ThinkPad X1 Yoga 2020-20UCS03S00 | i7-10510U | UHD Graphics 620 | 16 GB | 1.95 |
| Model | CPU | GPU | RAM | Value |
|---|---|---|---|---|
| Dell Latitude 7424 Rugged Extreme | i7-8650U | Radeon RX 540 1176 / 1500 MHz 4 GB | 16 GB | 1.67 |
| Fujitsu LifeBook U758 | i7-8650U | UHD Graphics 620 | 32 GB | 1.7 |
| Dell Latitude 5420 Rugged-P85G | i7-8650U | Radeon RX 540 1176 / 1500 MHz 4 GB | 16 GB | 1.84 |
| Dell Latitude 7390 2-in-1 | i7-8650U | UHD Graphics 620 1150 / 1067 MHz | 16 GB | 1.88 |
| Lenovo ThinkPad P52S-20LB001FUS | i7-8650U | Quadro P500 1455 / 1253 MHz 2 GB | 16 GB | 1.92 |
| Microsoft Surface Book 2 | i7-8650U | GeForce GTX 1050 Mobile 1493 / 1752 MHz 2 GB | 8 GB | 2.01 |
| Dell Latitude 7490 | i7-8650U | UHD Graphics 620 400 / 1197 MHz 1 GB | 8 GB | 2.01 |
| Dell Latitude 7390 | i7-8650U | UHD Graphics 620 1150 MHz | 8 GB | 2.02 |
| Dell Latitude 5490 | i7-8650U | UHD Graphics 620 1150 MHz | 8 GB | 2.04 |
| Model | CPU | GPU | RAM | Value |
|---|---|---|---|---|
| Lenovo ThinkPad X1 Yoga 2020-20UCS03S00 | i7-10510U | UHD Graphics 620 | 16 GB | 5740 |
| Asus ZenBook 15 UX534FTC-A8190T | i7-10510U | GeForce GTX 1650 Max-Q 1245 / 1751 MHz 4 GB | 16 GB | 7268 |
| Asus ZenBook Flip 15 UX563FD-A1027T | i7-10510U | GeForce GTX 1050 Max-Q 1329 / 1752 MHz 4 GB | 16 GB | 7748 |
| Model | CPU | GPU | RAM | Value |
|---|---|---|---|---|
| Fujitsu LifeBook U758 | i7-8650U | UHD Graphics 620 | 32 GB | 5307 |
| Microsoft Surface Book 2 | i7-8650U | GeForce GTX 1050 Mobile 1493 / 1752 MHz 2 GB | 8 GB | 6531 |
| Dell Latitude 7490 | i7-8650U | UHD Graphics 620 400 / 1197 MHz 1 GB | 8 GB | 6727 |
| Lenovo ThinkPad P52S-20LB001FUS | i7-8650U | Quadro P500 1455 / 1253 MHz 2 GB | 16 GB | 6782 |
| Model | CPU | GPU | RAM | Value |
|---|---|---|---|---|
| Lenovo ThinkPad X1 Yoga 2020-20UCS03S00 | i7-10510U | UHD Graphics 620 | 16 GB | 6763 |
| Asus ZenBook 15 UX534FTC-A8190T | i7-10510U | GeForce GTX 1650 Max-Q 1245 / 1751 MHz 4 GB | 16 GB | 25882 |
| Asus ZenBook Flip 15 UX563FD-A1027T | i7-10510U | GeForce GTX 1050 Max-Q 1329 / 1752 MHz 4 GB | 16 GB | 26265 |
| Model | CPU | GPU | RAM | Value |
|---|---|---|---|---|
| Lenovo ThinkPad P52S-20LB001FUS | i7-8650U | Quadro P500 1455 / 1253 MHz 2 GB | 16 GB | 16227 |
| Fujitsu LifeBook U758 | i7-8650U | UHD Graphics 620 | 32 GB | 16921 |
| Dell Latitude 7490 | i7-8650U | UHD Graphics 620 400 / 1197 MHz 1 GB | 8 GB | 20349 |
| Microsoft Surface Book 2 | i7-8650U | GeForce GTX 1050 Mobile 1493 / 1752 MHz 2 GB | 8 GB | 21455 |
| Model | CPU | GPU | RAM | Value |
|---|---|---|---|---|
| Lenovo ThinkPad X1 Yoga 2020-20UCS03S00 | i7-10510U | UHD Graphics 620 | 16 GB | 9009 |
| Model | CPU | GPU | RAM | Value |
|---|---|---|---|---|
| Fujitsu LifeBook U758 | i7-8650U | UHD Graphics 620 | 32 GB | 21677 |
| Model | CPU | GPU | RAM | Value |
|---|---|---|---|---|
| Lenovo ThinkPad T480-20L6S01V00 | i5-8550U | GeForce MX150 1469 / 1502 MHz 2 GB | 8 GB | 12279 |
| Dell Inspiron 17-7773-0043 | i5-8550U | GeForce MX150 1532 / 6000 MHz 2 GB | 16 GB | 18697 |
| SCHENKER Slim 15 L17 | i5-8550U | UHD Graphics 620 | 16 GB | 20666 |
| Lenovo IdeaPad 530s-14IKB | i5-8550U | GeForce MX150 1532 / 6000 MHz 2 GB | 8 GB | 21836 |
| HP ZBook 15u G5 2ZC05EA | i5-8550U | Radeon Pro WX 3100 1046 / 1500 MHz 2 GB | 8 GB | 22346 |
| Tuxedo InfinityBook Pro 13 2017 | i5-8550U | UHD Graphics 620 | 32 GB | 22468 |
| HP ZBook 14u G5-2ZB99EA | i5-8550U | Radeon Pro WX 3100 1046 / 6000 MHz 2 GB | 8 GB | 22966 |
| Acer Spin 5 SP515-51GN-80A3 | i5-8550U | GeForce GTX 1050 Mobile 1493 / 7000 MHz 4 GB | 8 GB | 23730 |
| Acer Aspire 5 A517-51G-80L | i5-8550U | GeForce MX150 1532 / 6000 MHz 2 GB | 8 GB | 25544 |
| Dell Inspiron 15 7570 | i5-8550U | GeForce 940MX 1242 / 4000 MHz 4 GB | 8 GB | 25854 |
| Lenovo ThinkPad T480s-20L8S02E00 | i5-8550U | GeForce MX150 1038 / 1252.5 MHz 2 GB | 16 GB | 29780 |
| Asus ZenBook Flip 15 UX561UD | i5-8550U | GeForce GTX 1050 Mobile 1493 / 7000 MHz 2 GB | 16 GB | 31667 |
| Model | CPU | GPU | RAM | Value |
|---|---|---|---|---|
| Lenovo ThinkPad X1 Yoga 2020-20UCS03S00 | i7-10510U | UHD Graphics 620 | 16 GB | 5856 |
| Model | CPU | GPU | RAM | Value |
|---|---|---|---|---|
| Fujitsu LifeBook U758 | i7-8650U | UHD Graphics 620 | 32 GB | 6864 |
| Model | CPU | GPU | RAM | Value |
|---|---|---|---|---|
| Lenovo ThinkPad T480-20L6S01V00 | i5-8550U | GeForce MX150 1469 / 1502 MHz 2 GB | 8 GB | 6737 |
| Dell Inspiron 17-7773-0043 | i5-8550U | GeForce MX150 1532 / 6000 MHz 2 GB | 16 GB | 6879 |
| Tuxedo InfinityBook Pro 13 2017 | i5-8550U | UHD Graphics 620 | 32 GB | 7952 |
| Lenovo IdeaPad 530s-14IKB | i5-8550U | GeForce MX150 1532 / 6000 MHz 2 GB | 8 GB | 8125 |
| SCHENKER Slim 15 L17 | i5-8550U | UHD Graphics 620 | 16 GB | 8271 |
| Acer Spin 5 SP515-51GN-80A3 | i5-8550U | GeForce GTX 1050 Mobile 1493 / 7000 MHz 4 GB | 8 GB | 8359 |
| Dell Inspiron 15 7570 | i5-8550U | GeForce 940MX 1242 / 4000 MHz 4 GB | 8 GB | 8382 |
| HP ZBook 14u G5-2ZB99EA | i5-8550U | Radeon Pro WX 3100 1046 / 6000 MHz 2 GB | 8 GB | 8383 |
| Asus ZenBook Flip 15 UX561UD | i5-8550U | GeForce GTX 1050 Mobile 1493 / 7000 MHz 2 GB | 16 GB | 8397 |
| Acer Aspire 5 A517-51G-80L | i5-8550U | GeForce MX150 1532 / 6000 MHz 2 GB | 8 GB | 8426 |
| HP ZBook 15u G5 2ZC05EA | i5-8550U | Radeon Pro WX 3100 1046 / 1500 MHz 2 GB | 8 GB | 8430 |
| Lenovo ThinkPad T480s-20L8S02E00 | i5-8550U | GeForce MX150 1038 / 1252.5 MHz 2 GB | 16 GB | 8436 |
| Model | CPU | GPU | RAM | Value |
|---|---|---|---|---|
| Dell Latitude 7390 | i7-8650U | UHD Graphics 620 1150 MHz | 8 GB | 268.3 |
| Dell Latitude 7390 2-in-1 | i7-8650U | UHD Graphics 620 1150 / 1067 MHz | 16 GB | 302.8 |
| Dell Latitude 5490 | i7-8650U | UHD Graphics 620 1150 MHz | 8 GB | 334.6 |
| Model | CPU | GPU | RAM | Value |
|---|---|---|---|---|
| Asus VivoBook Pro 17 N705UD-EH76 | i5-8550U | GeForce GTX 1050 Mobile 1354 / 1493 MHz 4 GB | 16 GB | 257.5 |
| Asus Zenbook UX430UN | i5-8550U | GeForce MX150 1468 / 6008 MHz 2 GB | 16 GB | 269.1 |
| Samsung Notebook 9 NP900X5T-X01US | i5-8550U | GeForce MX150 1468 / 6008 MHz 2 GB | 16 GB | 292.5 |
| Razer Blade Stealth QHD i7-8550U | i5-8550U @4 GHz | UHD Graphics 620 300 / 350 MHz 1 GB | 16 GB | @4 GHz 338.4 |
| Asus VivoBook S410UQ-NH74 | i5-8550U | GeForce 940MX 1242 / 4000 MHz 2 GB | 8 GB | 358.1 |
| Tuxedo InfinityBook Pro 13 2017 | i5-8550U | UHD Graphics 620 | 32 GB | 361 |
| Dell XPS 13 9370 i7 UHD | i5-8550U | UHD Graphics 620 | 16 GB | 372.4 |
| Lenovo Yoga 920-13IKB-80Y7 | i5-8550U | UHD Graphics 620 400 MHz | 7.9 GB | 378 |
| Acer Aspire 5 A517-51G-80L | i5-8550U | GeForce MX150 1532 / 6000 MHz 2 GB | 8 GB | 394 |
| HP Spectre x360 15t-bl100 | i5-8550U | GeForce MX150 1468 / 1502 MHz | 16 GB | 402.6 |
| HP Spectre x360 13t-ae000 | i5-8550U | UHD Graphics 620 1150 / 1067 MHz | 16 GB | 435 |
| Model | CPU | GPU | RAM | Value |
|---|---|---|---|---|
| Dell Latitude 7390 | i7-8650U | UHD Graphics 620 1150 MHz | 8 GB | 8.636 |
| Dell Latitude 7390 2-in-1 | i7-8650U | UHD Graphics 620 1150 / 1067 MHz | 16 GB | 9.94 |
| Dell Latitude 5490 | i7-8650U | UHD Graphics 620 1150 MHz | 8 GB | 10.28 |
| Model | CPU | GPU | RAM | Value |
|---|---|---|---|---|
| Asus VivoBook Pro 17 N705UD-EH76 | i5-8550U | GeForce GTX 1050 Mobile 1354 / 1493 MHz 4 GB | 16 GB | 7.047 |
| Razer Blade Stealth QHD i7-8550U | i5-8550U @4 GHz | UHD Graphics 620 300 / 350 MHz 1 GB | 16 GB | @4 GHz 7.4 |
| Asus Zenbook UX430UN | i5-8550U | GeForce MX150 1468 / 6008 MHz 2 GB | 16 GB | 7.831 |
| Samsung Notebook 9 NP900X5T-X01US | i5-8550U | GeForce MX150 1468 / 6008 MHz 2 GB | 16 GB | 8.136 |
| Lenovo Yoga 920-13IKB-80Y7 | i5-8550U | UHD Graphics 620 400 MHz | 7.9 GB | 9.52 |
| Asus VivoBook S410UQ-NH74 | i5-8550U | GeForce 940MX 1242 / 4000 MHz 2 GB | 8 GB | 9.82 |
| Acer Aspire 5 A517-51G-80L | i5-8550U | GeForce MX150 1532 / 6000 MHz 2 GB | 8 GB | 9.971 |
| HP Spectre x360 15t-bl100 | i5-8550U | GeForce MX150 1468 / 1502 MHz | 16 GB | 10.59 |
| HP Spectre x360 13t-ae000 | i5-8550U | UHD Graphics 620 1150 / 1067 MHz | 16 GB | 10.6 |
| Tuxedo InfinityBook Pro 13 2017 | i5-8550U | UHD Graphics 620 | 32 GB | 11.7 |
| Dell XPS 13 9370 i7 UHD | i5-8550U | UHD Graphics 620 | 16 GB | 12.7 |
| Model | CPU | GPU | RAM | Value |
|---|---|---|---|---|
| Microsoft Surface Book 2 | i7-8650U | GeForce GTX 1050 Mobile 1493 / 1752 MHz 2 GB | 8 GB | 413.8 |
| Model | CPU | GPU | RAM | Value |
|---|---|---|---|---|
| Acer Aspire 5 A517-51G-80L | i5-8550U | GeForce MX150 1532 / 6000 MHz 2 GB | 8 GB | 847 |
| Model | CPU | GPU | RAM | Value |
|---|---|---|---|---|
| Microsoft Surface Book 2 | i7-8650U | GeForce GTX 1050 Mobile 1493 / 1752 MHz 2 GB | 8 GB | 10.33 |
| Model | CPU | GPU | RAM | Value |
|---|---|---|---|---|
| Acer Aspire 5 A517-51G-80L | i5-8550U | GeForce MX150 1532 / 6000 MHz 2 GB | 8 GB | 26.3 |
| Model | CPU | GPU | RAM | Value |
|---|---|---|---|---|
| Dell Latitude 7390 2-in-1 | i7-8650U | UHD Graphics 620 1150 / 1067 MHz | 16 GB | 4140 |
| Microsoft Surface Book 2 | i7-8650U | GeForce GTX 1050 Mobile 1493 / 1752 MHz 2 GB | 8 GB | 4190 |
| Dell Latitude 7390 | i7-8650U | UHD Graphics 620 1150 MHz | 8 GB | 4448 |
| Dell Latitude 5490 | i7-8650U | UHD Graphics 620 1150 MHz | 8 GB | 4915 |
| Model | CPU | GPU | RAM | Value |
|---|---|---|---|---|
| Lenovo Yoga 920-13IKB-80Y7 | i5-8550U | UHD Graphics 620 400 MHz | 7.9 GB | 3847 |
| HP Spectre x360 13t-ae000 | i5-8550U | UHD Graphics 620 1150 / 1067 MHz | 16 GB | 3970 |
| Acer Aspire 5 A517-51G-80L | i5-8550U | GeForce MX150 1532 / 6000 MHz 2 GB | 8 GB | 4121 |
| Asus VivoBook S410UQ-NH74 | i5-8550U | GeForce 940MX 1242 / 4000 MHz 2 GB | 8 GB | 4374 |
| Tuxedo InfinityBook Pro 13 2017 | i5-8550U | UHD Graphics 620 | 32 GB | 4835 |
| HP Spectre x360 15t-bl100 | i5-8550U | GeForce MX150 1468 / 1502 MHz | 16 GB | 4976 |
| Asus VivoBook Pro 17 N705UD-EH76 | i5-8550U | GeForce GTX 1050 Mobile 1354 / 1493 MHz 4 GB | 16 GB | 5287 |
| CPU TDP ? | TDP 24 W | TDP 25 W | TDP 32 W |
|---|---|---|---|
| 90% | 97% | 99% | 100% |
| Model | CPU | GPU | RAM | Value |
|---|---|---|---|---|
| Kuu LeBook 12.6 Core i7-8550U | i5-8550U 18 W / 15 W | UHD Graphics 620 1067 / 1150 MHz | 8 GB | 15613 |
| CPU TDP ? | TDP 15 W | TDP 24 W | TDP 25 W | TDP 32 W |
|---|---|---|---|---|
| 90% | 80% | 97% | 99% | 100% |
| CPU TDP ? | TDP 24 W | TDP 25 W | TDP 32 W |
|---|---|---|---|
| 94% | 100% | 98% | 99% |
| Model | CPU | GPU | RAM | Value |
|---|---|---|---|---|
| Kuu LeBook 12.6 Core i7-8550U | i5-8550U 18 W / 15 W | UHD Graphics 620 1067 / 1150 MHz | 8 GB | 4337 |
| CPU TDP ? | TDP 15 W | TDP 24 W | TDP 25 W | TDP 32 W |
|---|---|---|---|---|
| 94% | 89% | 100% | 98% | 99% |
| Model | CPU | GPU | RAM | Value |
|---|---|---|---|---|
| Dell Latitude 7390 2-in-1 | i7-8650U | UHD Graphics 620 1150 / 1067 MHz | 16 GB | 35 |
| Dell Latitude 7390 | i7-8650U | UHD Graphics 620 1150 MHz | 8 GB | 39 |
| Microsoft Surface Book 2 | i7-8650U | GeForce GTX 1050 Mobile 1493 / 1752 MHz 2 GB | 8 GB | 40.5 |
| Dell Latitude 5490 | i7-8650U | UHD Graphics 620 1150 MHz | 8 GB | 41.98 |
| Model | CPU | GPU | RAM | Value |
|---|---|---|---|---|
| HP Spectre x360 13t-ae000 | i5-8550U | UHD Graphics 620 1150 / 1067 MHz | 16 GB | 32 |
| Acer Aspire 5 A517-51G-80L | i5-8550U | GeForce MX150 1532 / 6000 MHz 2 GB | 8 GB | 33.1 |
| Xiaomi Mi Notebook Pro i7 | i5-8550U | GeForce MX150 1341 / 1253 MHz 2 GB | 16 GB | 33.1 |
| HP Spectre x360 15t-bl100 | i5-8550U | GeForce MX150 1468 / 1502 MHz | 16 GB | 33.19 |
| Asus VivoBook S410UQ-NH74 | i5-8550U | GeForce 940MX 1242 / 4000 MHz 2 GB | 8 GB | 39.3 |
| Asus VivoBook Pro 17 N705UD-EH76 | i5-8550U | GeForce GTX 1050 Mobile 1354 / 1493 MHz 4 GB | 16 GB | 41 |
| Model | CPU | GPU | RAM | Value |
|---|---|---|---|---|
| Dell Latitude 7390 2-in-1 | i7-8650U | UHD Graphics 620 1150 / 1067 MHz | 16 GB | 149 |
| Dell Latitude 7390 | i7-8650U | UHD Graphics 620 1150 MHz | 8 GB | 168 |
| Microsoft Surface Book 2 | i7-8650U | GeForce GTX 1050 Mobile 1493 / 1752 MHz 2 GB | 8 GB | 171.2 |
| Dell Latitude 5490 | i7-8650U | UHD Graphics 620 1150 MHz | 8 GB | 173.2 |
| Model | CPU | GPU | RAM | Value |
|---|---|---|---|---|
| Acer Aspire 5 A517-51G-80L | i5-8550U | GeForce MX150 1532 / 6000 MHz 2 GB | 8 GB | 143.6 |
| Xiaomi Mi Notebook Pro i7 | i5-8550U | GeForce MX150 1341 / 1253 MHz 2 GB | 16 GB | 145 |
| HP Spectre x360 13t-ae000 | i5-8550U | UHD Graphics 620 1150 / 1067 MHz | 16 GB | 147 |
| HP Spectre x360 15t-bl100 | i5-8550U | GeForce MX150 1468 / 1502 MHz | 16 GB | 148.8 |
| Asus VivoBook S410UQ-NH74 | i5-8550U | GeForce 940MX 1242 / 4000 MHz 2 GB | 8 GB | 161 |
| Asus VivoBook Pro 17 N705UD-EH76 | i5-8550U | GeForce GTX 1050 Mobile 1354 / 1493 MHz 4 GB | 16 GB | 178 |
| CPU TDP ? | TDP 24 W | TDP 25 W | TDP 32 W |
|---|---|---|---|
| 75% | 85% | 89% | 100% |
| Model | CPU | GPU | RAM | Value |
|---|---|---|---|---|
| Kuu LeBook 12.6 Core i7-8550U | i5-8550U 18 W / 15 W | UHD Graphics 620 1067 / 1150 MHz | 8 GB | 3.77 |
| LG Gram 15Z980-B.AA78B | i5-8550U | UHD Graphics 620 | 16 GB | 3.88 |
| Xiaomi Mi Notebook Pro i7 | i5-8550U | GeForce MX150 1341 / 1253 MHz 2 GB | 16 GB | 4.43 |
| CPU TDP ? | TDP 15 W | TDP 24 W | TDP 25 W | TDP 32 W |
|---|---|---|---|---|
| 74% | 62% | 85% | 89% | 100% |
| Model | CPU | GPU | RAM | Value |
|---|---|---|---|---|
| Dell Latitude 7390 2-in-1 | i7-8650U | UHD Graphics 620 1150 / 1067 MHz | 16 GB | 0.393 |
| Dell Latitude 7390 | i7-8650U | UHD Graphics 620 1150 MHz | 8 GB | 0.443 |
| Dell Latitude 5490 | i7-8650U | UHD Graphics 620 1150 MHz | 8 GB | 0.443 |
| Microsoft Surface Book 2 | i7-8650U | GeForce GTX 1050 Mobile 1493 / 1752 MHz 2 GB | 8 GB | 0.444 |
| Model | CPU | GPU | RAM | Value |
|---|---|---|---|---|
| Tuxedo InfinityBook Pro 13 2017 | i5-8550U | UHD Graphics 620 | 32 GB | 0.357 |
| Asus Zenbook UX430UN | i5-8550U | GeForce MX150 1468 / 6008 MHz 2 GB | 16 GB | 0.405 |
| HP Spectre x360 13t-ae000 | i5-8550U | UHD Graphics 620 1150 / 1067 MHz | 16 GB | 0.42 |
| Samsung Notebook 9 NP900X5T-X01US | i5-8550U | GeForce MX150 1468 / 6008 MHz 2 GB | 16 GB | 0.441 |
| Acer Aspire 5 A517-51G-80L | i5-8550U | GeForce MX150 1532 / 6000 MHz 2 GB | 8 GB | 0.46 |
| Asus VivoBook Pro 17 N705UD-EH76 | i5-8550U | GeForce GTX 1050 Mobile 1354 / 1493 MHz 4 GB | 16 GB | 0.469 |
| Model | CPU | GPU | RAM | Value |
|---|---|---|---|---|
| Dell Latitude 7390 2-in-1 | i7-8650U | UHD Graphics 620 1150 / 1067 MHz | 16 GB | 0.662 |
| Microsoft Surface Book 2 | i7-8650U | GeForce GTX 1050 Mobile 1493 / 1752 MHz 2 GB | 8 GB | 0.715 |
| Dell Latitude 7390 | i7-8650U | UHD Graphics 620 1150 MHz | 8 GB | 0.733 |
| Dell Latitude 5490 | i7-8650U | UHD Graphics 620 1150 MHz | 8 GB | 0.733 |
| Model | CPU | GPU | RAM | Value |
|---|---|---|---|---|
| Tuxedo InfinityBook Pro 13 2017 | i5-8550U | UHD Graphics 620 | 32 GB | 0.583 |
| Asus Zenbook UX430UN | i5-8550U | GeForce MX150 1468 / 6008 MHz 2 GB | 16 GB | 0.673 |
| HP Spectre x360 13t-ae000 | i5-8550U | UHD Graphics 620 1150 / 1067 MHz | 16 GB | 0.68 |
| Samsung Notebook 9 NP900X5T-X01US | i5-8550U | GeForce MX150 1468 / 6008 MHz 2 GB | 16 GB | 0.778 |
| Acer Aspire 5 A517-51G-80L | i5-8550U | GeForce MX150 1532 / 6000 MHz 2 GB | 8 GB | 0.785 |
| Asus VivoBook Pro 17 N705UD-EH76 | i5-8550U | GeForce GTX 1050 Mobile 1354 / 1493 MHz 4 GB | 16 GB | 0.793 |
| Model | CPU | GPU | RAM | Value |
|---|---|---|---|---|
| Dell Latitude 7390 2-in-1 | i7-8650U | UHD Graphics 620 1150 / 1067 MHz | 16 GB | 3.9 |
| Microsoft Surface Book 2 | i7-8650U | GeForce GTX 1050 Mobile 1493 / 1752 MHz 2 GB | 8 GB | 4.2 |
| Dell Latitude 7390 | i7-8650U | UHD Graphics 620 1150 MHz | 8 GB | 4.4 |
| Dell Latitude 5490 | i7-8650U | UHD Graphics 620 1150 MHz | 8 GB | 4.4 |
| Model | CPU | GPU | RAM | Value |
|---|---|---|---|---|
| Tuxedo InfinityBook Pro 13 2017 | i5-8550U | UHD Graphics 620 | 32 GB | 3.3 |
| Asus Zenbook UX430UN | i5-8550U | GeForce MX150 1468 / 6008 MHz 2 GB | 16 GB | 3.9 |
| HP Spectre x360 13t-ae000 | i5-8550U | UHD Graphics 620 1150 / 1067 MHz | 16 GB | 4.1 |
| Acer Aspire 5 A517-51G-80L | i5-8550U | GeForce MX150 1532 / 6000 MHz 2 GB | 8 GB | 4.5 |
| Asus VivoBook Pro 17 N705UD-EH76 | i5-8550U | GeForce GTX 1050 Mobile 1354 / 1493 MHz 4 GB | 16 GB | 4.5 |
| Samsung Notebook 9 NP900X5T-X01US | i5-8550U | GeForce MX150 1468 / 6008 MHz 2 GB | 16 GB | 4.6 |
| CPU TDP ? | TDP 24 W | TDP 25 W | TDP 32 W |
|---|---|---|---|
| 100% | 101% | 101% | 101% |
| Model | CPU | GPU | RAM | Value |
|---|---|---|---|---|
| Xiaomi Mi Notebook Pro i7 | i5-8550U | GeForce MX150 1341 / 1253 MHz 2 GB | 16 GB | 841 |
| Razer Blade Stealth QHD i7-8550U | i5-8550U @4 GHz | UHD Graphics 620 300 / 350 MHz 1 GB | 16 GB | @4 GHz 841 |
| Kuu LeBook 12.6 Core i7-8550U | i5-8550U 18 W / 15 W | UHD Graphics 620 1067 / 1150 MHz | 8 GB | 913 |
| LG Gram 15Z980-B.AA78B | i5-8550U | UHD Graphics 620 | 16 GB | 937 |
| CPU TDP ? | TDP 15 W | TDP 24 W | TDP 25 W | TDP 32 W |
|---|---|---|---|---|
| 101% | 100% | 102% | 102% | 102% |
| CPU TDP ? | TDP 24 W | TDP 25 W | TDP 32 W |
|---|---|---|---|
| 100% | 101% | 101% | 101% |
| Model | CPU | GPU | RAM | Value |
|---|---|---|---|---|
| Kuu LeBook 12.6 Core i7-8550U | i5-8550U 18 W / 15 W | UHD Graphics 620 1067 / 1150 MHz | 8 GB | 0.716 |
| CPU TDP ? | TDP 15 W | TDP 24 W | TDP 25 W | TDP 32 W |
|---|---|---|---|---|
| 101% | 100% | 101% | 102% | 102% |
| Model | CPU | GPU | RAM | Value |
|---|---|---|---|---|
| HP 470 G7 8VU24EA | i7-10510U | Radeon 530 920 / 1000 MHz 2 GB | 16 GB | 5989 |
| HP Envy 13-ba0001ng | i7-10510U 4900 W / W | GeForce MX350 747 / 1752 MHz 2 GB | 16 GB | 6125 |
| Asus ZenBook 15 UX534FTC-A8190T | i7-10510U | GeForce GTX 1650 Max-Q 1245 / 1751 MHz 4 GB | 16 GB | 13303 |
| Model | CPU | GPU | RAM | Value |
|---|---|---|---|---|
| Dell Latitude 5420 Rugged-P85G | i7-8650U | Radeon RX 540 1176 / 1500 MHz 4 GB | 16 GB | 4487 |
| Dell Latitude 7390 2-in-1 | i7-8650U | UHD Graphics 620 1150 / 1067 MHz | 16 GB | 6930 |
| Microsoft Surface Book 2 | i7-8650U | GeForce GTX 1050 Mobile 1493 / 1752 MHz 2 GB | 8 GB | 6936 |
| Dell Latitude 7390 | i7-8650U | UHD Graphics 620 1150 MHz | 8 GB | 7286 |
| Dell Latitude 5490 | i7-8650U | UHD Graphics 620 1150 MHz | 8 GB | 7939 |
| Model | CPU | GPU | RAM | Value |
|---|---|---|---|---|
| Dell Latitude 7390 | i7-8650U | UHD Graphics 620 1150 MHz | 8 GB | 8 |
| Dell Latitude 5490 | i7-8650U | UHD Graphics 620 1150 MHz | 8 GB | 8 |
| Microsoft Surface Book 2 | i7-8650U | GeForce GTX 1050 Mobile 1493 / 1752 MHz 2 GB | 8 GB | 8.8 |
| Dell Latitude 5420 Rugged-P85G | i7-8650U | Radeon RX 540 1176 / 1500 MHz 4 GB | 16 GB | 8.87 |
| Dell Latitude 7424 Rugged Extreme | i7-8650U | Radeon RX 540 1176 / 1500 MHz 4 GB | 16 GB | 8.889 |
| Dell Latitude 7390 2-in-1 | i7-8650U | UHD Graphics 620 1150 / 1067 MHz | 16 GB | 9 |
| Model | CPU | GPU | RAM | Value |
|---|---|---|---|---|
| HP Spectre x360 13t-ae000 | i5-8550U | UHD Graphics 620 1150 / 1067 MHz | 16 GB | 9 |
| Asus VivoBook Pro 17 N705UD-EH76 | i5-8550U | GeForce GTX 1050 Mobile 1354 / 1493 MHz 4 GB | 16 GB | 9 |
| Asus Zenbook UX430UN | i5-8550U | GeForce MX150 1468 / 6008 MHz 2 GB | 16 GB | 9.239 |
| Samsung Notebook 9 NP900X5T-X01US | i5-8550U | GeForce MX150 1468 / 6008 MHz 2 GB | 16 GB | 9.25 |
| Lenovo Yoga 920-13IKB-80Y7 | i5-8550U | UHD Graphics 620 400 MHz | 7.9 GB | 9.27 |
| HP Spectre x360 15t-bl100 | i5-8550U | GeForce MX150 1468 / 1502 MHz | 16 GB | 9.28 |
| Acer TravelMate X3410-M-866T | i5-8550U | UHD Graphics 620 400 / 665 MHz 1 GB | 16 GB | 9.341 |
| Acer Aspire 5 A517-51G-80L | i5-8550U | GeForce MX150 1532 / 6000 MHz 2 GB | 8 GB | 9.704 |
| Tuxedo InfinityBook Pro 13 2017 | i5-8550U | UHD Graphics 620 | 32 GB | 10 |
| Asus VivoBook S410UQ-NH74 | i5-8550U | GeForce 940MX 1242 / 4000 MHz 2 GB | 8 GB | 14.37 |
| Dell XPS 13 9370 i7 UHD | i5-8550U | UHD Graphics 620 | 16 GB | 17.45 |
| Model | CPU | GPU | RAM | Value |
|---|---|---|---|---|
| Dell Latitude 7390 | i7-8650U | UHD Graphics 620 1150 MHz | 8 GB | 19 |
| Dell Latitude 5490 | i7-8650U | UHD Graphics 620 1150 MHz | 8 GB | 19 |
| Dell Latitude 5420 Rugged-P85G | i7-8650U | Radeon RX 540 1176 / 1500 MHz 4 GB | 16 GB | 19.93 |
| Dell Latitude 7390 2-in-1 | i7-8650U | UHD Graphics 620 1150 / 1067 MHz | 16 GB | 20 |
| Dell Latitude 7424 Rugged Extreme | i7-8650U | Radeon RX 540 1176 / 1500 MHz 4 GB | 16 GB | 20.07 |
| Microsoft Surface Book 2 | i7-8650U | GeForce GTX 1050 Mobile 1493 / 1752 MHz 2 GB | 8 GB | 20.1 |
| Model | CPU | GPU | RAM | Value |
|---|---|---|---|---|
| Asus VivoBook Pro 17 N705UD-EH76 | i5-8550U | GeForce GTX 1050 Mobile 1354 / 1493 MHz 4 GB | 16 GB | 20 |
| Samsung Notebook 9 NP900X5T-X01US | i5-8550U | GeForce MX150 1468 / 6008 MHz 2 GB | 16 GB | 20.78 |
| HP Spectre x360 15t-bl100 | i5-8550U | GeForce MX150 1468 / 1502 MHz | 16 GB | 20.83 |
| Lenovo Yoga 920-13IKB-80Y7 | i5-8550U | UHD Graphics 620 400 MHz | 7.9 GB | 20.85 |
| HP Spectre x360 13t-ae000 | i5-8550U | UHD Graphics 620 1150 / 1067 MHz | 16 GB | 21 |
| Acer Aspire 5 A517-51G-80L | i5-8550U | GeForce MX150 1532 / 6000 MHz 2 GB | 8 GB | 21.16 |
| Acer TravelMate X3410-M-866T | i5-8550U | UHD Graphics 620 400 / 665 MHz 1 GB | 16 GB | 21.18 |
| Asus Zenbook UX430UN | i5-8550U | GeForce MX150 1468 / 6008 MHz 2 GB | 16 GB | 21.24 |
| Tuxedo InfinityBook Pro 13 2017 | i5-8550U | UHD Graphics 620 | 32 GB | 22 |
| Dell XPS 13 9370 i7 UHD | i5-8550U | UHD Graphics 620 | 16 GB | 31 |
| Asus VivoBook S410UQ-NH74 | i5-8550U | GeForce 940MX 1242 / 4000 MHz 2 GB | 8 GB | 32.72 |
| Model | CPU | GPU | RAM | Value |
|---|---|---|---|---|
| Dell Latitude 5490 | i7-8650U | UHD Graphics 620 1150 MHz | 8 GB | 501 |
| Microsoft Surface Book 2 | i7-8650U | GeForce GTX 1050 Mobile 1493 / 1752 MHz 2 GB | 8 GB | 506 |
| Dell Latitude 7390 2-in-1 | i7-8650U | UHD Graphics 620 1150 / 1067 MHz | 16 GB | 507 |
| Dell Latitude 5420 Rugged-P85G | i7-8650U | Radeon RX 540 1176 / 1500 MHz 4 GB | 16 GB | 509 |
| Dell Latitude 7424 Rugged Extreme | i7-8650U | Radeon RX 540 1176 / 1500 MHz 4 GB | 16 GB | 515 |
| Dell Latitude 7390 | i7-8650U | UHD Graphics 620 1150 MHz | 8 GB | 542 |
| Model | CPU | GPU | RAM | Value |
|---|---|---|---|---|
| HP Spectre x360 15t-bl100 | i5-8550U | GeForce MX150 1468 / 1502 MHz | 16 GB | 510 |
| Asus VivoBook Pro 17 N705UD-EH76 | i5-8550U | GeForce GTX 1050 Mobile 1354 / 1493 MHz 4 GB | 16 GB | 512 |
| Samsung Notebook 9 NP900X5T-X01US | i5-8550U | GeForce MX150 1468 / 6008 MHz 2 GB | 16 GB | 514 |
| Tuxedo InfinityBook Pro 13 2017 | i5-8550U | UHD Graphics 620 | 32 GB | 524 |
| Asus Zenbook UX430UN | i5-8550U | GeForce MX150 1468 / 6008 MHz 2 GB | 16 GB | 530 |
| Lenovo Yoga 920-13IKB-80Y7 | i5-8550U | UHD Graphics 620 400 MHz | 7.9 GB | 536 |
| Acer Aspire 5 A517-51G-80L | i5-8550U | GeForce MX150 1532 / 6000 MHz 2 GB | 8 GB | 551 |
| Acer TravelMate X3410-M-866T | i5-8550U | UHD Graphics 620 400 / 665 MHz 1 GB | 16 GB | 577 |
| HP Spectre x360 13t-ae000 | i5-8550U | UHD Graphics 620 1150 / 1067 MHz | 16 GB | 601 |
| Asus VivoBook S410UQ-NH74 | i5-8550U | GeForce 940MX 1242 / 4000 MHz 2 GB | 8 GB | 734 |
| Dell XPS 13 9370 i7 UHD | i5-8550U | UHD Graphics 620 | 16 GB | 740 |
| Model | CPU | GPU | RAM | Value |
|---|---|---|---|---|
| Asus ZenBook Flip 15 UX563FD-A1027T | i7-10510U | GeForce GTX 1050 Max-Q 1329 / 1752 MHz 4 GB | 16 GB | 29737 |
| Model | CPU | GPU | RAM | Value |
|---|---|---|---|---|
| Dell Latitude 5420 Rugged-P85G | i7-8650U | Radeon RX 540 1176 / 1500 MHz 4 GB | 16 GB | 19125 |
| Model | CPU | GPU | RAM | Value |
|---|---|---|---|---|
| HP ZBook 15u G5 2ZC05EA | i5-8550U | Radeon Pro WX 3100 1046 / 1500 MHz 2 GB | 8 GB | 21623 |
| CPU TDP ? | TDP 24 W | TDP 25 W | TDP 32 W |
|---|---|---|---|
| 86% | 82% | 100% | 100% |
| CPU TDP ? | TDP 24 W | TDP 25 W | TDP 32 W |
|---|---|---|---|
| 83% | 82% | 100% | 100% |
| CPU TDP ? | TDP 15 W | TDP 24 W | TDP 25 W | TDP 32 W |
|---|---|---|---|---|
| 76% | 58% | 82% | 100% | 100% |
| CPU TDP ? | TDP 32 W |
|---|---|
| 79% | 100% |
| Model | CPU | GPU | RAM | Value |
|---|---|---|---|---|
| Dell Latitude 5420 Rugged-P85G | i7-8650U | Radeon RX 540 1176 / 1500 MHz 4 GB | 16 GB | 39040 |
| Microsoft Surface Book 2 | i7-8650U | GeForce GTX 1050 Mobile 1493 / 1752 MHz 2 GB | 8 GB | 41248 |
| Dell Latitude 7390 2-in-1 | i7-8650U | UHD Graphics 620 1150 / 1067 MHz | 16 GB | 41275 |
| Fujitsu LifeBook U758 | i7-8650U | UHD Graphics 620 | 32 GB | 41631 |
| Dell Latitude 7390 | i7-8650U | UHD Graphics 620 1150 MHz | 8 GB | 47797 |
| CPU TDP ? | TDP 32 W |
|---|---|
| 76% | 100% |
| CPU TDP ? | TDP 32 W |
|---|---|
| 73% | 100% |
| Model | CPU | GPU | RAM | Value |
|---|---|---|---|---|
| Microsoft Surface Book 2 | i7-8650U | GeForce GTX 1050 Mobile 1493 / 1752 MHz 2 GB | 8 GB | 41011 |
| Dell Latitude 7390 2-in-1 | i7-8650U | UHD Graphics 620 1150 / 1067 MHz | 16 GB | 41227 |
| Fujitsu LifeBook U758 | i7-8650U | UHD Graphics 620 | 32 GB | 41584 |
| Dell Latitude 7390 | i7-8650U | UHD Graphics 620 1150 MHz | 8 GB | 48293 |
| CPU TDP ? | TDP 32 W |
|---|---|
| 100% | 79% |
| Model | CPU | GPU | RAM | Value |
|---|---|---|---|---|
| Dell Latitude 7390 2-in-1 | i7-8650U | UHD Graphics 620 1150 / 1067 MHz | 16 GB | 44090 |
| Fujitsu LifeBook U758 | i7-8650U | UHD Graphics 620 | 32 GB | 47700 |
| Dell Latitude 5490 | i7-8650U | UHD Graphics 620 1150 MHz | 8 GB | 56455 |
| Microsoft Surface Book 2 | i7-8650U | GeForce GTX 1050 Mobile 1493 / 1752 MHz 2 GB | 8 GB | 57680 |
| Dell Latitude 7390 | i7-8650U | UHD Graphics 620 1150 MHz | 8 GB | 58675 |
| CPU TDP ? | TDP 32 W |
|---|---|
| 100% | 81% |
| CPU TDP ? | TDP 32 W |
|---|---|
| 100% | 86% |
| CPU TDP ? | TDP 24 W | TDP 32 W |
|---|---|---|
| 88% | 100% | 56% |
| Model | CPU | GPU | RAM | Value |
|---|---|---|---|---|
HP ZBook x2 G4-2ZC12EA  | i7-8650U | Quadro M620 614 / 1252 MHz 2 GB | 16 GB | 4442 |
| Lenovo ThinkPad P52S-20LB001FUS | i7-8650U | Quadro P500 1455 / 1253 MHz 2 GB | 16 GB | 4722 |
| Dell Latitude 7424 Rugged Extreme | i7-8650U | Radeon RX 540 1176 / 1500 MHz 4 GB | 16 GB | 5281 |
| Dell Latitude 5420 Rugged-P85G | i7-8650U | Radeon RX 540 1176 / 1500 MHz 4 GB | 16 GB | 5306 |
| Fujitsu LifeBook U758 | i7-8650U | UHD Graphics 620 | 32 GB | 5353 |
| Dell Latitude 7390 2-in-1 | i7-8650U | UHD Graphics 620 1150 / 1067 MHz | 16 GB | 6046 |
| HP Elitebook x360 1040 G5 | i7-8650U | UHD Graphics 620 300 / 1200 MHz | 16 GB | 6089 |
| Dell Latitude 7490 | i7-8650U | UHD Graphics 620 400 / 1197 MHz 1 GB | 8 GB | 6096 |
| Lenovo ThinkPad T580-20L9001AUS | i7-8650U | UHD Graphics 620 1150 / 1200 MHz | 16 GB | 6454 |
| Dell Latitude 7390 | i7-8650U | UHD Graphics 620 1150 MHz | 8 GB | 6464 |
| Microsoft Surface Pro 6, Core i7, 512 GB | i7-8650U | UHD Graphics 620 1150 / 933 MHz | 16 GB | 6476 |
| Dell Latitude 5490 | i7-8650U | UHD Graphics 620 1150 MHz | 8 GB | 7013 |
| Microsoft Surface Book 2 | i7-8650U | GeForce GTX 1050 Mobile 1493 / 1752 MHz 2 GB | 8 GB | 7416 |
| CPU TDP ? | TDP 24 W | TDP 32 W |
|---|---|---|
| 86% | 100% | 56% |
| CPU TDP ? | TDP 15 W | TDP 24 W | TDP 32 W |
|---|---|---|---|
| 81% | 80% | 100% | 56% |
| CPU TDP ? | TDP 24 W | TDP 25 W | TDP 32 W |
|---|---|---|---|
| 82% | 95% | 94% | 100% |
| Model | CPU | GPU | RAM | Value |
|---|---|---|---|---|
| Lenovo ThinkPad P52S-20LB001FUS | i7-8650U | Quadro P500 1455 / 1253 MHz 2 GB | 16 GB | 6823 |
| Fujitsu LifeBook U758 | i7-8650U | UHD Graphics 620 | 32 GB | 7670 |
| Dell Latitude 7424 Rugged Extreme | i7-8650U | Radeon RX 540 1176 / 1500 MHz 4 GB | 16 GB | 7942 |
| Dell Latitude 5420 Rugged-P85G | i7-8650U | Radeon RX 540 1176 / 1500 MHz 4 GB | 16 GB | 7950 |
| Dell Latitude 7390 2-in-1 | i7-8650U | UHD Graphics 620 1150 / 1067 MHz | 16 GB | 8236 |
| HP ZBook x2 G4-2ZC12EA | i7-8650U | Quadro M620 614 / 1252 MHz 2 GB | 16 GB | 9078 |
| Lenovo ThinkPad T580-20L9001AUS | i7-8650U | UHD Graphics 620 1150 / 1200 MHz | 16 GB | 9167 |
| HP ZBook x2 G4-3KK88AA | i7-8650U | Quadro M620 1018 / 1253 MHz 2 GB | 32 GB | 9263 |
| Dell Latitude 7490 | i7-8650U | UHD Graphics 620 400 / 1197 MHz 1 GB | 8 GB | 9278 |
| Dell Latitude 7390 | i7-8650U | UHD Graphics 620 1150 MHz | 8 GB | 9363 |
| Microsoft Surface Book 2 15 | i7-8650U | GeForce GTX 1060 Mobile 1569 / 2002 MHz 6 GB | 16 GB | 9979 |
| Dell Latitude 5490 | i7-8650U | UHD Graphics 620 1150 MHz | 8 GB | 10349 |
| Microsoft Surface Book 2 | i7-8650U | GeForce GTX 1050 Mobile 1493 / 1752 MHz 2 GB | 8 GB | 10541 |
| CPU TDP ? | TDP 24 W | TDP 25 W | TDP 32 W |
|---|---|---|---|
| 80% | 95% | 94% | 100% |
| CPU TDP ? | TDP 15 W | TDP 24 W | TDP 25 W | TDP 32 W |
|---|---|---|---|---|
| 74% | 55% | 95% | 94% | 100% |
| CPU TDP ? | TDP 24 W | TDP 25 W | TDP 32 W |
|---|---|---|---|
| 79% | 97% | 100% | 54% |
| Model | CPU | GPU | RAM | Value |
|---|---|---|---|---|
| Fujitsu LifeBook U758 | i7-8650U | UHD Graphics 620 | 32 GB | 2685 |
| Microsoft Surface Book 2 | i7-8650U | GeForce GTX 1050 Mobile 1493 / 1752 MHz 2 GB | 8 GB | 2708 |
| Dell Latitude 5420 Rugged-P85G | i7-8650U | Radeon RX 540 1176 / 1500 MHz 4 GB | 16 GB | 2876 |
| HP ZBook x2 G4-3KK88AA | i7-8650U | Quadro M620 1018 / 1253 MHz 2 GB | 32 GB | 3211 |
| Microsoft Surface Book 2 15 | i7-8650U | GeForce GTX 1060 Mobile 1569 / 2002 MHz 6 GB | 16 GB | 3569 |
| CPU TDP ? | TDP 24 W | TDP 25 W | TDP 32 W |
|---|---|---|---|
| 78% | 97% | 100% | 54% |
| CPU TDP ? | TDP 15 W | TDP 24 W | TDP 25 W | TDP 32 W |
|---|---|---|---|---|
| 77% | 63% | 97% | 100% | 54% |
| CPU TDP ? | TDP 24 W | TDP 25 W | TDP 32 W |
|---|---|---|---|
| 98% | 97% | 100% | 100% |
| CPU TDP ? | TDP 24 W | TDP 25 W | TDP 32 W |
|---|---|---|---|
| 87% | 84% | 100% | 99% |
| Model | CPU | GPU | RAM | Value |
|---|---|---|---|---|
| HP 470 G7 8VU24EA | i7-10510U | Radeon 530 920 / 1000 MHz 2 GB | 16 GB | 1118 |
| Lenovo Yoga C740-15IML | i7-10510U | UHD Graphics 620 | 16 GB | 1134 |
| Dell Vostro 14 5490 | i7-10510U | GeForce MX250 1582 / 1502 MHz 2 GB | 16 GB | 1180 |
| Asus ZenBook 15 UX534FTC-A8190T | i7-10510U | GeForce GTX 1650 Max-Q 1245 / 1751 MHz 4 GB | 16 GB | 1187 |
| Lenovo ThinkPad X1 Yoga 2020-20UCS03S00 | i7-10510U | UHD Graphics 620 | 16 GB | 1198 |
| HP ProBook 430 G7-8VU53EA | i7-10510U | UHD Graphics 620 | 8 GB | 1208 |
| Lenovo ThinkPad E15 20RD0011GE | i7-10510U | Radeon RX 640 1218 / 1500 MHz 2 GB | 16 GB | 1220 |
| HP ProBook 430 G7-8VU53EA | i7-10510U | UHD Graphics 620 | 8 GB | 1231 |
| Lenovo ThinkPad X1 Yoga 20SA000GUS | i7-10510U | UHD Graphics 620 | 16 GB | 1244 |
| Huawei MateBook X Pro 2020 i7 | i7-10510U | GeForce MX250 1038 / 1502 MHz 2 GB | 16 GB | 1246 |
| LG Gram 14T90N | i7-10510U | UHD Graphics 620 | 16 GB | 1255 |
| Asus ZenBook Flip 15 UX563FD-A1027T | i7-10510U | GeForce GTX 1050 Max-Q 1329 / 1752 MHz 4 GB | 16 GB | 1278 |
| Model | CPU | GPU | RAM | Value |
|---|---|---|---|---|
| Dynabook Portege A30-E-174 | i5-8550U | UHD Graphics 620 1150 / 1200 MHz | 16 GB | 1081 |
| Model | CPU | GPU | RAM | Value |
|---|---|---|---|---|
| Huawei MateBook X Pro 2020 i7 | i7-10510U | GeForce MX250 1038 / 1502 MHz 2 GB | 16 GB | 3143 |
| HP 470 G7 8VU24EA | i7-10510U | Radeon 530 920 / 1000 MHz 2 GB | 16 GB | 3188 |
| HP ProBook 430 G7-8VU53EA | i7-10510U | UHD Graphics 620 | 8 GB | 3246 |
| HP ProBook 430 G7-8VU53EA | i7-10510U | UHD Graphics 620 | 8 GB | 3326 |
| Lenovo ThinkPad E15 20RD0011GE | i7-10510U | Radeon RX 640 1218 / 1500 MHz 2 GB | 16 GB | 3437 |
| LG Gram 14T90N | i7-10510U | UHD Graphics 620 | 16 GB | 3652 |
| Dell Vostro 14 5490 | i7-10510U | GeForce MX250 1582 / 1502 MHz 2 GB | 16 GB | 3687 |
| Lenovo ThinkPad X1 Yoga 2020-20UCS03S00 | i7-10510U | UHD Graphics 620 | 16 GB | 3771 |
| Lenovo Yoga C740-15IML | i7-10510U | UHD Graphics 620 | 16 GB | 4130 |
| Lenovo ThinkPad X1 Yoga 20SA000GUS | i7-10510U | UHD Graphics 620 | 16 GB | 4335 |
| Asus ZenBook 15 UX534FTC-A8190T | i7-10510U | GeForce GTX 1650 Max-Q 1245 / 1751 MHz 4 GB | 16 GB | 4421 |
| Asus ZenBook Flip 15 UX563FD-A1027T | i7-10510U | GeForce GTX 1050 Max-Q 1329 / 1752 MHz 4 GB | 16 GB | 4476 |
| Model | CPU | GPU | RAM | Value |
|---|---|---|---|---|
| Dynabook Portege A30-E-174 | i5-8550U | UHD Graphics 620 1150 / 1200 MHz | 16 GB | 3141 |
| Model | CPU | GPU | RAM | Value |
|---|---|---|---|---|
| Medion Akoya S6625 | i5-8550U | GeForce 940MX 1189 / 1253 MHz 2 GB | 8 GB | 4555 |
| Asus ZenBook 13 UX331UN | i5-8550U | GeForce MX150 1607 / 1253 MHz 2 GB | 8 GB | 4700 |
| Xiaomi Mi Notebook Pro i7 | i5-8550U | GeForce MX150 1341 / 1253 MHz 2 GB | 16 GB | 4797 |
| Acer Swift 3 SF314-52G-89SL | i5-8550U | GeForce MX150 1797 / 1502 MHz 2 GB | 8 GB | 4813 |
| HP Envy 13-ah0003ng | i5-8550U | GeForce MX150 1038 / 1253 MHz 2 GB | 16 GB | 4842 |
| Lenovo Yoga 730-15IKB | i5-8550U | GeForce GTX 1050 Mobile 1493 / 1752 MHz 4 GB | 16 GB | 4900 |
| Lenovo Yoga 720-13IKB | i5-8550U | UHD Graphics 620 1150 MHz | 8 GB | 4942 |
| Lenovo ThinkPad X380 Yoga 20LJS02W00 | i5-8550U | UHD Graphics 620 1150 MHz | 16 GB | 4944 |
| Dynabook Portege A30-E-174 | i5-8550U | UHD Graphics 620 1150 / 1200 MHz | 16 GB | 4975 |
| Lenovo Miix 520-12IKB 20M3000LGE | i5-8550U | UHD Graphics 620 1150 MHz | 16 GB | 4977 |
| HP EliteBook 840 G5-3JX61EA | i5-8550U | UHD Graphics 620 1150 MHz | 32 GB | 4997 |
| Model | CPU | GPU | RAM | Value |
|---|---|---|---|---|
| Lenovo Yoga 720-13IKB | i5-8550U | UHD Graphics 620 1150 MHz | 8 GB | 10869 |
| Lenovo ThinkPad X380 Yoga 20LJS02W00 | i5-8550U | UHD Graphics 620 1150 MHz | 16 GB | 11870 |
| Lenovo Miix 520-12IKB 20M3000LGE | i5-8550U | UHD Graphics 620 1150 MHz | 16 GB | 13622 |
| Asus ZenBook 13 UX331UN | i5-8550U | GeForce MX150 1607 / 1253 MHz 2 GB | 8 GB | 13897 |
| Medion Akoya S6625 | i5-8550U | GeForce 940MX 1189 / 1253 MHz 2 GB | 8 GB | 13992 |
| Acer Swift 3 SF314-52G-89SL | i5-8550U | GeForce MX150 1797 / 1502 MHz 2 GB | 8 GB | 15117 |
| Dynabook Portege A30-E-174 | i5-8550U | UHD Graphics 620 1150 / 1200 MHz | 16 GB | 15155 |
| HP Envy 13-ah0003ng | i5-8550U | GeForce MX150 1038 / 1253 MHz 2 GB | 16 GB | 15166 |
| Lenovo Yoga 730-15IKB | i5-8550U | GeForce GTX 1050 Mobile 1493 / 1752 MHz 4 GB | 16 GB | 15196 |
| Xiaomi Mi Notebook Pro i7 | i5-8550U | GeForce MX150 1341 / 1253 MHz 2 GB | 16 GB | 15538 |
| HP EliteBook 840 G5-3JX61EA | i5-8550U | UHD Graphics 620 1150 MHz | 32 GB | 16294 |
| Model | CPU | GPU | RAM | Value |
|---|---|---|---|---|
| Medion Akoya S6625 | i5-8550U | GeForce 940MX 1189 / 1253 MHz 2 GB | 8 GB | 4439 |
| Lenovo Yoga 720-13IKB | i5-8550U | UHD Graphics 620 1150 MHz | 8 GB | 4523 |
| Asus ZenBook 13 UX331UN | i5-8550U | GeForce MX150 1607 / 1253 MHz 2 GB | 8 GB | 4569 |
| HP Envy 13-ah0003ng | i5-8550U | GeForce MX150 1038 / 1253 MHz 2 GB | 16 GB | 4684 |
| Acer Swift 3 SF314-52G-89SL | i5-8550U | GeForce MX150 1797 / 1502 MHz 2 GB | 8 GB | 4699 |
| Lenovo Yoga 730-15IKB | i5-8550U | GeForce GTX 1050 Mobile 1493 / 1752 MHz 4 GB | 16 GB | 4792 |
| HP EliteBook 840 G5-3JX61EA | i5-8550U | UHD Graphics 620 1150 MHz | 32 GB | 4801 |
| Lenovo ThinkPad X380 Yoga 20LJS02W00 | i5-8550U | UHD Graphics 620 1150 MHz | 16 GB | 4805 |
| Lenovo Miix 520-12IKB 20M3000LGE | i5-8550U | UHD Graphics 620 1150 MHz | 16 GB | 4858 |
| Model | CPU | GPU | RAM | Value |
|---|---|---|---|---|
| Lenovo Yoga 720-13IKB | i5-8550U | UHD Graphics 620 1150 MHz | 8 GB | 10747 |
| Lenovo ThinkPad X380 Yoga 20LJS02W00 | i5-8550U | UHD Graphics 620 1150 MHz | 16 GB | 11350 |
| Lenovo Miix 520-12IKB 20M3000LGE | i5-8550U | UHD Graphics 620 1150 MHz | 16 GB | 13014 |
| Medion Akoya S6625 | i5-8550U | GeForce 940MX 1189 / 1253 MHz 2 GB | 8 GB | 13077 |
| Asus ZenBook 13 UX331UN | i5-8550U | GeForce MX150 1607 / 1253 MHz 2 GB | 8 GB | 13251 |
| Acer Swift 3 SF314-52G-89SL | i5-8550U | GeForce MX150 1797 / 1502 MHz 2 GB | 8 GB | 14257 |
| HP Envy 13-ah0003ng | i5-8550U | GeForce MX150 1038 / 1253 MHz 2 GB | 16 GB | 14332 |
| Lenovo Yoga 730-15IKB | i5-8550U | GeForce GTX 1050 Mobile 1493 / 1752 MHz 4 GB | 16 GB | 14519 |
| HP EliteBook 840 G5-3JX61EA | i5-8550U | UHD Graphics 620 1150 MHz | 32 GB | 15294 |
| Model | CPU | GPU | RAM | Value |
|---|---|---|---|---|
| Asus ZenBook 15 UX534FTC-A8190T | i7-10510U | GeForce GTX 1650 Max-Q 1245 / 1751 MHz 4 GB | 16 GB | 16742 |
| Asus ZenBook Flip 15 UX563FD-A1027T | i7-10510U | GeForce GTX 1050 Max-Q 1329 / 1752 MHz 4 GB | 16 GB | 16838 |
| Model | CPU | GPU | RAM | Value |
|---|---|---|---|---|
| Lenovo Yoga 720-13IKB | i5-8550U | UHD Graphics 620 1150 MHz | 8 GB | 8918 |
| Lenovo ThinkPad X380 Yoga 20LJS02W00 | i5-8550U | UHD Graphics 620 1150 MHz | 16 GB | 10917 |
| Tuxedo InfinityBook Pro 13 2017 | i5-8550U | UHD Graphics 620 | 32 GB | 11452 |
| Medion Akoya S6625 | i5-8550U | GeForce 940MX 1189 / 1253 MHz 2 GB | 8 GB | 11701 |
| HP Envy 13-ah0003ng | i5-8550U | GeForce MX150 1038 / 1253 MHz 2 GB | 16 GB | 11795 |
| Dynabook Portege A30-E-174 | i5-8550U | UHD Graphics 620 1150 / 1200 MHz | 16 GB | 12132 |
| Lenovo Miix 520-12IKB 20M3000LGE | i5-8550U | UHD Graphics 620 1150 MHz | 16 GB | 12523 |
| Asus ZenBook 13 UX331UN | i5-8550U | GeForce MX150 1607 / 1253 MHz 2 GB | 8 GB | 13194 |
| Acer Swift 3 SF314-52G-89SL | i5-8550U | GeForce MX150 1797 / 1502 MHz 2 GB | 8 GB | 13525 |
| Acer Aspire 5 A517-51G-80L | i5-8550U | GeForce MX150 1532 / 6000 MHz 2 GB | 8 GB | 13547 |
| HP EliteBook 840 G5-3JX61EA | i5-8550U | UHD Graphics 620 1150 MHz | 32 GB | 13931 |
| Lenovo Yoga 730-15IKB | i5-8550U | GeForce GTX 1050 Mobile 1493 / 1752 MHz 4 GB | 16 GB | 14144 |
| Model | CPU | GPU | RAM | Value |
|---|---|---|---|---|
| Asus ZenBook 15 UX534FTC-A8190T | i7-10510U | GeForce GTX 1650 Max-Q 1245 / 1751 MHz 4 GB | 16 GB | 4369 |
| Asus ZenBook Flip 15 UX563FD-A1027T | i7-10510U | GeForce GTX 1050 Max-Q 1329 / 1752 MHz 4 GB | 16 GB | 4485 |
| Model | CPU | GPU | RAM | Value |
|---|---|---|---|---|
| Lenovo Yoga 720-13IKB | i5-8550U | UHD Graphics 620 1150 MHz | 8 GB | 2471 |
| Medion Akoya S6625 | i5-8550U | GeForce 940MX 1189 / 1253 MHz 2 GB | 8 GB | 3497 |
| HP Envy 13-ah0003ng | i5-8550U | GeForce MX150 1038 / 1253 MHz 2 GB | 16 GB | 3520 |
| Acer Aspire 5 A517-51G-80L | i5-8550U | GeForce MX150 1532 / 6000 MHz 2 GB | 8 GB | 3622 |
| Lenovo ThinkPad X380 Yoga 20LJS02W00 | i5-8550U | UHD Graphics 620 1150 MHz | 16 GB | 3759 |
| Dynabook Portege A30-E-174 | i5-8550U | UHD Graphics 620 1150 / 1200 MHz | 16 GB | 3761 |
| Acer Swift 3 SF314-52G-89SL | i5-8550U | GeForce MX150 1797 / 1502 MHz 2 GB | 8 GB | 3779 |
| Asus ZenBook 13 UX331UN | i5-8550U | GeForce MX150 1607 / 1253 MHz 2 GB | 8 GB | 3871 |
| Lenovo Miix 520-12IKB 20M3000LGE | i5-8550U | UHD Graphics 620 1150 MHz | 16 GB | 3875 |
| Lenovo Yoga 730-15IKB | i5-8550U | GeForce GTX 1050 Mobile 1493 / 1752 MHz 4 GB | 16 GB | 3933 |
| Tuxedo InfinityBook Pro 13 2017 | i5-8550U | UHD Graphics 620 | 32 GB | 3943 |
| HP EliteBook 840 G5-3JX61EA | i5-8550U | UHD Graphics 620 1150 MHz | 32 GB | 4020 |
| Model | CPU | GPU | RAM | Value |
|---|---|---|---|---|
| Tuxedo InfinityBook Pro 13 2017 | i5-8550U | UHD Graphics 620 | 32 GB | 11637 |
| Acer Aspire 5 A517-51G-80L | i5-8550U | GeForce MX150 1532 / 6000 MHz 2 GB | 8 GB | 14030 |
| Model | CPU | GPU | RAM | Value |
|---|---|---|---|---|
| Acer Aspire 5 A517-51G-80L | i5-8550U | GeForce MX150 1532 / 6000 MHz 2 GB | 8 GB | 3784 |
| Tuxedo InfinityBook Pro 13 2017 | i5-8550U | UHD Graphics 620 | 32 GB | 4113 |
| CPU TDP ? | TDP 24 W | TDP 25 W | TDP 32 W |
|---|---|---|---|
| 100% | 100% | 100% | 100% |
| Model | CPU | GPU | RAM | Value |
|---|---|---|---|---|
| Microsoft Surface Book 2 | i7-8650U | GeForce GTX 1050 Mobile 1493 / 1752 MHz 2 GB Edge 41.16299.15.0 | 8 GB | 809 |
| Dell Latitude 7390 | i7-8650U | UHD Graphics 620 1150 MHz Microsoft Edge 42.17134.1.0 | 8 GB | 988 |
| Dell Latitude 5490 | i7-8650U | UHD Graphics 620 1150 MHz Toshiba Exceria Pro SDXC 64 GB UHS-II | 8 GB | 998 |
| Dell Latitude 7424 Rugged Extreme | i7-8650U | Radeon RX 540 1176 / 1500 MHz 4 GB Microsoft Edge 42.17134.1.0 | 16 GB | 1060 |
| HP Elitebook x360 1040 G5 | i7-8650U | UHD Graphics 620 300 / 1200 MHz Edge 42.17134.1.0 | 16 GB | 1075 |
| Dell Latitude 5420 Rugged-P85G | i7-8650U | Radeon RX 540 1176 / 1500 MHz 4 GB | 16 GB | 1078 |
| Fujitsu LifeBook U758 | i7-8650U | UHD Graphics 620 Edge 41.16299.248.0 | 32 GB | 1083 |
| Lenovo ThinkPad T580-20L9001AUS | i7-8650U | UHD Graphics 620 1150 / 1200 MHz Microsoft Edge 42.17134.1.0 | 16 GB | 1083 |
| Microsoft Surface Pro 6, Core i7, 512 GB | i7-8650U | UHD Graphics 620 1150 / 933 MHz | 16 GB | 1177 |
| HP ZBook x2 G4-3KK88AA | i7-8650U | Quadro M620 1018 / 1253 MHz 2 GB Edge 42.17134.1.0 | 32 GB | 1912 |
| CPU TDP ? | TDP 24 W | TDP 25 W | TDP 32 W |
|---|---|---|---|
| 100% | 100% | 100% | 100% |
| CPU TDP ? | TDP 15 W | TDP 24 W | TDP 25 W | TDP 32 W |
|---|---|---|---|---|
| 100% | 100% | 100% | 100% | 100% |
| Model | CPU | GPU | RAM | Value |
|---|---|---|---|---|
| Microsoft Surface Book 2 | i7-8650U | GeForce GTX 1050 Mobile 1493 / 1752 MHz 2 GB Edge 41.16299.15.0 | 8 GB | 63.8 |
| Dell Latitude 7390 2-in-1 | i7-8650U | UHD Graphics 620 1150 / 1067 MHz Microsoft Edge 41.16299.248.0 | 16 GB | 67.6 |
| Dell Latitude 7390 | i7-8650U | UHD Graphics 620 1150 MHz Microsoft Edge 42.17134.1.0 | 8 GB | 74.3 |
| Dell Latitude 5490 | i7-8650U | UHD Graphics 620 1150 MHz Toshiba Exceria Pro SDXC 64 GB UHS-II | 8 GB | 74.5 |
| Dell Latitude 7424 Rugged Extreme | i7-8650U | Radeon RX 540 1176 / 1500 MHz 4 GB Microsoft Edge 42.17134.1.0 | 16 GB | 81.9 |
| Dell Latitude 5420 Rugged-P85G | i7-8650U | Radeon RX 540 1176 / 1500 MHz 4 GB | 16 GB | 83.1 |
| CPU TDP ? | TDP 25 W |
|---|---|
| 79% | 100% |
| Model | CPU | GPU | RAM | Value |
|---|---|---|---|---|
| HP ZBook x2 G4-3KK88AA | i7-8650U | Quadro M620 1018 / 1253 MHz 2 GB Edge 42.17134.1.0 | 32 GB | 11491 |
| HP Elitebook x360 1040 G5 | i7-8650U | UHD Graphics 620 300 / 1200 MHz Edge 42.17134.1.0 | 16 GB | 24785 |
| Fujitsu LifeBook U758 | i7-8650U | UHD Graphics 620 Edge 41.16299.248.0 | 32 GB | 31063 |
| Microsoft Surface Pro 6, Core i7, 512 GB | i7-8650U | UHD Graphics 620 1150 / 933 MHz | 16 GB | 32487 |
| Dell Latitude 5420 Rugged-P85G | i7-8650U | Radeon RX 540 1176 / 1500 MHz 4 GB | 16 GB | 33906 |
| Dell Latitude 7424 Rugged Extreme | i7-8650U | Radeon RX 540 1176 / 1500 MHz 4 GB Microsoft Edge 42.17134.1.0 | 16 GB | 34506 |
| Lenovo ThinkPad T580-20L9001AUS | i7-8650U | UHD Graphics 620 1150 / 1200 MHz Microsoft Edge 42.17134.1.0 | 16 GB | 35114 |
| Dell Latitude 7390 2-in-1 | i7-8650U | UHD Graphics 620 1150 / 1067 MHz Microsoft Edge 41.16299.248.0 | 16 GB | 35895 |
| Microsoft Surface Book 2 | i7-8650U | GeForce GTX 1050 Mobile 1493 / 1752 MHz 2 GB Edge 41.16299.15.0 | 8 GB | 42822 |
| CPU TDP ? | TDP 25 W |
|---|---|
| 73% | 100% |
| CPU TDP ? | TDP 25 W |
|---|---|
| 69% | 100% |
| CPU TDP ? | TDP 24 W | TDP 25 W | TDP 32 W |
|---|---|---|---|
| 95% | 100% | 97% | 97% |
| Model | CPU | GPU | RAM | Value |
|---|---|---|---|---|
| Dell Latitude 7424 Rugged Extreme | i7-8650U | Radeon RX 540 1176 / 1500 MHz 4 GB Microsoft Edge 42.17134.1.0 | 16 GB | 227 |
| CPU TDP ? | TDP 24 W | TDP 25 W | TDP 32 W |
|---|---|---|---|
| 96% | 100% | 97% | 97% |
| Model | CPU | GPU | RAM | Value |
|---|---|---|---|---|
| Kuu LeBook 12.6 Core i7-8550U | i5-8550U 18 W / 15 W | UHD Graphics 620 1067 / 1150 MHz Chrome 82 | 8 GB | 182 |
| CPU TDP ? | TDP 15 W | TDP 24 W | TDP 25 W | TDP 32 W |
|---|---|---|---|---|
| 96% | 83% | 100% | 97% | 97% |
| Model | CPU | GPU | RAM | Value |
|---|---|---|---|---|
| Lenovo Ideapad S540-14IML | i7-10510U 44 W / 24 W | GeForce MX250 1582 / 1750 MHz 2 GB | 12 GB | 1101 |
| Model | CPU | GPU | RAM | Value |
|---|---|---|---|---|
| Acer Aspire 3 A317-51G-72MD | i7-10510U | GeForce MX250 1582 / 1502 MHz 2 GB | 12 GB | 23 |
| Acer TravelMate P6 P614-51T-G2-72ZU | i7-10510U | UHD Graphics 620 1150 MHz | 16 GB | 24.6 |
| HP 470 G7 8VU24EA | i7-10510U | Radeon 530 920 / 1000 MHz 2 GB | 16 GB | 25 |
| Samsung Galaxy Book Ion Aura Silver | i7-10510U 51 W / 24 W | GeForce MX250 | 16 GB | 37 |
| HP Envy 13-ba0001ng | i7-10510U 4900 W / W | GeForce MX350 747 / 1752 MHz 2 GB | 16 GB | 38 |
| Asus VivoBook S14 S433FL | i7-10510U | GeForce MX250 1519 / 1752 MHz 2 GB | 16 GB | 45.8 |
| Xiaomi Mi NoteBook 14 Horizon Edition | i7-10510U 51 W / 32 W | GeForce MX350 1468 / 1752 MHz 2 GB | 8 GB | 46.7 |
| HP Spectre X360 15-5ZV31AV | i7-10510U | GeForce MX250 1519 / 1502 MHz 2 GB | 32 GB | 50 |
| HP Spectre x360 15-eb0010ng | i7-10510U | GeForce MX330 | 50 |
| CPU TDP ? | TDP 24 W | TDP 32 W |
|---|---|---|
| 102% | 102% | 100% |
| Model | CPU | GPU | RAM | Value |
|---|---|---|---|---|
| Kuu LeBook 12.6 Core i7-8550U | i5-8550U 18 W / 15 W | UHD Graphics 620 1067 / 1150 MHz | 8 GB | 25.3 |
| Razer Blade Stealth QHD i7-8550U | i5-8550U @4 GHz | UHD Graphics 620 300 / 350 MHz 1 GB | 16 GB | @4 GHz 31.6 |
| Xiaomi Mi Notebook Pro i7 | i5-8550U | GeForce MX150 1341 / 1253 MHz 2 GB | 16 GB | 33.7 |
| Lenovo ThinkPad T580-20LAS01H00 | i5-8550U | GeForce MX150 1532 / 1502 MHz 2 GB | 8 GB | 61.4 |
| CPU TDP ? | TDP 15 W | TDP 24 W | TDP 32 W |
|---|---|---|---|
| 102% | 104% | 102% | 100% |
| Model | CPU | GPU | RAM | Value |
|---|---|---|---|---|
| HP 470 G7 8VU24EA | i7-10510U | Radeon 530 920 / 1000 MHz 2 GB | 16 GB | 25.5 |
| Acer Aspire 3 A317-51G-72MD | i7-10510U | GeForce MX250 1582 / 1502 MHz 2 GB | 12 GB | 28.5 |
| Acer TravelMate P6 P614-51T-G2-72ZU | i7-10510U | UHD Graphics 620 1150 MHz | 16 GB | 32.4 |
| HP Envy 13-ba0001ng | i7-10510U 4900 W / W | GeForce MX350 747 / 1752 MHz 2 GB | 16 GB | 37.3 |
| Samsung Galaxy Book Ion Aura Silver | i7-10510U 51 W / 24 W | GeForce MX250 | 16 GB | 38.4 |
| Asus VivoBook S14 S433FL | i7-10510U | GeForce MX250 1519 / 1752 MHz 2 GB | 16 GB | 42.8 |
| Xiaomi Mi NoteBook 14 Horizon Edition | i7-10510U 51 W / 32 W | GeForce MX350 1468 / 1752 MHz 2 GB | 8 GB | 44.3 |
| HP Spectre X360 15-5ZV31AV | i7-10510U | GeForce MX250 1519 / 1502 MHz 2 GB | 32 GB | 61 |
| HP Spectre x360 15-eb0010ng | i7-10510U | GeForce MX330 | 61 |
| CPU TDP ? | TDP 24 W | TDP 32 W |
|---|---|---|
| 101% | 101% | 100% |
| Model | CPU | GPU | RAM | Value |
|---|---|---|---|---|
| Kuu LeBook 12.6 Core i7-8550U | i5-8550U 18 W / 15 W | UHD Graphics 620 1067 / 1150 MHz | 8 GB | 28.2 |
| LG Gram 15Z980-B.AA78B | i5-8550U | UHD Graphics 620 | 16 GB | 28.9 |
| Razer Blade Stealth QHD i7-8550U | i5-8550U @4 GHz | UHD Graphics 620 300 / 350 MHz 1 GB | 16 GB | @4 GHz 30.1 |
| Xiaomi Mi Notebook Pro i7 | i5-8550U | GeForce MX150 1341 / 1253 MHz 2 GB | 16 GB | 31.9 |
| Lenovo ThinkPad T580-20LAS01H00 | i5-8550U | GeForce MX150 1532 / 1502 MHz 2 GB | 8 GB | 63.2 |
| CPU TDP ? | TDP 15 W | TDP 24 W | TDP 32 W |
|---|---|---|---|
| 101% | 103% | 101% | 100% |
| Model | CPU | GPU | RAM | Value |
|---|---|---|---|---|
| HP Spectre X360 15-5ZV31AV | i7-10510U | GeForce MX250 1519 / 1502 MHz 2 GB | 32 GB | 8.95 |
| HP Envy 13-ba0001ng | i7-10510U 4900 W / W | GeForce MX350 747 / 1752 MHz 2 GB | 16 GB | 14.5 |
| Asus VivoBook S14 S433FL | i7-10510U | GeForce MX250 1519 / 1752 MHz 2 GB | 16 GB | 15 |
| Xiaomi Mi NoteBook 14 Horizon Edition | i7-10510U 51 W / 32 W | GeForce MX350 1468 / 1752 MHz 2 GB | 8 GB | 16 |
| Samsung Galaxy Book Ion Aura Silver | i7-10510U 51 W / 24 W | GeForce MX250 | 16 GB | 17.9 |
| Acer Aspire 3 A317-51G-72MD | i7-10510U | GeForce MX250 1582 / 1502 MHz 2 GB | 12 GB | 18.8 |
| HP 470 G7 8VU24EA | i7-10510U | Radeon 530 920 / 1000 MHz 2 GB | 16 GB | 20.4 |
| Acer TravelMate P6 P614-51T-G2-72ZU | i7-10510U | UHD Graphics 620 1150 MHz | 16 GB | 22.4 |
| CPU TDP ? | TDP 24 W | TDP 32 W |
|---|---|---|
| 93% | 100% | 89% |
| Model | CPU | GPU | RAM | Value |
|---|---|---|---|---|
| Lenovo ThinkPad T580-20LAS01H00 | i5-8550U | GeForce MX150 1532 / 1502 MHz 2 GB | 8 GB | 10.4 |
| Kuu LeBook 12.6 Core i7-8550U | i5-8550U 18 W / 15 W | UHD Graphics 620 1067 / 1150 MHz | 8 GB | 17 |
| Razer Blade Stealth QHD i7-8550U | i5-8550U @4 GHz | UHD Graphics 620 300 / 350 MHz 1 GB | 16 GB | @4 GHz 17.3 |
| Xiaomi Mi Notebook Pro i7 | i5-8550U | GeForce MX150 1341 / 1253 MHz 2 GB | 16 GB | 17.5 |
| LG Gram 15Z980-B.AA78B | i5-8550U | UHD Graphics 620 | 16 GB | 17.5 |
| CPU TDP ? | TDP 15 W | TDP 24 W | TDP 32 W |
|---|---|---|---|
| 91% | 95% | 100% | 89% |
Average Benchmarks Intel Core i7-10510U → 100% n=20
Average Benchmarks Intel Core i7-8650U → 99% n=20
Average Benchmarks Intel Core i7-8550U → 96% n=20
* Smaller numbers mean a higher performance
1 This benchmark is not used for the average calculation
#0 ran 0s before starting gpusingle class +0s ... 0s
#1 checking url part for id 11457 +0s ... 0s
#2 checking url part for id 9212 +0s ... 0s
#3 checking url part for id 9208 +0s ... 0s
#4 redirected to Ajax server, took 1755349706s time from redirect:0 +0s ... 0s
#5 did not recreate cache, as it is less than 5 days old! Created at Sat, 16 Aug 2025 05:18:17 +0200 +0s ... 0s
#6 composed specs +0.007s ... 0.007s
#7 did output specs +0s ... 0.007s
#8 getting avg benchmarks for device 11457 +0.004s ... 0.011s
#9 got single benchmarks 11457 +0.034s ... 0.045s
#10 getting avg benchmarks for device 9212 +0.001s ... 0.046s
#11 got single benchmarks 9212 +0.01s ... 0.056s
#12 getting avg benchmarks for device 9208 +0.001s ... 0.057s
#13 got single benchmarks 9208 +0.011s ... 0.068s
#14 got avg benchmarks for devices +0s ... 0.068s
#15 min, max, avg, median took s +0.06s ... 0.128s
#16 return log +0s ... 0.128s