Notebookcheck Logo
Zählmarke

Rainbow Six Siege Notebook Benchmarks

Rough diamond. Ubisoft does not follow the casual trend of its own franchise over the last couple of years with Rainbow Six Siege. Instead of stupid non-stop action, the title turns out to be a clever tactical sandbox. We have a closer look at the technology.
Rainbow Six Siege Logo

For the original German article, see here.

Graphics & Benchmark

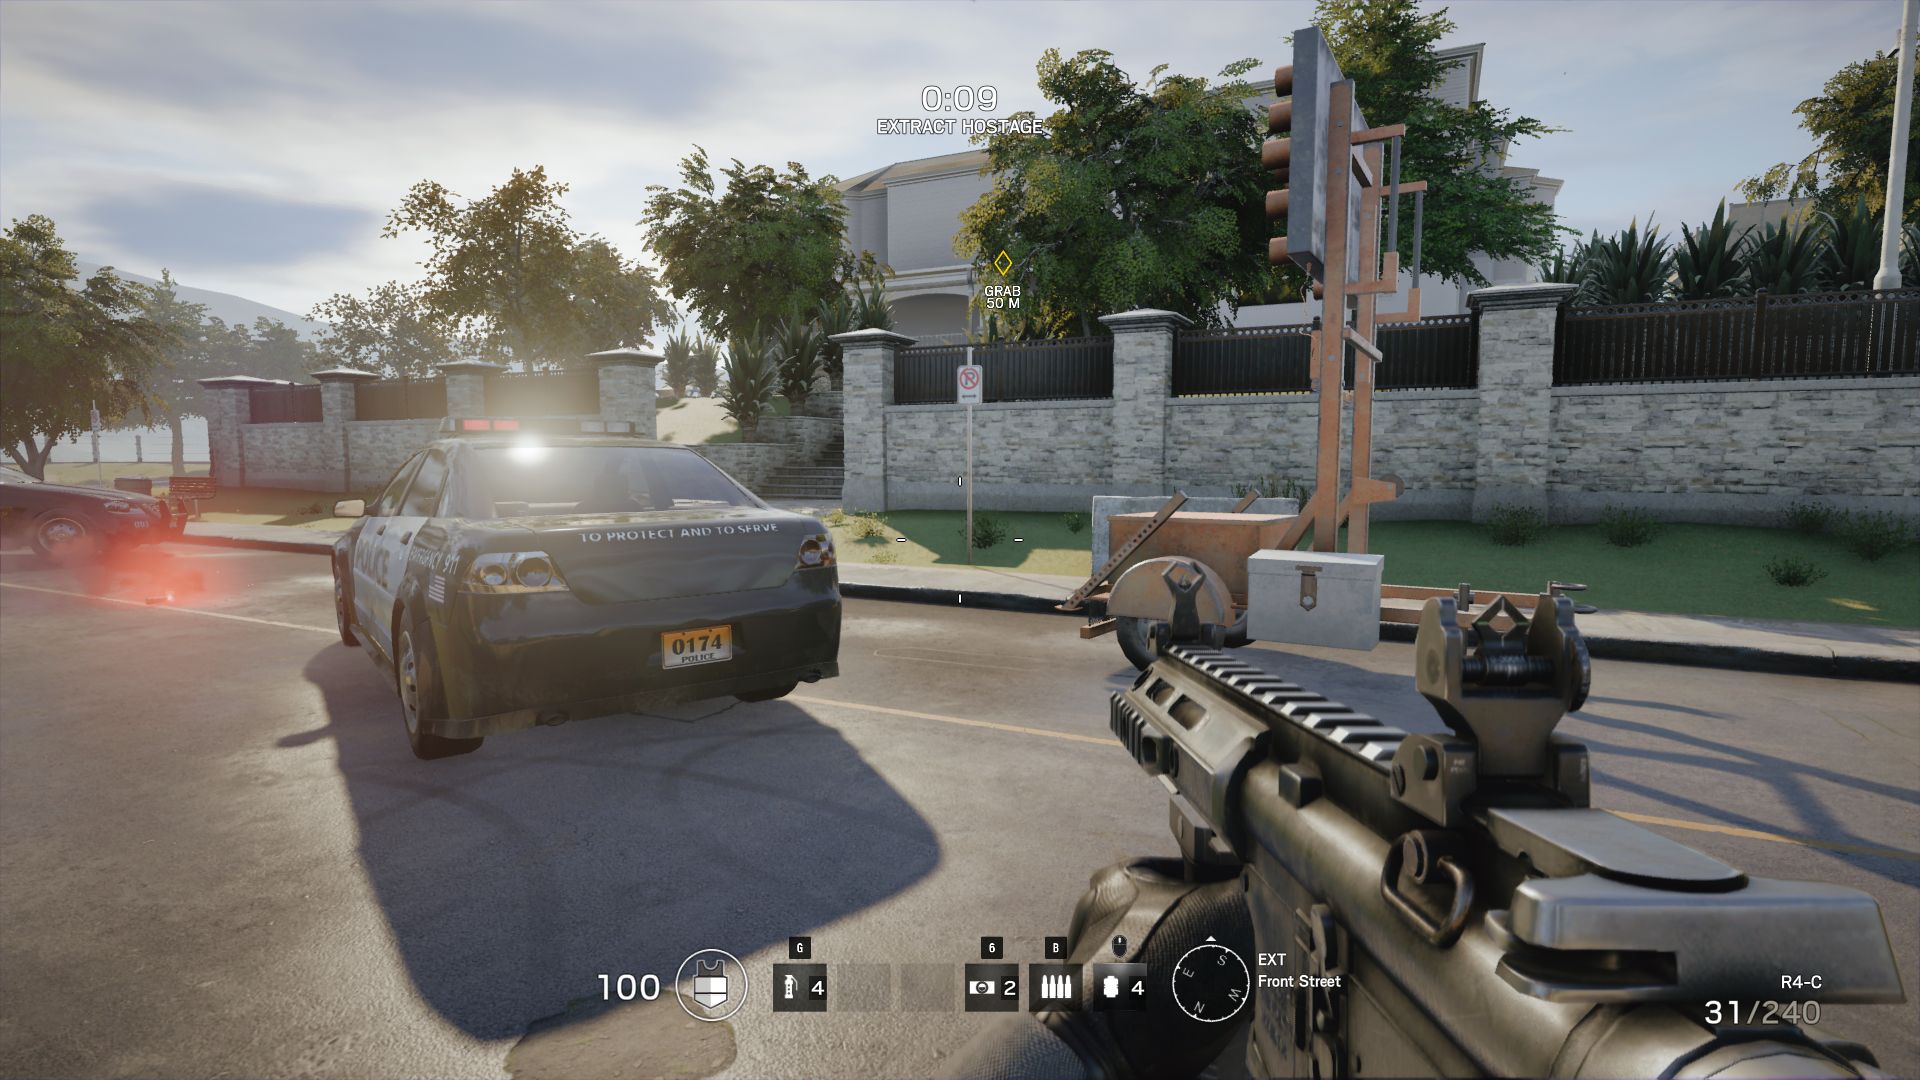
Rainbow Six Siege is the right title if you do not want to play rather simple action blockbuster titles like Call of Duty and Star Wars Battlefront. While other games are basically dominated by firefights, the new game from Ubisoft is rather old-school – in the best way. Running through the levels with the gun and only trusting your aim will soon end your game. Instead, you have to rely on map experience, team communication and tactical decisions, similar to Counter-Strike or the old SWAT series. You can already feel a part of the thrilling atmosphere in the tutorial missions, which only show you the basics of the game.

Rainbow Six Siege
Rainbow Six Siege
Rainbow Six Siege

It is therefore hardly an issue that Ubisoft did not create a graphics masterpiece. Despite or rather because of the second-class graphics of Rainbow Six Siege, the technology appears pretty sophisticated. Some players do complain about typical multiplayer bugs (connection issues etc.), but we did not encounter any serious problems in respect of crashes or graphics bugs. And as a PC gamer, you also get the feeling to be taken seriously. This impression is particularly created by the options menu, which convinces with a lot of explanations.

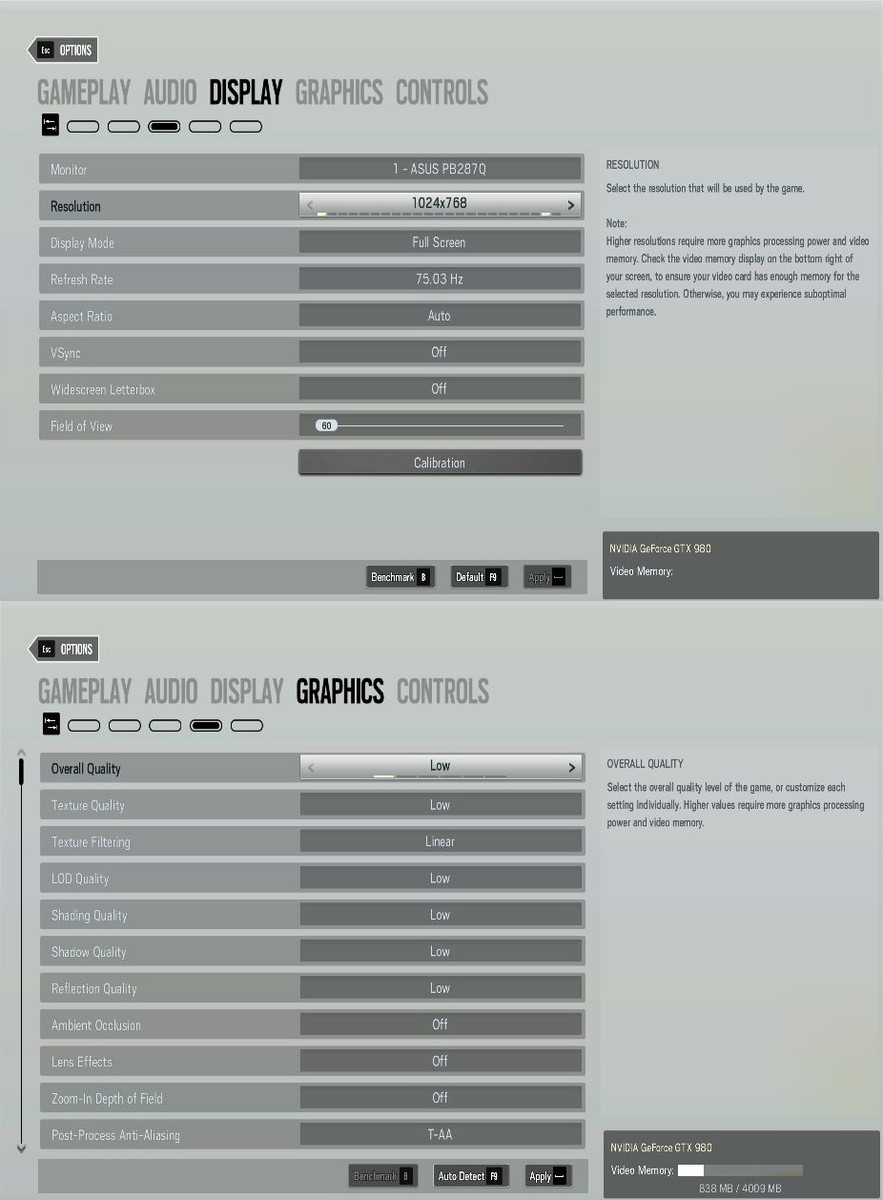
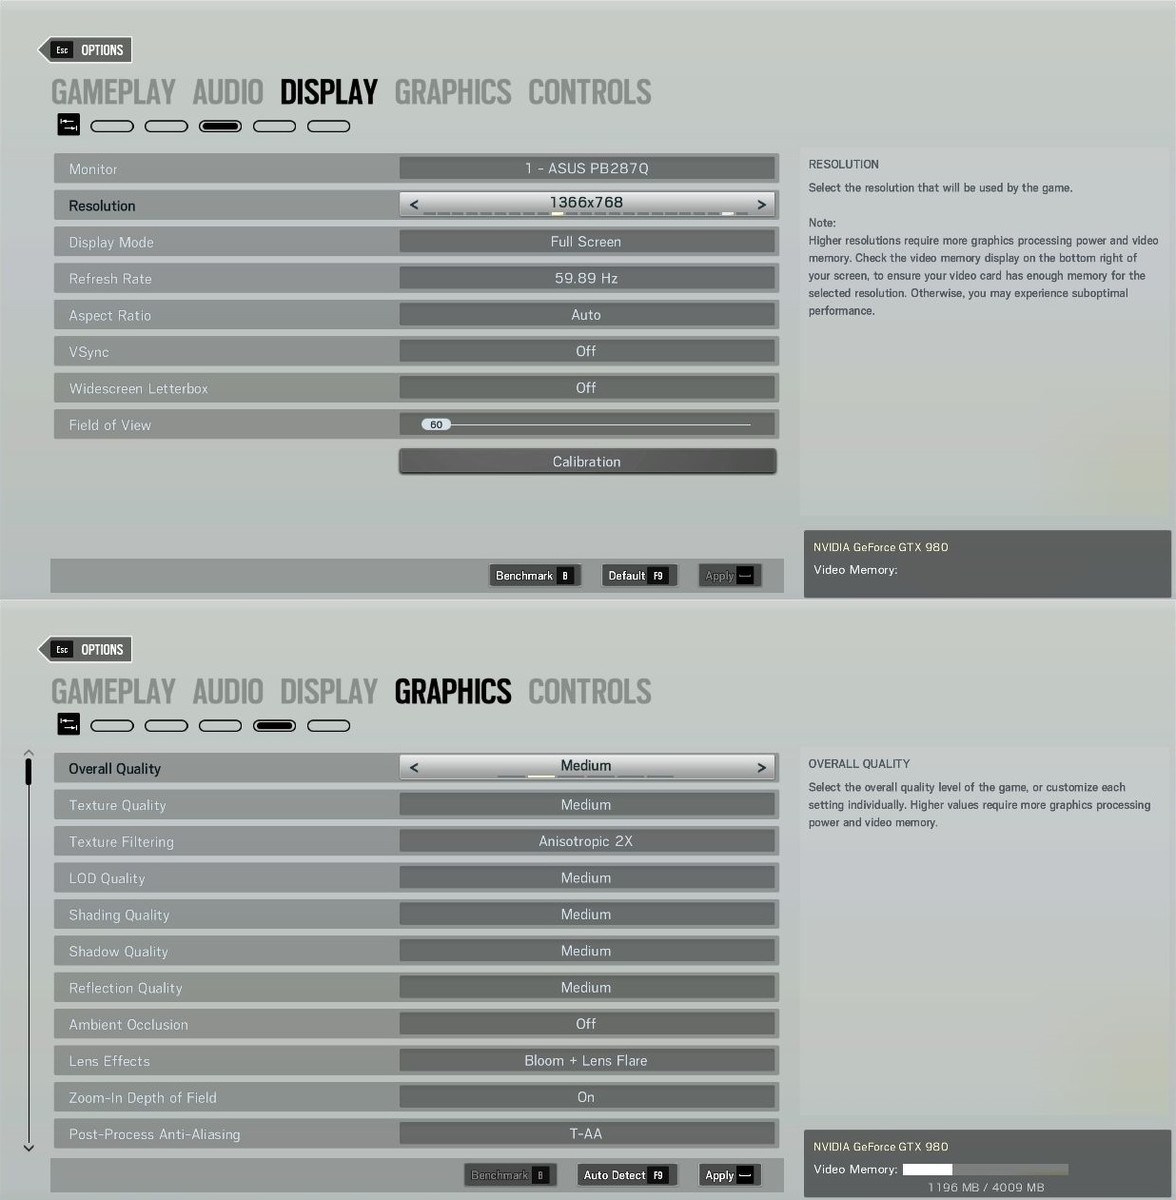
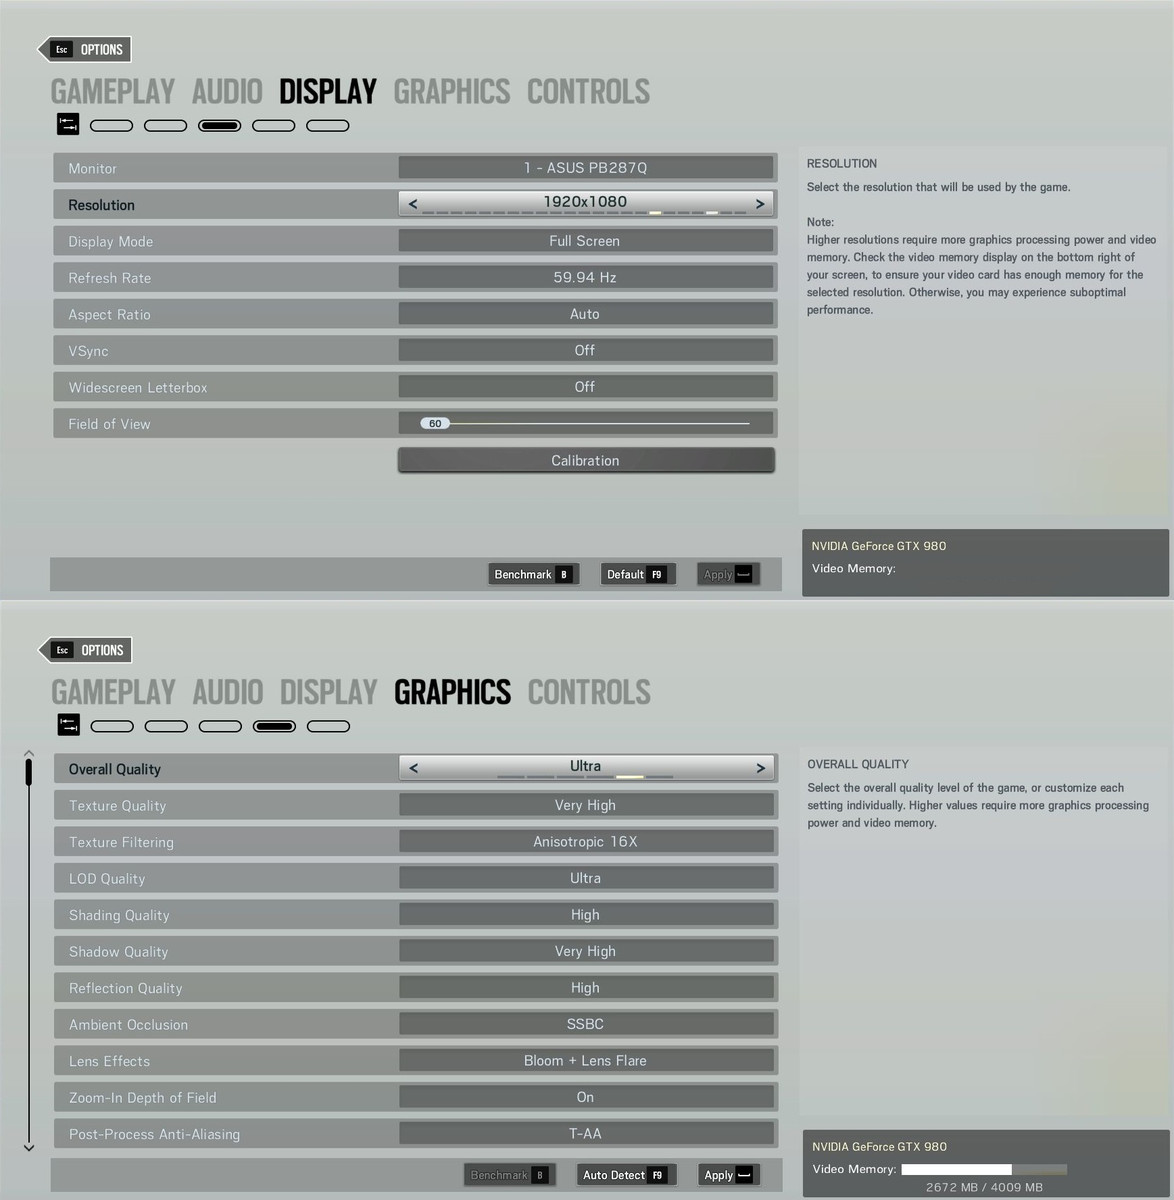
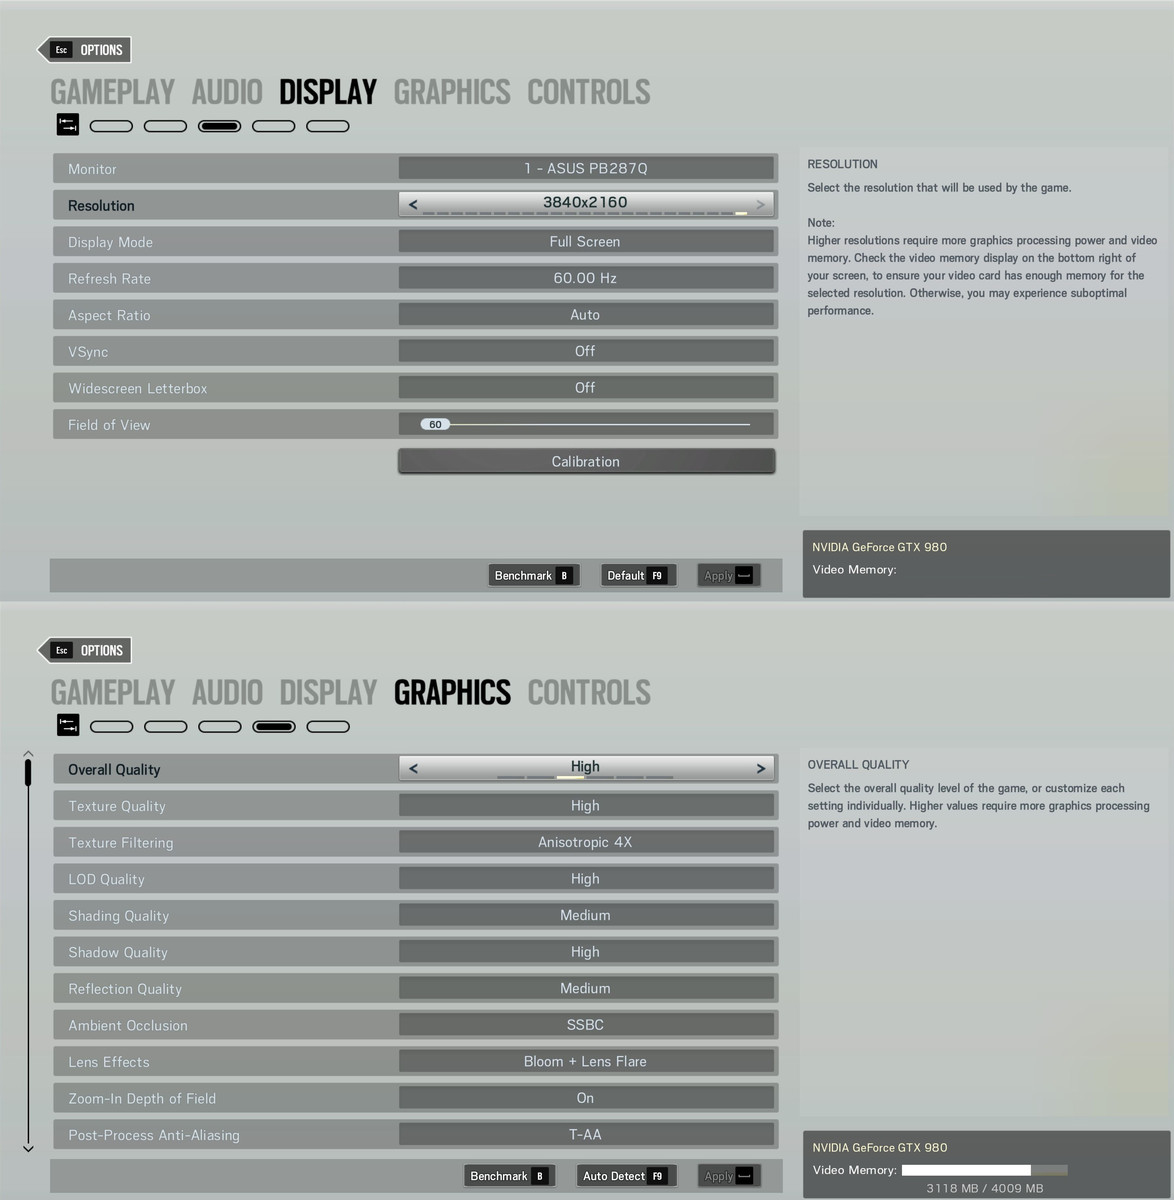
In this article, we only want to have a look at the video options, which are split up into two menus. Basic display settings can be found – as expected – in the Display tab. Besides the resolution, the picture mode, the frequency and the screen ratio, you can also adjust the viewing distance. Vertical sync is available as well. The majority of options is available in the Graphics menu: Almost 10 settings can be adjusted in multiple steps.

Rainbow Six Siege
Rainbow Six Siege
Rainbow Six Siege

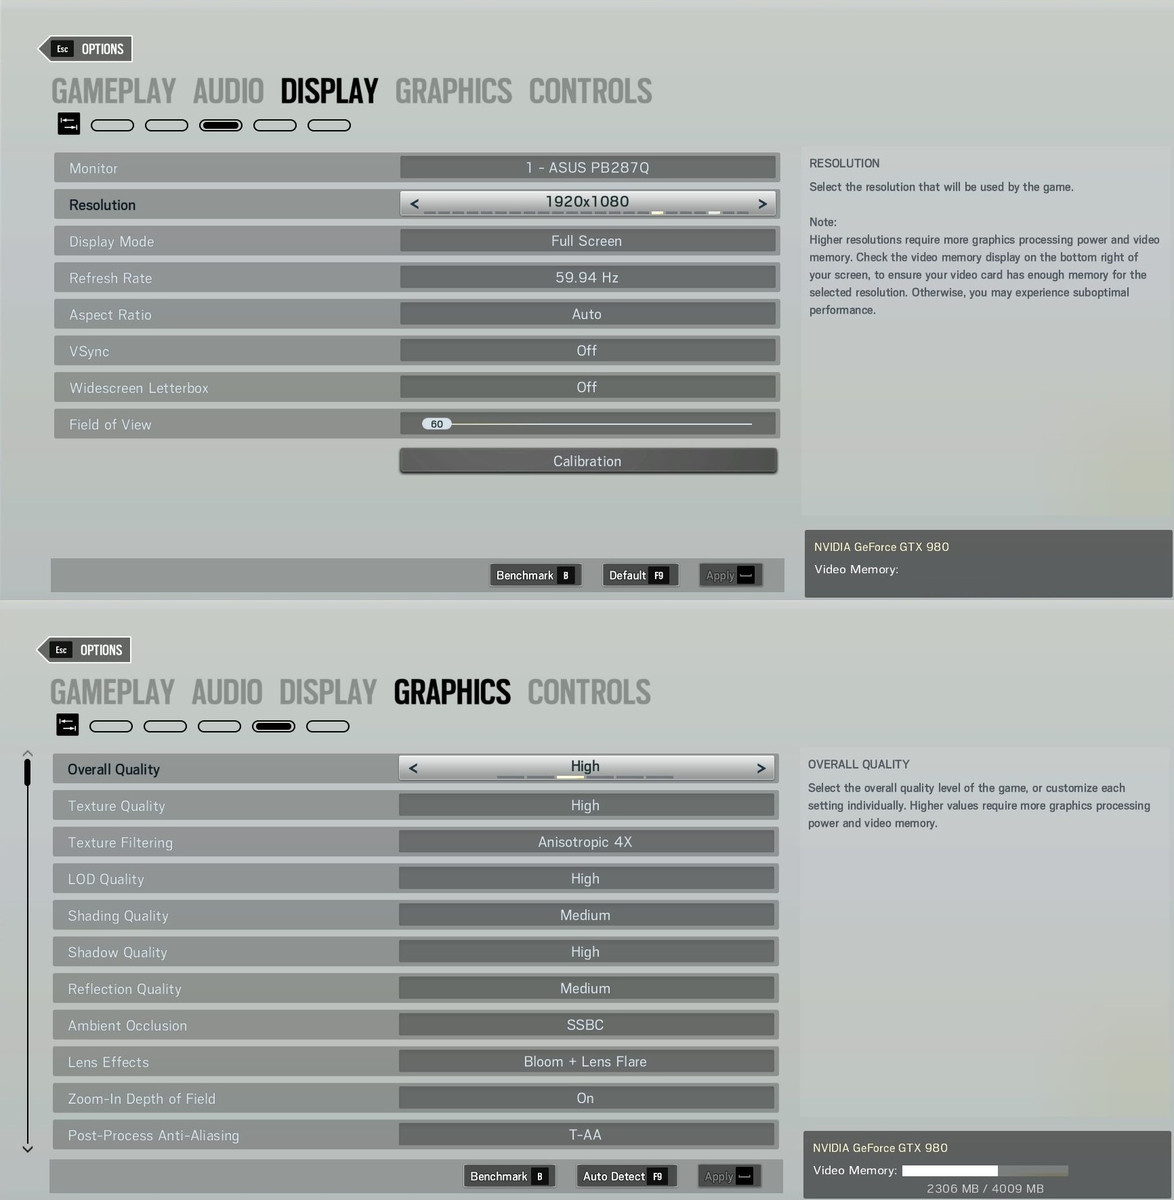
Great: Ubisoft included five presets for lazy or less experienced users that we – except for the preset Very High – also use for our benchmarks, even though the presets are not perfectly adjusted. For example, Rainbow Six does not use the maximum settings all the time in the Ultra preset (only SSBC instead HBAO+). A Medium shading quality in the preset Very High and just 4x AF in the setting High are not perfect, either. Furthermore, the title uses the post-processing anti-aliasing T-AA for every preset (FXAA optional), and we had to activate better versions manually. Siege also supports MSAA and TXAA, but they are much more demanding for the hardware.

Speaking of the performance: Anti-aliasing requires a lot of video memory, and you can get a good feel for the requirements thanks to the integrated VRAM indicator. While 1920 x 1080 pixels and the Ultra preset require around 2.5 GB, it is 3.5 GB for a combination of FHD and 8x MSAA (the same applies for 3840 x 2160 pixels without AA). It gets really extreme when you combine 4K and 8x MSAA: Not many laptop or desktop GPUs can handle 7.5 GB.

Rainbow Six Siege
Rainbow Six Siege
Rainbow Six Siege

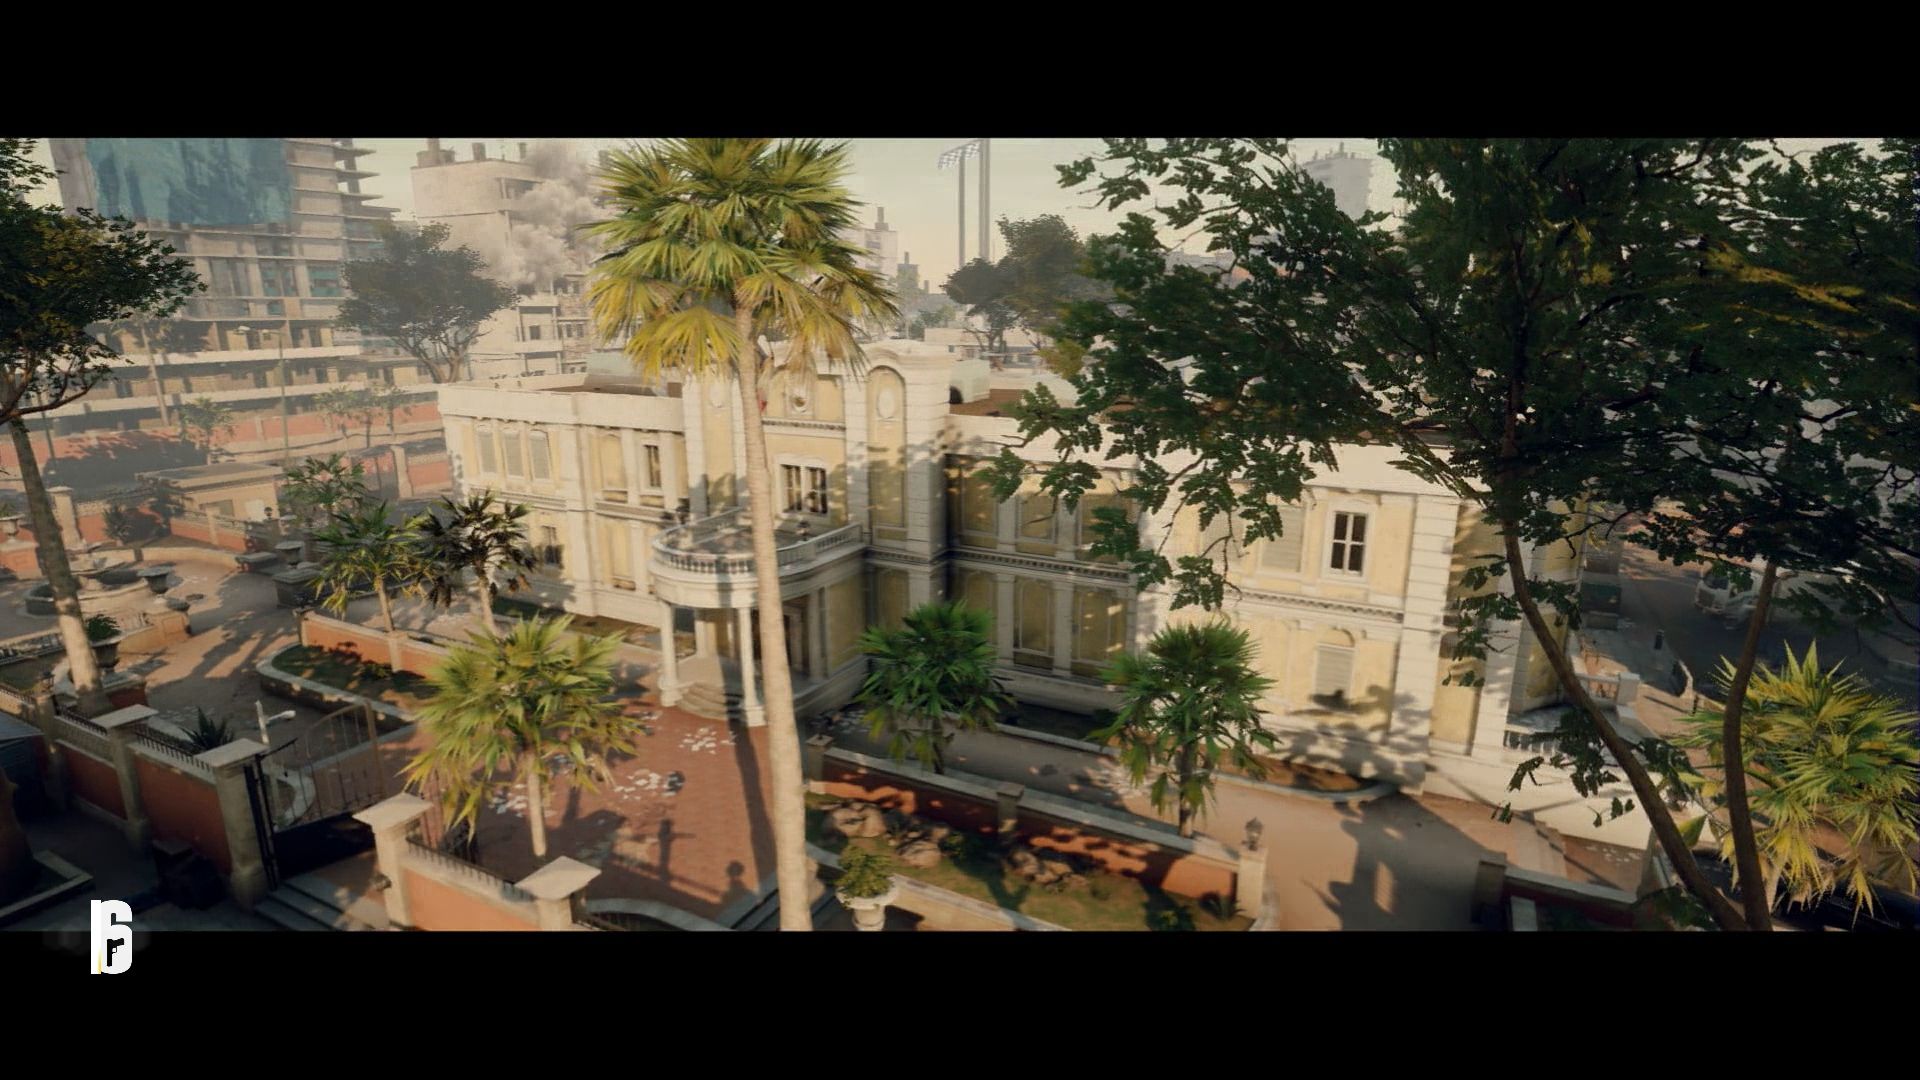
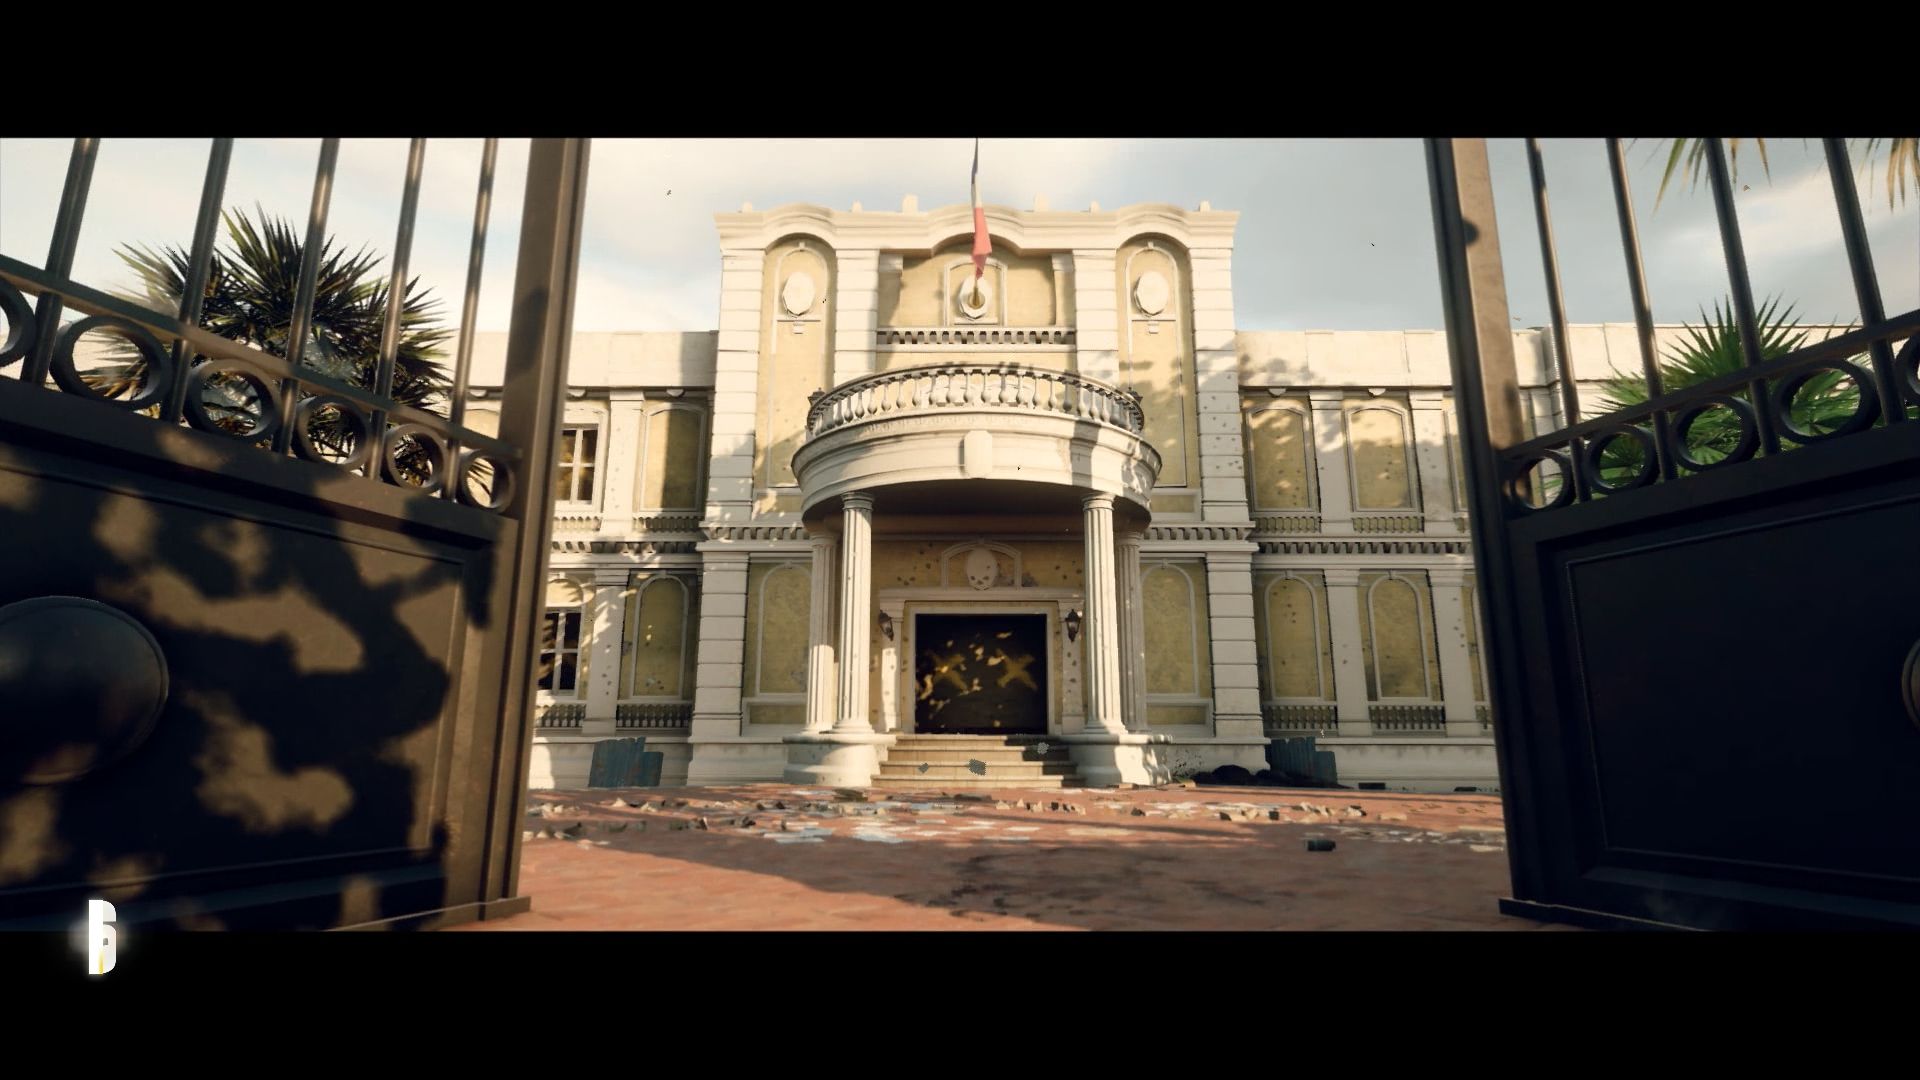
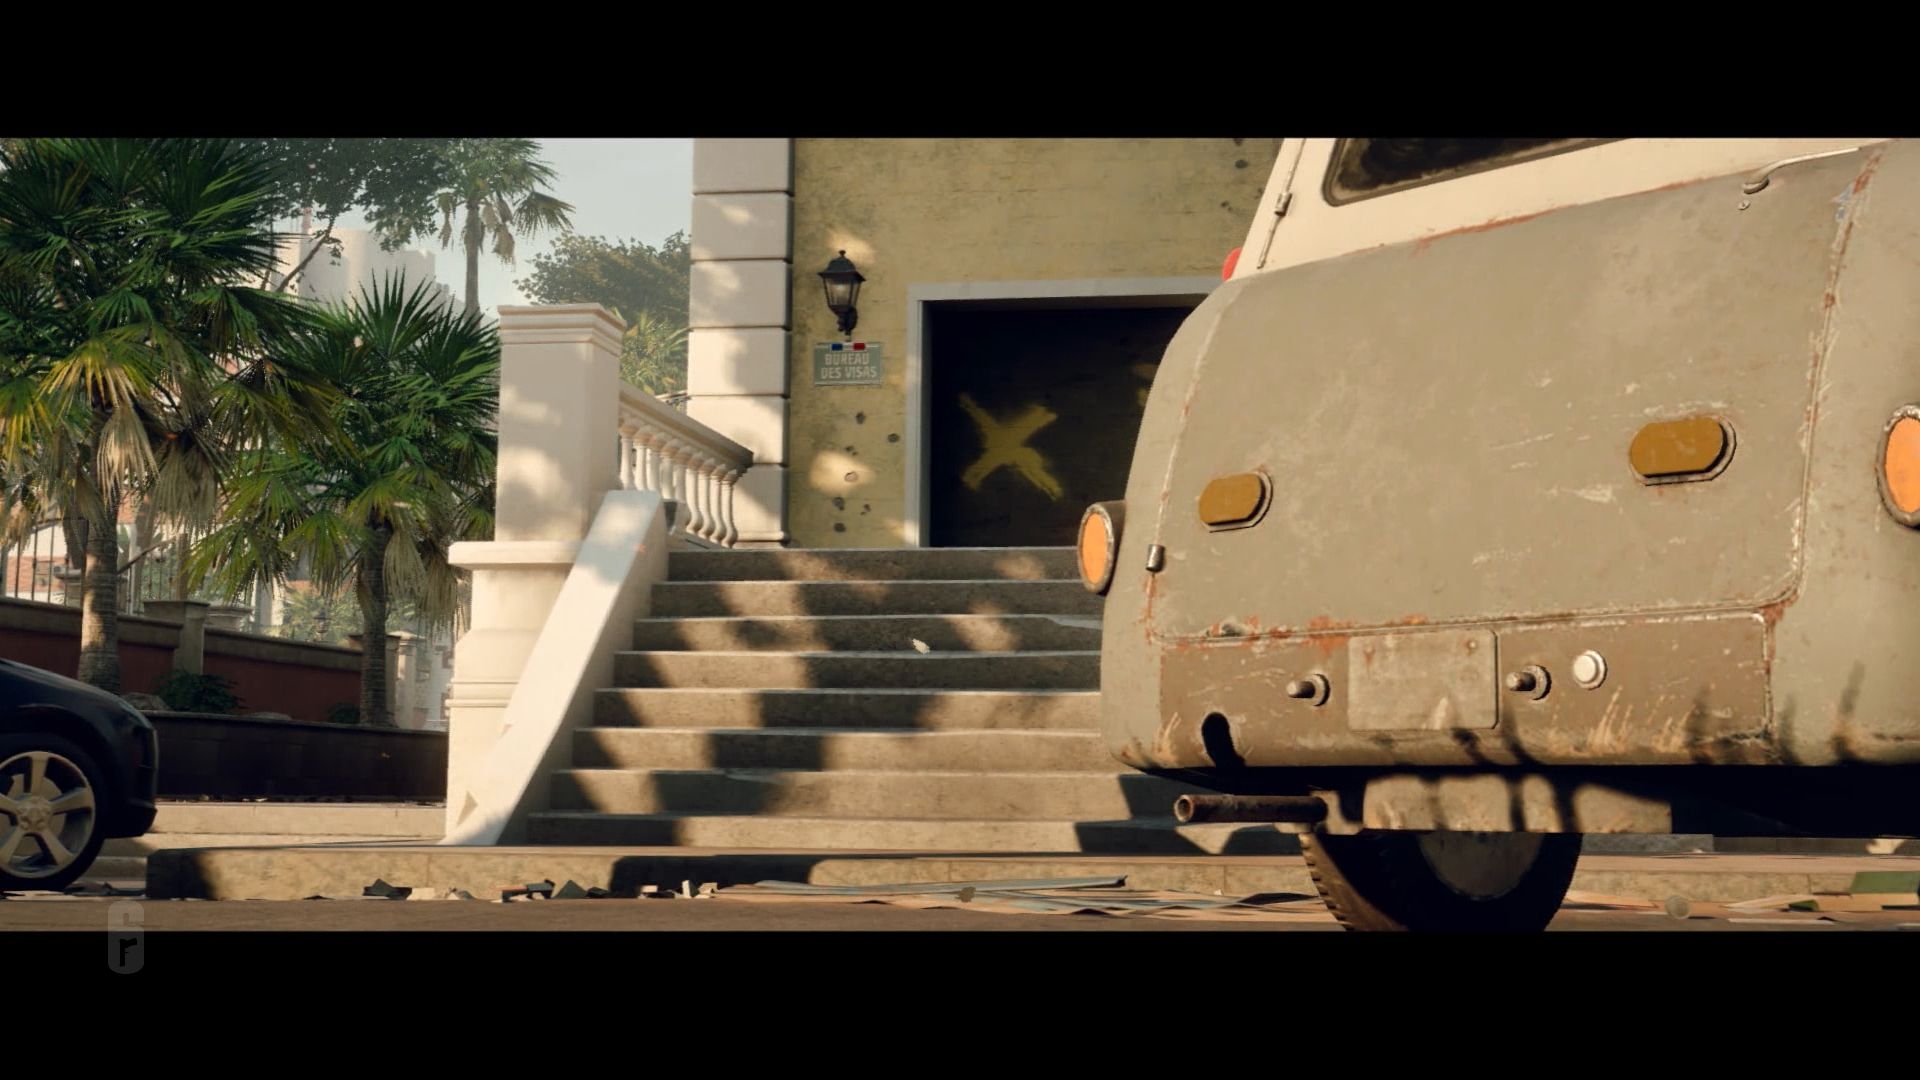
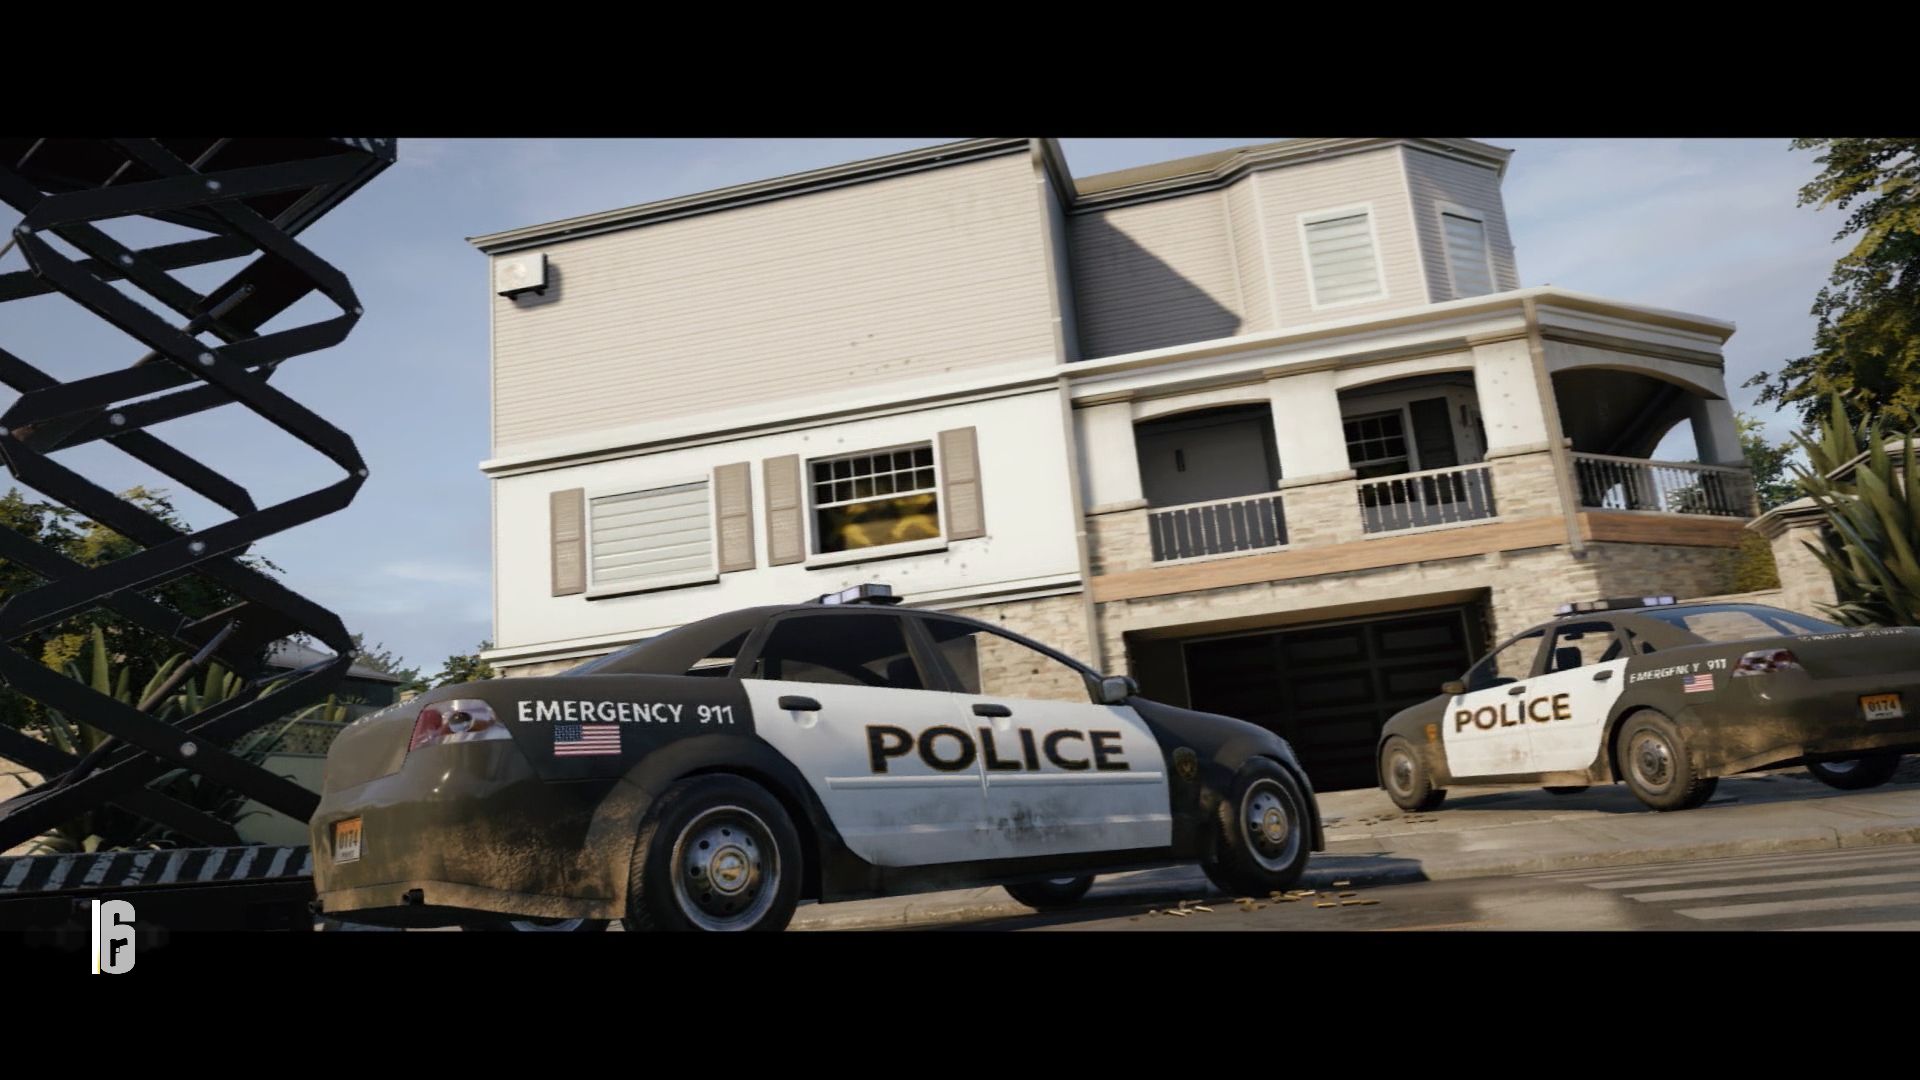
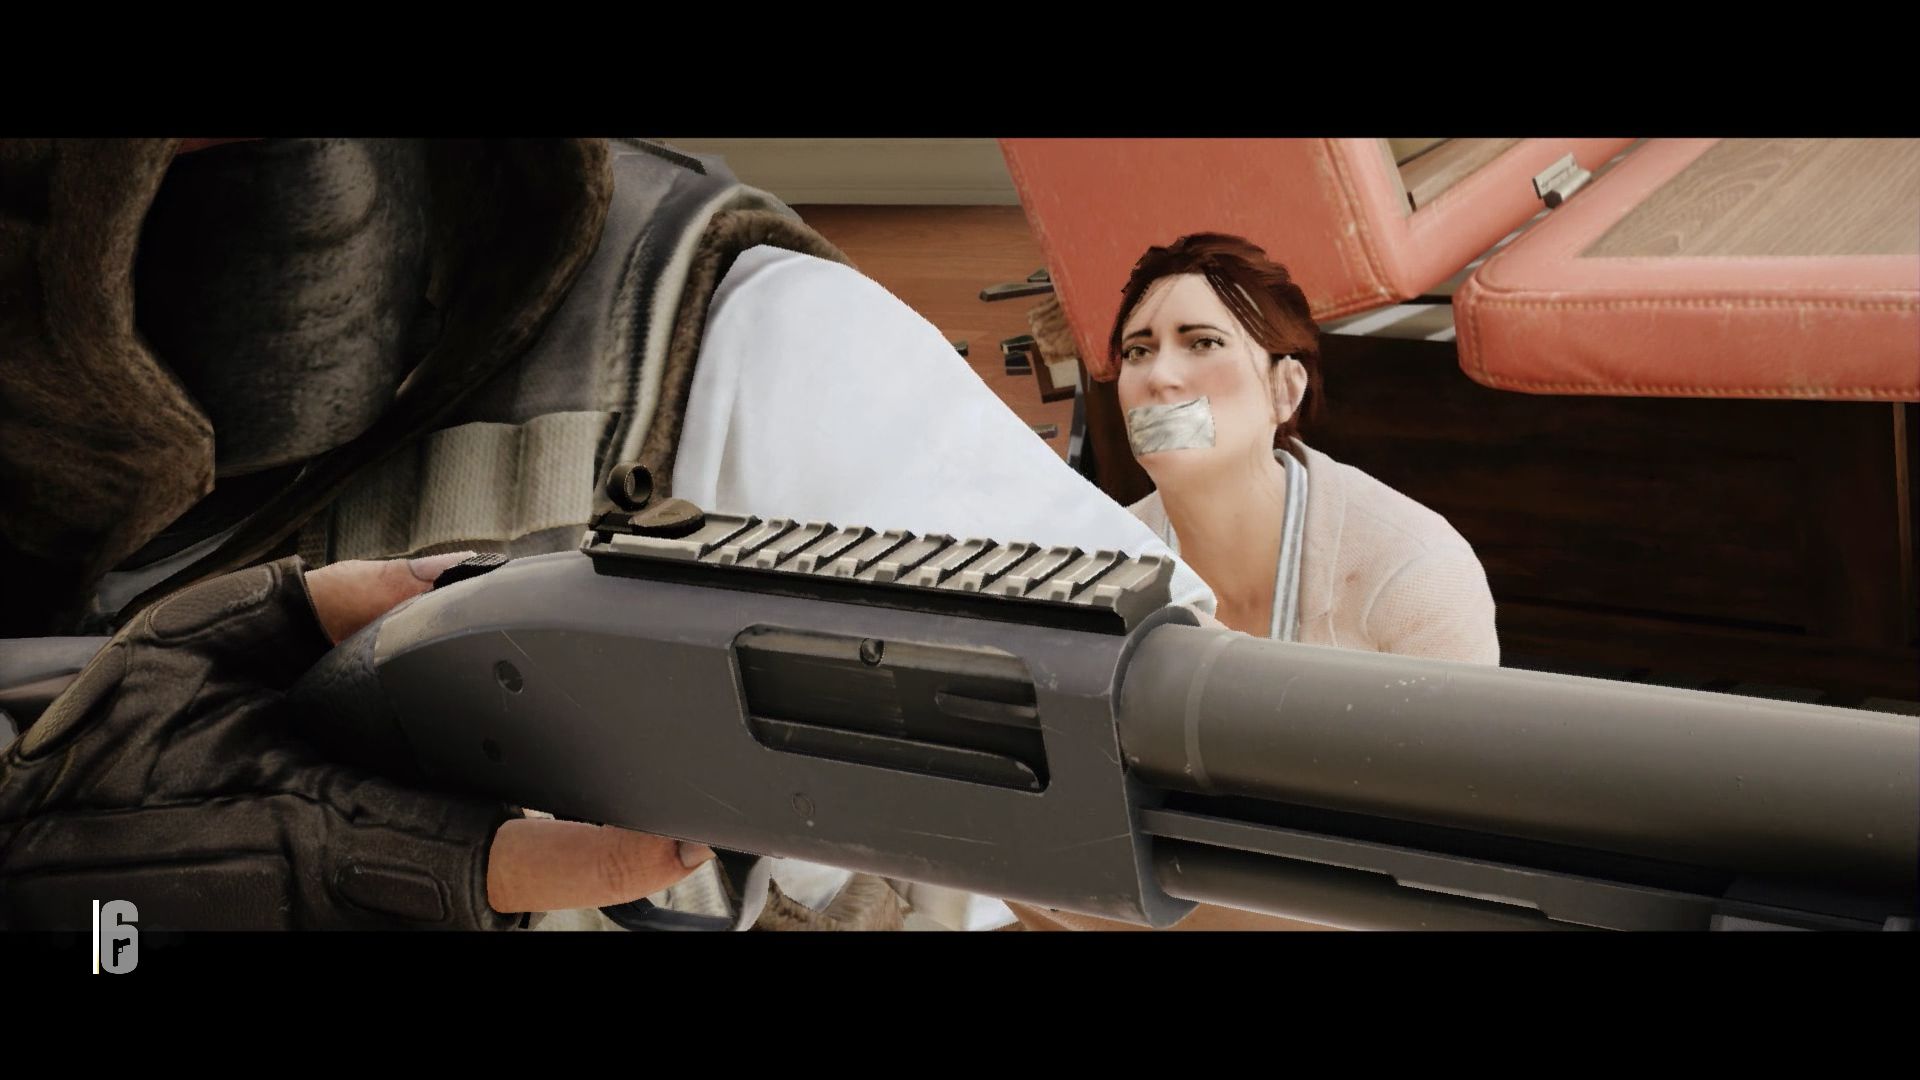
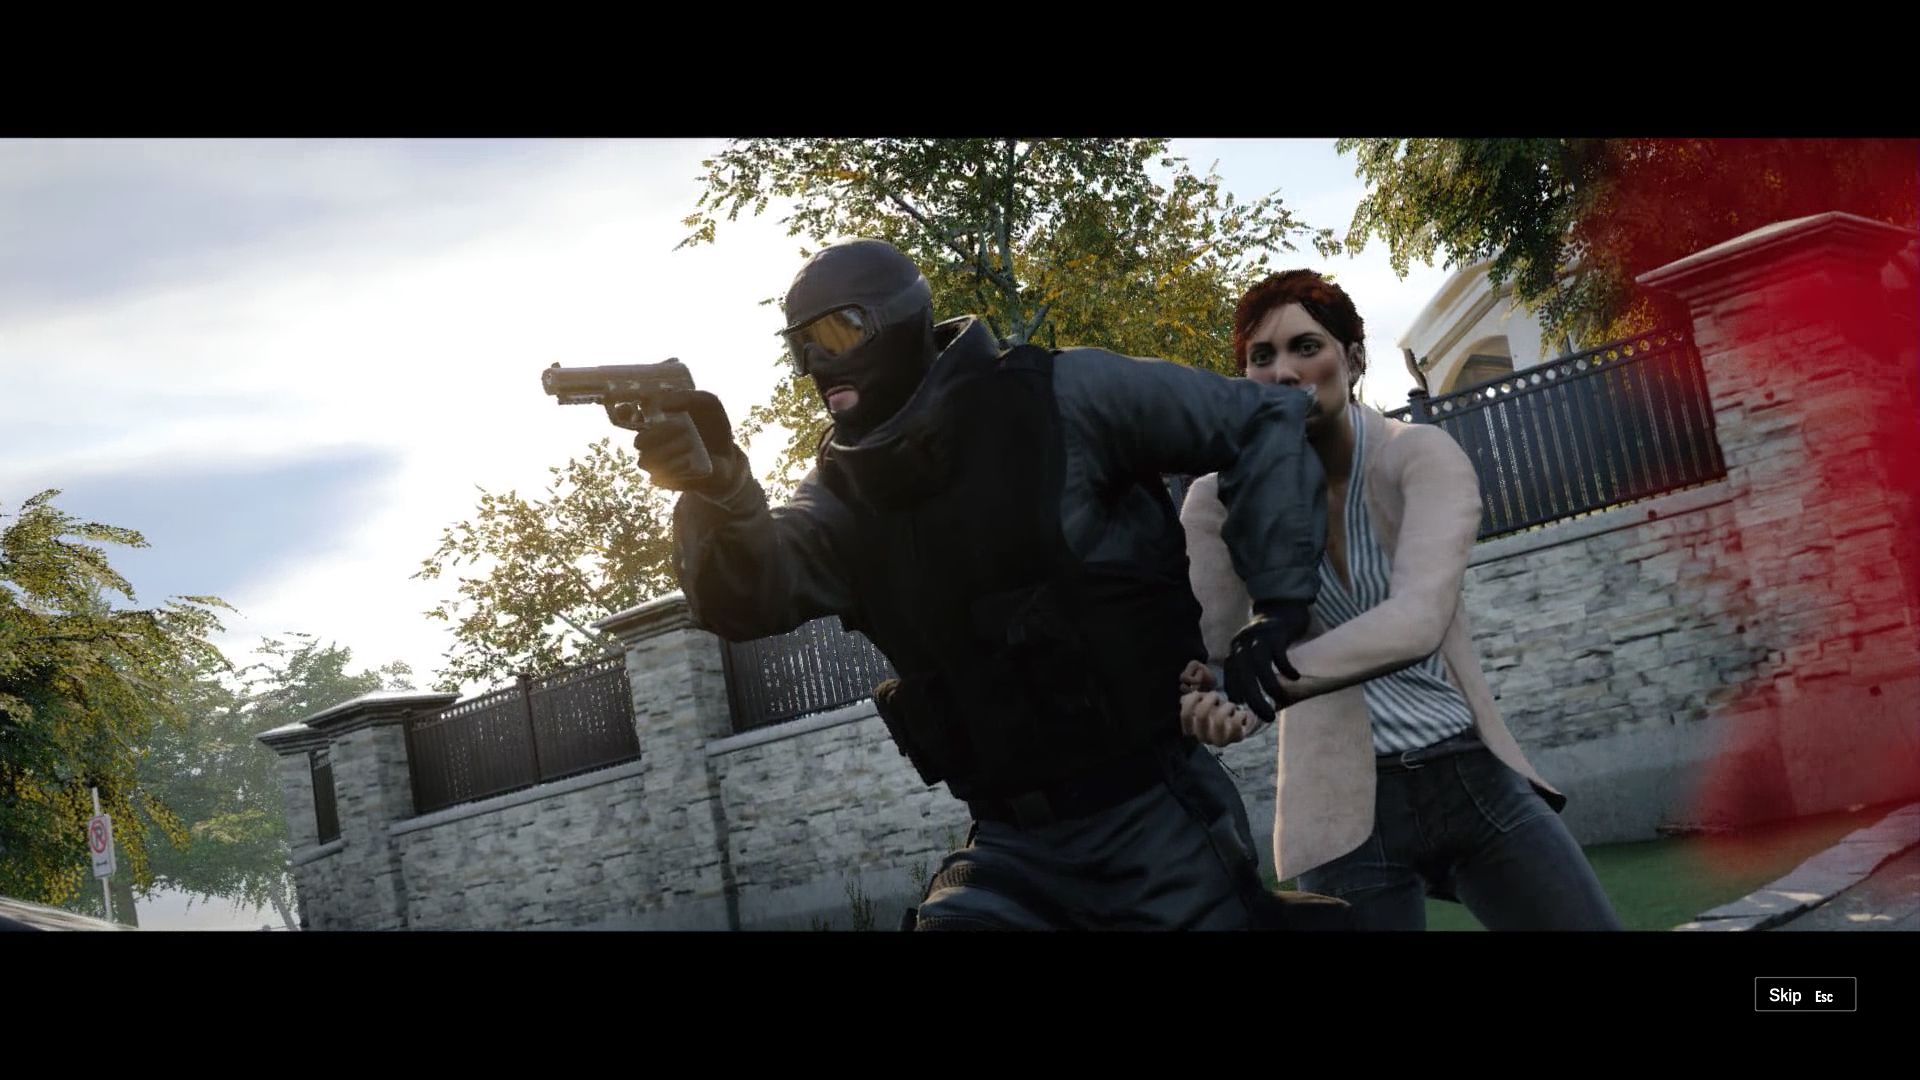
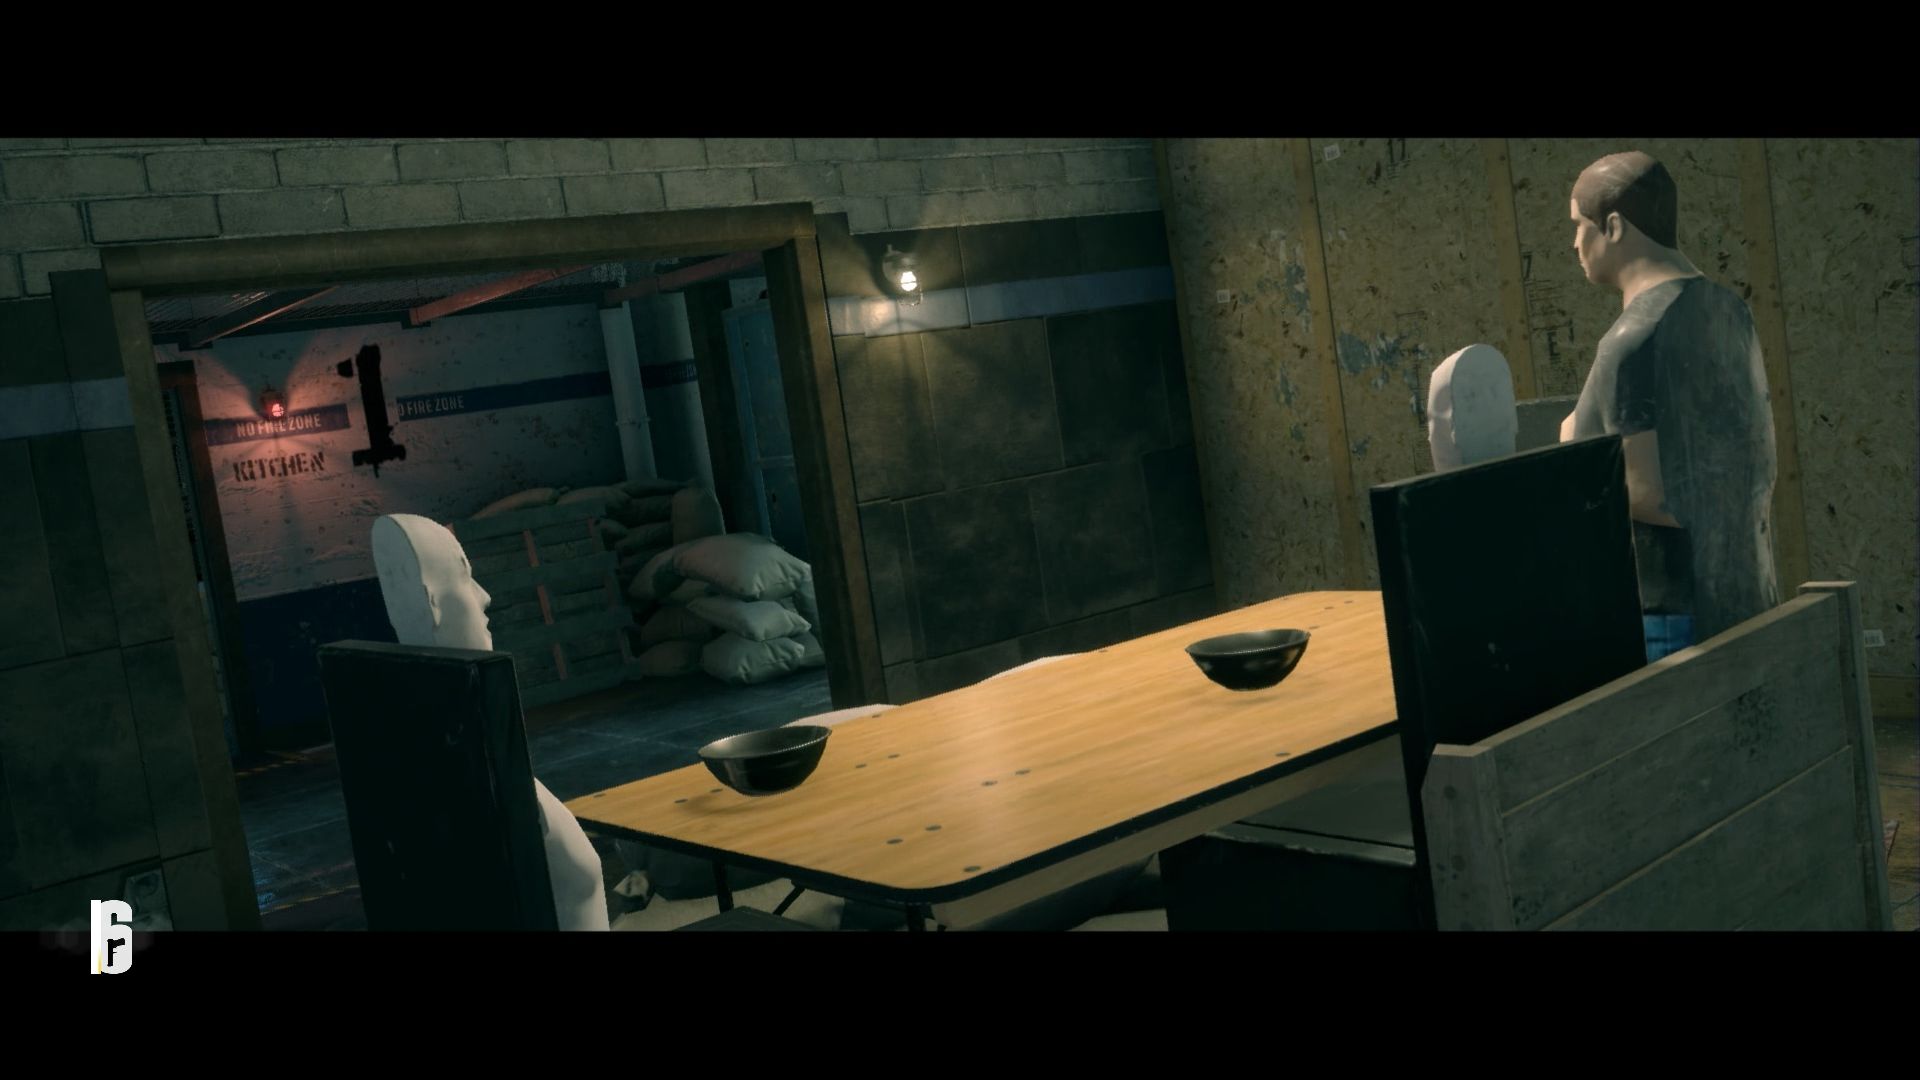
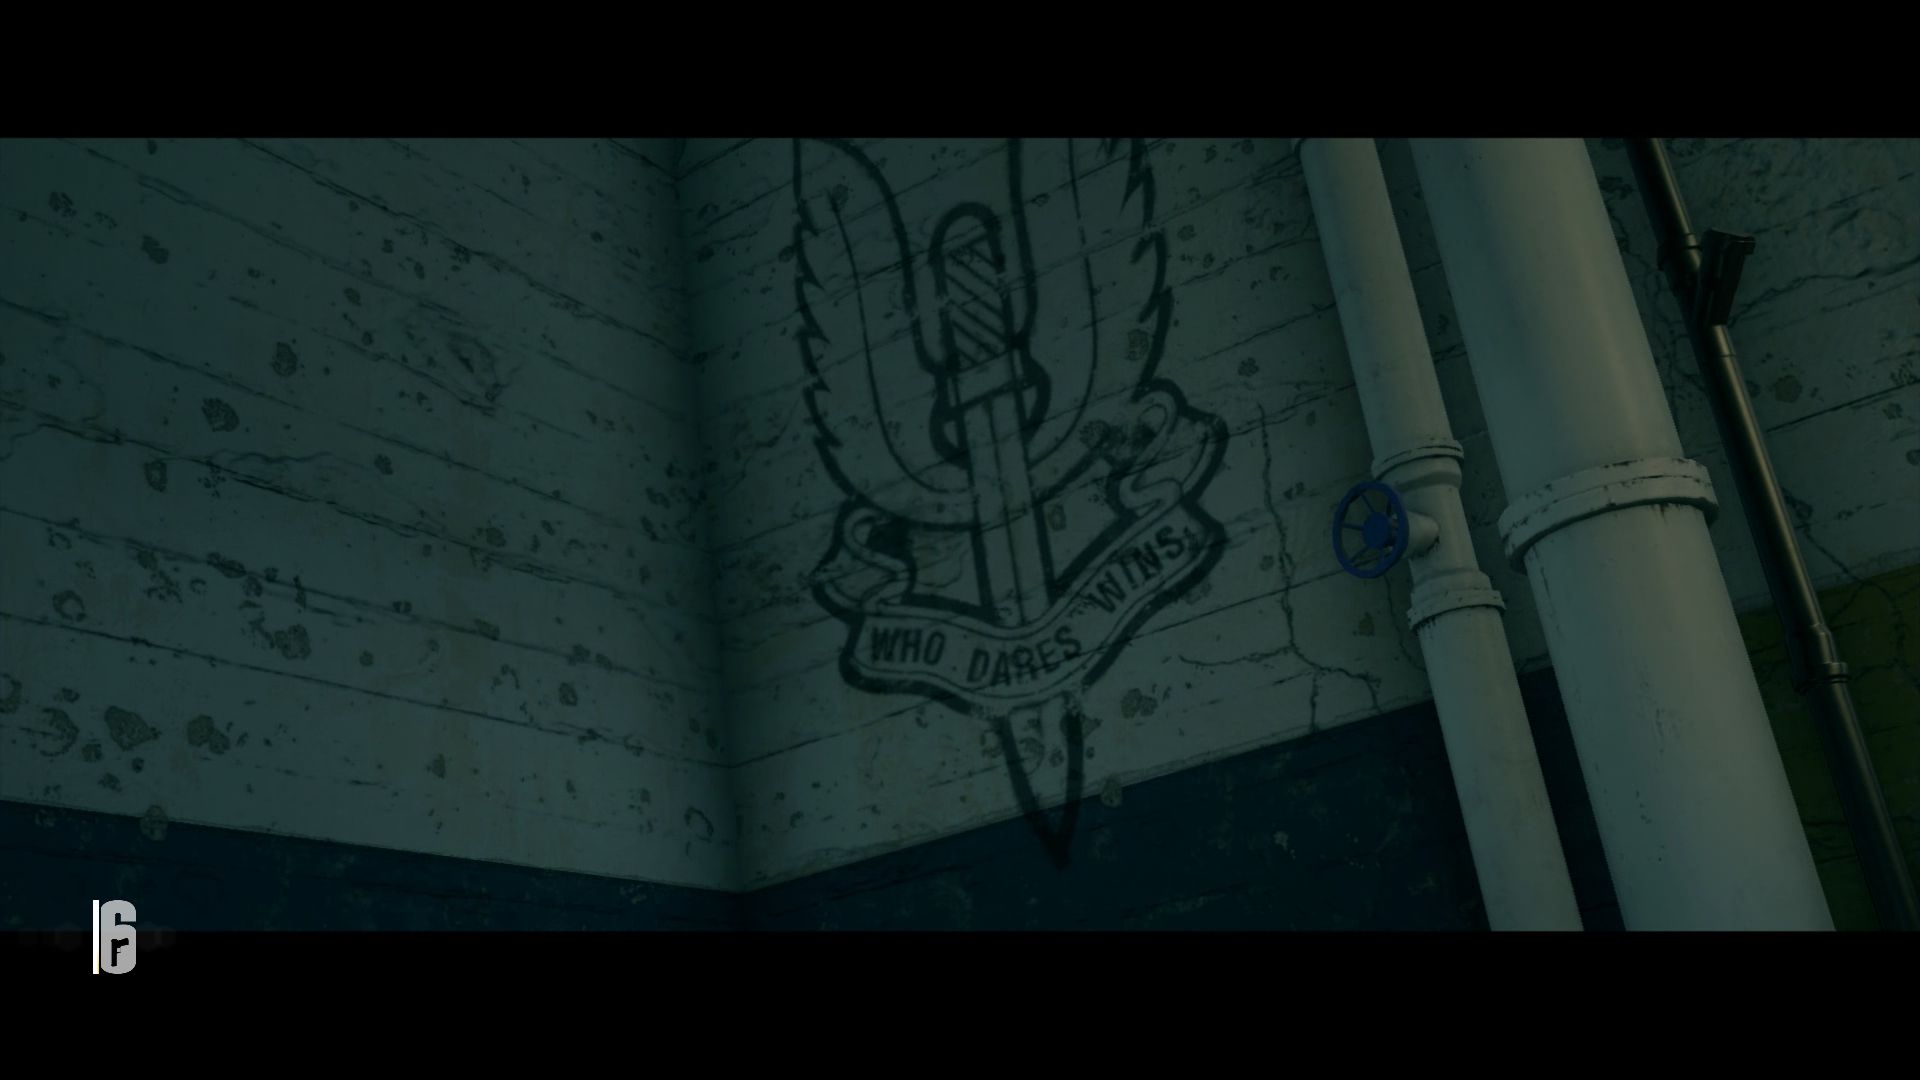
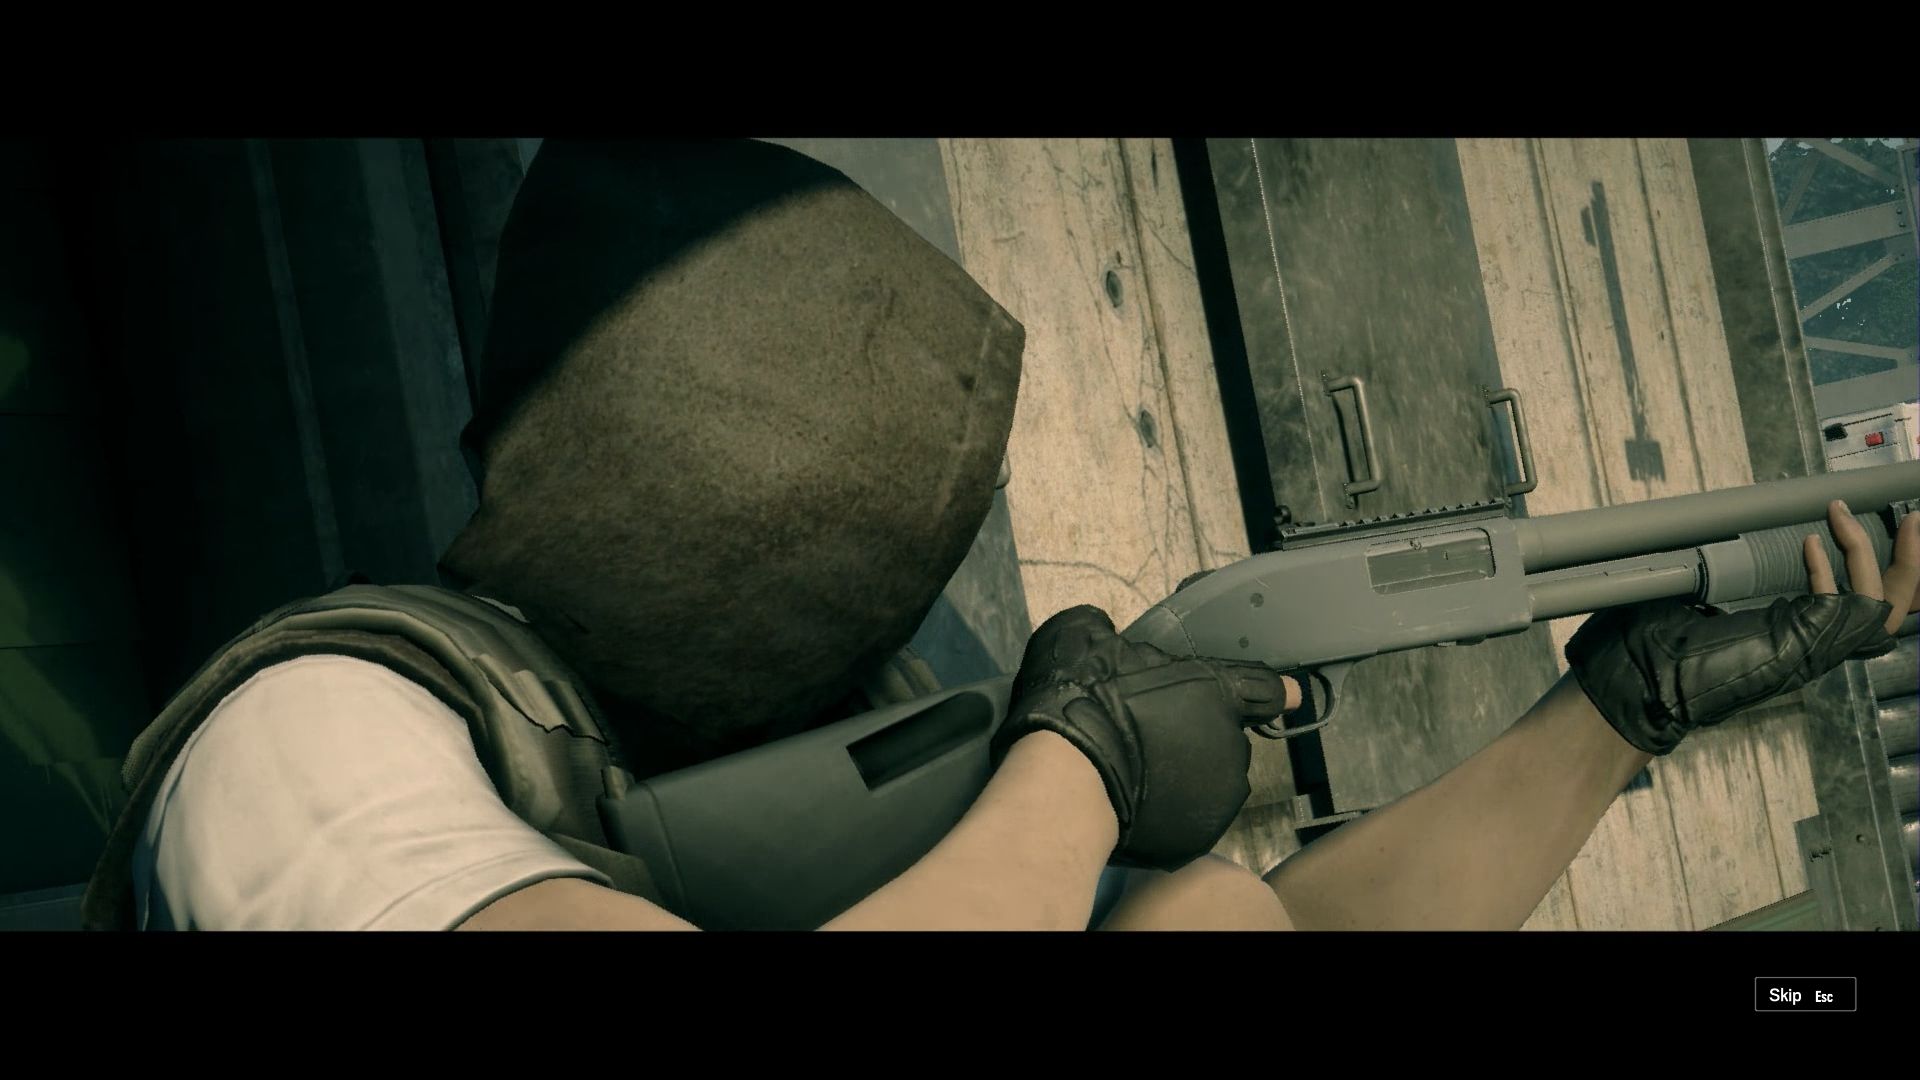
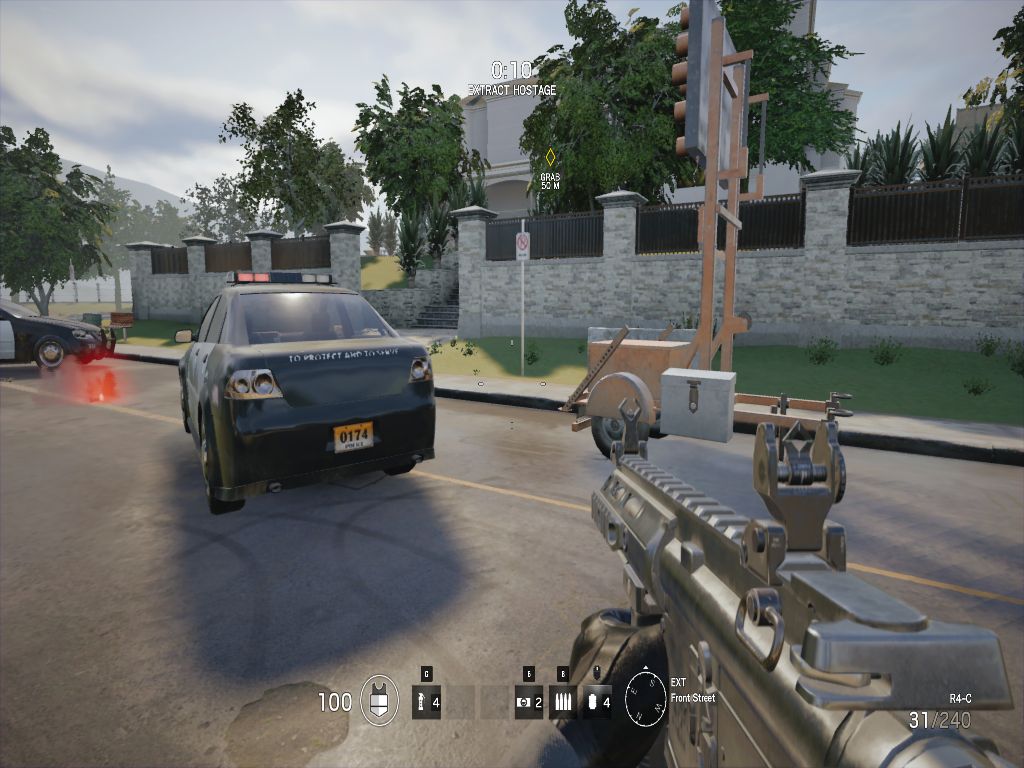
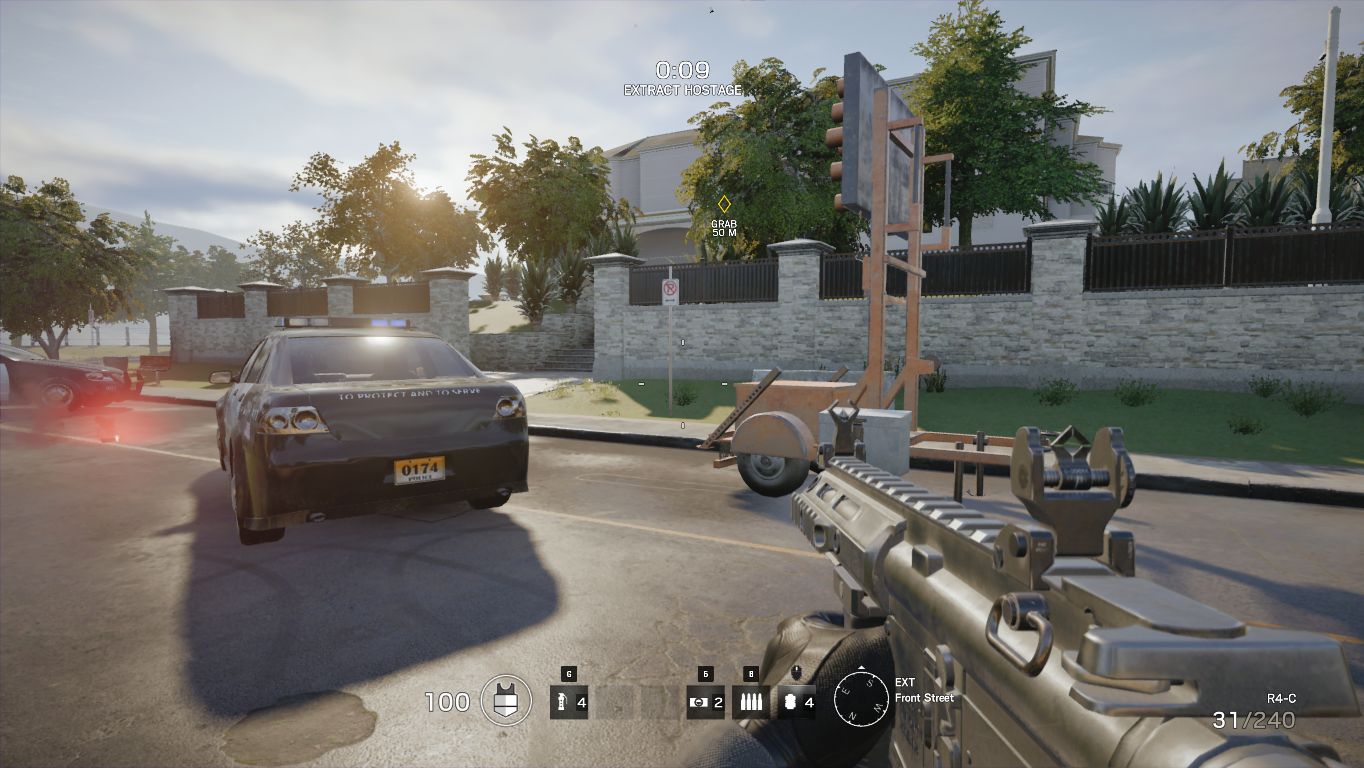
It is great that setting changes do not require a restart. Ubisoft also deserves praise for the integrated benchmark, which shows a camera drive through a house with multiple figures and explosions. Based on the sequence that takes about 50 seconds, you can recognize the strengths and the weaknesses of the engine. While the physical effects and the characters are mainly convincing, the environment can sometimes be a bit dull due to the rather blurry textures. The general performance of the benchmark represents "real" gameplay very well, so the results are significant. Despite the rather slow gameplay, the FPS number should be above 35-40 on average based on our experiences, not least because the minimum FPS number varies quite a bit.

Results

Thanks to the slightly outdated graphics, the hardware requirements are not that high for Rainbow Six Siege. Almost every Intel GPU has a hard time even at low settings (HD Graphics 4600500060006100, ...), but dedicated chips from AMD and Nvidia that are not too old can handle smooth gameplay. This starts with inexpensive all-round GPUs like the GeForce GT 740M, which can at least manage the preset Low at 1024 x 768 pixels. Medium details require more performance; you should at least use a GeForce GT 750M for medium details at 1366 x 768 pixels.

Low Settings
Low Settings
Medium Settings
Medium Settings
High Settings
High Settings
Ultra Settings
Ultra Settings
4K Settings
4K Settings

As expected, the jump to Full-HD will cost a lot of performance. High details and 1920 x 1080 pixels require a fast mainstream chip (GTX 850M+, R9 M280X+) or an older high-end GPU (GTX 860M+), while we would recommend at least a GeForce GTX 960M or GTX 870M for Ultra settings. Owners of a 4K display that do not want to waive high details will even need a GeForce GTX 980M or GTX 980.

The title is not very demanding in terms of CPU performance and the graphics card is usually the limiting factor even at minimum details. Not even slower CPUs from AMD or Intel's ULV series have a problem with this game.

Low Settings
Low Settings
Medium Settings
Medium Settings
High Settings
High Settings
Ultra Settings
Ultra Settings
4K Settings
4K Settings
Rainbow Six Siege
    3840x2160 High Preset AA:T AF:4x     1920x1080 Ultra Preset AA:T AF:16x     1920x1080 High Preset AA:T AF:4x     1366x768 Medium Preset AA:T AF:2x     1024x768 Low Preset AA:T AF:Linear
AMD Radeon R9 Fury, 4790K
XFX Radeon R9 Fury Pro
62 (47min) fps ∼18%
117 (77min) fps ∼24%
160 (94min) fps ∼27%
303 (133min) fps ∼44%
319 (112min) fps ∼36%
NVIDIA GeForce GTX 980, 6700K
Desktop PC
50.1 (35min) fps ∼15%
107.6 (67min) fps ∼22%
149.6 (69min) fps ∼25%
256.4 (100min) fps ∼37%
347.2 (116min) fps ∼40%
NVIDIA GeForce GTX 980M, 4700MQ
Schenker W504
35.9 (28min) fps ∼10%
80.3 (26min) fps ∼16%
108.1 (48min) fps ∼18%
180.8 (98min) fps ∼26%
232.4 (91min) fps ∼27%
NVIDIA GeForce GTX 970M, 4700MQ
Schenker W504
27.5 (12min) fps ∼8%
63.5 (22min) fps ∼13%
86.8 (60min) fps ∼15%
152.1 (77min) fps ∼22%
212.8 (81min) fps ∼24%
NVIDIA GeForce GTX 880M, 4700MQ
Schenker W504
24.9 (7min) fps ∼7%
56.5 (16min) fps ∼12%
78.8 (56min) fps ∼13%
137 (70min) fps ∼20%
203.6 (89min) fps ∼23%
AMD Radeon R7 370, 4790K
MSI Gaming R7 370 2GB
23.7 (18min) fps ∼7%
49 (34min) fps ∼10%
70 (44min) fps ∼12%
134 (75min) fps ∼19%
206 (103min) fps ∼24%
NVIDIA GeForce GTX 870M, 4700MQ
Schenker W504
20.3 (16min) fps ∼6%
44.5 (27min) fps ∼9%
65 (46min) fps ∼11%
114.5 (69min) fps ∼17%
172.8 (89min) fps ∼20%
NVIDIA GeForce GTX 950, 6700K
Desktop PC
18.8 (14min) fps ∼5%
46.6 (28min) fps ∼10%
74.2 (52min) fps ∼13%
137.6 (88min) fps ∼20%
212.1 (116min) fps ∼24%
NVIDIA GeForce GTX 960M, 4720HQ
Schenker XMG A505
15 (7min) fps ∼4%
39.6 (17min) fps ∼8%
54.5 (39min) fps ∼9%
101.1 (62min) fps ∼15%
155.5 (92min) fps ∼18%
AMD Radeon R9 M280X, FX-7600P
Asus N551ZU-CN007H
32.4 (14min) fps ∼7%
38.5 (12min) fps ∼7%
58.8 (30min) fps ∼7%
NVIDIA GeForce GTX 860M, 4700MQ
Schenker W504
13.8 (9min) fps ∼4%
28.7 (14min) fps ∼6%
47.5 (21min) fps ∼8%
86.2 (55min) fps ∼13%
134.4 (74min) fps ∼15%
NVIDIA GeForce GTX 850M, 4340M
Schenker M504
11.4 (4min) fps ∼3%
29.7 (13min) fps ∼6%
38.8 (19min) fps ∼7%
73.1 (41min) fps ∼11%
112.9 (49min) fps ∼13%
AMD Radeon R7 512 Cores (Kaveri Desktop), A10-7850K
A10-7850K Asus A88-XM-PLUS
17.4 (6min) fps ∼4%
23.7 (10min) fps ∼4%
43.9 (13min) fps ∼6%
68 (26min) fps ∼8%
NVIDIA GeForce GT 750M, 4702MQ
Schenker M503
16.3 fps ∼3%
22.1 (16min) fps ∼4%
42.3 (29min) fps ∼6%
66.5 (44min) fps ∼8%
NVIDIA GeForce GT 740M, 4200M
HP Envy 15-j011sg
11 (4min) fps ∼2%
15.1 (3min) fps ∼3%
29.4 (21min) fps ∼4%
46.8 (31min) fps ∼5%
Intel Iris Pro Graphics 5200, 4750HQ
SCHENKER S413
0 (0min) fps ∼0%
21.9 (9.3min) fps ∼3%
35.3 (14min) fps ∼4%
NVIDIA GeForce GT 720M, 4200M
MSI CX61-i572M
10.4 (0min) fps ∼2%
20.4 (0min) fps ∼3%
32.4 (0min) fps ∼4%
NVIDIA GeForce GT 630M, 3720QM
Asus N56VM
6.9 (2min) fps ∼1%
9.9 (7min) fps ∼2%
18.8 (9min) fps ∼3%
30 (16min) fps ∼3%
Intel HD Graphics 4600, 4700MQ
Schenker W504
7.8 (4min) fps ∼1%
14.6 (6min) fps ∼2%
25.7 (10min) fps ∼3%

Test Systems

Four of our test models are provided by Schenker Technologies (mysn.de):

  • W504 (Core i7-4700MQ, 8 GB DDR3, GeForce GTX 860M, GTX 870M, GTX 880M, GTX 970M, GTX 980M)
  • A505 (Core i7-4720HQ, 8 GB DDR3, GeForce GTX 960M)
  • M504 (Core i5-4340M, 8 GB DDR3, GeForce GTX 850M)
  • M503 (Core i7-4702MQ, 8 GB DDR3, GeForce GT 750M)

Three notebooks are provided by Nvidia:

In addition, Intel provided one notebook:

  • Schenker S413 (Core i7-4750HQ, 8 GB DDR3, Iris Pro Graphics 5200)

The desktop PCs are equipped with CPUs/APUs from Intel and AMD, SSDs from Micron, OCZ, Intel and Samsung, motherboards from Intel and Asus as well as graphics cards from Nvidia, PNY and AMD. We use the monitor Asus PB287Q for our 4K tests.

We used the following GPU drivers: Nvidia 359.06, AMD 15.11.1 Beta, Intel 20.19.15.4300 (Win 10) and Intel 10.18.14.4294 (Win 7), respectively.

Overview

Show Restrictions
PosModel< PrevNext >Rainbow Six Siege
 Rainbow Six Siege (2015)
low
1024x768
Low Preset
LinearAF TAA
med.
1366x768
Medium Preset
2xAF TAA
high
1920x1080
High Preset
4xAF TAA
ultra
1920x1080
Ultra Preset
16xAF TAA
4K
3840x2160
High Preset
4xAF TAA
NVIDIA Titan RTX
327
281
275
274
177
NVIDIA GeForce RTX 2080 Ti (Desktop)
447.55n2
369.7n2
337.75n2
320n2
180.2n2
NVIDIA GeForce RTX 2080 Super (Desktop)
296.8
255.6
245.1
236.1
150
NVIDIA GeForce RTX 2080 (Desktop)
310.65n2
273.4n2
255.7n2
249.35n2
138.55n2
NVIDIA GeForce RTX 2080 Mobile
275
259
122
NVIDIA GeForce GTX 1080 Ti (Desktop)
338
301
274
247
109
NVIDIA Titan X Pascal
408.2
332.6
270.7
239.8
106.9
NVIDIA GeForce RTX 2070 Super (Desktop)
376.6n2
311.6n2
274.9n2
254n2
132.7n2
AMD Radeon VII
227
225
200
190
93
AMD Radeon RX 5700 XT (Desktop)
320.6
258.5
246.4
115.9
NVIDIA GeForce RTX 2070 (Desktop)
320n3
275n3
251.5n3
240.8n3
121n3
NVIDIA GeForce GTX 1080 (Desktop)
208n3
85n3
NVIDIA GeForce RTX 2060 Super (Desktop)
376.3n2
305.7n2
262.4n2
236.85n2
113.75n2
AMD Radeon RX 5700 (Desktop)
283.3
250.7
236.5
103.2
NVIDIA GeForce RTX 2070 Mobile
234
216
93.3
NVIDIA GeForce RTX 2080 Max-Q
210n3
201n3
94.5n2
NVIDIA GeForce RTX 2060 (Desktop)
244
297
238
223
97
AMD Radeon RX Vega 64
328.85n2
281.6n2
247.9n2
211.1n2
79.35n2
NVIDIA GeForce GTX 1080 Mobile
226
203
81.8
PosModel< PrevNext >Rainbow Six Siege
low med. high ultra 4K
NVIDIA GeForce GTX 1070 Ti (Desktop)
177
77
NVIDIA GeForce RTX 2070 Max-Q
175
173
73
AMD Radeon RX Vega 56
319.5
271.8
233.2
201.6
89.2
NVIDIA GeForce RTX 2060 Mobile
206
188
77.6
NVIDIA GeForce GTX 1070 (Desktop)
334n3
279.7n3
207.2n3
181.5n4
70.7n4
NVIDIA GeForce GTX 1080 Max-Q
201.5n2
174n2
67.85n2
AMD Radeon Pro Vega 56
198.7
135.7
70.2
NVIDIA GeForce GTX 1070 Mobile
191.5n4
168n4
64.4n2
NVIDIA GeForce GTX 1660 Ti (Desktop)
318.8
269.4
225.9
194.6
84.9
NVIDIA GeForce GTX 1660 Ti Mobile
201
175
73.3
NVIDIA GeForce GTX 980 Ti
321
275
192
164
67
NVIDIA GeForce GTX 1070 Max-Q
164.5n2
143.5n2
54.4
AMD Radeon R9 Fury
319
303
160
117
62
AMD Radeon R9 Nano
141
60.7
NVIDIA GeForce GTX 980
347.2
256.4
149.6
107.6
50.1
NVIDIA GeForce GTX 1660 Ti Max-Q
232.8
200.1
163.6
148.8
AMD Radeon RX 590 (Desktop)
387.5
315.5
204
183.9
68.9
AMD Radeon RX 580 (Desktop)
290.6
246.7
166
134.6
55.4
NVIDIA GeForce GTX 980 (Laptop)
327.5
247.7
149.4
114.1
50.4
AMD Radeon R9 390X
274.5
216.5
145
107.6
54
PosModel< PrevNext >Rainbow Six Siege
low med. high ultra 4K
NVIDIA GeForce GTX 1060 (Desktop)
327
262
154
130
47.7
AMD Radeon RX 570 (Desktop)
317.5
258.9
165.3
138.3
57.1
AMD Radeon RX 480 (Desktop)
127
48.4
NVIDIA GeForce GTX 1060 Mobile
136
115n3
42.7
AMD Radeon RX 5500M
151
143
59.6
AMD Radeon Pro 5500M
126
44.8
AMD Radeon RX 580 (Laptop)
199
177
148
121
47.4
NVIDIA GeForce GTX 1650 (Desktop)
264.1
209.9
146.2
124
49.6
NVIDIA GeForce GTX 1650 Mobile
154
130
50.3
NVIDIA GeForce GTX 970
281.65n2
229.8n2
142.45n2
120.8n2
44.8
NVIDIA GeForce GTX 1060 Max-Q
224
126
102
37.3
AMD Radeon RX 470 (Desktop)
120
32.2
NVIDIA GeForce GTX 1650 Max-Q
115
101
40
NVIDIA Quadro T1000 (Laptop)
217.3n2
178.75n2
125.45n2
107.9n2
NVIDIA GeForce GTX 980M
232.4n3
186.2n3
110.9n3
93.1n3
35.9
NVIDIA GeForce GTX 960
248.5
163.6
90.2
64.5
27.2
NVIDIA GeForce GTX 1050 Ti Mobile
95.9
92
90.25n4
71.85n4
28.4
NVIDIA GeForce GTX 1050 Ti (Desktop)
272
181
95
79
NVIDIA GeForce GTX 970M
228.6n3
161.1n4
88.15n4
63.9n4
26.35n2
NVIDIA GeForce GTX 680
271.6
180.6
102.9
67.4
25
PosModel< PrevNext >Rainbow Six Siege
low med. high ultra 4K
NVIDIA GeForce GTX 1050 Ti Max-Q
250.1n2
158.4n2
91.45n2
65n2
28.5n2
AMD Radeon RX Vega M GL / 870
180.9
149.4
97
80.5
30.8
NVIDIA GeForce GTX 1050 (Desktop)
247
155
82.4
65.9
20.3
NVIDIA GeForce GTX 1050 Mobile
178.5n4
136.3n4
73.7n4
60.8n4
AMD Radeon R7 370
206
134
70
49
23.7
NVIDIA GeForce GTX 880M
203.6
137
78.8
56.5
24.9
NVIDIA GeForce GTX 1050 Max-Q
139.15n2
110.4n2
73.95n2
64.9n2
24.1n2
NVIDIA GeForce GTX 950
212.1
137.6
74.2
46.6
18.8
AMD Radeon RX 460 (Desktop)
236
151
79
64.6
22.9
NVIDIA GeForce GTX 965M
190n3
131n3
71.8n3
45.8n3
AMD Radeon RX 560X (Laptop)
166
145
84.1
76.6
NVIDIA GeForce GTX 870M
172.8
114.5
65
44.5
20.3
AMD Radeon HD 8970M
212.7
139.6
81.3
65.1
AMD Radeon Pro 560X
180
76.4
62.9
17.4
AMD Radeon Pro 460
150.3
55.2
45
NVIDIA GeForce GTX 960M
159.1n2
105n3
55.5n3
45.6n3
15
AMD Radeon Pro 555
48.5
36.2
AMD Radeon Pro 455
162
52.7
33.7
NVIDIA GeForce GT 1030 (Desktop)
143.85n2
90.05n2
46.35n2
36.25n2
10.9n2
NVIDIA GeForce MX250
123.1
90.3
50.2
31.9
PosModel< PrevNext >Rainbow Six Siege
low med. high ultra 4K
NVIDIA GeForce MX150
129.05n2
76.4n4
40.2n4
24.7n4
AMD Radeon RX 540
105.5
56.3
28
21.1
NVIDIA GeForce GTX 860M
134.4
86.2
47.5
28.7
13.8
NVIDIA GeForce GTX 950M
110.6n4
70n4
38.4n4
28.25n4
AMD Radeon Pro 450
39.6
34.1
AMD Radeon 540X
110
77.4
40.9
30
AMD Radeon R9 M385X
74
64.8
48.4
27.8
NVIDIA GeForce GTX 850M
112.9
73.1
38.8
29.7
11.4
AMD Radeon R9 M280X
58.8
38.5
32.4
Intel Iris Plus Graphics G7 (Ice Lake 64 EU)
98.2
61.5
33.6
27.7
AMD Radeon RX Vega 10
70.6
48.9
24.4
NVIDIA GeForce MX230
85.9
61.9
32.2
22.5
AMD Radeon RX Vega 7
122.8
80.2
43.3
36.4
NVIDIA GeForce GT 750M
66.5
42.3
22.1
16.3
NVIDIA GeForce MX130
87.1
53.2
29.4
18.3
NVIDIA GeForce 940MX
81.05n4
52.35n4
25.45n4
21.7n3
AMD Radeon RX Vega 8 (Ryzen 2000/3000)
85.3n2
54.05n2
29.2n2
22.35n2
NVIDIA GeForce 940M
55.3
34.7
20
14.5
Intel Iris Plus Graphics G4 (Ice Lake 48 EU)
62.3
42.7
25.3
20.3
NVIDIA GeForce 930MX
69.3
39.8
21.1
14
PosModel< PrevNext >Rainbow Six Siege
low med. high ultra 4K
AMD Radeon R9 M375
89.4
58.5
31.1
26.2
Intel Iris Plus Graphics 655
75.8
AMD Radeon R7 M445
64.4
37.8
20.1
13.5
AMD Radeon R7 512 Cores (Kaveri Desktop)
68
43.9
23.7
17.4
Intel Iris Pro Graphics 5200
35.3
21.9
NVIDIA GeForce GT 740M
46.8
29.4
15.1
11
Intel Iris Plus Graphics 650
54.2
35.6
20.8
NVIDIA GeForce 930M
62
39
19.8
12.7
Intel Iris Graphics 550
50.65n2
31.2n2
18.6n2
14.75n2
AMD Radeon 530
60.9
37.4
21.3
NVIDIA GeForce MX110
65.7
43.7
24.1
20.7
Intel Iris Plus Graphics 640
50.5n3
30.7n3
16.6n3
14.2
NVIDIA GeForce 920MX
54.3
34.1
17.2
Intel Iris Graphics 540
41.7n2
25.8n2
15.15n2
12.3n2
AMD Radeon R7 (Bristol Ridge)
47.1
20.8
14.7
NVIDIA GeForce GT 640M
51.4
29.2
16.5
11.2
AMD Radeon R7 (Carrizo)
36.35n2
23.5n2
12.1n2
10.1
AMD Radeon R7 (Kaveri)
55
17.1
13.6
AMD Radeon R7 M460
51.9
31.8
13.1
10.6
AMD Radeon R7 M360
48.1n2
29.4n2
14.55n2
11.3n2
PosModel< PrevNext >Rainbow Six Siege
low med. high ultra 4K
NVIDIA GeForce 920M
47.95n2
29.85n2
15.2
12.4
AMD Radeon R7 M440
54
42.9
26.9
20.3
AMD Radeon 520
52
31.9
13.8
AMD Radeon RX Vega 6 (Ryzen 2000/3000)
54.6
30.1
19.7
16.7
AMD Radeon RX Vega 5
109
74
39
38
Intel UHD Graphics G1 (Ice Lake 32 EU)
45.4
31.6
16.3
13.2
Intel UHD Graphics 630
51.7
32.5
Intel HD Graphics 630
39.9
24.8
16.1
AMD Radeon R5 (Bristol Ridge)
36.3
24.3
Intel UHD Graphics 620
41n5
25.9n5
15.35n2
10.8
Intel HD Graphics 620
38.75n2
24.1n2
13.2n2
11.5
AMD Radeon R6 (Carrizo)
37.7
22.9
11.9
8.7
AMD Radeon HD 8650G
30.8
18.7
NVIDIA GeForce GT 630M
30
18.8
9.9
6.9
AMD Radeon R5 M335
39.4
24.8
12.4
9.9
AMD Radeon R5 M330
40.7n2
22.4n2
9.1
7.1
AMD Radeon R5 M430
47
29.3
14.2
AMD Radeon R5 M255
49
30.6
14.9
10
AMD Radeon RX Vega 3
39.7
20.4
10.2
NVIDIA GeForce 910M
38.8
25.3
12.6
10.7
PosModel< PrevNext >Rainbow Six Siege
low med. high ultra 4K
Intel HD Graphics 520
31.95n2
19.7n2
11.6
9.1
Intel Iris Graphics 6100
31
19.7
11.7
9.7
NVIDIA GeForce GT 720M
32.4
20.4
10.4
AMD Radeon R5 (Stoney Ridge)
26.9
21.6
Intel HD Graphics 6000
28.9
18.2
10.9
9.1
Intel HD Graphics 4600
22.3n2
13.3n2
7.8
Intel HD Graphics 5500
25.8n2
15.35n2
9.9
7.8
Intel UHD Graphics 615
31.3
19.5
Intel HD Graphics 615
24.6
16.2
Intel HD Graphics 515
25.7
15.2
Intel UHD Graphics 610
24.2
15.1
Intel HD Graphics 610
22.4
16.2
Intel HD Graphics 4400
20.2
12.6
Intel HD Graphics 510
25
15.9
Intel UHD Graphics 605
12.3
Intel HD Graphics 505
15
8.9
Intel HD Graphics 5300
13.2
8.5
5
AMD Radeon R5 (Beema/Carrizo-L)
24.8
15
AMD Radeon R2 (Stoney Ridge)
20.4
13.8
Intel HD Graphics 4200
17.2
10.7
PosModel< PrevNext >Rainbow Six Siege
low med. high ultra 4K
Intel UHD Graphics 600
17.1
10.8
Intel HD Graphics 500
15.5
Intel HD Graphics 405 (Braswell)
15.3
8.9
Intel HD Graphics 400 (Braswell)
7.3
3.2
Intel HD Graphics (Haswell)
13.7
8.9
Intel HD Graphics (Cherry Trail)
11.5
7
(-) * Smaller values are better. / n123 Number of benchmarks for this median value / * Approximate position


Legend
5Stutters – This game is very likely to stutter and have poor frame rates. Based on all known benchmarks using the specified graphical settings, average frame rates are expected to fall below 25fps
May Stutter – This graphics card has not been explicitly tested on this game. Based on interpolated information from surrounding graphics cards of similar performance levels, stutters and poor frame rates are expected.
30Fluent – Based on all known benchmarks using the specified graphical settings, this game should run at or above 25fps
40Fluent – Based on all known benchmarks using the specified graphical settings, this game should run at or above 35fps
60Fluent – Based on all known benchmarks using the specified graphical settings, this game should run at or above 58fps
May Run Fluently – This graphics card has not been explicitly tested on this game. Based on interpolated information from surrounding graphics cards of similar performance levels, fluent frame rates are expected.
?Uncertain – This graphics card experienced unexpected performance issues during testing for this game. A slower card may be able to achieve better and more consistent frame rates than this particular GPU running the same benchmark scene.
Uncertain – This graphics card has not been explicitly tested on this game and no reliable interpolation can be made based on the performances of surrounding cards of the same class or family.
The value in the fields displays the average frame rate of all values in the database. Move your cursor over the value to see individual results.
Read all 2 comments / answer
static version load dynamic
Loading Comments
Comment on this article
Please share our article, every link counts!
Florian Glaser, 2015-12-19 (Update: 2015-12-19)