




SK Hynix HFS001TEJ9X115N vs Samsung PM9A1 MZVL21T0HCLR
SK Hynix HFS001TEJ9X115N
► remove from comparison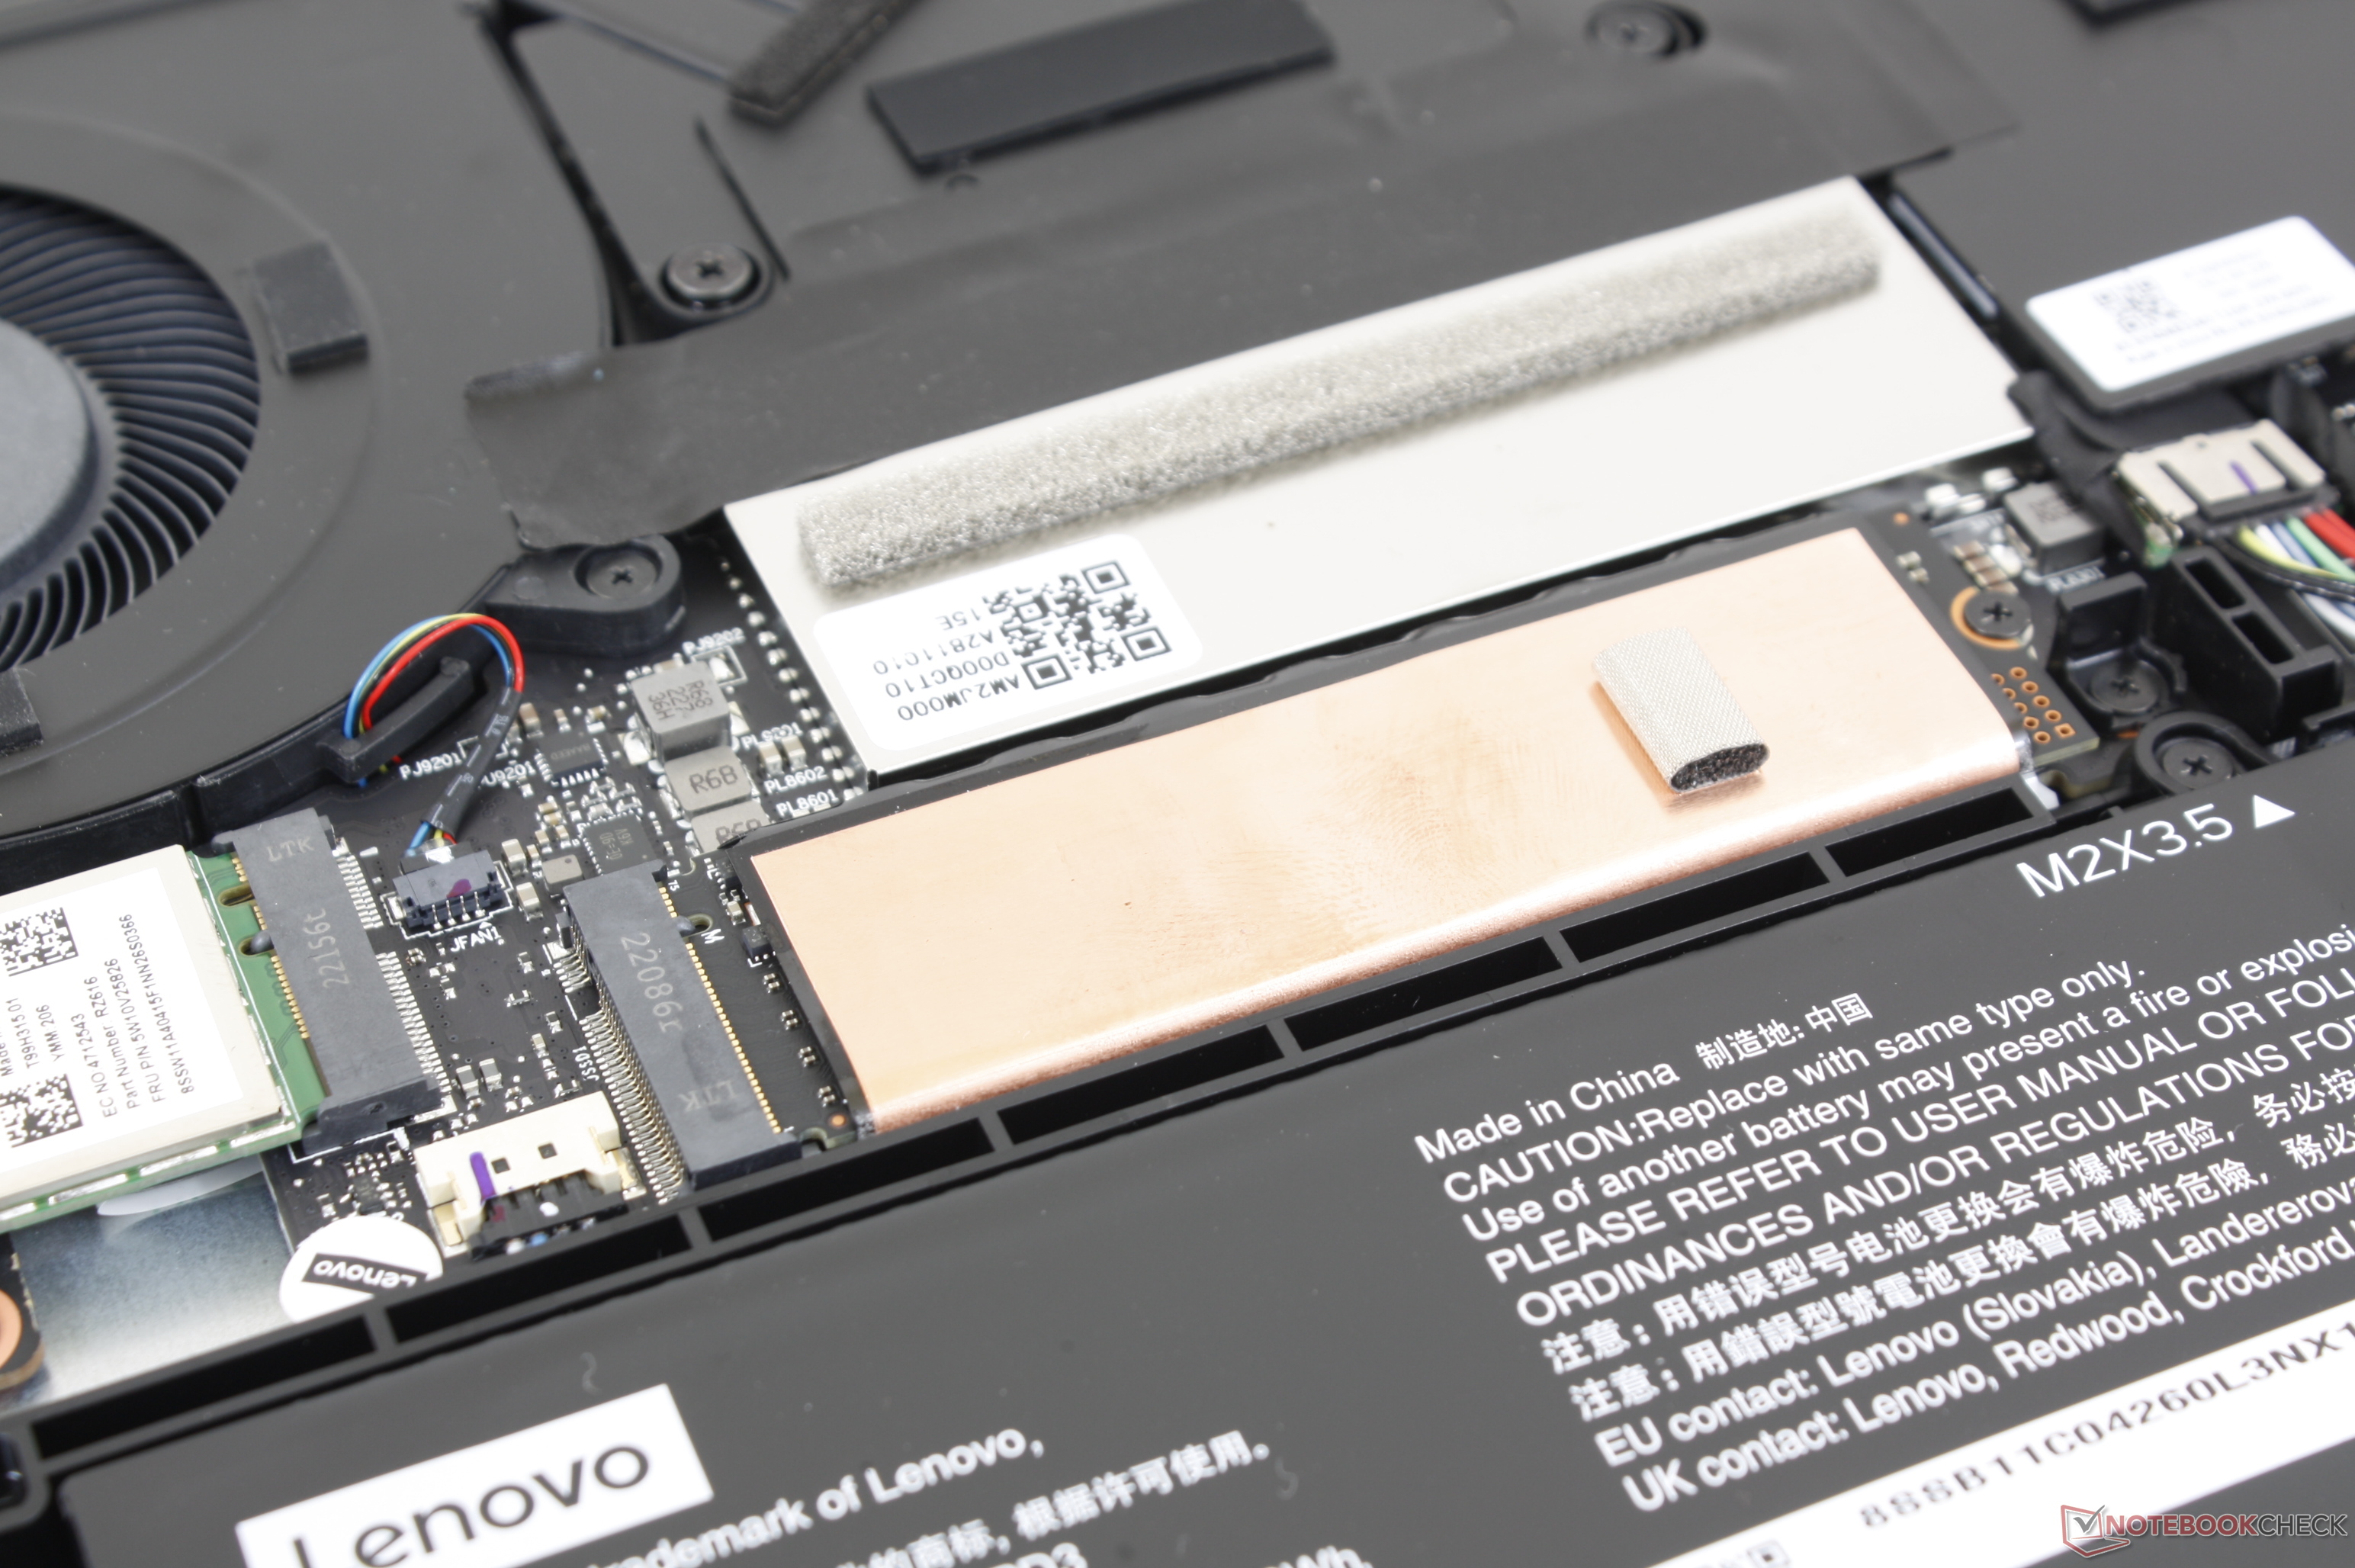
The SK Hynix HFS001TEJ9X115N is a fast PCIe4 x4 NVMe SSD in the M.2 2280 form factor. It could be from the BC711 of BC511 series and was found in the Lenovo Legion Slim 7i laptop.
Samsung PM9A1 MZVL21T0HCLR
► remove from comparison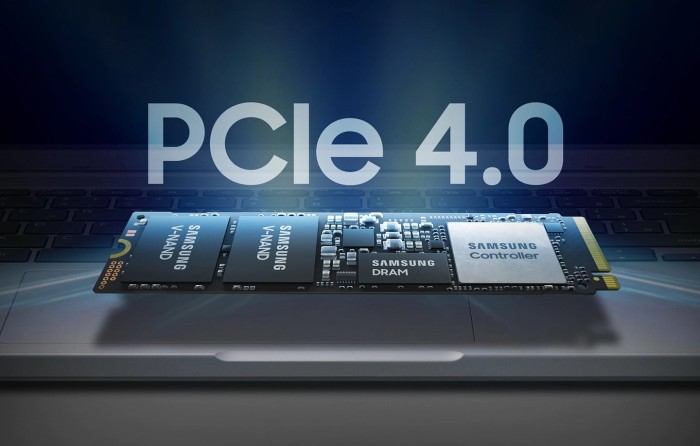
The Samsung OEM Client SSD PM9A1 1TB, M.2 (MZVL21T0HCLR, OEM variant of the 980 Pro) is a fast M.2 2280 SSD which supports PCIe 4.0 x4. It uses the Samsung Elpis (S4LV003) Controller with 8 channels and 512 MB LPDDR4. The memory modules are from Samsung (3D-NAND TLC 136 layers). The 1TB version is specified at 7000 MB/s and 5100 MB/s write (SLC cached). The power consumption is specified at 0.005 W (sleep) and 0.035W (idle).
| SK Hynix HFS001TEJ9X115N | Samsung PM9A1 MZVL21T0HCLR | |
| Type | SSD | SSD |
| Size | M.2 2280 | M.2 2280 |
| Capacity | 1024 GB | 1024 GB |
| Interface | NVMe | NVMe |
| Announced | 08.11.2022 | 26.02.2021 |
Benchmarks
| Model | CPU | GPU | RAM | Value |
|---|---|---|---|---|
| Lenovo Yoga Pro 9 16IMH9 RTX 4050 | Ultra 9 185H 120 W / 83 W | GeForce RTX 4050 Laptop GPU 100 W 2055 / 2000 MHz 6 GB | 32 GB | 131.3 |
| Lenovo Yoga Pro 7 14IMH9 | Ultra 7 155H 64 W / 55 W | Arc 8-Core 0.1 GB | 32 GB | 136.2 |
| Dell Precision 7670 | i7-12850HX 153 W / 72 W | RTX A2000 Laptop GPU 95 W 1612 / 1750 MHz 8 GB | 32 GB | 136.3 |
| Lenovo Yoga Pro 9 16IMH9 6.0.1 x64 1024 MiB [C: 8.8% (83.4/951.6 GiB)] (x5) [Interval=5 sec] | Ultra 9 185H 115 W / 80 W | GeForce RTX 4070 Laptop GPU 100 W 2175 / 2000 MHz 8 GB | 32 GB | 136.4 |
| Lenovo Legion Pro 5 16IAX10, RTX 5070 6.0.0 x64 1024 MiB [C: 77.9% (741.5/951.6 GiB)] (x5) [Interval=5 sec] | Ultra 7 255HX 185 W / 125 W | GeForce RTX 5070 Laptop 115 W | 32 GB | 156.1 |
| Lenovo Legion Pro 7i 16 Gen 10 | Ultra 9 275HX 201 W / 156 W | GeForce RTX 5080 Laptop 175 W 1650 / 1788 MHz 16 GB | 32 GB | 164.4 |
| Lenovo Legion S7 16ARHA7 | R9 6900HX 103 W / 85 W | Radeon RX 6800S 90 W 1481 / 2000 MHz 8 GB | 16 GB | 193.5 |
| Lenovo Legion Slim 5 14APH8 | R7 7840HS 92 W / 83 W | GeForce RTX 4060 Laptop GPU 105 W 2040 / 2050 MHz 8 GB | 16 GB | 247.2 |
| Lenovo Legion Pro 7 16IRX9H | i9-14900HX 185 W / 130 W | GeForce RTX 4080 Laptop GPU 175 W 1665 / 2250 MHz 12 GB | 32 GB | 331.4 |
| Lenovo Legion 7 16 IRX G9 6.0.1 x64 1024 MiB [C: 9.0% (85.6/951.6 GiB)] (x5) [Interval=5 sec] | i9-14900HX 154 W / 90 W | GeForce RTX 4070 Laptop GPU 115 W 2480 / 2250 MHz 8 GB | 32 GB | 338 |
| Model | CPU | GPU | RAM | Value |
|---|---|---|---|---|
| Dell XPS 14 2024 OLED 6.0.1 x64 1024 MiB [C: 9.2% (85.1/925.7 GiB)] (x5) [Interval=5 sec] | Ultra 7 155H 64 W / 30 W | GeForce RTX 4050 Laptop GPU 30 W 1605 / 2000 MHz 4 GB | 32 GB | 113 |
| Lenovo Slim 7 Pro X 14ARH7 | R9 6900HS 65 W / 54 W | GeForce RTX 3050 4GB Laptop GPU 55 W 1057 / 1375 MHz 4 GB | 32 GB | 117.6 |
| Lenovo Yoga Pro 7 14ARP G8 6.0.1 x64 1024 MiB [C: 3.8% (36.3/953.1 GiB)] (x5) [Interval=5 sec] | R7 7735HS 60 W / 54 W | Radeon 680M | 16 GB | 120.9 |
| LG Gram 16Z90Q | i7-1260P 43 W / 25 W | Iris Xe G7 96EUs 1400 / 2600 MHz | 16 GB | 123.4 |
| Eluktronics Mech-17 GP2 | i9-13900HX 160 W / 99 W | GeForce RTX 4090 Laptop GPU 175 W 2140 / 2375 MHz 16 GB | 32 GB | 130.1 |
| Lenovo Yoga Pro 7 14IRH G8 6.0.1 x64 1024 MiB [C: 13.8% (130.9/951.6 GiB)] (x5) [Interval=5 sec] | i7-13700H 80 W / 53 W | GeForce RTX 4050 Laptop GPU 55 W 1905 / 2000 MHz 6 GB | 16 GB | 134 |
| Lenovo Yoga Slim 7 14APU G8 6.0.1 x64 1024 MiB [C: 7.6% (72.4/951.6 GiB)] (x5) [Interval=5 sec] | R7 7840S 52 W / 42 W | Radeon 780M ? / 800 MHz | 32 GB | 135.3 |
| Lenovo Yoga Slim 7 Carbon 13IAP7-82U9005FGE 6.0.1 x64 1024 MiB [C: 19.6% (186.5/951.6 GiB)] (x5) [Interval=5 sec] | i7-1260P 46 W / 28 W | Iris Xe G7 96EUs 1400 / 2400 MHz | 16 GB | 135.59 |
| Asus ROG Zephyrus G14 GA402XY 6.0.1 x64 1024 MiB [C: 8.2% (76.2/926.6 GiB)] (x5) [Interval=5 sec] | R9 7940HS 80 W / 80 W | GeForce RTX 4090 Laptop GPU 125 W 1455 / 2250 MHz 16 GB | 32 GB | 138.4 |
| Lenovo Yoga Pro 9-14IRP G8 6.0.1 x64 1024 MiB [C: 8.6% (81.6/951.6 GiB)] (x5) [Interval=5 sec] | i7-13705H 104 W / 75 W | GeForce RTX 4050 Laptop GPU 80 W 2055 / 2000 MHz 6 GB | 32 GB | 138.6 |
| Lenovo Yoga Pro 9 16-IRP G8 6.0.1 x64 1024 MiB [C: 7.1% (67.9/951.6 GiB)] (x5) [Interval=5 sec] | i7-13705H 125 W / 80 W | GeForce RTX 4060 Laptop GPU 100 W 8 GB | 16 GB | 138.7 |
| Lenovo Yoga Pro 7 14APH G8 6.0.1 x64 1024 MiB [C: 15.9% (151.5/951.6 GiB)] (x5) [Interval=5 sec] | R7 7840HS 60 W / 54 W | Radeon 780M | 32 GB | 138.8 |
| Uniwell Technology GM7AG8N Liquid Cooling Box | i9-12900H 140 W / 98 W | GeForce RTX 3080 Ti Laptop GPU 175 W 1590 / 2000 MHz 16 GB | 16 GB | 139.7 |
| Asus Zenbook 17 Fold UX9702 6.0.1 x64 1024 MiB [C: 5.2% (49.4/952.5 GiB)] (x5) [Interval=5 sec] | i7-1250U 29 W / 16 W | Iris Xe G7 80EUs 950 MHz | 16 GB | 140.52 |
| Asus ZenBook S13 OLED UX5304 6.0.1 x64 1024 MiB [C: 5.5% (52.1/952.4 GiB)] (x5) [Interval=5 sec] | i7-1355U 44 W / 17 W | Iris Xe G7 96EUs 1300 MHz | 16 GB | 141.4 |
| Dell Precision 5480 | i9-13900H 88 W / 51 W | RTX 3000 Ada Generation Laptop 50 W 1530 / 2000 MHz 8 GB | 64 GB | 142.6 |
| HP Omen 16-n0033dx | R7 6800H 93 W / 64 W | Radeon RX 6650M 105 W ? / 2000 MHz 8 GB | 16 GB | 142.9 |
| HP ZBook Firefly 16 G9-6B897EA 6.0.1 x64 1024 MiB [C: 7.0% (66.5/952.7 GiB)] (x5) [Interval=5 sec] | i7-1265U 51 W / 12 W | T550 Laptop GPU 20 W 1665 / 1500 MHz 4 GB | 32 GB | 143.95 |
| Lenovo Slim Pro 9i 16IRP8 | i9-13905H 123 W / 85 W | GeForce RTX 4050 Laptop GPU 100 W 2055 / 2000 MHz 6 GB | 32 GB | 145.9 |
| Dell XPS 13 Plus 9320 4K 6.0.1 x64 1024 MiB [C: 15.9% (148.3/934.4 GiB)] (x5) [Interval=5 sec] | i7-1260P 64 W / 34 W | Iris Xe G7 96EUs 1400 MHz | 32 GB | 146.7 |
| Lenovo ThinkPad T14 G3-21AJS00400 6.0.1 x64 1024 MiB [C: 6.0% (57.5/951.6 GiB)] (x5) [Interval=5 sec] | i7-1260P 58 W / 42 W | GeForce MX550 30 W 1710 / 1500 MHz 2 GB | 16 GB | 148.8 |
| Asus Zenbook S 13 OLED 6.0.1 x64 1024 MiB [C: 4.9% (46.8/952.2 GiB)] (x5) [Interval=5 sec] | R7 6800U 30 W / 25 W | Radeon 680M 2200DC MHz | 16 GB | 152.69 |
| Dell Precision 5000 5470 | i9-12900H 91 W / 20 W | RTX A1000 Laptop GPU 40 W 1140 / 1375 MHz 4 GB | 32 GB | 153.8 |
| HP ZBook Power 15 G9 6B8C4EA 6.0.1 x64 1024 MiB [C: 7.2% (68.3/952.7 GiB)] (x5) [Interval=5 sec] | i7-12700H 90 W / 55 W | RTX A2000 Laptop GPU 45 W 1335 / 1368 MHz 8 GB | 32 GB | 156.27 |
| Acer Nitro 16 AN16-41 | R7 7735HS 100 W / 75 W | GeForce RTX 4070 Laptop GPU 140 W 1980 / 2000 MHz 8 GB | 16 GB | 163.4 |
| LG Gram 15Z90Q | i5-1240P 43 W / 13 W | Iris Xe G7 80EUs 1300 / 2600 MHz | 16 GB | 164.3 |
| Acer Nitro 17 AN17-41-R9LN | R7 7735HS 100 W / 65 W | GeForce RTX 4070 Laptop GPU 140 W 1980 / 1963 MHz 8 GB | 16 GB | 165 |
| Lenovo ThinkPad X1 Carbon G9-20XWCTO1WW | i7-1165G7 36 W / 28 W | Iris Xe G7 96EUs | 32 GB | 171.3 |
| Dell XPS 17 9720 RTX 3060 | i7-12700H 155 W / 55 W | GeForce RTX 3060 Laptop GPU 65 W 1282 / 1500 MHz 6 GB | 32 GB | 179.9 |
| Asus ProArt StudioBook 16 H7600ZW | i9-12900H 115 W / 110 W | GeForce RTX 3070 Ti Laptop GPU 115 W 8 GB | 32 GB | 179.9 |
| Alienware x15 R2 P111F | i9-12900H 140 W / 140 W | GeForce RTX 3080 Ti Laptop GPU 140 W 16 GB | 32 GB | 187.2 |
| Lenovo Legion 5 Pro 16ARH7H RTX 3070 Ti | R7 6800H 90 W / 90 W | GeForce RTX 3070 Ti Laptop GPU 150 W 1510 / 1800 MHz 8 GB | 32 GB | 194.3 |
| Razer Blade 14 Ryzen 9 6900HX | R9 6900HX 90 W / 75 W | GeForce RTX 3070 Ti Laptop GPU 100 W 1035 / 1500 MHz 8 GB | 16 GB | 197.4 |
| Razer Blade 14 RZ09-0508 | R9 8945HS 90 W / 75 W | GeForce RTX 4070 Laptop GPU 140 W 1605 / 2000 MHz 8 GB | 32 GB | 201.6 |
| Alienware m16 R2 | Ultra 7 155H 121 W / 102 W | GeForce RTX 4070 Laptop GPU 140 W 2005 / 2013 MHz 8 GB | 16 GB | 201.9 |
| Razer Blade 14 RTX 4070 | R9 7940HS 88 W / 80 W | GeForce RTX 4070 Laptop GPU 140 W 1980 / 2000 MHz 8 GB | 16 GB | 202.6 |
| MSI Prestige 13 AI Evo 6.0.1 x64 1024 MiB [C: 14.6% (135.6/931.1 GiB)] (x5) [Interval=5 sec] | Ultra 7 155H | Arc 8-Core | 32 GB | 205 |
| Razer Blade 16 RTX 5080 | Ryzen AI 9 365 80 W / 75 W | GeForce RTX 5080 Laptop 160 W 1500 / 1750 MHz 16 GB | 32 GB | 207.2 |
| Medion Erazer Beast X30 | i9-12900HK 120 W / 120 W | GeForce RTX 3080 Ti Laptop GPU 175 W 1590 / 2000 MHz 16 GB | 32 GB | 209 |
| Lenovo Yoga 9i 14 2022 i7-1260P 6.0.1 x64 1024 MiB [C: 8.3% (79.4/951.6 GiB)] (x5) [Interval=5 sec] | i7-1260P 64 W / 38 W | Iris Xe G7 96EUs 1400 / 2600 MHz | 16 GB | 210.14 |
| Nubia RedMagic Titan 16 Pro | i9-14900HX 140 W / 45 W | GeForce RTX 4060 Laptop GPU 140 W 2250 / 2000 MHz 8 GB | 16 GB | 211.6 |
| Razer Blade 15 OLED (Early 2022) | i9-12900H 160 W / 65 W | GeForce RTX 3070 Ti Laptop GPU 110 W 1035 / 1500 MHz 8 GB | 16 GB | 213.2 |
| Asus ExpertBook B7 Flip B7402FEA | i7-1195G7 51 W / 35 W | Iris Xe G7 96EUs 1400 MHz | 16 GB | 219.3 |
| Razer Blade 17 (i7-12800H, RTX 3070 Ti) 6.0.0 x64 1024 MiB [C: 13.7% (127.7/934.5 GiB)] (x5) [Interval=5 sec] | i7-12800H 110 W / 60 W | GeForce RTX 3070 Ti Laptop GPU 150 W 8 GB | 16 GB | 220.27 |
| Razer Blade 14 2025 6.0.1 x64 1024 MiB [C: 9.7% (90.3/927.8 GiB)] (x5) [Interval=5 sec] | Ryzen AI 9 365 70 W / 60 W | GeForce RTX 5070 Laptop 115 W 2632 / 1500 MHz | 32 GB | 222 |
| Razer Blade 17 RTX 3080 Ti | i7-12800H 107 W / 61 W | GeForce RTX 3080 Ti Laptop GPU 165 W 1395 / 2000 MHz 16 GB | 32 GB | 222.4 |
| LG Gram 17 (2023) | i7-1360P 43 W / 26 W | Iris Xe G7 96EUs 1400 MHz | 16 GB | 223.1 |
| Alienware m15 R6, i7-11800H RTX 3080 | i7-11800H 90 W / 50 W | GeForce RTX 3080 Laptop GPU 125 W 8 GB | 32 GB | 225.7 |
| Maingear Vector Pro MG-VCP17 | i7-11800H 120 W / 120 W | GeForce RTX 3080 Laptop GPU 165 W 1605 / 1750 MHz 16 GB | 32 GB | 227.2 |
| Acer Predator Helios 300 (i7-12700H, RTX 3070 Ti) 6.0.0 x64 1024 MiB [C: 37.2% (354.4/952.6 GiB)] (x5) [Interval=5 sec] | i7-12700H 115 W / 115 W | GeForce RTX 3070 Ti Laptop GPU 150 W 8 GB | 32 GB | 227.49 |
| MSI Summit E14 Flip Evo A12MT | i7-1260P 72 W / 28 W | Iris Xe G7 96EUs 1400 / 2400 MHz | 32 GB | 227.9 |
| Razer Blade 17 Early 2022 | i9-12900H 160 W / 65 W | GeForce RTX 3080 Ti Laptop GPU 165 W 1395 / 2000 MHz 16 GB | 32 GB | 228.2 |
| Aorus 15P YD | i7-11800H 109 W / 45 W | GeForce RTX 3080 Laptop GPU 130 W 1545 / 1750 MHz 8 GB | 16 GB | 230.4 |
| Gigabyte Aero 15 OLED XD | i7-11800H @4.6 GHz 109 W / 62 W | GeForce RTX 3070 Laptop GPU 105 W 1290 / 1500 MHz 8 GB | 32 GB | 231.4 |
| Acer Nitro 5 AN515-58-72QR | i7-12700H 115 W / 80 W | GeForce RTX 3070 Ti Laptop GPU 150 W 1410 / 1750 MHz 8 GB | 16 GB | 232.7 |
| Lenovo Legion Pro 5 16ARX8 | R7 7745HX 110 W / 97 W | GeForce RTX 4070 Laptop GPU 140 W 1755 / 2050 MHz 8 GB | 16 GB | 233.3 |
| Razer Blade 17 RTX 3070 | i7-11800H 160 W / 65 W | GeForce RTX 3070 Laptop GPU 130 W 1410 / 1500 MHz 8 GB | 16 GB | 233.5 |
| MSI Stealth 14 Studio A13V 6.0.1 x64 1024 MiB [C: 38.8% (358.9/926.3 GiB)] (x5) [Interval=5 sec] | i7-13700H 110 W / 85 W | GeForce RTX 4050 Laptop GPU 90 W 2370 / 2000 MHz 6 GB | 16 GB | 238 |
| MSI CreatorPro Z16P B12UKST 6.0.1 x64 1024 MiB [C: 9.7% (90.5/934.1 GiB)] (x5) [Interval=5 sec] | i7-12700H 74 W / 64 W | RTX A3000 Laptop GPU 90 W 1440 / 1750 MHz 12 GB | 32 GB | 238.39 |
| MSI GE76 Raider 11UH-472US | i9-11980HK 200 W / 91.75 W | GeForce RTX 3080 Laptop GPU 165 W 1710 / 1750 MHz 16 GB | 64 GB | 238.8 |
| Lenovo Legion 5 16IRX G9 6.0.1 x64 1024 MiB [C: 7.7% (73.7/951.6 GiB)] (x5) [Interval=5 sec] | i7-14650HX 140 W / 100 W | GeForce RTX 4060 Laptop GPU 125 W 2430 / 2050 MHz 8 GB | 16 GB | 241 |
| Lenovo ThinkPad X1 Yoga G6-20Y0S00200 5.2.1 x64 1024 MiB [C: 9.3% (88.3/953.3 GiB)] (x5) [Interval=5 sec] | i7-1165G7 48 W / 28 W | Iris Xe G7 96EUs | 32 GB | 241.9 |
| Razer Blade 15 Advanced Model Early 2022 5.2.0 x64 1024 MiB [C: 51.4% (480.7/934.5 GiB)] (x5) [Interval=5 sec] | i7-12800H 160 W / 65 W | GeForce RTX 3080 Ti Laptop GPU 110 W 1125 / 1750 MHz 16 GB | 32 GB | 242.96 |
| MSI Titan GT77 12UHS | i9-12900HX 200 W / 125 W | GeForce RTX 3080 Ti Laptop GPU 175 W 16 GB | 64 GB | 243.5 |
| Lenovo Legion Pro 7 RTX4090 | i9-13900HX 185 W / 130 W | GeForce RTX 4090 Laptop GPU 175 W 1455 / 2250 MHz 16 GB | 32 GB | 244.3 |
| Lenovo Legion Pro 5 16IRX9 G9 6.0.0 x64 1024 MiB [C: 27.0% (257.1/951.6 GiB)] (x5) [Interval=5 sec] | i7-14700HX 190 W / 130 W | GeForce RTX 4060 Laptop GPU 140 W 8 GB | 32 GB | 245 |
| Lenovo Legion Pro 7 16IRX8H | i9-13900HX 185 W / 130 W | GeForce RTX 4080 Laptop GPU 175 W 1665 / 2250 MHz 12 GB | 32 GB | 246.2 |
| Lenovo Legion Slim 7i 16 Gen 8 | i9-13900H 107 W / 81 W | GeForce RTX 4070 Laptop GPU 140 W 1845 / 2050 MHz 8 GB | 16 GB | 247.4 |
| Lenovo Legion Pro 5 16IRX9 | i9-14900HX 187 W / 104 W | GeForce RTX 4070 Laptop GPU 140 W 1705 / 2050 MHz 8 GB | 32 GB | 251.7 |
| Lenovo Legion 5 Pro 16 G7 i7 RTX 3070Ti 6.0.1 x64 1024 MiB [C: 9.5% (90.8/951.6 GiB)] (x5) [Interval=5 sec] | i7-12700H 124 W / 108 W | GeForce RTX 3070 Ti Laptop GPU 150 W 1702 / 1750 MHz 8 GB | 16 GB | 263.4 |
| Asus ExpertBook B2 Flip B2502FBA-N80141X | i7-1260P 64 W / 28 W | Iris Xe G7 96EUs 1400 MHz | 32 GB | 267.2 |
| MSI GE67 HX 12UGS | i7-12800HX 190 W / 110 W | GeForce RTX 3070 Ti Laptop GPU 150 W 1555 / 1750 MHz 8 GB | 16 GB | 269.4 |
| Acer Swift X SFX14-71G 6.0.1 x64 1024 MiB [C: 6.5% (61.6/952.6 GiB)] (x5) [Interval=5 sec] | i7-13700H 80 W / 40 W | GeForce RTX 4050 Laptop GPU 50 W 1605 / 2000 MHz 6 GB | 16 GB | 270 |
| Model | CPU | GPU | RAM | Value |
|---|---|---|---|---|
| Lenovo Yoga Pro 9 16IMH9 RTX 4050 | Ultra 9 185H 120 W / 83 W | GeForce RTX 4050 Laptop GPU 100 W 2055 / 2000 MHz 6 GB | 32 GB | 52.38 |
| Dell Precision 7670 | i7-12850HX 153 W / 72 W | RTX A2000 Laptop GPU 95 W 1612 / 1750 MHz 8 GB | 32 GB | 59.74 |
| Lenovo Legion Pro 5 16IAX10, RTX 5070 6.0.0 x64 1024 MiB [C: 77.9% (741.5/951.6 GiB)] (x5) [Interval=5 sec] | Ultra 7 255HX 185 W / 125 W | GeForce RTX 5070 Laptop 115 W | 32 GB | 61.8 |
| Lenovo Yoga Pro 9 16IMH9 6.0.1 x64 1024 MiB [C: 8.8% (83.4/951.6 GiB)] (x5) [Interval=5 sec] | Ultra 9 185H 115 W / 80 W | GeForce RTX 4070 Laptop GPU 100 W 2175 / 2000 MHz 8 GB | 32 GB | 63 |
| Lenovo Yoga Pro 7 14IMH9 | Ultra 7 155H 64 W / 55 W | Arc 8-Core 0.1 GB | 32 GB | 65.47 |
| Lenovo Legion Pro 7i 16 Gen 10 | Ultra 9 275HX 201 W / 156 W | GeForce RTX 5080 Laptop 175 W 1650 / 1788 MHz 16 GB | 32 GB | 68.03 |
| Lenovo Legion S7 16ARHA7 | R9 6900HX 103 W / 85 W | Radeon RX 6800S 90 W 1481 / 2000 MHz 8 GB | 16 GB | 68.22 |
| Lenovo Legion Slim 5 14APH8 | R7 7840HS 92 W / 83 W | GeForce RTX 4060 Laptop GPU 105 W 2040 / 2050 MHz 8 GB | 16 GB | 72.7 |
| Lenovo Legion Pro 7 16IRX9H | i9-14900HX 185 W / 130 W | GeForce RTX 4080 Laptop GPU 175 W 1665 / 2250 MHz 12 GB | 32 GB | 90 |
| Lenovo Legion 7 16 IRX G9 6.0.1 x64 1024 MiB [C: 9.0% (85.6/951.6 GiB)] (x5) [Interval=5 sec] | i9-14900HX 154 W / 90 W | GeForce RTX 4070 Laptop GPU 115 W 2480 / 2250 MHz 8 GB | 32 GB | 90.1 |
| Model | CPU | GPU | RAM | Value |
|---|---|---|---|---|
| HP Omen 16-n0033dx | R7 6800H 93 W / 64 W | Radeon RX 6650M 105 W ? / 2000 MHz 8 GB | 16 GB | 49.29 |
| Alienware x15 R2 P111F | i9-12900H 140 W / 140 W | GeForce RTX 3080 Ti Laptop GPU 140 W 16 GB | 32 GB | 52.41 |
| Lenovo Legion Pro 5 16IRX9 | i9-14900HX 187 W / 104 W | GeForce RTX 4070 Laptop GPU 140 W 1705 / 2050 MHz 8 GB | 32 GB | 58.86 |
| Lenovo Slim 7 Pro X 14ARH7 | R9 6900HS 65 W / 54 W | GeForce RTX 3050 4GB Laptop GPU 55 W 1057 / 1375 MHz 4 GB | 32 GB | 60.23 |
| Lenovo Yoga Pro 7 14ARP G8 6.0.1 x64 1024 MiB [C: 3.8% (36.3/953.1 GiB)] (x5) [Interval=5 sec] | R7 7735HS 60 W / 54 W | Radeon 680M | 16 GB | 60.3 |
| Eluktronics Mech-17 GP2 | i9-13900HX 160 W / 99 W | GeForce RTX 4090 Laptop GPU 175 W 2140 / 2375 MHz 16 GB | 32 GB | 61.83 |
| Asus Zenbook S 13 OLED 6.0.1 x64 1024 MiB [C: 4.9% (46.8/952.2 GiB)] (x5) [Interval=5 sec] | R7 6800U 30 W / 25 W | Radeon 680M 2200DC MHz | 16 GB | 67.08 |
| Lenovo Yoga Slim 7 14APU G8 6.0.1 x64 1024 MiB [C: 7.6% (72.4/951.6 GiB)] (x5) [Interval=5 sec] | R7 7840S 52 W / 42 W | Radeon 780M ? / 800 MHz | 32 GB | 67.7 |
| Dell XPS 14 2024 OLED 6.0.1 x64 1024 MiB [C: 9.2% (85.1/925.7 GiB)] (x5) [Interval=5 sec] | Ultra 7 155H 64 W / 30 W | GeForce RTX 4050 Laptop GPU 30 W 1605 / 2000 MHz 4 GB | 32 GB | 67.9 |
| HP ZBook Firefly 16 G9-6B897EA 6.0.1 x64 1024 MiB [C: 7.0% (66.5/952.7 GiB)] (x5) [Interval=5 sec] | i7-1265U 51 W / 12 W | T550 Laptop GPU 20 W 1665 / 1500 MHz 4 GB | 32 GB | 67.94 |
| Lenovo Yoga Pro 7 14APH G8 6.0.1 x64 1024 MiB [C: 15.9% (151.5/951.6 GiB)] (x5) [Interval=5 sec] | R7 7840HS 60 W / 54 W | Radeon 780M | 32 GB | 68.2 |
| Asus ROG Zephyrus G14 GA402XY 6.0.1 x64 1024 MiB [C: 8.2% (76.2/926.6 GiB)] (x5) [Interval=5 sec] | R9 7940HS 80 W / 80 W | GeForce RTX 4090 Laptop GPU 125 W 1455 / 2250 MHz 16 GB | 32 GB | 69 |
| LG Gram 16Z90Q | i7-1260P 43 W / 25 W | Iris Xe G7 96EUs 1400 / 2600 MHz | 16 GB | 70.34 |
| Lenovo Yoga Pro 7 14IRH G8 6.0.1 x64 1024 MiB [C: 13.8% (130.9/951.6 GiB)] (x5) [Interval=5 sec] | i7-13700H 80 W / 53 W | GeForce RTX 4050 Laptop GPU 55 W 1905 / 2000 MHz 6 GB | 16 GB | 71.8 |
| Uniwell Technology GM7AG8N Liquid Cooling Box | i9-12900H 140 W / 98 W | GeForce RTX 3080 Ti Laptop GPU 175 W 1590 / 2000 MHz 16 GB | 16 GB | 72.42 |
| Dell Precision 5480 | i9-13900H 88 W / 51 W | RTX 3000 Ada Generation Laptop 50 W 1530 / 2000 MHz 8 GB | 64 GB | 72.46 |
| Lenovo Legion 5 Pro 16ARH7H RTX 3070 Ti | R7 6800H 90 W / 90 W | GeForce RTX 3070 Ti Laptop GPU 150 W 1510 / 1800 MHz 8 GB | 32 GB | 72.6 |
| Lenovo Yoga Pro 9-14IRP G8 6.0.1 x64 1024 MiB [C: 8.6% (81.6/951.6 GiB)] (x5) [Interval=5 sec] | i7-13705H 104 W / 75 W | GeForce RTX 4050 Laptop GPU 80 W 2055 / 2000 MHz 6 GB | 32 GB | 72.6 |
| Lenovo Slim Pro 9i 16IRP8 | i9-13905H 123 W / 85 W | GeForce RTX 4050 Laptop GPU 100 W 2055 / 2000 MHz 6 GB | 32 GB | 72.95 |
| Dell Precision 5000 5470 | i9-12900H 91 W / 20 W | RTX A1000 Laptop GPU 40 W 1140 / 1375 MHz 4 GB | 32 GB | 73.28 |
| Lenovo Yoga Pro 9 16-IRP G8 6.0.1 x64 1024 MiB [C: 7.1% (67.9/951.6 GiB)] (x5) [Interval=5 sec] | i7-13705H 125 W / 80 W | GeForce RTX 4060 Laptop GPU 100 W 8 GB | 16 GB | 74 |
| Lenovo ThinkPad T14 G3-21AJS00400 6.0.1 x64 1024 MiB [C: 6.0% (57.5/951.6 GiB)] (x5) [Interval=5 sec] | i7-1260P 58 W / 42 W | GeForce MX550 30 W 1710 / 1500 MHz 2 GB | 16 GB | 74.9 |
| Lenovo Yoga Slim 7 Carbon 13IAP7-82U9005FGE 6.0.1 x64 1024 MiB [C: 19.6% (186.5/951.6 GiB)] (x5) [Interval=5 sec] | i7-1260P 46 W / 28 W | Iris Xe G7 96EUs 1400 / 2400 MHz | 16 GB | 76.14 |
| HP ZBook Power 15 G9 6B8C4EA 6.0.1 x64 1024 MiB [C: 7.2% (68.3/952.7 GiB)] (x5) [Interval=5 sec] | i7-12700H 90 W / 55 W | RTX A2000 Laptop GPU 45 W 1335 / 1368 MHz 8 GB | 32 GB | 76.6 |
| Asus ZenBook S13 OLED UX5304 6.0.1 x64 1024 MiB [C: 5.5% (52.1/952.4 GiB)] (x5) [Interval=5 sec] | i7-1355U 44 W / 17 W | Iris Xe G7 96EUs 1300 MHz | 16 GB | 76.9 |
| Razer Blade 16 RTX 5080 | Ryzen AI 9 365 80 W / 75 W | GeForce RTX 5080 Laptop 160 W 1500 / 1750 MHz 16 GB | 32 GB | 77.25 |
| Dell XPS 13 Plus 9320 4K 6.0.1 x64 1024 MiB [C: 15.9% (148.3/934.4 GiB)] (x5) [Interval=5 sec] | i7-1260P 64 W / 34 W | Iris Xe G7 96EUs 1400 MHz | 32 GB | 77.34 |
| Razer Blade 14 2025 6.0.1 x64 1024 MiB [C: 9.7% (90.3/927.8 GiB)] (x5) [Interval=5 sec] | Ryzen AI 9 365 70 W / 60 W | GeForce RTX 5070 Laptop 115 W 2632 / 1500 MHz | 32 GB | 77.4 |
| Acer Nitro 16 AN16-41 | R7 7735HS 100 W / 75 W | GeForce RTX 4070 Laptop GPU 140 W 1980 / 2000 MHz 8 GB | 16 GB | 78.15 |
| Acer Nitro 17 AN17-41-R9LN | R7 7735HS 100 W / 65 W | GeForce RTX 4070 Laptop GPU 140 W 1980 / 1963 MHz 8 GB | 16 GB | 78.62 |
| LG Gram 15Z90Q | i5-1240P 43 W / 13 W | Iris Xe G7 80EUs 1300 / 2600 MHz | 16 GB | 78.83 |
| Nubia RedMagic Titan 16 Pro | i9-14900HX 140 W / 45 W | GeForce RTX 4060 Laptop GPU 140 W 2250 / 2000 MHz 8 GB | 16 GB | 79.06 |
| Lenovo ThinkPad X1 Carbon G9-20XWCTO1WW | i7-1165G7 36 W / 28 W | Iris Xe G7 96EUs | 32 GB | 80.5 |
| Razer Blade 14 Ryzen 9 6900HX | R9 6900HX 90 W / 75 W | GeForce RTX 3070 Ti Laptop GPU 100 W 1035 / 1500 MHz 8 GB | 16 GB | 80.58 |
| Razer Blade 15 OLED (Early 2022) | i9-12900H 160 W / 65 W | GeForce RTX 3070 Ti Laptop GPU 110 W 1035 / 1500 MHz 8 GB | 16 GB | 80.7 |
| Razer Blade 14 RTX 4070 | R9 7940HS 88 W / 80 W | GeForce RTX 4070 Laptop GPU 140 W 1980 / 2000 MHz 8 GB | 16 GB | 81.48 |
| Dell XPS 17 9720 RTX 3060 | i7-12700H 155 W / 55 W | GeForce RTX 3060 Laptop GPU 65 W 1282 / 1500 MHz 6 GB | 32 GB | 81.97 |
| MSI Titan GT77 12UHS | i9-12900HX 200 W / 125 W | GeForce RTX 3080 Ti Laptop GPU 175 W 16 GB | 64 GB | 82.19 |
| Razer Blade 14 RZ09-0508 | R9 8945HS 90 W / 75 W | GeForce RTX 4070 Laptop GPU 140 W 1605 / 2000 MHz 8 GB | 32 GB | 83.06 |
| Alienware m15 R6, i7-11800H RTX 3080 | i7-11800H 90 W / 50 W | GeForce RTX 3080 Laptop GPU 125 W 8 GB | 32 GB | 83.1 |
| Asus ProArt StudioBook 16 H7600ZW | i9-12900H 115 W / 110 W | GeForce RTX 3070 Ti Laptop GPU 115 W 8 GB | 32 GB | 83.33 |
| Lenovo Legion Pro 5 16ARX8 | R7 7745HX 110 W / 97 W | GeForce RTX 4070 Laptop GPU 140 W 1755 / 2050 MHz 8 GB | 16 GB | 83.67 |
| Lenovo Legion Pro 5 16IRX9 G9 6.0.0 x64 1024 MiB [C: 27.0% (257.1/951.6 GiB)] (x5) [Interval=5 sec] | i7-14700HX 190 W / 130 W | GeForce RTX 4060 Laptop GPU 140 W 8 GB | 32 GB | 83.7 |
| Lenovo Legion Pro 7 16IRX8H | i9-13900HX 185 W / 130 W | GeForce RTX 4080 Laptop GPU 175 W 1665 / 2250 MHz 12 GB | 32 GB | 84.92 |
| Asus Zenbook 17 Fold UX9702 6.0.1 x64 1024 MiB [C: 5.2% (49.4/952.5 GiB)] (x5) [Interval=5 sec] | i7-1250U 29 W / 16 W | Iris Xe G7 80EUs 950 MHz | 16 GB | 85.26 |
| MSI Prestige 13 AI Evo 6.0.1 x64 1024 MiB [C: 14.6% (135.6/931.1 GiB)] (x5) [Interval=5 sec] | Ultra 7 155H | Arc 8-Core | 32 GB | 86.7 |
| Alienware m16 R2 | Ultra 7 155H 121 W / 102 W | GeForce RTX 4070 Laptop GPU 140 W 2005 / 2013 MHz 8 GB | 16 GB | 87.53 |
| Medion Erazer Beast X30 | i9-12900HK 120 W / 120 W | GeForce RTX 3080 Ti Laptop GPU 175 W 1590 / 2000 MHz 16 GB | 32 GB | 87.77 |
| MSI GE76 Raider 11UH-472US | i9-11980HK 200 W / 91.75 W | GeForce RTX 3080 Laptop GPU 165 W 1710 / 1750 MHz 16 GB | 64 GB | 88 |
| Maingear Vector Pro MG-VCP17 | i7-11800H 120 W / 120 W | GeForce RTX 3080 Laptop GPU 165 W 1605 / 1750 MHz 16 GB | 32 GB | 89 |
| Asus ExpertBook B7 Flip B7402FEA | i7-1195G7 51 W / 35 W | Iris Xe G7 96EUs 1400 MHz | 16 GB | 89.2 |
| Lenovo Yoga 9i 14 2022 i7-1260P 6.0.1 x64 1024 MiB [C: 8.3% (79.4/951.6 GiB)] (x5) [Interval=5 sec] | i7-1260P 64 W / 38 W | Iris Xe G7 96EUs 1400 / 2600 MHz | 16 GB | 89.41 |
| Gigabyte Aero 15 OLED XD | i7-11800H @4.6 GHz 109 W / 62 W | GeForce RTX 3070 Laptop GPU 105 W 1290 / 1500 MHz 8 GB | 32 GB | 89.5 |
| Razer Blade 17 (i7-12800H, RTX 3070 Ti) 6.0.0 x64 1024 MiB [C: 13.7% (127.7/934.5 GiB)] (x5) [Interval=5 sec] | i7-12800H 110 W / 60 W | GeForce RTX 3070 Ti Laptop GPU 150 W 8 GB | 16 GB | 89.6 |
| Razer Blade 17 RTX 3080 Ti | i7-12800H 107 W / 61 W | GeForce RTX 3080 Ti Laptop GPU 165 W 1395 / 2000 MHz 16 GB | 32 GB | 89.8 |
| Razer Blade 17 RTX 3070 | i7-11800H 160 W / 65 W | GeForce RTX 3070 Laptop GPU 130 W 1410 / 1500 MHz 8 GB | 16 GB | 90.1 |
| LG Gram 17 (2023) | i7-1360P 43 W / 26 W | Iris Xe G7 96EUs 1400 MHz | 16 GB | 90.18 |
| Razer Blade 17 Early 2022 | i9-12900H 160 W / 65 W | GeForce RTX 3080 Ti Laptop GPU 165 W 1395 / 2000 MHz 16 GB | 32 GB | 90.25 |
| Acer Predator Helios 300 (i7-12700H, RTX 3070 Ti) 6.0.0 x64 1024 MiB [C: 37.2% (354.4/952.6 GiB)] (x5) [Interval=5 sec] | i7-12700H 115 W / 115 W | GeForce RTX 3070 Ti Laptop GPU 150 W 8 GB | 32 GB | 90.69 |
| MSI Summit E14 Flip Evo A12MT | i7-1260P 72 W / 28 W | Iris Xe G7 96EUs 1400 / 2400 MHz | 32 GB | 90.75 |
| Lenovo Legion Pro 7 RTX4090 | i9-13900HX 185 W / 130 W | GeForce RTX 4090 Laptop GPU 175 W 1455 / 2250 MHz 16 GB | 32 GB | 91.26 |
| Acer Nitro 5 AN515-58-72QR | i7-12700H 115 W / 80 W | GeForce RTX 3070 Ti Laptop GPU 150 W 1410 / 1750 MHz 8 GB | 16 GB | 91.58 |
| Aorus 15P YD | i7-11800H 109 W / 45 W | GeForce RTX 3080 Laptop GPU 130 W 1545 / 1750 MHz 8 GB | 16 GB | 91.8 |
| MSI CreatorPro Z16P B12UKST 6.0.1 x64 1024 MiB [C: 9.7% (90.5/934.1 GiB)] (x5) [Interval=5 sec] | i7-12700H 74 W / 64 W | RTX A3000 Laptop GPU 90 W 1440 / 1750 MHz 12 GB | 32 GB | 92.21 |
| Razer Blade 15 Advanced Model Early 2022 5.2.0 x64 1024 MiB [C: 51.4% (480.7/934.5 GiB)] (x5) [Interval=5 sec] | i7-12800H 160 W / 65 W | GeForce RTX 3080 Ti Laptop GPU 110 W 1125 / 1750 MHz 16 GB | 32 GB | 92.87 |
| Lenovo ThinkPad X1 Yoga G6-20Y0S00200 5.2.1 x64 1024 MiB [C: 9.3% (88.3/953.3 GiB)] (x5) [Interval=5 sec] | i7-1165G7 48 W / 28 W | Iris Xe G7 96EUs | 32 GB | 93 |
| Lenovo Legion Slim 7i 16 Gen 8 | i9-13900H 107 W / 81 W | GeForce RTX 4070 Laptop GPU 140 W 1845 / 2050 MHz 8 GB | 16 GB | 93.35 |
| Lenovo Legion 5 16IRX G9 6.0.1 x64 1024 MiB [C: 7.7% (73.7/951.6 GiB)] (x5) [Interval=5 sec] | i7-14650HX 140 W / 100 W | GeForce RTX 4060 Laptop GPU 125 W 2430 / 2050 MHz 8 GB | 16 GB | 93.5 |
| MSI Stealth 14 Studio A13V 6.0.1 x64 1024 MiB [C: 38.8% (358.9/926.3 GiB)] (x5) [Interval=5 sec] | i7-13700H 110 W / 85 W | GeForce RTX 4050 Laptop GPU 90 W 2370 / 2000 MHz 6 GB | 16 GB | 93.7 |
| Asus ExpertBook B2 Flip B2502FBA-N80141X | i7-1260P 64 W / 28 W | Iris Xe G7 96EUs 1400 MHz | 32 GB | 95.81 |
| Lenovo Legion 5 Pro 16 G7 i7 RTX 3070Ti 6.0.1 x64 1024 MiB [C: 9.5% (90.8/951.6 GiB)] (x5) [Interval=5 sec] | i7-12700H 124 W / 108 W | GeForce RTX 3070 Ti Laptop GPU 150 W 1702 / 1750 MHz 8 GB | 16 GB | 95.9 |
| Acer Swift X SFX14-71G 6.0.1 x64 1024 MiB [C: 6.5% (61.6/952.6 GiB)] (x5) [Interval=5 sec] | i7-13700H 80 W / 40 W | GeForce RTX 4050 Laptop GPU 50 W 1605 / 2000 MHz 6 GB | 16 GB | 96 |
| MSI GE67 HX 12UGS | i7-12800HX 190 W / 110 W | GeForce RTX 3070 Ti Laptop GPU 150 W 1555 / 1750 MHz 8 GB | 16 GB | 96.32 |
| Model | CPU | GPU | RAM | Value |
|---|---|---|---|---|
| Lenovo Legion Pro 7i 16 Gen 10 | Ultra 9 275HX 201 W / 156 W | GeForce RTX 5080 Laptop 175 W 1650 / 1788 MHz 16 GB | 32 GB | 1724 |
| Lenovo Yoga Pro 9 16IMH9 RTX 4050 | Ultra 9 185H 120 W / 83 W | GeForce RTX 4050 Laptop GPU 100 W 2055 / 2000 MHz 6 GB | 32 GB | 3077 |
| Lenovo Yoga Pro 7 14IMH9 | Ultra 7 155H 64 W / 55 W | Arc 8-Core 0.1 GB | 32 GB | 3170 |
| Lenovo Legion S7 16ARHA7 | R9 6900HX 103 W / 85 W | Radeon RX 6800S 90 W 1481 / 2000 MHz 8 GB | 16 GB | 3820 |
| Lenovo Legion Slim 5 14APH8 | R7 7840HS 92 W / 83 W | GeForce RTX 4060 Laptop GPU 105 W 2040 / 2050 MHz 8 GB | 16 GB | 5209 |
| Lenovo Legion Pro 7 16IRX9H | i9-14900HX 185 W / 130 W | GeForce RTX 4080 Laptop GPU 175 W 1665 / 2250 MHz 12 GB | 32 GB | 5246 |
| Dell Precision 7670 | i7-12850HX 153 W / 72 W | RTX A2000 Laptop GPU 95 W 1612 / 1750 MHz 8 GB | 32 GB | 7455 |
| Model | CPU | GPU | RAM | Value |
|---|---|---|---|---|
| Lenovo Yoga Pro 7 14IMH9 | Ultra 7 155H 64 W / 55 W | Arc 8-Core 0.1 GB | 32 GB | 3846 |
| Lenovo Legion Pro 7i 16 Gen 10 | Ultra 9 275HX 201 W / 156 W | GeForce RTX 5080 Laptop 175 W 1650 / 1788 MHz 16 GB | 32 GB | 4383 |
| Lenovo Yoga Pro 9 16IMH9 RTX 4050 | Ultra 9 185H 120 W / 83 W | GeForce RTX 4050 Laptop GPU 100 W 2055 / 2000 MHz 6 GB | 32 GB | 4549 |
| Lenovo Legion S7 16ARHA7 | R9 6900HX 103 W / 85 W | Radeon RX 6800S 90 W 1481 / 2000 MHz 8 GB | 16 GB | 4888 |
| Lenovo Legion Pro 7 16IRX9H | i9-14900HX 185 W / 130 W | GeForce RTX 4080 Laptop GPU 175 W 1665 / 2250 MHz 12 GB | 32 GB | 5645 |
| Lenovo Legion Slim 5 14APH8 | R7 7840HS 92 W / 83 W | GeForce RTX 4060 Laptop GPU 105 W 2040 / 2050 MHz 8 GB | 16 GB | 5853 |
| Dell Precision 7670 | i7-12850HX 153 W / 72 W | RTX A2000 Laptop GPU 95 W 1612 / 1750 MHz 8 GB | 32 GB | 8284 |
| Model | CPU | GPU | RAM | Value |
|---|---|---|---|---|
| Lenovo Yoga Pro 7 14IMH9 | Ultra 7 155H 64 W / 55 W | Arc 8-Core 0.1 GB | 32 GB | 389.3 |
| Lenovo Legion Slim 5 14APH8 | R7 7840HS 92 W / 83 W | GeForce RTX 4060 Laptop GPU 105 W 2040 / 2050 MHz 8 GB | 16 GB | 431.6 |
| Lenovo Yoga Pro 9 16IMH9 6.0.1 x64 1024 MiB [C: 8.8% (83.4/951.6 GiB)] (x5) [Interval=5 sec] | Ultra 9 185H 115 W / 80 W | GeForce RTX 4070 Laptop GPU 100 W 2175 / 2000 MHz 8 GB | 32 GB | 463 |
| Lenovo Yoga Pro 9 16IMH9 RTX 4050 | Ultra 9 185H 120 W / 83 W | GeForce RTX 4050 Laptop GPU 100 W 2055 / 2000 MHz 6 GB | 32 GB | 470.6 |
| Lenovo Legion Pro 7 16IRX9H | i9-14900HX 185 W / 130 W | GeForce RTX 4080 Laptop GPU 175 W 1665 / 2250 MHz 12 GB | 32 GB | 506.4 |
| Lenovo Legion 7 16 IRX G9 6.0.1 x64 1024 MiB [C: 9.0% (85.6/951.6 GiB)] (x5) [Interval=5 sec] | i9-14900HX 154 W / 90 W | GeForce RTX 4070 Laptop GPU 115 W 2480 / 2250 MHz 8 GB | 32 GB | 527 |
| Dell Precision 7670 | i7-12850HX 153 W / 72 W | RTX A2000 Laptop GPU 95 W 1612 / 1750 MHz 8 GB | 32 GB | 536.6 |
| Lenovo Legion S7 16ARHA7 | R9 6900HX 103 W / 85 W | Radeon RX 6800S 90 W 1481 / 2000 MHz 8 GB | 16 GB | 693.6 |
| Lenovo Legion Pro 5 16IAX10, RTX 5070 6.0.0 x64 1024 MiB [C: 77.9% (741.5/951.6 GiB)] (x5) [Interval=5 sec] | Ultra 7 255HX 185 W / 125 W | GeForce RTX 5070 Laptop 115 W | 32 GB | 756 |
| Lenovo Legion Pro 7i 16 Gen 10 | Ultra 9 275HX 201 W / 156 W | GeForce RTX 5080 Laptop 175 W 1650 / 1788 MHz 16 GB | 32 GB | 791.3 |
| Model | CPU | GPU | RAM | Value |
|---|---|---|---|---|
| HP ZBook Firefly 16 G9-6B897EA 6.0.1 x64 1024 MiB [C: 7.0% (66.5/952.7 GiB)] (x5) [Interval=5 sec] | i7-1265U 51 W / 12 W | T550 Laptop GPU 20 W 1665 / 1500 MHz 4 GB | 32 GB | 315.45 |
| Lenovo Slim 7 Pro X 14ARH7 | R9 6900HS 65 W / 54 W | GeForce RTX 3050 4GB Laptop GPU 55 W 1057 / 1375 MHz 4 GB | 32 GB | 325.8 |
| Uniwell Technology GM7AG8N Liquid Cooling Box | i9-12900H 140 W / 98 W | GeForce RTX 3080 Ti Laptop GPU 175 W 1590 / 2000 MHz 16 GB | 16 GB | 341.5 |
| Asus Zenbook 17 Fold UX9702 6.0.1 x64 1024 MiB [C: 5.2% (49.4/952.5 GiB)] (x5) [Interval=5 sec] | i7-1250U 29 W / 16 W | Iris Xe G7 80EUs 950 MHz | 16 GB | 348.19 |
| LG Gram 16Z90Q | i7-1260P 43 W / 25 W | Iris Xe G7 96EUs 1400 / 2600 MHz | 16 GB | 352.9 |
| Asus ZenBook S13 OLED UX5304 6.0.1 x64 1024 MiB [C: 5.5% (52.1/952.4 GiB)] (x5) [Interval=5 sec] | i7-1355U 44 W / 17 W | Iris Xe G7 96EUs 1300 MHz | 16 GB | 355 |
| Lenovo Yoga Pro 7 14ARP G8 6.0.1 x64 1024 MiB [C: 3.8% (36.3/953.1 GiB)] (x5) [Interval=5 sec] | R7 7735HS 60 W / 54 W | Radeon 680M | 16 GB | 356 |
| Lenovo Yoga Slim 7 Carbon 13IAP7-82U9005FGE 6.0.1 x64 1024 MiB [C: 19.6% (186.5/951.6 GiB)] (x5) [Interval=5 sec] | i7-1260P 46 W / 28 W | Iris Xe G7 96EUs 1400 / 2400 MHz | 16 GB | 361.36 |
| Lenovo ThinkPad T14 G3-21AJS00400 6.0.1 x64 1024 MiB [C: 6.0% (57.5/951.6 GiB)] (x5) [Interval=5 sec] | i7-1260P 58 W / 42 W | GeForce MX550 30 W 1710 / 1500 MHz 2 GB | 16 GB | 375 |
| Dell XPS 13 Plus 9320 4K 6.0.1 x64 1024 MiB [C: 15.9% (148.3/934.4 GiB)] (x5) [Interval=5 sec] | i7-1260P 64 W / 34 W | Iris Xe G7 96EUs 1400 MHz | 32 GB | 375.49 |
| Dell XPS 14 2024 OLED 6.0.1 x64 1024 MiB [C: 9.2% (85.1/925.7 GiB)] (x5) [Interval=5 sec] | Ultra 7 155H 64 W / 30 W | GeForce RTX 4050 Laptop GPU 30 W 1605 / 2000 MHz 4 GB | 32 GB | 378 |
| MSI Prestige 13 AI Evo 6.0.1 x64 1024 MiB [C: 14.6% (135.6/931.1 GiB)] (x5) [Interval=5 sec] | Ultra 7 155H | Arc 8-Core | 32 GB | 385 |
| Razer Blade 14 RZ09-0508 | R9 8945HS 90 W / 75 W | GeForce RTX 4070 Laptop GPU 140 W 1605 / 2000 MHz 8 GB | 32 GB | 391.8 |
| Dell Precision 5000 5470 | i9-12900H 91 W / 20 W | RTX A1000 Laptop GPU 40 W 1140 / 1375 MHz 4 GB | 32 GB | 395.7 |
| Lenovo Yoga Pro 7 14IRH G8 6.0.1 x64 1024 MiB [C: 13.8% (130.9/951.6 GiB)] (x5) [Interval=5 sec] | i7-13700H 80 W / 53 W | GeForce RTX 4050 Laptop GPU 55 W 1905 / 2000 MHz 6 GB | 16 GB | 397 |
| Alienware m16 R2 | Ultra 7 155H 121 W / 102 W | GeForce RTX 4070 Laptop GPU 140 W 2005 / 2013 MHz 8 GB | 16 GB | 398.8 |
| HP ZBook Power 15 G9 6B8C4EA 6.0.1 x64 1024 MiB [C: 7.2% (68.3/952.7 GiB)] (x5) [Interval=5 sec] | i7-12700H 90 W / 55 W | RTX A2000 Laptop GPU 45 W 1335 / 1368 MHz 8 GB | 32 GB | 400.34 |
| Acer Predator Helios 300 (i7-12700H, RTX 3070 Ti) 6.0.0 x64 1024 MiB [C: 37.2% (354.4/952.6 GiB)] (x5) [Interval=5 sec] | i7-12700H 115 W / 115 W | GeForce RTX 3070 Ti Laptop GPU 150 W 8 GB | 32 GB | 403.78 |
| Acer Nitro 17 AN17-41-R9LN | R7 7735HS 100 W / 65 W | GeForce RTX 4070 Laptop GPU 140 W 1980 / 1963 MHz 8 GB | 16 GB | 405.5 |
| Lenovo Yoga 9i 14 2022 i7-1260P 6.0.1 x64 1024 MiB [C: 8.3% (79.4/951.6 GiB)] (x5) [Interval=5 sec] | i7-1260P 64 W / 38 W | Iris Xe G7 96EUs 1400 / 2600 MHz | 16 GB | 420.37 |
| Lenovo Yoga Slim 7 14APU G8 6.0.1 x64 1024 MiB [C: 7.6% (72.4/951.6 GiB)] (x5) [Interval=5 sec] | R7 7840S 52 W / 42 W | Radeon 780M ? / 800 MHz | 32 GB | 421 |
| Medion Erazer Beast X30 | i9-12900HK 120 W / 120 W | GeForce RTX 3080 Ti Laptop GPU 175 W 1590 / 2000 MHz 16 GB | 32 GB | 421.8 |
| LG Gram 15Z90Q | i5-1240P 43 W / 13 W | Iris Xe G7 80EUs 1300 / 2600 MHz | 16 GB | 425.2 |
| Lenovo Yoga Pro 7 14APH G8 6.0.1 x64 1024 MiB [C: 15.9% (151.5/951.6 GiB)] (x5) [Interval=5 sec] | R7 7840HS 60 W / 54 W | Radeon 780M | 32 GB | 427 |
| Acer Nitro 5 AN515-58-72QR | i7-12700H 115 W / 80 W | GeForce RTX 3070 Ti Laptop GPU 150 W 1410 / 1750 MHz 8 GB | 16 GB | 428.2 |
| Acer Nitro 16 AN16-41 | R7 7735HS 100 W / 75 W | GeForce RTX 4070 Laptop GPU 140 W 1980 / 2000 MHz 8 GB | 16 GB | 442.5 |
| Lenovo Yoga Pro 9-14IRP G8 6.0.1 x64 1024 MiB [C: 8.6% (81.6/951.6 GiB)] (x5) [Interval=5 sec] | i7-13705H 104 W / 75 W | GeForce RTX 4050 Laptop GPU 80 W 2055 / 2000 MHz 6 GB | 32 GB | 448 |
| Asus ROG Zephyrus G14 GA402XY 6.0.1 x64 1024 MiB [C: 8.2% (76.2/926.6 GiB)] (x5) [Interval=5 sec] | R9 7940HS 80 W / 80 W | GeForce RTX 4090 Laptop GPU 125 W 1455 / 2250 MHz 16 GB | 32 GB | 450 |
| Razer Blade 15 OLED (Early 2022) | i9-12900H 160 W / 65 W | GeForce RTX 3070 Ti Laptop GPU 110 W 1035 / 1500 MHz 8 GB | 16 GB | 454.2 |
| Lenovo Yoga Pro 9 16-IRP G8 6.0.1 x64 1024 MiB [C: 7.1% (67.9/951.6 GiB)] (x5) [Interval=5 sec] | i7-13705H 125 W / 80 W | GeForce RTX 4060 Laptop GPU 100 W 8 GB | 16 GB | 459 |
| MSI Summit E14 Flip Evo A12MT | i7-1260P 72 W / 28 W | Iris Xe G7 96EUs 1400 / 2400 MHz | 32 GB | 460.3 |
| Razer Blade 17 (i7-12800H, RTX 3070 Ti) 6.0.0 x64 1024 MiB [C: 13.7% (127.7/934.5 GiB)] (x5) [Interval=5 sec] | i7-12800H 110 W / 60 W | GeForce RTX 3070 Ti Laptop GPU 150 W 8 GB | 16 GB | 463.71 |
| Dell Precision 5480 | i9-13900H 88 W / 51 W | RTX 3000 Ada Generation Laptop 50 W 1530 / 2000 MHz 8 GB | 64 GB | 464.2 |
| Lenovo Slim Pro 9i 16IRP8 | i9-13905H 123 W / 85 W | GeForce RTX 4050 Laptop GPU 100 W 2055 / 2000 MHz 6 GB | 32 GB | 471.5 |
| Razer Blade 17 RTX 3080 Ti | i7-12800H 107 W / 61 W | GeForce RTX 3080 Ti Laptop GPU 165 W 1395 / 2000 MHz 16 GB | 32 GB | 475.2 |
| Razer Blade 17 Early 2022 | i9-12900H 160 W / 65 W | GeForce RTX 3080 Ti Laptop GPU 165 W 1395 / 2000 MHz 16 GB | 32 GB | 479.8 |
| Alienware x15 R2 P111F | i9-12900H 140 W / 140 W | GeForce RTX 3080 Ti Laptop GPU 140 W 16 GB | 32 GB | 482 |
| Eluktronics Mech-17 GP2 | i9-13900HX 160 W / 99 W | GeForce RTX 4090 Laptop GPU 175 W 2140 / 2375 MHz 16 GB | 32 GB | 494.9 |
| Razer Blade 14 RTX 4070 | R9 7940HS 88 W / 80 W | GeForce RTX 4070 Laptop GPU 140 W 1980 / 2000 MHz 8 GB | 16 GB | 497.7 |
| Lenovo Legion Pro 5 16IRX9 G9 6.0.0 x64 1024 MiB [C: 27.0% (257.1/951.6 GiB)] (x5) [Interval=5 sec] | i7-14700HX 190 W / 130 W | GeForce RTX 4060 Laptop GPU 140 W 8 GB | 32 GB | 498 |
| Lenovo Legion 5 Pro 16ARH7H RTX 3070 Ti | R7 6800H 90 W / 90 W | GeForce RTX 3070 Ti Laptop GPU 150 W 1510 / 1800 MHz 8 GB | 32 GB | 504.8 |
| Lenovo ThinkPad X1 Carbon G9-20XWCTO1WW | i7-1165G7 36 W / 28 W | Iris Xe G7 96EUs | 32 GB | 513 |
| Asus Zenbook S 13 OLED 6.0.1 x64 1024 MiB [C: 4.9% (46.8/952.2 GiB)] (x5) [Interval=5 sec] | R7 6800U 30 W / 25 W | Radeon 680M 2200DC MHz | 16 GB | 515.54 |
| Lenovo Legion 5 16IRX G9 6.0.1 x64 1024 MiB [C: 7.7% (73.7/951.6 GiB)] (x5) [Interval=5 sec] | i7-14650HX 140 W / 100 W | GeForce RTX 4060 Laptop GPU 125 W 2430 / 2050 MHz 8 GB | 16 GB | 517 |
| Razer Blade 14 Ryzen 9 6900HX | R9 6900HX 90 W / 75 W | GeForce RTX 3070 Ti Laptop GPU 100 W 1035 / 1500 MHz 8 GB | 16 GB | 517.1 |
| Lenovo Legion Pro 5 16IRX9 | i9-14900HX 187 W / 104 W | GeForce RTX 4070 Laptop GPU 140 W 1705 / 2050 MHz 8 GB | 32 GB | 524.8 |
| Dell XPS 17 9720 RTX 3060 | i7-12700H 155 W / 55 W | GeForce RTX 3060 Laptop GPU 65 W 1282 / 1500 MHz 6 GB | 32 GB | 536.8 |
| HP Omen 16-n0033dx | R7 6800H 93 W / 64 W | Radeon RX 6650M 105 W ? / 2000 MHz 8 GB | 16 GB | 537 |
| Razer Blade 17 RTX 3070 | i7-11800H 160 W / 65 W | GeForce RTX 3070 Laptop GPU 130 W 1410 / 1500 MHz 8 GB | 16 GB | 538 |
| Lenovo Legion Pro 7 16IRX8H | i9-13900HX 185 W / 130 W | GeForce RTX 4080 Laptop GPU 175 W 1665 / 2250 MHz 12 GB | 32 GB | 538 |
| Asus ProArt StudioBook 16 H7600ZW | i9-12900H 115 W / 110 W | GeForce RTX 3070 Ti Laptop GPU 115 W 8 GB | 32 GB | 540.4 |
| Alienware m15 R6, i7-11800H RTX 3080 | i7-11800H 90 W / 50 W | GeForce RTX 3080 Laptop GPU 125 W 8 GB | 32 GB | 544 |
| Razer Blade 16 RTX 5080 | Ryzen AI 9 365 80 W / 75 W | GeForce RTX 5080 Laptop 160 W 1500 / 1750 MHz 16 GB | 32 GB | 544.1 |
| Razer Blade 14 2025 6.0.1 x64 1024 MiB [C: 9.7% (90.3/927.8 GiB)] (x5) [Interval=5 sec] | Ryzen AI 9 365 70 W / 60 W | GeForce RTX 5070 Laptop 115 W 2632 / 1500 MHz | 32 GB | 549 |
| LG Gram 17 (2023) | i7-1360P 43 W / 26 W | Iris Xe G7 96EUs 1400 MHz | 16 GB | 559.2 |
| Asus ExpertBook B7 Flip B7402FEA | i7-1195G7 51 W / 35 W | Iris Xe G7 96EUs 1400 MHz | 16 GB | 560 |
| Lenovo Legion Pro 5 16ARX8 | R7 7745HX 110 W / 97 W | GeForce RTX 4070 Laptop GPU 140 W 1755 / 2050 MHz 8 GB | 16 GB | 562.5 |
| MSI Stealth 14 Studio A13V 6.0.1 x64 1024 MiB [C: 38.8% (358.9/926.3 GiB)] (x5) [Interval=5 sec] | i7-13700H 110 W / 85 W | GeForce RTX 4050 Laptop GPU 90 W 2370 / 2000 MHz 6 GB | 16 GB | 582 |
| Asus ExpertBook B2 Flip B2502FBA-N80141X | i7-1260P 64 W / 28 W | Iris Xe G7 96EUs 1400 MHz | 32 GB | 611.9 |
| Maingear Vector Pro MG-VCP17 | i7-11800H 120 W / 120 W | GeForce RTX 3080 Laptop GPU 165 W 1605 / 1750 MHz 16 GB | 32 GB | 614 |
| Razer Blade 15 Advanced Model Early 2022 5.2.0 x64 1024 MiB [C: 51.4% (480.7/934.5 GiB)] (x5) [Interval=5 sec] | i7-12800H 160 W / 65 W | GeForce RTX 3080 Ti Laptop GPU 110 W 1125 / 1750 MHz 16 GB | 32 GB | 631.75 |
| Lenovo Legion Slim 7i 16 Gen 8 | i9-13900H 107 W / 81 W | GeForce RTX 4070 Laptop GPU 140 W 1845 / 2050 MHz 8 GB | 16 GB | 641.1 |
| Gigabyte Aero 15 OLED XD | i7-11800H @4.6 GHz 109 W / 62 W | GeForce RTX 3070 Laptop GPU 105 W 1290 / 1500 MHz 8 GB | 32 GB | 648 |
| Lenovo Legion Pro 7 RTX4090 | i9-13900HX 185 W / 130 W | GeForce RTX 4090 Laptop GPU 175 W 1455 / 2250 MHz 16 GB | 32 GB | 652.7 |
| Aorus 15P YD | i7-11800H 109 W / 45 W | GeForce RTX 3080 Laptop GPU 130 W 1545 / 1750 MHz 8 GB | 16 GB | 656 |
| Lenovo Legion 5 Pro 16 G7 i7 RTX 3070Ti 6.0.1 x64 1024 MiB [C: 9.5% (90.8/951.6 GiB)] (x5) [Interval=5 sec] | i7-12700H 124 W / 108 W | GeForce RTX 3070 Ti Laptop GPU 150 W 1702 / 1750 MHz 8 GB | 16 GB | 661 |
| Lenovo ThinkPad X1 Yoga G6-20Y0S00200 5.2.1 x64 1024 MiB [C: 9.3% (88.3/953.3 GiB)] (x5) [Interval=5 sec] | i7-1165G7 48 W / 28 W | Iris Xe G7 96EUs | 32 GB | 672 |
| MSI CreatorPro Z16P B12UKST 6.0.1 x64 1024 MiB [C: 9.7% (90.5/934.1 GiB)] (x5) [Interval=5 sec] | i7-12700H 74 W / 64 W | RTX A3000 Laptop GPU 90 W 1440 / 1750 MHz 12 GB | 32 GB | 677.66 |
| MSI GE76 Raider 11UH-472US | i9-11980HK 200 W / 91.75 W | GeForce RTX 3080 Laptop GPU 165 W 1710 / 1750 MHz 16 GB | 64 GB | 699 |
| MSI GE67 HX 12UGS | i7-12800HX 190 W / 110 W | GeForce RTX 3070 Ti Laptop GPU 150 W 1555 / 1750 MHz 8 GB | 16 GB | 716.9 |
| MSI Titan GT77 12UHS | i9-12900HX 200 W / 125 W | GeForce RTX 3080 Ti Laptop GPU 175 W 16 GB | 64 GB | 744.5 |
| Nubia RedMagic Titan 16 Pro | i9-14900HX 140 W / 45 W | GeForce RTX 4060 Laptop GPU 140 W 2250 / 2000 MHz 8 GB | 16 GB | 747.9 |
| Acer Swift X SFX14-71G 6.0.1 x64 1024 MiB [C: 6.5% (61.6/952.6 GiB)] (x5) [Interval=5 sec] | i7-13700H 80 W / 40 W | GeForce RTX 4050 Laptop GPU 50 W 1605 / 2000 MHz 6 GB | 16 GB | 777 |
| Model | CPU | GPU | RAM | Value |
|---|---|---|---|---|
| Lenovo Yoga Pro 7 14IMH9 | Ultra 7 155H 64 W / 55 W | Arc 8-Core 0.1 GB | 32 GB | 414.8 |
| Lenovo Yoga Pro 9 16IMH9 6.0.1 x64 1024 MiB [C: 8.8% (83.4/951.6 GiB)] (x5) [Interval=5 sec] | Ultra 9 185H 115 W / 80 W | GeForce RTX 4070 Laptop GPU 100 W 2175 / 2000 MHz 8 GB | 32 GB | 417 |
| Lenovo Yoga Pro 9 16IMH9 RTX 4050 | Ultra 9 185H 120 W / 83 W | GeForce RTX 4050 Laptop GPU 100 W 2055 / 2000 MHz 6 GB | 32 GB | 439.4 |
| Lenovo Legion S7 16ARHA7 | R9 6900HX 103 W / 85 W | Radeon RX 6800S 90 W 1481 / 2000 MHz 8 GB | 16 GB | 498.9 |
| Lenovo Legion Pro 5 16IAX10, RTX 5070 6.0.0 x64 1024 MiB [C: 77.9% (741.5/951.6 GiB)] (x5) [Interval=5 sec] | Ultra 7 255HX 185 W / 125 W | GeForce RTX 5070 Laptop 115 W | 32 GB | 538 |
| Lenovo Legion Pro 7i 16 Gen 10 | Ultra 9 275HX 201 W / 156 W | GeForce RTX 5080 Laptop 175 W 1650 / 1788 MHz 16 GB | 32 GB | 552.3 |
| Lenovo Legion Slim 5 14APH8 | R7 7840HS 92 W / 83 W | GeForce RTX 4060 Laptop GPU 105 W 2040 / 2050 MHz 8 GB | 16 GB | 583.7 |
| Lenovo Legion Pro 7 16IRX9H | i9-14900HX 185 W / 130 W | GeForce RTX 4080 Laptop GPU 175 W 1665 / 2250 MHz 12 GB | 32 GB | 754 |
| Dell Precision 7670 | i7-12850HX 153 W / 72 W | RTX A2000 Laptop GPU 95 W 1612 / 1750 MHz 8 GB | 32 GB | 760.5 |
| Lenovo Legion 7 16 IRX G9 6.0.1 x64 1024 MiB [C: 9.0% (85.6/951.6 GiB)] (x5) [Interval=5 sec] | i9-14900HX 154 W / 90 W | GeForce RTX 4070 Laptop GPU 115 W 2480 / 2250 MHz 8 GB | 32 GB | 784 |
| Model | CPU | GPU | RAM | Value |
|---|---|---|---|---|
| HP ZBook Firefly 16 G9-6B897EA 6.0.1 x64 1024 MiB [C: 7.0% (66.5/952.7 GiB)] (x5) [Interval=5 sec] | i7-1265U 51 W / 12 W | T550 Laptop GPU 20 W 1665 / 1500 MHz 4 GB | 32 GB | 347.81 |
| Lenovo Slim 7 Pro X 14ARH7 | R9 6900HS 65 W / 54 W | GeForce RTX 3050 4GB Laptop GPU 55 W 1057 / 1375 MHz 4 GB | 32 GB | 349.9 |
| Dell XPS 14 2024 OLED 6.0.1 x64 1024 MiB [C: 9.2% (85.1/925.7 GiB)] (x5) [Interval=5 sec] | Ultra 7 155H 64 W / 30 W | GeForce RTX 4050 Laptop GPU 30 W 1605 / 2000 MHz 4 GB | 32 GB | 355 |
| Lenovo Yoga Pro 7 14ARP G8 6.0.1 x64 1024 MiB [C: 3.8% (36.3/953.1 GiB)] (x5) [Interval=5 sec] | R7 7735HS 60 W / 54 W | Radeon 680M | 16 GB | 362 |
| Dell XPS 13 Plus 9320 4K 6.0.1 x64 1024 MiB [C: 15.9% (148.3/934.4 GiB)] (x5) [Interval=5 sec] | i7-1260P 64 W / 34 W | Iris Xe G7 96EUs 1400 MHz | 32 GB | 371.42 |
| Asus Zenbook 17 Fold UX9702 6.0.1 x64 1024 MiB [C: 5.2% (49.4/952.5 GiB)] (x5) [Interval=5 sec] | i7-1250U 29 W / 16 W | Iris Xe G7 80EUs 950 MHz | 16 GB | 373.69 |
| LG Gram 16Z90Q | i7-1260P 43 W / 25 W | Iris Xe G7 96EUs 1400 / 2600 MHz | 16 GB | 415.1 |
| Lenovo ThinkPad T14 G3-21AJS00400 6.0.1 x64 1024 MiB [C: 6.0% (57.5/951.6 GiB)] (x5) [Interval=5 sec] | i7-1260P 58 W / 42 W | GeForce MX550 30 W 1710 / 1500 MHz 2 GB | 16 GB | 423 |
| Lenovo Yoga Pro 7 14APH G8 6.0.1 x64 1024 MiB [C: 15.9% (151.5/951.6 GiB)] (x5) [Interval=5 sec] | R7 7840HS 60 W / 54 W | Radeon 780M | 32 GB | 428 |
| Lenovo Yoga Slim 7 Carbon 13IAP7-82U9005FGE 6.0.1 x64 1024 MiB [C: 19.6% (186.5/951.6 GiB)] (x5) [Interval=5 sec] | i7-1260P 46 W / 28 W | Iris Xe G7 96EUs 1400 / 2400 MHz | 16 GB | 428.09 |
| Asus ZenBook S13 OLED UX5304 6.0.1 x64 1024 MiB [C: 5.5% (52.1/952.4 GiB)] (x5) [Interval=5 sec] | i7-1355U 44 W / 17 W | Iris Xe G7 96EUs 1300 MHz | 16 GB | 435 |
| Lenovo Yoga Slim 7 14APU G8 6.0.1 x64 1024 MiB [C: 7.6% (72.4/951.6 GiB)] (x5) [Interval=5 sec] | R7 7840S 52 W / 42 W | Radeon 780M ? / 800 MHz | 32 GB | 436 |
| HP ZBook Power 15 G9 6B8C4EA 6.0.1 x64 1024 MiB [C: 7.2% (68.3/952.7 GiB)] (x5) [Interval=5 sec] | i7-12700H 90 W / 55 W | RTX A2000 Laptop GPU 45 W 1335 / 1368 MHz 8 GB | 32 GB | 438.24 |
| Dell Precision 5000 5470 | i9-12900H 91 W / 20 W | RTX A1000 Laptop GPU 40 W 1140 / 1375 MHz 4 GB | 32 GB | 448.3 |
| Asus Zenbook S 13 OLED 6.0.1 x64 1024 MiB [C: 4.9% (46.8/952.2 GiB)] (x5) [Interval=5 sec] | R7 6800U 30 W / 25 W | Radeon 680M 2200DC MHz | 16 GB | 449.11 |
| Uniwell Technology GM7AG8N Liquid Cooling Box | i9-12900H 140 W / 98 W | GeForce RTX 3080 Ti Laptop GPU 175 W 1590 / 2000 MHz 16 GB | 16 GB | 452 |
| Dell Precision 5480 | i9-13900H 88 W / 51 W | RTX 3000 Ada Generation Laptop 50 W 1530 / 2000 MHz 8 GB | 64 GB | 456 |
| Lenovo Yoga Pro 7 14IRH G8 6.0.1 x64 1024 MiB [C: 13.8% (130.9/951.6 GiB)] (x5) [Interval=5 sec] | i7-13700H 80 W / 53 W | GeForce RTX 4050 Laptop GPU 55 W 1905 / 2000 MHz 6 GB | 16 GB | 457 |
| HP Omen 16-n0033dx | R7 6800H 93 W / 64 W | Radeon RX 6650M 105 W ? / 2000 MHz 8 GB | 16 GB | 458.9 |
| Asus ROG Zephyrus G14 GA402XY 6.0.1 x64 1024 MiB [C: 8.2% (76.2/926.6 GiB)] (x5) [Interval=5 sec] | R9 7940HS 80 W / 80 W | GeForce RTX 4090 Laptop GPU 125 W 1455 / 2250 MHz 16 GB | 32 GB | 459 |
| Lenovo Yoga Pro 9-14IRP G8 6.0.1 x64 1024 MiB [C: 8.6% (81.6/951.6 GiB)] (x5) [Interval=5 sec] | i7-13705H 104 W / 75 W | GeForce RTX 4050 Laptop GPU 80 W 2055 / 2000 MHz 6 GB | 32 GB | 461 |
| Lenovo Yoga Pro 9 16-IRP G8 6.0.1 x64 1024 MiB [C: 7.1% (67.9/951.6 GiB)] (x5) [Interval=5 sec] | i7-13705H 125 W / 80 W | GeForce RTX 4060 Laptop GPU 100 W 8 GB | 16 GB | 465 |
| Lenovo ThinkPad X1 Carbon G9-20XWCTO1WW | i7-1165G7 36 W / 28 W | Iris Xe G7 96EUs | 32 GB | 478.4 |
| Lenovo Slim Pro 9i 16IRP8 | i9-13905H 123 W / 85 W | GeForce RTX 4050 Laptop GPU 100 W 2055 / 2000 MHz 6 GB | 32 GB | 479.6 |
| LG Gram 15Z90Q | i5-1240P 43 W / 13 W | Iris Xe G7 80EUs 1300 / 2600 MHz | 16 GB | 505.5 |
| Acer Predator Helios 300 (i7-12700H, RTX 3070 Ti) 6.0.0 x64 1024 MiB [C: 37.2% (354.4/952.6 GiB)] (x5) [Interval=5 sec] | i7-12700H 115 W / 115 W | GeForce RTX 3070 Ti Laptop GPU 150 W 8 GB | 32 GB | 515.11 |
| Acer Nitro 17 AN17-41-R9LN | R7 7735HS 100 W / 65 W | GeForce RTX 4070 Laptop GPU 140 W 1980 / 1963 MHz 8 GB | 16 GB | 522.7 |
| Acer Nitro 16 AN16-41 | R7 7735HS 100 W / 75 W | GeForce RTX 4070 Laptop GPU 140 W 1980 / 2000 MHz 8 GB | 16 GB | 528 |
| Acer Nitro 5 AN515-58-72QR | i7-12700H 115 W / 80 W | GeForce RTX 3070 Ti Laptop GPU 150 W 1410 / 1750 MHz 8 GB | 16 GB | 530.5 |
| Alienware x15 R2 P111F | i9-12900H 140 W / 140 W | GeForce RTX 3080 Ti Laptop GPU 140 W 16 GB | 32 GB | 549 |
| Alienware m16 R2 | Ultra 7 155H 121 W / 102 W | GeForce RTX 4070 Laptop GPU 140 W 2005 / 2013 MHz 8 GB | 16 GB | 557.9 |
| Razer Blade 14 RZ09-0508 | R9 8945HS 90 W / 75 W | GeForce RTX 4070 Laptop GPU 140 W 1605 / 2000 MHz 8 GB | 32 GB | 570.1 |
| Medion Erazer Beast X30 | i9-12900HK 120 W / 120 W | GeForce RTX 3080 Ti Laptop GPU 175 W 1590 / 2000 MHz 16 GB | 32 GB | 598.5 |
| Dell XPS 17 9720 RTX 3060 | i7-12700H 155 W / 55 W | GeForce RTX 3060 Laptop GPU 65 W 1282 / 1500 MHz 6 GB | 32 GB | 605.6 |
| Razer Blade 14 RTX 4070 | R9 7940HS 88 W / 80 W | GeForce RTX 4070 Laptop GPU 140 W 1980 / 2000 MHz 8 GB | 16 GB | 607.3 |
| MSI Prestige 13 AI Evo 6.0.1 x64 1024 MiB [C: 14.6% (135.6/931.1 GiB)] (x5) [Interval=5 sec] | Ultra 7 155H | Arc 8-Core | 32 GB | 611 |
| MSI Stealth 14 Studio A13V 6.0.1 x64 1024 MiB [C: 38.8% (358.9/926.3 GiB)] (x5) [Interval=5 sec] | i7-13700H 110 W / 85 W | GeForce RTX 4050 Laptop GPU 90 W 2370 / 2000 MHz 6 GB | 16 GB | 628 |
| Lenovo Legion 5 Pro 16ARH7H RTX 3070 Ti | R7 6800H 90 W / 90 W | GeForce RTX 3070 Ti Laptop GPU 150 W 1510 / 1800 MHz 8 GB | 32 GB | 629.3 |
| MSI Summit E14 Flip Evo A12MT | i7-1260P 72 W / 28 W | Iris Xe G7 96EUs 1400 / 2400 MHz | 32 GB | 638.4 |
| Asus ProArt StudioBook 16 H7600ZW | i9-12900H 115 W / 110 W | GeForce RTX 3070 Ti Laptop GPU 115 W 8 GB | 32 GB | 640.4 |
| Razer Blade 14 Ryzen 9 6900HX | R9 6900HX 90 W / 75 W | GeForce RTX 3070 Ti Laptop GPU 100 W 1035 / 1500 MHz 8 GB | 16 GB | 642.7 |
| Razer Blade 15 OLED (Early 2022) | i9-12900H 160 W / 65 W | GeForce RTX 3070 Ti Laptop GPU 110 W 1035 / 1500 MHz 8 GB | 16 GB | 643.1 |
| Razer Blade 17 (i7-12800H, RTX 3070 Ti) 6.0.0 x64 1024 MiB [C: 13.7% (127.7/934.5 GiB)] (x5) [Interval=5 sec] | i7-12800H 110 W / 60 W | GeForce RTX 3070 Ti Laptop GPU 150 W 8 GB | 16 GB | 651.74 |
| Razer Blade 14 2025 6.0.1 x64 1024 MiB [C: 9.7% (90.3/927.8 GiB)] (x5) [Interval=5 sec] | Ryzen AI 9 365 70 W / 60 W | GeForce RTX 5070 Laptop 115 W 2632 / 1500 MHz | 32 GB | 658 |
| Maingear Vector Pro MG-VCP17 | i7-11800H 120 W / 120 W | GeForce RTX 3080 Laptop GPU 165 W 1605 / 1750 MHz 16 GB | 32 GB | 659 |
| Razer Blade 16 RTX 5080 | Ryzen AI 9 365 80 W / 75 W | GeForce RTX 5080 Laptop 160 W 1500 / 1750 MHz 16 GB | 32 GB | 662.1 |
| Lenovo Yoga 9i 14 2022 i7-1260P 6.0.1 x64 1024 MiB [C: 8.3% (79.4/951.6 GiB)] (x5) [Interval=5 sec] | i7-1260P 64 W / 38 W | Iris Xe G7 96EUs 1400 / 2600 MHz | 16 GB | 664.35 |
| Eluktronics Mech-17 GP2 | i9-13900HX 160 W / 99 W | GeForce RTX 4090 Laptop GPU 175 W 2140 / 2375 MHz 16 GB | 32 GB | 669.8 |
| Razer Blade 17 RTX 3080 Ti | i7-12800H 107 W / 61 W | GeForce RTX 3080 Ti Laptop GPU 165 W 1395 / 2000 MHz 16 GB | 32 GB | 672 |
| LG Gram 17 (2023) | i7-1360P 43 W / 26 W | Iris Xe G7 96EUs 1400 MHz | 16 GB | 675.1 |
| Lenovo Legion Pro 5 16ARX8 | R7 7745HX 110 W / 97 W | GeForce RTX 4070 Laptop GPU 140 W 1755 / 2050 MHz 8 GB | 16 GB | 678.5 |
| Lenovo Legion Pro 5 16IRX9 G9 6.0.0 x64 1024 MiB [C: 27.0% (257.1/951.6 GiB)] (x5) [Interval=5 sec] | i7-14700HX 190 W / 130 W | GeForce RTX 4060 Laptop GPU 140 W 8 GB | 32 GB | 687 |
| Gigabyte Aero 15 OLED XD | i7-11800H @4.6 GHz 109 W / 62 W | GeForce RTX 3070 Laptop GPU 105 W 1290 / 1500 MHz 8 GB | 32 GB | 691 |
| Razer Blade 17 Early 2022 | i9-12900H 160 W / 65 W | GeForce RTX 3080 Ti Laptop GPU 165 W 1395 / 2000 MHz 16 GB | 32 GB | 691.7 |
| Razer Blade 17 RTX 3070 | i7-11800H 160 W / 65 W | GeForce RTX 3070 Laptop GPU 130 W 1410 / 1500 MHz 8 GB | 16 GB | 703 |
| Asus ExpertBook B7 Flip B7402FEA | i7-1195G7 51 W / 35 W | Iris Xe G7 96EUs 1400 MHz | 16 GB | 710 |
| Lenovo Legion 5 16IRX G9 6.0.1 x64 1024 MiB [C: 7.7% (73.7/951.6 GiB)] (x5) [Interval=5 sec] | i7-14650HX 140 W / 100 W | GeForce RTX 4060 Laptop GPU 125 W 2430 / 2050 MHz 8 GB | 16 GB | 712 |
| Aorus 15P YD | i7-11800H 109 W / 45 W | GeForce RTX 3080 Laptop GPU 130 W 1545 / 1750 MHz 8 GB | 16 GB | 722 |
| Lenovo Legion Pro 7 16IRX8H | i9-13900HX 185 W / 130 W | GeForce RTX 4080 Laptop GPU 175 W 1665 / 2250 MHz 12 GB | 32 GB | 724.7 |
| Lenovo Legion Pro 5 16IRX9 | i9-14900HX 187 W / 104 W | GeForce RTX 4070 Laptop GPU 140 W 1705 / 2050 MHz 8 GB | 32 GB | 727.6 |
| Lenovo Legion Slim 7i 16 Gen 8 | i9-13900H 107 W / 81 W | GeForce RTX 4070 Laptop GPU 140 W 1845 / 2050 MHz 8 GB | 16 GB | 731.8 |
| Lenovo Legion Pro 7 RTX4090 | i9-13900HX 185 W / 130 W | GeForce RTX 4090 Laptop GPU 175 W 1455 / 2250 MHz 16 GB | 32 GB | 741.4 |
| Lenovo ThinkPad X1 Yoga G6-20Y0S00200 5.2.1 x64 1024 MiB [C: 9.3% (88.3/953.3 GiB)] (x5) [Interval=5 sec] | i7-1165G7 48 W / 28 W | Iris Xe G7 96EUs | 32 GB | 750 |
| MSI GE76 Raider 11UH-472US | i9-11980HK 200 W / 91.75 W | GeForce RTX 3080 Laptop GPU 165 W 1710 / 1750 MHz 16 GB | 64 GB | 752 |
| Alienware m15 R6, i7-11800H RTX 3080 | i7-11800H 90 W / 50 W | GeForce RTX 3080 Laptop GPU 125 W 8 GB | 32 GB | 755 |
| Razer Blade 15 Advanced Model Early 2022 5.2.0 x64 1024 MiB [C: 51.4% (480.7/934.5 GiB)] (x5) [Interval=5 sec] | i7-12800H 160 W / 65 W | GeForce RTX 3080 Ti Laptop GPU 110 W 1125 / 1750 MHz 16 GB | 32 GB | 863.75 |
| MSI CreatorPro Z16P B12UKST 6.0.1 x64 1024 MiB [C: 9.7% (90.5/934.1 GiB)] (x5) [Interval=5 sec] | i7-12700H 74 W / 64 W | RTX A3000 Laptop GPU 90 W 1440 / 1750 MHz 12 GB | 32 GB | 884.83 |
| Lenovo Legion 5 Pro 16 G7 i7 RTX 3070Ti 6.0.1 x64 1024 MiB [C: 9.5% (90.8/951.6 GiB)] (x5) [Interval=5 sec] | i7-12700H 124 W / 108 W | GeForce RTX 3070 Ti Laptop GPU 150 W 1702 / 1750 MHz 8 GB | 16 GB | 890 |
| Asus ExpertBook B2 Flip B2502FBA-N80141X | i7-1260P 64 W / 28 W | Iris Xe G7 96EUs 1400 MHz | 32 GB | 891.9 |
| Acer Swift X SFX14-71G 6.0.1 x64 1024 MiB [C: 6.5% (61.6/952.6 GiB)] (x5) [Interval=5 sec] | i7-13700H 80 W / 40 W | GeForce RTX 4050 Laptop GPU 50 W 1605 / 2000 MHz 6 GB | 16 GB | 897 |
| MSI GE67 HX 12UGS | i7-12800HX 190 W / 110 W | GeForce RTX 3070 Ti Laptop GPU 150 W 1555 / 1750 MHz 8 GB | 16 GB | 929 |
| MSI Titan GT77 12UHS | i9-12900HX 200 W / 125 W | GeForce RTX 3080 Ti Laptop GPU 175 W 16 GB | 64 GB | 948.9 |
| Nubia RedMagic Titan 16 Pro | i9-14900HX 140 W / 45 W | GeForce RTX 4060 Laptop GPU 140 W 2250 / 2000 MHz 8 GB | 16 GB | 997.2 |
| Model | CPU | GPU | RAM | Value |
|---|---|---|---|---|
| Lenovo Legion Pro 5 16IAX10, RTX 5070 6.0.0 x64 1024 MiB [C: 77.9% (741.5/951.6 GiB)] (x5) [Interval=5 sec] | Ultra 7 255HX 185 W / 125 W | GeForce RTX 5070 Laptop 115 W | 32 GB | 2240 |
| Lenovo Yoga Pro 9 16IMH9 RTX 4050 | Ultra 9 185H 120 W / 83 W | GeForce RTX 4050 Laptop GPU 100 W 2055 / 2000 MHz 6 GB | 32 GB | 4774 |
| Lenovo Yoga Pro 7 14IMH9 | Ultra 7 155H 64 W / 55 W | Arc 8-Core 0.1 GB | 32 GB | 4974 |
| Lenovo Yoga Pro 9 16IMH9 6.0.1 x64 1024 MiB [C: 8.8% (83.4/951.6 GiB)] (x5) [Interval=5 sec] | Ultra 9 185H 115 W / 80 W | GeForce RTX 4070 Laptop GPU 100 W 2175 / 2000 MHz 8 GB | 32 GB | 5363 |
| Lenovo Legion Pro 7 16IRX9H | i9-14900HX 185 W / 130 W | GeForce RTX 4080 Laptop GPU 175 W 1665 / 2250 MHz 12 GB | 32 GB | 6106 |
| Lenovo Legion 7 16 IRX G9 6.0.1 x64 1024 MiB [C: 9.0% (85.6/951.6 GiB)] (x5) [Interval=5 sec] | i9-14900HX 154 W / 90 W | GeForce RTX 4070 Laptop GPU 115 W 2480 / 2250 MHz 8 GB | 32 GB | 6130 |
| Lenovo Legion Pro 7i 16 Gen 10 | Ultra 9 275HX 201 W / 156 W | GeForce RTX 5080 Laptop 175 W 1650 / 1788 MHz 16 GB | 32 GB | 6157 |
| Lenovo Legion Slim 5 14APH8 | R7 7840HS 92 W / 83 W | GeForce RTX 4060 Laptop GPU 105 W 2040 / 2050 MHz 8 GB | 16 GB | 6464 |
| Lenovo Legion S7 16ARHA7 | R9 6900HX 103 W / 85 W | Radeon RX 6800S 90 W 1481 / 2000 MHz 8 GB | 16 GB | 6538 |
| Dell Precision 7670 | i7-12850HX 153 W / 72 W | RTX A2000 Laptop GPU 95 W 1612 / 1750 MHz 8 GB | 32 GB | 9500 |
| Model | CPU | GPU | RAM | Value |
|---|---|---|---|---|
| Alienware x15 R2 P111F | i9-12900H 140 W / 140 W | GeForce RTX 3080 Ti Laptop GPU 140 W 16 GB | 32 GB | 2186.8 |
| HP Omen 16-n0033dx | R7 6800H 93 W / 64 W | Radeon RX 6650M 105 W ? / 2000 MHz 8 GB | 16 GB | 2222 |
| Razer Blade 15 OLED (Early 2022) | i9-12900H 160 W / 65 W | GeForce RTX 3070 Ti Laptop GPU 110 W 1035 / 1500 MHz 8 GB | 16 GB | 2442 |
| HP ZBook Firefly 16 G9-6B897EA 6.0.1 x64 1024 MiB [C: 7.0% (66.5/952.7 GiB)] (x5) [Interval=5 sec] | i7-1265U 51 W / 12 W | T550 Laptop GPU 20 W 1665 / 1500 MHz 4 GB | 32 GB | 2669.7 |
| Alienware m15 R6, i7-11800H RTX 3080 | i7-11800H 90 W / 50 W | GeForce RTX 3080 Laptop GPU 125 W 8 GB | 32 GB | 3174 |
| Asus Zenbook 17 Fold UX9702 6.0.1 x64 1024 MiB [C: 5.2% (49.4/952.5 GiB)] (x5) [Interval=5 sec] | i7-1250U 29 W / 16 W | Iris Xe G7 80EUs 950 MHz | 16 GB | 3231.4 |
| Asus ExpertBook B7 Flip B7402FEA | i7-1195G7 51 W / 35 W | Iris Xe G7 96EUs 1400 MHz | 16 GB | 3460 |
| Asus ZenBook S13 OLED UX5304 6.0.1 x64 1024 MiB [C: 5.5% (52.1/952.4 GiB)] (x5) [Interval=5 sec] | i7-1355U 44 W / 17 W | Iris Xe G7 96EUs 1300 MHz | 16 GB | 3931 |
| Lenovo ThinkPad T14 G3-21AJS00400 6.0.1 x64 1024 MiB [C: 6.0% (57.5/951.6 GiB)] (x5) [Interval=5 sec] | i7-1260P 58 W / 42 W | GeForce MX550 30 W 1710 / 1500 MHz 2 GB | 16 GB | 4443 |
| Lenovo ThinkPad X1 Carbon G9-20XWCTO1WW | i7-1165G7 36 W / 28 W | Iris Xe G7 96EUs | 32 GB | 4524 |
| Dell XPS 13 Plus 9320 4K 6.0.1 x64 1024 MiB [C: 15.9% (148.3/934.4 GiB)] (x5) [Interval=5 sec] | i7-1260P 64 W / 34 W | Iris Xe G7 96EUs 1400 MHz | 32 GB | 4646 |
| Dell XPS 14 2024 OLED 6.0.1 x64 1024 MiB [C: 9.2% (85.1/925.7 GiB)] (x5) [Interval=5 sec] | Ultra 7 155H 64 W / 30 W | GeForce RTX 4050 Laptop GPU 30 W 1605 / 2000 MHz 4 GB | 32 GB | 4820 |
| HP ZBook Power 15 G9 6B8C4EA 6.0.1 x64 1024 MiB [C: 7.2% (68.3/952.7 GiB)] (x5) [Interval=5 sec] | i7-12700H 90 W / 55 W | RTX A2000 Laptop GPU 45 W 1335 / 1368 MHz 8 GB | 32 GB | 4842.9 |
| Lenovo ThinkPad X1 Yoga G6-20Y0S00200 5.2.1 x64 1024 MiB [C: 9.3% (88.3/953.3 GiB)] (x5) [Interval=5 sec] | i7-1165G7 48 W / 28 W | Iris Xe G7 96EUs | 32 GB | 4931 |
| Acer Swift X SFX14-71G 6.0.1 x64 1024 MiB [C: 6.5% (61.6/952.6 GiB)] (x5) [Interval=5 sec] | i7-13700H 80 W / 40 W | GeForce RTX 4050 Laptop GPU 50 W 1605 / 2000 MHz 6 GB | 16 GB | 5031 |
| Eluktronics Mech-17 GP2 | i9-13900HX 160 W / 99 W | GeForce RTX 4090 Laptop GPU 175 W 2140 / 2375 MHz 16 GB | 32 GB | 5040 |
| Uniwell Technology GM7AG8N Liquid Cooling Box | i9-12900H 140 W / 98 W | GeForce RTX 3080 Ti Laptop GPU 175 W 1590 / 2000 MHz 16 GB | 16 GB | 5058 |
| LG Gram 16Z90Q | i7-1260P 43 W / 25 W | Iris Xe G7 96EUs 1400 / 2600 MHz | 16 GB | 5076 |
| Lenovo Legion Pro 7 RTX4090 | i9-13900HX 185 W / 130 W | GeForce RTX 4090 Laptop GPU 175 W 1455 / 2250 MHz 16 GB | 32 GB | 5082 |
| Dell Precision 5000 5470 | i9-12900H 91 W / 20 W | RTX A1000 Laptop GPU 40 W 1140 / 1375 MHz 4 GB | 32 GB | 5086 |
| Razer Blade 17 RTX 3070 | i7-11800H 160 W / 65 W | GeForce RTX 3070 Laptop GPU 130 W 1410 / 1500 MHz 8 GB | 16 GB | 5097 |
| Dell XPS 17 9720 RTX 3060 | i7-12700H 155 W / 55 W | GeForce RTX 3060 Laptop GPU 65 W 1282 / 1500 MHz 6 GB | 32 GB | 5100 |
| Gigabyte Aero 15 OLED XD | i7-11800H @4.6 GHz 109 W / 62 W | GeForce RTX 3070 Laptop GPU 105 W 1290 / 1500 MHz 8 GB | 32 GB | 5111 |
| MSI GE76 Raider 11UH-472US | i9-11980HK 200 W / 91.75 W | GeForce RTX 3080 Laptop GPU 165 W 1710 / 1750 MHz 16 GB | 64 GB | 5119 |
| Razer Blade 16 RTX 5080 | Ryzen AI 9 365 80 W / 75 W | GeForce RTX 5080 Laptop 160 W 1500 / 1750 MHz 16 GB | 32 GB | 5125 |
| Lenovo Yoga Pro 9-14IRP G8 6.0.1 x64 1024 MiB [C: 8.6% (81.6/951.6 GiB)] (x5) [Interval=5 sec] | i7-13705H 104 W / 75 W | GeForce RTX 4050 Laptop GPU 80 W 2055 / 2000 MHz 6 GB | 32 GB | 5126 |
| MSI GE67 HX 12UGS | i7-12800HX 190 W / 110 W | GeForce RTX 3070 Ti Laptop GPU 150 W 1555 / 1750 MHz 8 GB | 16 GB | 5127 |
| Asus ExpertBook B2 Flip B2502FBA-N80141X | i7-1260P 64 W / 28 W | Iris Xe G7 96EUs 1400 MHz | 32 GB | 5133 |
| Lenovo Slim Pro 9i 16IRP8 | i9-13905H 123 W / 85 W | GeForce RTX 4050 Laptop GPU 100 W 2055 / 2000 MHz 6 GB | 32 GB | 5135 |
| MSI Summit E14 Flip Evo A12MT | i7-1260P 72 W / 28 W | Iris Xe G7 96EUs 1400 / 2400 MHz | 32 GB | 5147 |
| Acer Nitro 17 AN17-41-R9LN | R7 7735HS 100 W / 65 W | GeForce RTX 4070 Laptop GPU 140 W 1980 / 1963 MHz 8 GB | 16 GB | 5147 |
| Asus ProArt StudioBook 16 H7600ZW | i9-12900H 115 W / 110 W | GeForce RTX 3070 Ti Laptop GPU 115 W 8 GB | 32 GB | 5150.8 |
| Lenovo Slim 7 Pro X 14ARH7 | R9 6900HS 65 W / 54 W | GeForce RTX 3050 4GB Laptop GPU 55 W 1057 / 1375 MHz 4 GB | 32 GB | 5156 |
| MSI Titan GT77 12UHS | i9-12900HX 200 W / 125 W | GeForce RTX 3080 Ti Laptop GPU 175 W 16 GB | 64 GB | 5157.6 |
| Acer Nitro 5 AN515-58-72QR | i7-12700H 115 W / 80 W | GeForce RTX 3070 Ti Laptop GPU 150 W 1410 / 1750 MHz 8 GB | 16 GB | 5161 |
| Acer Nitro 16 AN16-41 | R7 7735HS 100 W / 75 W | GeForce RTX 4070 Laptop GPU 140 W 1980 / 2000 MHz 8 GB | 16 GB | 5161 |
| Lenovo Yoga Pro 7 14IRH G8 6.0.1 x64 1024 MiB [C: 13.8% (130.9/951.6 GiB)] (x5) [Interval=5 sec] | i7-13700H 80 W / 53 W | GeForce RTX 4050 Laptop GPU 55 W 1905 / 2000 MHz 6 GB | 16 GB | 5162 |
| Lenovo Yoga Slim 7 Carbon 13IAP7-82U9005FGE 6.0.1 x64 1024 MiB [C: 19.6% (186.5/951.6 GiB)] (x5) [Interval=5 sec] | i7-1260P 46 W / 28 W | Iris Xe G7 96EUs 1400 / 2400 MHz | 16 GB | 5163.3 |
| Lenovo Yoga Pro 9 16-IRP G8 6.0.1 x64 1024 MiB [C: 7.1% (67.9/951.6 GiB)] (x5) [Interval=5 sec] | i7-13705H 125 W / 80 W | GeForce RTX 4060 Laptop GPU 100 W 8 GB | 16 GB | 5167 |
| Lenovo Legion Pro 5 16IRX9 | i9-14900HX 187 W / 104 W | GeForce RTX 4070 Laptop GPU 140 W 1705 / 2050 MHz 8 GB | 32 GB | 5178 |
| LG Gram 15Z90Q | i5-1240P 43 W / 13 W | Iris Xe G7 80EUs 1300 / 2600 MHz | 16 GB | 5179 |
| Lenovo Yoga 9i 14 2022 i7-1260P 6.0.1 x64 1024 MiB [C: 8.3% (79.4/951.6 GiB)] (x5) [Interval=5 sec] | i7-1260P 64 W / 38 W | Iris Xe G7 96EUs 1400 / 2600 MHz | 16 GB | 5190.9 |
| Aorus 15P YD | i7-11800H 109 W / 45 W | GeForce RTX 3080 Laptop GPU 130 W 1545 / 1750 MHz 8 GB | 16 GB | 5198 |
| MSI Prestige 13 AI Evo 6.0.1 x64 1024 MiB [C: 14.6% (135.6/931.1 GiB)] (x5) [Interval=5 sec] | Ultra 7 155H | Arc 8-Core | 32 GB | 5200 |
| Nubia RedMagic Titan 16 Pro | i9-14900HX 140 W / 45 W | GeForce RTX 4060 Laptop GPU 140 W 2250 / 2000 MHz 8 GB | 16 GB | 5205 |
| Alienware m16 R2 | Ultra 7 155H 121 W / 102 W | GeForce RTX 4070 Laptop GPU 140 W 2005 / 2013 MHz 8 GB | 16 GB | 5207 |
| Dell Precision 5480 | i9-13900H 88 W / 51 W | RTX 3000 Ada Generation Laptop 50 W 1530 / 2000 MHz 8 GB | 64 GB | 5209 |
| Lenovo Yoga Pro 7 14ARP G8 6.0.1 x64 1024 MiB [C: 3.8% (36.3/953.1 GiB)] (x5) [Interval=5 sec] | R7 7735HS 60 W / 54 W | Radeon 680M | 16 GB | 5210 |
| Lenovo Legion 5 16IRX G9 6.0.1 x64 1024 MiB [C: 7.7% (73.7/951.6 GiB)] (x5) [Interval=5 sec] | i7-14650HX 140 W / 100 W | GeForce RTX 4060 Laptop GPU 125 W 2430 / 2050 MHz 8 GB | 16 GB | 5212 |
| Medion Erazer Beast X30 | i9-12900HK 120 W / 120 W | GeForce RTX 3080 Ti Laptop GPU 175 W 1590 / 2000 MHz 16 GB | 32 GB | 5215 |
| Maingear Vector Pro MG-VCP17 | i7-11800H 120 W / 120 W | GeForce RTX 3080 Laptop GPU 165 W 1605 / 1750 MHz 16 GB | 32 GB | 5216 |
| Lenovo Legion Slim 7i 16 Gen 8 | i9-13900H 107 W / 81 W | GeForce RTX 4070 Laptop GPU 140 W 1845 / 2050 MHz 8 GB | 16 GB | 5223 |
| Razer Blade 17 RTX 3080 Ti | i7-12800H 107 W / 61 W | GeForce RTX 3080 Ti Laptop GPU 165 W 1395 / 2000 MHz 16 GB | 32 GB | 5226 |
| Razer Blade 14 2025 6.0.1 x64 1024 MiB [C: 9.7% (90.3/927.8 GiB)] (x5) [Interval=5 sec] | Ryzen AI 9 365 70 W / 60 W | GeForce RTX 5070 Laptop 115 W 2632 / 1500 MHz | 32 GB | 5229 |
| Asus Zenbook S 13 OLED 6.0.1 x64 1024 MiB [C: 4.9% (46.8/952.2 GiB)] (x5) [Interval=5 sec] | R7 6800U 30 W / 25 W | Radeon 680M 2200DC MHz | 16 GB | 5233.3 |
| Razer Blade 17 Early 2022 | i9-12900H 160 W / 65 W | GeForce RTX 3080 Ti Laptop GPU 165 W 1395 / 2000 MHz 16 GB | 32 GB | 5235 |
| Acer Predator Helios 300 (i7-12700H, RTX 3070 Ti) 6.0.0 x64 1024 MiB [C: 37.2% (354.4/952.6 GiB)] (x5) [Interval=5 sec] | i7-12700H 115 W / 115 W | GeForce RTX 3070 Ti Laptop GPU 150 W 8 GB | 32 GB | 5243.9 |
| Lenovo Yoga Pro 7 14APH G8 6.0.1 x64 1024 MiB [C: 15.9% (151.5/951.6 GiB)] (x5) [Interval=5 sec] | R7 7840HS 60 W / 54 W | Radeon 780M | 32 GB | 5245 |
| Razer Blade 15 Advanced Model Early 2022 5.2.0 x64 1024 MiB [C: 51.4% (480.7/934.5 GiB)] (x5) [Interval=5 sec] | i7-12800H 160 W / 65 W | GeForce RTX 3080 Ti Laptop GPU 110 W 1125 / 1750 MHz 16 GB | 32 GB | 5251.3 |
| Razer Blade 14 RZ09-0508 | R9 8945HS 90 W / 75 W | GeForce RTX 4070 Laptop GPU 140 W 1605 / 2000 MHz 8 GB | 32 GB | 5252 |
| MSI CreatorPro Z16P B12UKST 6.0.1 x64 1024 MiB [C: 9.7% (90.5/934.1 GiB)] (x5) [Interval=5 sec] | i7-12700H 74 W / 64 W | RTX A3000 Laptop GPU 90 W 1440 / 1750 MHz 12 GB | 32 GB | 5255.8 |
| Lenovo Legion Pro 5 16ARX8 | R7 7745HX 110 W / 97 W | GeForce RTX 4070 Laptop GPU 140 W 1755 / 2050 MHz 8 GB | 16 GB | 5259 |
| Lenovo Yoga Slim 7 14APU G8 6.0.1 x64 1024 MiB [C: 7.6% (72.4/951.6 GiB)] (x5) [Interval=5 sec] | R7 7840S 52 W / 42 W | Radeon 780M ? / 800 MHz | 32 GB | 5260 |
| LG Gram 17 (2023) | i7-1360P 43 W / 26 W | Iris Xe G7 96EUs 1400 MHz | 16 GB | 5262 |
| Lenovo Legion Pro 5 16IRX9 G9 6.0.0 x64 1024 MiB [C: 27.0% (257.1/951.6 GiB)] (x5) [Interval=5 sec] | i7-14700HX 190 W / 130 W | GeForce RTX 4060 Laptop GPU 140 W 8 GB | 32 GB | 5263 |
| Asus ROG Zephyrus G14 GA402XY 6.0.1 x64 1024 MiB [C: 8.2% (76.2/926.6 GiB)] (x5) [Interval=5 sec] | R9 7940HS 80 W / 80 W | GeForce RTX 4090 Laptop GPU 125 W 1455 / 2250 MHz 16 GB | 32 GB | 5265 |
| Razer Blade 17 (i7-12800H, RTX 3070 Ti) 6.0.0 x64 1024 MiB [C: 13.7% (127.7/934.5 GiB)] (x5) [Interval=5 sec] | i7-12800H 110 W / 60 W | GeForce RTX 3070 Ti Laptop GPU 150 W 8 GB | 16 GB | 5265.3 |
| Razer Blade 14 RTX 4070 | R9 7940HS 88 W / 80 W | GeForce RTX 4070 Laptop GPU 140 W 1980 / 2000 MHz 8 GB | 16 GB | 5267 |
| Razer Blade 14 Ryzen 9 6900HX | R9 6900HX 90 W / 75 W | GeForce RTX 3070 Ti Laptop GPU 100 W 1035 / 1500 MHz 8 GB | 16 GB | 5272 |
| Lenovo Legion 5 Pro 16 G7 i7 RTX 3070Ti 6.0.1 x64 1024 MiB [C: 9.5% (90.8/951.6 GiB)] (x5) [Interval=5 sec] | i7-12700H 124 W / 108 W | GeForce RTX 3070 Ti Laptop GPU 150 W 1702 / 1750 MHz 8 GB | 16 GB | 5277 |
| Lenovo Legion Pro 7 16IRX8H | i9-13900HX 185 W / 130 W | GeForce RTX 4080 Laptop GPU 175 W 1665 / 2250 MHz 12 GB | 32 GB | 5278 |
| Lenovo Legion 5 Pro 16ARH7H RTX 3070 Ti | R7 6800H 90 W / 90 W | GeForce RTX 3070 Ti Laptop GPU 150 W 1510 / 1800 MHz 8 GB | 32 GB | 5280 |
| MSI Stealth 14 Studio A13V 6.0.1 x64 1024 MiB [C: 38.8% (358.9/926.3 GiB)] (x5) [Interval=5 sec] | i7-13700H 110 W / 85 W | GeForce RTX 4050 Laptop GPU 90 W 2370 / 2000 MHz 6 GB | 16 GB | 5284 |
| Model | CPU | GPU | RAM | Value |
|---|---|---|---|---|
| Lenovo Legion Pro 5 16IAX10, RTX 5070 6.0.0 x64 1024 MiB [C: 77.9% (741.5/951.6 GiB)] (x5) [Interval=5 sec] | Ultra 7 255HX 185 W / 125 W | GeForce RTX 5070 Laptop 115 W | 32 GB | 6199 |
| Lenovo Legion Pro 7i 16 Gen 10 | Ultra 9 275HX 201 W / 156 W | GeForce RTX 5080 Laptop 175 W 1650 / 1788 MHz 16 GB | 32 GB | 6551 |
| Lenovo Legion Slim 5 14APH8 | R7 7840HS 92 W / 83 W | GeForce RTX 4060 Laptop GPU 105 W 2040 / 2050 MHz 8 GB | 16 GB | 6982 |
| Lenovo Yoga Pro 7 14IMH9 | Ultra 7 155H 64 W / 55 W | Arc 8-Core 0.1 GB | 32 GB | 6997 |
| Lenovo Yoga Pro 9 16IMH9 RTX 4050 | Ultra 9 185H 120 W / 83 W | GeForce RTX 4050 Laptop GPU 100 W 2055 / 2000 MHz 6 GB | 32 GB | 7061 |
| Lenovo Legion Pro 7 16IRX9H | i9-14900HX 185 W / 130 W | GeForce RTX 4080 Laptop GPU 175 W 1665 / 2250 MHz 12 GB | 32 GB | 7066 |
| Lenovo Yoga Pro 9 16IMH9 6.0.1 x64 1024 MiB [C: 8.8% (83.4/951.6 GiB)] (x5) [Interval=5 sec] | Ultra 9 185H 115 W / 80 W | GeForce RTX 4070 Laptop GPU 100 W 2175 / 2000 MHz 8 GB | 32 GB | 7075 |
| Lenovo Legion 7 16 IRX G9 6.0.1 x64 1024 MiB [C: 9.0% (85.6/951.6 GiB)] (x5) [Interval=5 sec] | i9-14900HX 154 W / 90 W | GeForce RTX 4070 Laptop GPU 115 W 2480 / 2250 MHz 8 GB | 32 GB | 7133 |
| Lenovo Legion S7 16ARHA7 | R9 6900HX 103 W / 85 W | Radeon RX 6800S 90 W 1481 / 2000 MHz 8 GB | 16 GB | 7159 |
| Dell Precision 7670 | i7-12850HX 153 W / 72 W | RTX A2000 Laptop GPU 95 W 1612 / 1750 MHz 8 GB | 32 GB | 12786 |
| Model | CPU | GPU | RAM | Value |
|---|---|---|---|---|
| Acer Nitro 17 AN17-41-R9LN | R7 7735HS 100 W / 65 W | GeForce RTX 4070 Laptop GPU 140 W 1980 / 1963 MHz 8 GB | 16 GB | 1771 |
| MSI Summit E14 Flip Evo A12MT | i7-1260P 72 W / 28 W | Iris Xe G7 96EUs 1400 / 2400 MHz | 32 GB | 2088 |
| Asus ExpertBook B7 Flip B7402FEA | i7-1195G7 51 W / 35 W | Iris Xe G7 96EUs 1400 MHz | 16 GB | 2794 |
| Alienware m15 R6, i7-11800H RTX 3080 | i7-11800H 90 W / 50 W | GeForce RTX 3080 Laptop GPU 125 W 8 GB | 32 GB | 3552 |
| Acer Predator Helios 300 (i7-12700H, RTX 3070 Ti) 6.0.0 x64 1024 MiB [C: 37.2% (354.4/952.6 GiB)] (x5) [Interval=5 sec] | i7-12700H 115 W / 115 W | GeForce RTX 3070 Ti Laptop GPU 150 W 8 GB | 32 GB | 6648.9 |
| Asus Zenbook 17 Fold UX9702 6.0.1 x64 1024 MiB [C: 5.2% (49.4/952.5 GiB)] (x5) [Interval=5 sec] | i7-1250U 29 W / 16 W | Iris Xe G7 80EUs 950 MHz | 16 GB | 6667.7 |
| Acer Swift X SFX14-71G 6.0.1 x64 1024 MiB [C: 6.5% (61.6/952.6 GiB)] (x5) [Interval=5 sec] | i7-13700H 80 W / 40 W | GeForce RTX 4050 Laptop GPU 50 W 1605 / 2000 MHz 6 GB | 16 GB | 6691 |
| Asus ExpertBook B2 Flip B2502FBA-N80141X | i7-1260P 64 W / 28 W | Iris Xe G7 96EUs 1400 MHz | 32 GB | 6786 |
| Alienware x15 R2 P111F | i9-12900H 140 W / 140 W | GeForce RTX 3080 Ti Laptop GPU 140 W 16 GB | 32 GB | 6796.5 |
| Lenovo Legion Pro 5 16IRX9 | i9-14900HX 187 W / 104 W | GeForce RTX 4070 Laptop GPU 140 W 1705 / 2050 MHz 8 GB | 32 GB | 6809 |
| Dell Precision 5000 5470 | i9-12900H 91 W / 20 W | RTX A1000 Laptop GPU 40 W 1140 / 1375 MHz 4 GB | 32 GB | 6817 |
| HP Omen 16-n0033dx | R7 6800H 93 W / 64 W | Radeon RX 6650M 105 W ? / 2000 MHz 8 GB | 16 GB | 6821 |
| Lenovo Legion Slim 7i 16 Gen 8 | i9-13900H 107 W / 81 W | GeForce RTX 4070 Laptop GPU 140 W 1845 / 2050 MHz 8 GB | 16 GB | 6821 |
| Lenovo Legion Pro 7 RTX4090 | i9-13900HX 185 W / 130 W | GeForce RTX 4090 Laptop GPU 175 W 1455 / 2250 MHz 16 GB | 32 GB | 6903 |
| Dell XPS 17 9720 RTX 3060 | i7-12700H 155 W / 55 W | GeForce RTX 3060 Laptop GPU 65 W 1282 / 1500 MHz 6 GB | 32 GB | 6941 |
| Uniwell Technology GM7AG8N Liquid Cooling Box | i9-12900H 140 W / 98 W | GeForce RTX 3080 Ti Laptop GPU 175 W 1590 / 2000 MHz 16 GB | 16 GB | 6947 |
| Dell XPS 13 Plus 9320 4K 6.0.1 x64 1024 MiB [C: 15.9% (148.3/934.4 GiB)] (x5) [Interval=5 sec] | i7-1260P 64 W / 34 W | Iris Xe G7 96EUs 1400 MHz | 32 GB | 6947.9 |
| Lenovo Slim 7 Pro X 14ARH7 | R9 6900HS 65 W / 54 W | GeForce RTX 3050 4GB Laptop GPU 55 W 1057 / 1375 MHz 4 GB | 32 GB | 6951 |
| HP ZBook Power 15 G9 6B8C4EA 6.0.1 x64 1024 MiB [C: 7.2% (68.3/952.7 GiB)] (x5) [Interval=5 sec] | i7-12700H 90 W / 55 W | RTX A2000 Laptop GPU 45 W 1335 / 1368 MHz 8 GB | 32 GB | 6958.9 |
| Lenovo Yoga Slim 7 Carbon 13IAP7-82U9005FGE 6.0.1 x64 1024 MiB [C: 19.6% (186.5/951.6 GiB)] (x5) [Interval=5 sec] | i7-1260P 46 W / 28 W | Iris Xe G7 96EUs 1400 / 2400 MHz | 16 GB | 6972.5 |
| Lenovo ThinkPad T14 G3-21AJS00400 6.0.1 x64 1024 MiB [C: 6.0% (57.5/951.6 GiB)] (x5) [Interval=5 sec] | i7-1260P 58 W / 42 W | GeForce MX550 30 W 1710 / 1500 MHz 2 GB | 16 GB | 6974 |
| Lenovo Yoga 9i 14 2022 i7-1260P 6.0.1 x64 1024 MiB [C: 8.3% (79.4/951.6 GiB)] (x5) [Interval=5 sec] | i7-1260P 64 W / 38 W | Iris Xe G7 96EUs 1400 / 2600 MHz | 16 GB | 6984.4 |
| Lenovo Slim Pro 9i 16IRP8 | i9-13905H 123 W / 85 W | GeForce RTX 4050 Laptop GPU 100 W 2055 / 2000 MHz 6 GB | 32 GB | 6992 |
| Lenovo Yoga Pro 9-14IRP G8 6.0.1 x64 1024 MiB [C: 8.6% (81.6/951.6 GiB)] (x5) [Interval=5 sec] | i7-13705H 104 W / 75 W | GeForce RTX 4050 Laptop GPU 80 W 2055 / 2000 MHz 6 GB | 32 GB | 6998 |
| Nubia RedMagic Titan 16 Pro | i9-14900HX 140 W / 45 W | GeForce RTX 4060 Laptop GPU 140 W 2250 / 2000 MHz 8 GB | 16 GB | 7001 |
| Gigabyte Aero 15 OLED XD | i7-11800H @4.6 GHz 109 W / 62 W | GeForce RTX 3070 Laptop GPU 105 W 1290 / 1500 MHz 8 GB | 32 GB | 7002 |
| Asus ZenBook S13 OLED UX5304 6.0.1 x64 1024 MiB [C: 5.5% (52.1/952.4 GiB)] (x5) [Interval=5 sec] | i7-1355U 44 W / 17 W | Iris Xe G7 96EUs 1300 MHz | 16 GB | 7025 |
| LG Gram 17 (2023) | i7-1360P 43 W / 26 W | Iris Xe G7 96EUs 1400 MHz | 16 GB | 7026 |
| Eluktronics Mech-17 GP2 | i9-13900HX 160 W / 99 W | GeForce RTX 4090 Laptop GPU 175 W 2140 / 2375 MHz 16 GB | 32 GB | 7030 |
| MSI Prestige 13 AI Evo 6.0.1 x64 1024 MiB [C: 14.6% (135.6/931.1 GiB)] (x5) [Interval=5 sec] | Ultra 7 155H | Arc 8-Core | 32 GB | 7035 |
| Lenovo Yoga Pro 7 14IRH G8 6.0.1 x64 1024 MiB [C: 13.8% (130.9/951.6 GiB)] (x5) [Interval=5 sec] | i7-13700H 80 W / 53 W | GeForce RTX 4050 Laptop GPU 55 W 1905 / 2000 MHz 6 GB | 16 GB | 7040 |
| HP ZBook Firefly 16 G9-6B897EA 6.0.1 x64 1024 MiB [C: 7.0% (66.5/952.7 GiB)] (x5) [Interval=5 sec] | i7-1265U 51 W / 12 W | T550 Laptop GPU 20 W 1665 / 1500 MHz 4 GB | 32 GB | 7050.7 |
| LG Gram 15Z90Q | i5-1240P 43 W / 13 W | Iris Xe G7 80EUs 1300 / 2600 MHz | 16 GB | 7056 |
| MSI Titan GT77 12UHS | i9-12900HX 200 W / 125 W | GeForce RTX 3080 Ti Laptop GPU 175 W 16 GB | 64 GB | 7058.7 |
| Aorus 15P YD | i7-11800H 109 W / 45 W | GeForce RTX 3080 Laptop GPU 130 W 1545 / 1750 MHz 8 GB | 16 GB | 7065 |
| Razer Blade 17 RTX 3070 | i7-11800H 160 W / 65 W | GeForce RTX 3070 Laptop GPU 130 W 1410 / 1500 MHz 8 GB | 16 GB | 7065 |
| LG Gram 16Z90Q | i7-1260P 43 W / 25 W | Iris Xe G7 96EUs 1400 / 2600 MHz | 16 GB | 7066 |
| Lenovo Yoga Pro 9 16-IRP G8 6.0.1 x64 1024 MiB [C: 7.1% (67.9/951.6 GiB)] (x5) [Interval=5 sec] | i7-13705H 125 W / 80 W | GeForce RTX 4060 Laptop GPU 100 W 8 GB | 16 GB | 7066 |
| Dell Precision 5480 | i9-13900H 88 W / 51 W | RTX 3000 Ada Generation Laptop 50 W 1530 / 2000 MHz 8 GB | 64 GB | 7070 |
| Razer Blade 16 RTX 5080 | Ryzen AI 9 365 80 W / 75 W | GeForce RTX 5080 Laptop 160 W 1500 / 1750 MHz 16 GB | 32 GB | 7071 |
| Maingear Vector Pro MG-VCP17 | i7-11800H 120 W / 120 W | GeForce RTX 3080 Laptop GPU 165 W 1605 / 1750 MHz 16 GB | 32 GB | 7073 |
| Razer Blade 17 Early 2022 | i9-12900H 160 W / 65 W | GeForce RTX 3080 Ti Laptop GPU 165 W 1395 / 2000 MHz 16 GB | 32 GB | 7076 |
| MSI Stealth 14 Studio A13V 6.0.1 x64 1024 MiB [C: 38.8% (358.9/926.3 GiB)] (x5) [Interval=5 sec] | i7-13700H 110 W / 85 W | GeForce RTX 4050 Laptop GPU 90 W 2370 / 2000 MHz 6 GB | 16 GB | 7077 |
| Acer Nitro 16 AN16-41 | R7 7735HS 100 W / 75 W | GeForce RTX 4070 Laptop GPU 140 W 1980 / 2000 MHz 8 GB | 16 GB | 7079 |
| Asus ProArt StudioBook 16 H7600ZW | i9-12900H 115 W / 110 W | GeForce RTX 3070 Ti Laptop GPU 115 W 8 GB | 32 GB | 7084.8 |
| MSI GE76 Raider 11UH-472US | i9-11980HK 200 W / 91.75 W | GeForce RTX 3080 Laptop GPU 165 W 1710 / 1750 MHz 16 GB | 64 GB | 7086 |
| Lenovo Legion 5 16IRX G9 6.0.1 x64 1024 MiB [C: 7.7% (73.7/951.6 GiB)] (x5) [Interval=5 sec] | i7-14650HX 140 W / 100 W | GeForce RTX 4060 Laptop GPU 125 W 2430 / 2050 MHz 8 GB | 16 GB | 7086 |
| Lenovo Legion Pro 5 16IRX9 G9 6.0.0 x64 1024 MiB [C: 27.0% (257.1/951.6 GiB)] (x5) [Interval=5 sec] | i7-14700HX 190 W / 130 W | GeForce RTX 4060 Laptop GPU 140 W 8 GB | 32 GB | 7087 |
| Razer Blade 17 (i7-12800H, RTX 3070 Ti) 6.0.0 x64 1024 MiB [C: 13.7% (127.7/934.5 GiB)] (x5) [Interval=5 sec] | i7-12800H 110 W / 60 W | GeForce RTX 3070 Ti Laptop GPU 150 W 8 GB | 16 GB | 7087.4 |
| Dell XPS 14 2024 OLED 6.0.1 x64 1024 MiB [C: 9.2% (85.1/925.7 GiB)] (x5) [Interval=5 sec] | Ultra 7 155H 64 W / 30 W | GeForce RTX 4050 Laptop GPU 30 W 1605 / 2000 MHz 4 GB | 32 GB | 7089 |
| Lenovo Yoga Pro 7 14ARP G8 6.0.1 x64 1024 MiB [C: 3.8% (36.3/953.1 GiB)] (x5) [Interval=5 sec] | R7 7735HS 60 W / 54 W | Radeon 680M | 16 GB | 7091 |
| MSI GE67 HX 12UGS | i7-12800HX 190 W / 110 W | GeForce RTX 3070 Ti Laptop GPU 150 W 1555 / 1750 MHz 8 GB | 16 GB | 7092 |
| Razer Blade 17 RTX 3080 Ti | i7-12800H 107 W / 61 W | GeForce RTX 3080 Ti Laptop GPU 165 W 1395 / 2000 MHz 16 GB | 32 GB | 7093 |
| Medion Erazer Beast X30 | i9-12900HK 120 W / 120 W | GeForce RTX 3080 Ti Laptop GPU 175 W 1590 / 2000 MHz 16 GB | 32 GB | 7095 |
| Alienware m16 R2 | Ultra 7 155H 121 W / 102 W | GeForce RTX 4070 Laptop GPU 140 W 2005 / 2013 MHz 8 GB | 16 GB | 7095 |
| Razer Blade 15 Advanced Model Early 2022 5.2.0 x64 1024 MiB [C: 51.4% (480.7/934.5 GiB)] (x5) [Interval=5 sec] | i7-12800H 160 W / 65 W | GeForce RTX 3080 Ti Laptop GPU 110 W 1125 / 1750 MHz 16 GB | 32 GB | 7096.4 |
| MSI CreatorPro Z16P B12UKST 6.0.1 x64 1024 MiB [C: 9.7% (90.5/934.1 GiB)] (x5) [Interval=5 sec] | i7-12700H 74 W / 64 W | RTX A3000 Laptop GPU 90 W 1440 / 1750 MHz 12 GB | 32 GB | 7097.1 |
| Lenovo ThinkPad X1 Carbon G9-20XWCTO1WW | i7-1165G7 36 W / 28 W | Iris Xe G7 96EUs | 32 GB | 7098 |
| Razer Blade 15 OLED (Early 2022) | i9-12900H 160 W / 65 W | GeForce RTX 3070 Ti Laptop GPU 110 W 1035 / 1500 MHz 8 GB | 16 GB | 7098 |
| Lenovo Legion Pro 7 16IRX8H | i9-13900HX 185 W / 130 W | GeForce RTX 4080 Laptop GPU 175 W 1665 / 2250 MHz 12 GB | 32 GB | 7098 |
| Razer Blade 14 2025 6.0.1 x64 1024 MiB [C: 9.7% (90.3/927.8 GiB)] (x5) [Interval=5 sec] | Ryzen AI 9 365 70 W / 60 W | GeForce RTX 5070 Laptop 115 W 2632 / 1500 MHz | 32 GB | 7098 |
| Acer Nitro 5 AN515-58-72QR | i7-12700H 115 W / 80 W | GeForce RTX 3070 Ti Laptop GPU 150 W 1410 / 1750 MHz 8 GB | 16 GB | 7102 |
| Lenovo ThinkPad X1 Yoga G6-20Y0S00200 5.2.1 x64 1024 MiB [C: 9.3% (88.3/953.3 GiB)] (x5) [Interval=5 sec] | i7-1165G7 48 W / 28 W | Iris Xe G7 96EUs | 32 GB | 7103 |
| Lenovo Legion 5 Pro 16 G7 i7 RTX 3070Ti 6.0.1 x64 1024 MiB [C: 9.5% (90.8/951.6 GiB)] (x5) [Interval=5 sec] | i7-12700H 124 W / 108 W | GeForce RTX 3070 Ti Laptop GPU 150 W 1702 / 1750 MHz 8 GB | 16 GB | 7110 |
| Lenovo Legion Pro 5 16ARX8 | R7 7745HX 110 W / 97 W | GeForce RTX 4070 Laptop GPU 140 W 1755 / 2050 MHz 8 GB | 16 GB | 7110 |
| Asus Zenbook S 13 OLED 6.0.1 x64 1024 MiB [C: 4.9% (46.8/952.2 GiB)] (x5) [Interval=5 sec] | R7 6800U 30 W / 25 W | Radeon 680M 2200DC MHz | 16 GB | 7112.5 |
| Lenovo Legion 5 Pro 16ARH7H RTX 3070 Ti | R7 6800H 90 W / 90 W | GeForce RTX 3070 Ti Laptop GPU 150 W 1510 / 1800 MHz 8 GB | 32 GB | 7113 |
| Asus ROG Zephyrus G14 GA402XY 6.0.1 x64 1024 MiB [C: 8.2% (76.2/926.6 GiB)] (x5) [Interval=5 sec] | R9 7940HS 80 W / 80 W | GeForce RTX 4090 Laptop GPU 125 W 1455 / 2250 MHz 16 GB | 32 GB | 7113 |
| Lenovo Yoga Slim 7 14APU G8 6.0.1 x64 1024 MiB [C: 7.6% (72.4/951.6 GiB)] (x5) [Interval=5 sec] | R7 7840S 52 W / 42 W | Radeon 780M ? / 800 MHz | 32 GB | 7113 |
| Lenovo Yoga Pro 7 14APH G8 6.0.1 x64 1024 MiB [C: 15.9% (151.5/951.6 GiB)] (x5) [Interval=5 sec] | R7 7840HS 60 W / 54 W | Radeon 780M | 32 GB | 7115 |
| Razer Blade 14 RZ09-0508 | R9 8945HS 90 W / 75 W | GeForce RTX 4070 Laptop GPU 140 W 1605 / 2000 MHz 8 GB | 32 GB | 7117 |
| Razer Blade 14 Ryzen 9 6900HX | R9 6900HX 90 W / 75 W | GeForce RTX 3070 Ti Laptop GPU 100 W 1035 / 1500 MHz 8 GB | 16 GB | 7118 |
| Razer Blade 14 RTX 4070 | R9 7940HS 88 W / 80 W | GeForce RTX 4070 Laptop GPU 140 W 1980 / 2000 MHz 8 GB | 16 GB | 7124 |
| Model | CPU | GPU | RAM | Value |
|---|---|---|---|---|
| Lenovo Yoga Pro 9 16IMH9 6.0.1 x64 1024 MiB [C: 8.8% (83.4/951.6 GiB)] (x5) [Interval=5 sec] | Ultra 9 185H 115 W / 80 W | GeForce RTX 4070 Laptop GPU 100 W 2175 / 2000 MHz 8 GB | 32 GB | 443 |
| Lenovo Legion Pro 5 16IAX10, RTX 5070 6.0.0 x64 1024 MiB [C: 77.9% (741.5/951.6 GiB)] (x5) [Interval=5 sec] | Ultra 7 255HX 185 W / 125 W | GeForce RTX 5070 Laptop 115 W | 32 GB | 2237 |
| Lenovo Legion 7 16 IRX G9 6.0.1 x64 1024 MiB [C: 9.0% (85.6/951.6 GiB)] (x5) [Interval=5 sec] | i9-14900HX 154 W / 90 W | GeForce RTX 4070 Laptop GPU 115 W 2480 / 2250 MHz 8 GB | 32 GB | 2294 |
| Model | CPU | GPU | RAM | Value |
|---|---|---|---|---|
| HP ZBook Firefly 16 G9-6B897EA 6.0.1 x64 1024 MiB [C: 7.0% (66.5/952.7 GiB)] (x5) [Interval=5 sec] | i7-1265U 51 W / 12 W | T550 Laptop GPU 20 W 1665 / 1500 MHz 4 GB | 32 GB | 276.62 |
| Lenovo ThinkPad T14 G3-21AJS00400 6.0.1 x64 1024 MiB [C: 6.0% (57.5/951.6 GiB)] (x5) [Interval=5 sec] | i7-1260P 58 W / 42 W | GeForce MX550 30 W 1710 / 1500 MHz 2 GB | 16 GB | 326 |
| Lenovo Yoga Slim 7 Carbon 13IAP7-82U9005FGE 6.0.1 x64 1024 MiB [C: 19.6% (186.5/951.6 GiB)] (x5) [Interval=5 sec] | i7-1260P 46 W / 28 W | Iris Xe G7 96EUs 1400 / 2400 MHz | 16 GB | 343.55 |
| Asus ZenBook S13 OLED UX5304 6.0.1 x64 1024 MiB [C: 5.5% (52.1/952.4 GiB)] (x5) [Interval=5 sec] | i7-1355U 44 W / 17 W | Iris Xe G7 96EUs 1300 MHz | 16 GB | 348 |
| Dell XPS 14 2024 OLED 6.0.1 x64 1024 MiB [C: 9.2% (85.1/925.7 GiB)] (x5) [Interval=5 sec] | Ultra 7 155H 64 W / 30 W | GeForce RTX 4050 Laptop GPU 30 W 1605 / 2000 MHz 4 GB | 32 GB | 348 |
| Asus Zenbook 17 Fold UX9702 6.0.1 x64 1024 MiB [C: 5.2% (49.4/952.5 GiB)] (x5) [Interval=5 sec] | i7-1250U 29 W / 16 W | Iris Xe G7 80EUs 950 MHz | 16 GB | 354.92 |
| Lenovo Yoga Pro 7 14ARP G8 6.0.1 x64 1024 MiB [C: 3.8% (36.3/953.1 GiB)] (x5) [Interval=5 sec] | R7 7735HS 60 W / 54 W | Radeon 680M | 16 GB | 364 |
| Dell XPS 13 Plus 9320 4K 6.0.1 x64 1024 MiB [C: 15.9% (148.3/934.4 GiB)] (x5) [Interval=5 sec] | i7-1260P 64 W / 34 W | Iris Xe G7 96EUs 1400 MHz | 32 GB | 370.02 |
| HP ZBook Power 15 G9 6B8C4EA 6.0.1 x64 1024 MiB [C: 7.2% (68.3/952.7 GiB)] (x5) [Interval=5 sec] | i7-12700H 90 W / 55 W | RTX A2000 Laptop GPU 45 W 1335 / 1368 MHz 8 GB | 32 GB | 409.28 |
| Lenovo Yoga Pro 7 14IRH G8 6.0.1 x64 1024 MiB [C: 13.8% (130.9/951.6 GiB)] (x5) [Interval=5 sec] | i7-13700H 80 W / 53 W | GeForce RTX 4050 Laptop GPU 55 W 1905 / 2000 MHz 6 GB | 16 GB | 413 |
| Lenovo Yoga Pro 9 16-IRP G8 6.0.1 x64 1024 MiB [C: 7.1% (67.9/951.6 GiB)] (x5) [Interval=5 sec] | i7-13705H 125 W / 80 W | GeForce RTX 4060 Laptop GPU 100 W 8 GB | 16 GB | 431 |
| Lenovo Yoga Pro 7 14APH G8 6.0.1 x64 1024 MiB [C: 15.9% (151.5/951.6 GiB)] (x5) [Interval=5 sec] | R7 7840HS 60 W / 54 W | Radeon 780M | 32 GB | 433 |
| Lenovo Yoga Slim 7 14APU G8 6.0.1 x64 1024 MiB [C: 7.6% (72.4/951.6 GiB)] (x5) [Interval=5 sec] | R7 7840S 52 W / 42 W | Radeon 780M ? / 800 MHz | 32 GB | 436 |
| Lenovo Yoga Pro 9-14IRP G8 6.0.1 x64 1024 MiB [C: 8.6% (81.6/951.6 GiB)] (x5) [Interval=5 sec] | i7-13705H 104 W / 75 W | GeForce RTX 4050 Laptop GPU 80 W 2055 / 2000 MHz 6 GB | 32 GB | 437 |
| Asus ROG Zephyrus G14 GA402XY 6.0.1 x64 1024 MiB [C: 8.2% (76.2/926.6 GiB)] (x5) [Interval=5 sec] | R9 7940HS 80 W / 80 W | GeForce RTX 4090 Laptop GPU 125 W 1455 / 2250 MHz 16 GB | 32 GB | 452 |
| Asus Zenbook S 13 OLED 6.0.1 x64 1024 MiB [C: 4.9% (46.8/952.2 GiB)] (x5) [Interval=5 sec] | R7 6800U 30 W / 25 W | Radeon 680M 2200DC MHz | 16 GB | 517.14 |
| Alienware x15 R2 P111F | i9-12900H 140 W / 140 W | GeForce RTX 3080 Ti Laptop GPU 140 W 16 GB | 32 GB | 527.8 |
| Asus ProArt StudioBook 16 H7600ZW | i9-12900H 115 W / 110 W | GeForce RTX 3070 Ti Laptop GPU 115 W 8 GB | 32 GB | 591.7 |
| MSI Prestige 13 AI Evo 6.0.1 x64 1024 MiB [C: 14.6% (135.6/931.1 GiB)] (x5) [Interval=5 sec] | Ultra 7 155H | Arc 8-Core | 32 GB | 1267 |
| Alienware m15 R6, i7-11800H RTX 3080 | i7-11800H 90 W / 50 W | GeForce RTX 3080 Laptop GPU 125 W 8 GB | 32 GB | 1414 |
| Acer Predator Helios 300 (i7-12700H, RTX 3070 Ti) 6.0.0 x64 1024 MiB [C: 37.2% (354.4/952.6 GiB)] (x5) [Interval=5 sec] | i7-12700H 115 W / 115 W | GeForce RTX 3070 Ti Laptop GPU 150 W 8 GB | 32 GB | 1758.31 |
| Lenovo Yoga 9i 14 2022 i7-1260P 6.0.1 x64 1024 MiB [C: 8.3% (79.4/951.6 GiB)] (x5) [Interval=5 sec] | i7-1260P 64 W / 38 W | Iris Xe G7 96EUs 1400 / 2600 MHz | 16 GB | 1910.38 |
| Razer Blade 17 (i7-12800H, RTX 3070 Ti) 6.0.0 x64 1024 MiB [C: 13.7% (127.7/934.5 GiB)] (x5) [Interval=5 sec] | i7-12800H 110 W / 60 W | GeForce RTX 3070 Ti Laptop GPU 150 W 8 GB | 16 GB | 2137.38 |
| Lenovo Legion 5 16IRX G9 6.0.1 x64 1024 MiB [C: 7.7% (73.7/951.6 GiB)] (x5) [Interval=5 sec] | i7-14650HX 140 W / 100 W | GeForce RTX 4060 Laptop GPU 125 W 2430 / 2050 MHz 8 GB | 16 GB | 2299 |
| Lenovo Legion Pro 5 16IRX9 G9 6.0.0 x64 1024 MiB [C: 27.0% (257.1/951.6 GiB)] (x5) [Interval=5 sec] | i7-14700HX 190 W / 130 W | GeForce RTX 4060 Laptop GPU 140 W 8 GB | 32 GB | 2402 |
| MSI Stealth 14 Studio A13V 6.0.1 x64 1024 MiB [C: 38.8% (358.9/926.3 GiB)] (x5) [Interval=5 sec] | i7-13700H 110 W / 85 W | GeForce RTX 4050 Laptop GPU 90 W 2370 / 2000 MHz 6 GB | 16 GB | 2571 |
| Lenovo Legion 5 Pro 16 G7 i7 RTX 3070Ti 6.0.1 x64 1024 MiB [C: 9.5% (90.8/951.6 GiB)] (x5) [Interval=5 sec] | i7-12700H 124 W / 108 W | GeForce RTX 3070 Ti Laptop GPU 150 W 1702 / 1750 MHz 8 GB | 16 GB | 2614 |
| MSI CreatorPro Z16P B12UKST 6.0.1 x64 1024 MiB [C: 9.7% (90.5/934.1 GiB)] (x5) [Interval=5 sec] | i7-12700H 74 W / 64 W | RTX A3000 Laptop GPU 90 W 1440 / 1750 MHz 12 GB | 32 GB | 2830.34 |
| MSI Titan GT77 12UHS | i9-12900HX 200 W / 125 W | GeForce RTX 3080 Ti Laptop GPU 175 W 16 GB | 64 GB | 3017.8 |
| Acer Swift X SFX14-71G 6.0.1 x64 1024 MiB [C: 6.5% (61.6/952.6 GiB)] (x5) [Interval=5 sec] | i7-13700H 80 W / 40 W | GeForce RTX 4050 Laptop GPU 50 W 1605 / 2000 MHz 6 GB | 16 GB | 3112 |
| Razer Blade 14 2025 6.0.1 x64 1024 MiB [C: 9.7% (90.3/927.8 GiB)] (x5) [Interval=5 sec] | Ryzen AI 9 365 70 W / 60 W | GeForce RTX 5070 Laptop 115 W 2632 / 1500 MHz | 32 GB | 3528 |
| Model | CPU | GPU | RAM | Value |
|---|---|---|---|---|
| Lenovo Yoga Pro 9 16IMH9 6.0.1 x64 1024 MiB [C: 8.8% (83.4/951.6 GiB)] (x5) [Interval=5 sec] | Ultra 9 185H 115 W / 80 W | GeForce RTX 4070 Laptop GPU 100 W 2175 / 2000 MHz 8 GB | 32 GB | 998 |
| Lenovo Legion Pro 5 16IAX10, RTX 5070 6.0.0 x64 1024 MiB [C: 77.9% (741.5/951.6 GiB)] (x5) [Interval=5 sec] | Ultra 7 255HX 185 W / 125 W | GeForce RTX 5070 Laptop 115 W | 32 GB | 2577 |
| Lenovo Legion 7 16 IRX G9 6.0.1 x64 1024 MiB [C: 9.0% (85.6/951.6 GiB)] (x5) [Interval=5 sec] | i9-14900HX 154 W / 90 W | GeForce RTX 4070 Laptop GPU 115 W 2480 / 2250 MHz 8 GB | 32 GB | 3186 |
| Model | CPU | GPU | RAM | Value |
|---|---|---|---|---|
| HP ZBook Firefly 16 G9-6B897EA 6.0.1 x64 1024 MiB [C: 7.0% (66.5/952.7 GiB)] (x5) [Interval=5 sec] | i7-1265U 51 W / 12 W | T550 Laptop GPU 20 W 1665 / 1500 MHz 4 GB | 32 GB | 457.5 |
| Asus ZenBook S13 OLED UX5304 6.0.1 x64 1024 MiB [C: 5.5% (52.1/952.4 GiB)] (x5) [Interval=5 sec] | i7-1355U 44 W / 17 W | Iris Xe G7 96EUs 1300 MHz | 16 GB | 566 |
| Asus Zenbook 17 Fold UX9702 6.0.1 x64 1024 MiB [C: 5.2% (49.4/952.5 GiB)] (x5) [Interval=5 sec] | i7-1250U 29 W / 16 W | Iris Xe G7 80EUs 950 MHz | 16 GB | 567.96 |
| Lenovo Yoga Slim 7 Carbon 13IAP7-82U9005FGE 6.0.1 x64 1024 MiB [C: 19.6% (186.5/951.6 GiB)] (x5) [Interval=5 sec] | i7-1260P 46 W / 28 W | Iris Xe G7 96EUs 1400 / 2400 MHz | 16 GB | 720.43 |
| Dell XPS 13 Plus 9320 4K 6.0.1 x64 1024 MiB [C: 15.9% (148.3/934.4 GiB)] (x5) [Interval=5 sec] | i7-1260P 64 W / 34 W | Iris Xe G7 96EUs 1400 MHz | 32 GB | 764.6 |
| Lenovo ThinkPad T14 G3-21AJS00400 6.0.1 x64 1024 MiB [C: 6.0% (57.5/951.6 GiB)] (x5) [Interval=5 sec] | i7-1260P 58 W / 42 W | GeForce MX550 30 W 1710 / 1500 MHz 2 GB | 16 GB | 826 |
| Lenovo Yoga Pro 7 14IRH G8 6.0.1 x64 1024 MiB [C: 13.8% (130.9/951.6 GiB)] (x5) [Interval=5 sec] | i7-13700H 80 W / 53 W | GeForce RTX 4050 Laptop GPU 55 W 1905 / 2000 MHz 6 GB | 16 GB | 859 |
| Lenovo Yoga Pro 9-14IRP G8 6.0.1 x64 1024 MiB [C: 8.6% (81.6/951.6 GiB)] (x5) [Interval=5 sec] | i7-13705H 104 W / 75 W | GeForce RTX 4050 Laptop GPU 80 W 2055 / 2000 MHz 6 GB | 32 GB | 882 |
| Lenovo Yoga Pro 9 16-IRP G8 6.0.1 x64 1024 MiB [C: 7.1% (67.9/951.6 GiB)] (x5) [Interval=5 sec] | i7-13705H 125 W / 80 W | GeForce RTX 4060 Laptop GPU 100 W 8 GB | 16 GB | 943 |
| Lenovo Yoga Pro 7 14ARP G8 6.0.1 x64 1024 MiB [C: 3.8% (36.3/953.1 GiB)] (x5) [Interval=5 sec] | R7 7735HS 60 W / 54 W | Radeon 680M | 16 GB | 1009 |
| Dell XPS 14 2024 OLED 6.0.1 x64 1024 MiB [C: 9.2% (85.1/925.7 GiB)] (x5) [Interval=5 sec] | Ultra 7 155H 64 W / 30 W | GeForce RTX 4050 Laptop GPU 30 W 1605 / 2000 MHz 4 GB | 32 GB | 1028 |
| HP ZBook Power 15 G9 6B8C4EA 6.0.1 x64 1024 MiB [C: 7.2% (68.3/952.7 GiB)] (x5) [Interval=5 sec] | i7-12700H 90 W / 55 W | RTX A2000 Laptop GPU 45 W 1335 / 1368 MHz 8 GB | 32 GB | 1041.79 |
| Lenovo Yoga Slim 7 14APU G8 6.0.1 x64 1024 MiB [C: 7.6% (72.4/951.6 GiB)] (x5) [Interval=5 sec] | R7 7840S 52 W / 42 W | Radeon 780M ? / 800 MHz | 32 GB | 1116 |
| Lenovo Yoga Pro 7 14APH G8 6.0.1 x64 1024 MiB [C: 15.9% (151.5/951.6 GiB)] (x5) [Interval=5 sec] | R7 7840HS 60 W / 54 W | Radeon 780M | 32 GB | 1203 |
| Asus ROG Zephyrus G14 GA402XY 6.0.1 x64 1024 MiB [C: 8.2% (76.2/926.6 GiB)] (x5) [Interval=5 sec] | R9 7940HS 80 W / 80 W | GeForce RTX 4090 Laptop GPU 125 W 1455 / 2250 MHz 16 GB | 32 GB | 1322 |
| Alienware x15 R2 P111F | i9-12900H 140 W / 140 W | GeForce RTX 3080 Ti Laptop GPU 140 W 16 GB | 32 GB | 1373.5 |
| Asus ProArt StudioBook 16 H7600ZW | i9-12900H 115 W / 110 W | GeForce RTX 3070 Ti Laptop GPU 115 W 8 GB | 32 GB | 1390.3 |
| Asus Zenbook S 13 OLED 6.0.1 x64 1024 MiB [C: 4.9% (46.8/952.2 GiB)] (x5) [Interval=5 sec] | R7 6800U 30 W / 25 W | Radeon 680M 2200DC MHz | 16 GB | 1559.86 |
| MSI Prestige 13 AI Evo 6.0.1 x64 1024 MiB [C: 14.6% (135.6/931.1 GiB)] (x5) [Interval=5 sec] | Ultra 7 155H | Arc 8-Core | 32 GB | 2098 |
| Acer Predator Helios 300 (i7-12700H, RTX 3070 Ti) 6.0.0 x64 1024 MiB [C: 37.2% (354.4/952.6 GiB)] (x5) [Interval=5 sec] | i7-12700H 115 W / 115 W | GeForce RTX 3070 Ti Laptop GPU 150 W 8 GB | 32 GB | 2262.05 |
| Lenovo Yoga 9i 14 2022 i7-1260P 6.0.1 x64 1024 MiB [C: 8.3% (79.4/951.6 GiB)] (x5) [Interval=5 sec] | i7-1260P 64 W / 38 W | Iris Xe G7 96EUs 1400 / 2600 MHz | 16 GB | 2478.22 |
| Razer Blade 17 (i7-12800H, RTX 3070 Ti) 6.0.0 x64 1024 MiB [C: 13.7% (127.7/934.5 GiB)] (x5) [Interval=5 sec] | i7-12800H 110 W / 60 W | GeForce RTX 3070 Ti Laptop GPU 150 W 8 GB | 16 GB | 2680.19 |
| MSI Stealth 14 Studio A13V 6.0.1 x64 1024 MiB [C: 38.8% (358.9/926.3 GiB)] (x5) [Interval=5 sec] | i7-13700H 110 W / 85 W | GeForce RTX 4050 Laptop GPU 90 W 2370 / 2000 MHz 6 GB | 16 GB | 2777 |
| Alienware m15 R6, i7-11800H RTX 3080 | i7-11800H 90 W / 50 W | GeForce RTX 3080 Laptop GPU 125 W 8 GB | 32 GB | 2823 |
| Lenovo Legion 5 16IRX G9 6.0.1 x64 1024 MiB [C: 7.7% (73.7/951.6 GiB)] (x5) [Interval=5 sec] | i7-14650HX 140 W / 100 W | GeForce RTX 4060 Laptop GPU 125 W 2430 / 2050 MHz 8 GB | 16 GB | 2836 |
| Lenovo Legion Pro 5 16IRX9 G9 6.0.0 x64 1024 MiB [C: 27.0% (257.1/951.6 GiB)] (x5) [Interval=5 sec] | i7-14700HX 190 W / 130 W | GeForce RTX 4060 Laptop GPU 140 W 8 GB | 32 GB | 2842 |
| MSI Titan GT77 12UHS | i9-12900HX 200 W / 125 W | GeForce RTX 3080 Ti Laptop GPU 175 W 16 GB | 64 GB | 2927.6 |
| MSI CreatorPro Z16P B12UKST 6.0.1 x64 1024 MiB [C: 9.7% (90.5/934.1 GiB)] (x5) [Interval=5 sec] | i7-12700H 74 W / 64 W | RTX A3000 Laptop GPU 90 W 1440 / 1750 MHz 12 GB | 32 GB | 3031.56 |
| Acer Swift X SFX14-71G 6.0.1 x64 1024 MiB [C: 6.5% (61.6/952.6 GiB)] (x5) [Interval=5 sec] | i7-13700H 80 W / 40 W | GeForce RTX 4050 Laptop GPU 50 W 1605 / 2000 MHz 6 GB | 16 GB | 3035 |
| Lenovo Legion 5 Pro 16 G7 i7 RTX 3070Ti 6.0.1 x64 1024 MiB [C: 9.5% (90.8/951.6 GiB)] (x5) [Interval=5 sec] | i7-12700H 124 W / 108 W | GeForce RTX 3070 Ti Laptop GPU 150 W 1702 / 1750 MHz 8 GB | 16 GB | 3047 |
| Razer Blade 14 2025 6.0.1 x64 1024 MiB [C: 9.7% (90.3/927.8 GiB)] (x5) [Interval=5 sec] | Ryzen AI 9 365 70 W / 60 W | GeForce RTX 5070 Laptop 115 W 2632 / 1500 MHz | 32 GB | 3075 |

 - Average benchmark values for this graphics card
* Smaller numbers mean a higher performance
Average Benchmarks
SK Hynix HFS001TEJ9X115N → 100% n=33
Samsung PM9A1 MZVL21T0HCLR → 106% n=33

- $87.37KOOTION 512GB PCIe 3.0 M.2 Internal Solid State Drive PCle 3.0x4 SSD NVMe M.2 2280 Internal SSD Up to 3500MB/s PCIe Gen 3 NVMe SSD Less Heat Large Storage M.2 Internal Solid State Hard Drive for PC
- $69.00SK Hynix SSD 512GB M.2 2280 PCIe Gen3 x4 PC601 HFS512GD9TNG for Laptop Desktop Ultrabook
- $199.00SK hynix 1TB NVMe PCIe Gen4x4 M.2 2242 Internal SSD OEM (HFS001TEJ4X112N) for Handheld Gaming Device, Laptop PCs and More
- $49.59SK Hynix BC711 128GB PCIe NVMe M.2 2230 Gen 3 x 4 SSD, 0X3K2X, HFM128GD3GX013N, OEM Package
- $254.38SK hynix 1TB Internal SSD, SATA III 2.5-inch, Silver S32 Series, TLC NAND Flash, 560MB/s Read Speed, 510MB/s Write Speed
#0 ran 0s before starting gpusingle class +0s ... 0s
#1 checking url part for id 3901 +0s ... 0s
#2 checking url part for id 3657 +0s ... 0s
#3 redirected to Ajax server, took 1780134496s time from redirect:0 +0s ... 0s
#4 did not recreate cache, as it is less than 5 days old! Created at Wed, 27 May 2026 22:46:57 +0200 +0s ... 0s
#5 composed specs +0.002s ... 0.003s
#6 did output specs +0s ... 0.003s
#7 getting avg benchmarks for device 3901 +0.005s ... 0.008s
#8 got single benchmarks 3901 +0.009s ... 0.017s
#9 getting avg benchmarks for device 3657 +0.004s ... 0.02s
#10 got single benchmarks 3657 +0.057s ... 0.077s
#11 got avg benchmarks for devices +0s ... 0.077s
#12 min, max, avg, median took s +0.081s ... 0.158s
#13 return log +0.445s ... 0.603s
 Add as a preferred source on Google


