NVIDIA GeForce GTX 1070 Ti (Desktop) vs Intel UHD Graphics 630 vs Intel Iris Plus Graphics 640
NVIDIA GeForce GTX 1070 Ti (Desktop) ► remove from comparison
The Nvidia GeForce GTX 1070 Ti is the second fastest Pascal based graphics card in November 2017. It is a high-end desktop graphics card based on a cut down GP104 chip as the GTX 1080 and manufactured in 16 nm FinFET at TSMC. Compared to the GTX 1080, it uses the more available GDDR5 graphics memory, and compared to the GTX 1070 it offers more shaders (2432 versus 1920). More details on the Pascal architecture including all features and comparisons to Maxwell, can be found here .
The performance of the GTX 1070 Ti was in our tests right between the GTX 1070 and GTX 1080. However, the powerefficiency was worse than the GTX 1070 and near the GTX 1080. Nvidia also specifies the 1070 Ti and 1080 at 180W.
Intel UHD Graphics 630 ► remove from comparison
The Intel UHD Graphics 630 (GT2) is an integrated graphics card, which can be found in various desktop and notebook processors of the Coffee-Lake generation. The "GT2" version of the GPU offers 24 Execution Units (EUs) and the clocks depend on the CPU model. Due to its lack of dedicated graphics memory or eDRAM cache, the UHD 630 has to access the main memory (2x 64-bit DDR3L-1600 / DDR4-2133). Compared to the older HD Graphics 630 (Kaby-Lake), the newer UHD GPU is identical but can be clocked slightly higher.
Performance
The exact performance of the UHD Graphics 630 depends on various factors like TDP, L3 Cache, memory (DDR3/DDR4) and maximum clock rate of the specific model. However, it should be fairly similar to the HD Graphics 530 and HD Graphics 630 and therefore only suited for low demanding games like Overwatch or Farming Simulator 2017 (low details).
Features
The features of the UHD 630 are the same as for the HD 630 and therefore H.265/HEVC Main10 profile at 10-bit color depth are supported in hardware. Furthermore, HDCP 2.2 is also supported in all chips, which allows Netflix 4K videos, for instance. HDMI 2.0 however is still only supported with an external converter chip (LSPCon).
Power Consumption
The UHD Graphics 630 can be found in several notebook and desktop processors of different TDP classes (35 - 91 W).
Intel Iris Plus Graphics 640 ► remove from comparison
The Intel Iris Plus Graphics 640 (GT3e) is a processor graphics card for Kaby Lake models announced in January 2017. As the successor to the Intel Iris Graphics 540 (Skylake), the Iris Plus Graphics 640 is used for 15-Watt ULV models and is equipped with 64 MB eDRAM cache. There should not be any big changes compared to the Iris Graphics 540.
The so called GT3e version of the Kaby Lake GPU still has 48 Execution Units (EUs), which can reach up to 1050 MHz depending on the model. Besides eDRAM cache, the Iris 640 can also access the system memory (2x 64 Bit DDR3L-1600/LPDDR3-1866/DDR4-2400) via processor interface.
Compared to the Iris Plus 650 from the 28-Watt models, the Iris 640 only has a slightly lower maximum clock as well as the lower TDP, so the utilization of the Turbo Boost potential should be worse.
Performance
The exact performance of the Iris Plus Graphics 640 depends on the CPU model, because maximum clock as well as the size of the L3 cache can differ a bit. The system memory (DDR3/DDR4) will influence the performance as well.
The fastest chips are high-clocked Core i7 models like the Core i7-7660U . Depending on the game, the Iris Plus 640 will probably be similar to the previous model somewhere between a dedicated GeForce 920M and GeForce 940M and is usually limited to low settings in modern games.
Features
The reworked video engine now fully supports hardware decoding of H.265/HEVC videos. Contrary to Skylake, however, Kaby Lake can now also decode H.265/HEVC Main 10 with a 10-bit color depth as well as Google's VP9 codec. The video output is possible via DP 1.2/eDP 1.3 (up to 3840 x 2160 @60 Hz), whereas HDMI is also supported in the older 1.4a standard. An HDMI 2.0 output can be added via converter from DisplayPort. The GPU can drive up to three displays simultaneously.
Power Consumption
The Iris Plus Graphics 640 is used for 15-Watt ULV processor and therefore thin notebooks and Ultrabooks.
NVIDIA GeForce GTX 1070 Ti (Desktop) Intel UHD Graphics 630 Intel Iris Plus Graphics 640 Gen. 9.5 Series Codename Pascal GP104 Kaby-Lake-H-GT2 Kaby Lake GT3e Architecture Pascal Gen. 9.5 Gen. 9.5 Kaby Lake Pipelines 2432 - unified 24 - unified 48 - unified Core Speed 1607 - 1683 (Boost) MHz 300 - 1150 (Boost) MHz 300 - 1050 (Boost) MHz Memory Speed 8000 MHz Memory Bus Width 256 Bit 64/128 Bit 64/128 Bit Memory Type GDDR5 DDR3/DDR4 Max. Amount of Memory 8 GB 64 MB Shared Memory no yes yes API DirectX 12_1, OpenGL 4.5 DirectX 12_1, OpenGL 4.4 DirectX 12_1, OpenGL 4.4 Power Consumption 180 Watt Transistors 7.2 Billion technology 16 nm 14 nm 14 nm Features Multi-Projection, VR Ready, G-SYNC, Vulkan, Multi Monitor QuickSync QuickSync Date of Announcement 02.11.2017 01.10.2017 03.01.2017 Link to Manufacturer Page www.nvidia.at
CPU in UHD Graphics 630 GPU Base Speed GPU Boost / Turbo Intel Core i9-10900K 10 x 3700 MHz, 125 W 350 MHz 1200 MHz Intel Core i9-10850K 10 x 3600 MHz, 125 W ? MHz ? MHz Intel Core i9-10910 10 x 3600 MHz, 125 W ? MHz ? MHz » show 41 more Intel Core i9-9900KS 8 x 4000 MHz, 127 W 350 MHz 1200 MHz Intel Core i7-10700K 8 x 3800 MHz, 125 W 350 MHz 1200 MHz Intel Core i9-9900K 8 x 3600 MHz, 95 W 350 MHz 1200 MHz Intel Core i7-10700 8 x 2900 MHz, 65 W 350 MHz 1200 MHz Intel Core i9-10980HK 8 x 2400 MHz, 45 W 350 MHz 1250 MHz Intel Core i9-10885H 8 x 2400 MHz, 45 W 350 MHz 1200 MHz Intel Core i9-10880H 8 x 2300 MHz, 45 W 350 MHz 1200 MHz Intel Core i7-10875H 8 x 2300 MHz, 45 W 350 MHz 1200 MHz Intel Core i9-9980HK 8 x 2400 MHz, 45 W 350 MHz 1250 MHz Intel Core i7-10870H 8 x 2200 MHz, 45 W 350 MHz 1200 MHz Intel Core i7-9700K 8 x 3600 MHz, 95 W 350 MHz 1200 MHz Intel Core i5-10600K 6 x 4100 MHz, 125 W 350 MHz 1200 MHz Intel Core i9-9880H 8 x 2300 MHz, 45 W 350 MHz 1200 MHz Intel Core i7-8086K 6 x 3700 MHz, 95 W 350 MHz 1200 MHz Intel Core i7-8700K 6 x 3700 MHz, 95 W 350 MHz 1200 MHz Intel Core i7-9700 8 x 3000 MHz, 65 W 350 MHz 1200 MHz Intel Core i9-8950HK 6 x 2900 MHz, 45 W 350 MHz 1200 MHz Intel Xeon E-2186M 6 x 2900 MHz, 45 W 350 MHz ? MHz Intel Core i7-10850H 6 x 2700 MHz, 45 W 350 MHz 1150 MHz Intel Core i7-10750H 6 x 2600 MHz, 45 W 350 MHz 1150 MHz Intel Core i7-8700 6 x 3200 MHz, 65 W 350 MHz 1200 MHz Intel Core i5-10500H 6 x 2500 MHz, 45 W 350 MHz 1050 MHz Intel Core i5-9600K 6 x 3700 MHz, 95 W 350 MHz 1150 MHz Intel Core i7-9850H 6 x 2600 MHz, 45 W 350 MHz 1150 MHz Intel Core i7-9750H 6 x 2600 MHz, 45 W 350 MHz 1150 MHz Intel Core i9-9900T 8 x 2100 MHz, 35 W 350 MHz 1200 MHz Intel Xeon E-2176M 6 x 2700 MHz, 45 W 350 MHz ? MHz Intel Core i7-8850H 6 x 2600 MHz, 45 W 350 MHz 1150 MHz Intel Core i5-8600K 6 x 3600 MHz, 95 W 350 MHz 1150 MHz Intel Core i5-8500 6 x 3000 MHz, 65 W 350 MHz 1100 MHz Intel Core i7-8750H 6 x 2200 MHz, 45 W 350 MHz 1100 MHz Intel Core i5-8400 6 x 2800 MHz, 65 W 350 MHz 1050 MHz Intel Core i5-10400H 4 x 2600 MHz, 45 W 350 MHz 1100 MHz Intel Core i3-10320 4 x 3800 MHz, 65 W 350 MHz 1150 MHz Intel Core i5-10300H 4 x 2500 MHz, 45 W 350 MHz 1050 MHz Intel Core i5-8500T 6 x 2100 MHz, 35 W 350 MHz 1100 MHz Intel Core i5-9400H 4 x 2500 MHz, 45 W 350 MHz 1100 MHz Intel Core i5-9300H 4 x 2400 MHz, 45 W 350 MHz 1050 MHz Intel Core i5-8400H 4 x 2500 MHz, 45 W 350 MHz 1100 MHz Intel Core i5-8300H 4 x 2300 MHz, 45 W 350 MHz 1000 MHz Intel Core i3-8100H 4 x 3000 MHz, 45 W 350 MHz 1000 MHz min. - max. 350 MHz 1000 - 1250 MHz
CPU in Iris Plus Graphics 640 GPU Base Speed GPU Boost / Turbo Intel Core i7-7660U 2 x 2500 MHz, 15 W 300 MHz 1050 MHz Intel Core i7-7560U 2 x 2400 MHz, 15 W 300 MHz 1050 MHz Intel Core i5-7360U 2 x 2300 MHz, 15 W 300 MHz 1000 MHz Intel Core i5-7260U 2 x 2200 MHz, 15 W 300 MHz 950 MHz min. - max. 300 - 350 MHz 950 - 1250 MHz
Benchmarks Performance Rating - 3DMark 11 + Fire Strike + Time Spy - UHD Graphics 630
0.6 pt (2%)
...
...
3DMark - 3DMark Time Spy Score
6177 Points (18%)
min: 425 avg: 474.5 median: 479.5 (1%) max: 534 Points
min: 467 avg: 499.8 median: 494.5 (1%) max: 543 Points
3DMark - 3DMark Time Spy Graphics
6531 Points (17%)
min: 367 avg: 409.5 median: 414.5 (1%) max: 459 Points
min: 413 avg: 442.5 median: 437 (1%) max: 483 Points
3DMark - 3DMark Ice Storm Unlimited Graphics
442105 Points (50%)
min: 37815 avg: 97120 median: 106362 (12%) max: 122355 Points
min: 142163 avg: 147298 median: 145481 (16%) max: 154251 Points
3DMark - 3DMark Ice Storm Extreme Graphics
min: 19075 avg: 40640 median: 45176 (6%) max: 48377 Points
3DMark - 3DMark Cloud Gate Score
29364 Points (31%)
min: 3712 avg: 9196 median: 9545 (10%) max: 11286 Points
min: 7558 avg: 8025 median: 8067 (9%) max: 8711 Points
3DMark - 3DMark Cloud Gate Graphics
88161 Points (23%)
min: 3863 avg: 9333 median: 9798 (3%) max: 11199 Points
min: 10486 avg: 11119 median: 11248 (3%) max: 11495 Points
3DMark - 3DMark Fire Strike Standard Score
15061 Points (27%)
min: 779 avg: 1143 median: 1115 (2%) max: 1355 Points
min: 1236 avg: 1349 median: 1310 (2%) max: 1509 Points
3DMark - 3DMark Fire Strike Standard Graphics
18405 Points (21%)
min: 722 avg: 1228 median: 1211 (1%) max: 1472 Points
min: 1315 avg: 1411 median: 1393.5 (2%) max: 1541 Points
3DMark - 3DMark Ice Storm Graphics
min: 43334 avg: 63184 median: 68228 (8%) max: 74772 Points
3DMark - 3DMark Wild Life Unlimited
3195 Points (2%)
3DMark - 3DMark Wild Life Extreme Unlimited
882 Points (1%)
3DMark - 3DMark Night Raid
6929 Points (7%)
3DMark - 3DMark Night Raid Graphics Score
6446 Points (2%)
3DMark 11 - 3DM11 Performance Score
20106 Points (28%)
min: 790 avg: 1990 median: 2030 (3%) max: 2326 Points
min: 2136 avg: 2440 median: 2561 (4%) max: 2664 Points
3DMark 11 - 3DM11 Performance GPU
27503 Points (24%)
min: 642 avg: 1742 median: 1789.5 (2%) max: 2025 Points
min: 1980 avg: 2275 median: 2379 (2%) max: 2493 Points
3DMark Vantage + Intel UHD Graphics 630 3DMark Vantage - 3DM Vant. Perf. total
7704 Points (2%)
3DM Vant. Perf. GPU no PhysX + Intel UHD Graphics 630 3DMark Vantage - 3DM Vant. Perf. GPU no PhysX
6111 Points (3%)
3DMark 06 3DMark 06 - Standard 1280x1024 + NVIDIA GeForce GTX 1070 Ti (Desktop)
36475 Points (48%)
3DMark 06 - Standard 1280x1024 + Intel UHD Graphics 630
min: 11920 avg: 13425 median: 13216.5 (17%) max: 15020 Points
3DMark 06 - Standard 1280x1024 + Intel Iris Plus Graphics 640
min: 13164 avg: 14118 median: 14117.5 (18%) max: 15071 Points
Unigine Valley 1.0 - Unigine Valley 1.0 DX
min: 5.7 avg: 6.1 median: 6.1 (2%) max: 6.4 fps
6.5 fps (2%)
Unigine Heaven 3.0 - Unigine Heaven 3.0 DX 11
18.9 fps (6%)
SPECviewperf 12 + Intel UHD Graphics 630 SPECviewperf 12 - specvp12 sw-03
min: 28.56 avg: 28.8 median: 28.8 (7%) max: 29.03 fps
specvp12 snx-02 + Intel UHD Graphics 630 SPECviewperf 12 - specvp12 snx-02
min: 3.14 avg: 3.3 median: 3.3 (0%) max: 3.37 fps
specvp12 showcase-01 + Intel UHD Graphics 630 SPECviewperf 12 - specvp12 showcase-01
min: 7.98 avg: 8.2 median: 8.2 (2%) max: 8.38 fps
specvp12 mediacal-01 + Intel UHD Graphics 630 SPECviewperf 12 - specvp12 mediacal-01
min: 2.96 avg: 3.1 median: 3.1 (1%) max: 3.32 fps
specvp12 maya-04 + Intel UHD Graphics 630 SPECviewperf 12 - specvp12 maya-04
min: 14.66 avg: 15.2 median: 15.2 (4%) max: 15.67 fps
specvp12 energy-01 + Intel UHD Graphics 630 SPECviewperf 12 - specvp12 energy-01
min: 0.29 avg: 0.3 median: 0.3 (0%) max: 0.32 fps
specvp12 creo-01 + Intel UHD Graphics 630 SPECviewperf 12 - specvp12 creo-01
min: 13.57 avg: 14 median: 14 (6%) max: 14.51 fps
specvp12 catia-04 + Intel UHD Graphics 630 SPECviewperf 12 - specvp12 catia-04
min: 15.36 avg: 16 median: 16 (3%) max: 16.61 fps
specvp12 3dsmax-05 + Intel UHD Graphics 630 SPECviewperf 12 - specvp12 3dsmax-05
min: 11.27 avg: 12.6 median: 12.6 (2%) max: 14 fps
SPECviewperf 13 specvp13 sw-04 + Intel UHD Graphics 630 SPECviewperf 13 - specvp13 sw-04
min: 35.74 avg: 36.9 median: 36.9 (10%) max: 37.96 fps
specvp13 snx-03 + Intel UHD Graphics 630 SPECviewperf 13 - specvp13 snx-03
min: 5.64 avg: 5.9 median: 5.9 (1%) max: 6.07 fps
specvp13 showcase-02 + Intel UHD Graphics 630 SPECviewperf 13 - specvp13 showcase-02
min: 7.91 avg: 8.1 median: 8.1 (2%) max: 8.34 fps
specvp13 medical-02 + Intel UHD Graphics 630 SPECviewperf 13 - specvp13 medical-02
min: 2.13 avg: 2.2 median: 2.2 (0%) max: 2.28 fps
specvp13 maya-05 + Intel UHD Graphics 630 SPECviewperf 13 - specvp13 maya-05
min: 21.35 avg: 22.2 median: 22.2 (3%) max: 23.03 fps
specvp13 energy-02 + Intel UHD Graphics 630 SPECviewperf 13 - specvp13 energy-02
0.8 fps (0%)
specvp13 creo-02 + Intel UHD Graphics 630 SPECviewperf 13 - specvp13 creo-02
min: 17.54 avg: 18.2 median: 18.2 (3%) max: 18.83 fps
specvp13 catia-05 + Intel UHD Graphics 630 SPECviewperf 13 - specvp13 catia-05
min: 21.7 avg: 22.5 median: 22.5 (3%) max: 23.36 fps
specvp13 3dsmax-06 + Intel UHD Graphics 630 SPECviewperf 13 - specvp13 3dsmax-06
min: 14 avg: 14.5 median: 14.5 (3%) max: 14.98 fps
Cinebench R10 Cinebench R10 Shading (32bit) + Intel UHD Graphics 630 Cinebench R10 - Cinebench R10 Shading (32bit)
min: 6430 avg: 8573 median: 8578 (6%) max: 10435 Points
Cinebench R10 Shading (32bit) + Intel Iris Plus Graphics 640
min: 8824 avg: 9678 median: 9703 (7%) max: 10506 Points
Cinebench R11.5 Cinebench R11.5 OpenGL 64 Bit + Intel UHD Graphics 630 Cinebench R11.5 - Cinebench R11.5 OpenGL 64 Bit
min: 42.77 avg: 46.8 median: 46.9 (16%) max: 50.6 fps
Cinebench R11.5 OpenGL 64 Bit + Intel Iris Plus Graphics 640
46.1 fps (16%)
Cinebench R15 + Intel UHD Graphics 630 Cinebench R15 - Cinebench R15 OpenGL 64 Bit
min: 17 avg: 52.2 median: 54.5 (3%) max: 63.1 fps
Cinebench R15 OpenGL 64 Bit + Intel Iris Plus Graphics 640
min: 41.32 avg: 54 median: 56.2 (3%) max: 62.3 fps
Cinebench R15 OpenGL Ref. Match 64 Bit + Intel UHD Graphics 630 Cinebench R15 - Cinebench R15 OpenGL Ref. Match 64 Bit
min: 97.8 avg: 97.8 median: 97.8 (98%) max: 98 %
Cinebench R15 OpenGL Ref. Match 64 Bit + Intel Iris Plus Graphics 640
min: 97.8 avg: 98.2 median: 97.8 (98%) max: 99.3 %
GFXBench - GFXBench Car Chase Offscreen
40.7 fps (5%)
GFXBench 3.1 - GFXBench Manhattan ES 3.1 Offscreen
56.1 fps (1%)
GFXBench 3.0 - GFXBench 3.0 Manhattan Offscreen
31.2 fps (2%)
GFXBench (DX / GLBenchmark) 2.7 + Intel Iris Plus Graphics 640 GFXBench (DX / GLBenchmark) 2.7 - GFXBench T-Rex HD Offscreen C24Z16
171 fps (1%)
Basemark GPU 1.2 - Basemark GPU 1.2 Vulkan Official Medium Offscreen 1080
105 fps (1%)
Geekbench 6.2 - Geekbench 6.2 GPU OpenCL
5449 Points (2%)
Geekbench 6.2 - Geekbench 6.2 GPU Vulkan
5749 Points (2%)
LuxMark v2.0 64Bit - LuxMark v2.0 Room GPU
2542 Samples/s (11%)
363 Samples/s (2%)
min: 315 avg: 325 median: 325 (1%) max: 335 Samples/s
LuxMark v2.0 64Bit - LuxMark v2.0 Sala GPU
5159 Samples/s (9%)
696 Samples/s (1%)
min: 748 avg: 779 median: 778.5 (1%) max: 809 Samples/s
ComputeMark v2.1 - ComputeMark v2.1 Result
15488 Points (17%)
894 Points (1%)
min: 1575 avg: 1677 median: 1677 (2%) max: 1779 Points
Power Consumption - Furmark Stress Test Power Consumption - external Monitor *
291 Watt (41%)
min: 35.2 avg: 50.7 median: 54.9 (8%) max: 61.9 Watt
min: 30.8 avg: 33.6 median: 31.5 (4%) max: 38.5 Watt
Power Consumption - The Witcher 3 Power Consumption - external Monitor *
290 Watt (41%)
min: 28 avg: 33.5 median: 33.5 (5%) max: 38.9 Watt
Power Consumption - Witcher 3 Power Consumption *
min: 31.7 avg: 34.9 median: 34.9 (8%) max: 38.1 Watt
Power Consumption - Witcher 3 ultra Power Efficiency - external Monitor
0.2 fps per Watt (21%)
0.1 fps per Watt (9%)
Emissions Witcher 3 Fan Noise + Intel Iris Plus Graphics 640 Emissions - Witcher 3 Fan Noise
33.4 dB(A) (53%)
Clock Speed - GPU Clock Witcher 3 ultra
1810 MHz (71%)
min: 748 avg: 823 median: 823 (32%) max: 898 MHz
Clock Speed - GPU Clock Speed Furmark
1677 MHz (66%)
min: 570 avg: 634 median: 634 (25%) max: 698 MHz
Average Benchmarks NVIDIA GeForce GTX 1070 Ti (Desktop) → 100% n=13 Average Benchmarks Intel UHD Graphics 630 → 14% n=13 Average Benchmarks Intel Iris Plus Graphics 640 → 16% n=13
- Range of benchmark values for this graphics card
- Average benchmark values for this graphics card
* Smaller numbers mean a higher performance
1 This benchmark is not used for the average calculation
Game Benchmarks The following benchmarks stem from our benchmarks of review laptops. The performance depends on the used graphics memory, clock rate, processor, system settings, drivers, and operating systems. So the results don't have to be representative for all laptops with this GPU. For detailed information on the benchmark results, click on the fps number.
UHD Graphics 630:
6 [X] Lenovo Legion 5 15IMH05H 81Y600D7GE Intel Core i5-10300H 2.5GHz
UHD Graphics 630
min:
3.11 fps, P0.1:
3.4 fps, P1:
4.71 fps, max:
15.7 fps
fps
UHD Graphics 630:
42.7 [X] Lenovo Legion 5 15IMH05H 81Y600D7GE Intel Core i5-10300H 2.5GHz
UHD Graphics 630
min:
9.85 fps, P0.1:
10.2 fps, P1:
32.7 fps, max:
128.8 fps
fps
UHD Graphics 630:
22.4 [X] Lenovo Legion 5 15IMH05H 81Y600D7GE Intel Core i5-10300H 2.5GHz
UHD Graphics 630
min:
8 fps, P0.1:
8.22 fps, P1:
17.8 fps, max:
134 fps
fps
UHD Graphics 630:
22.1 [X] Lenovo Legion 5 15IMH05H 81Y600D7GE Intel Core i5-10300H 2.5GHz
UHD Graphics 630
min:
6.98 fps, P0.1:
7.6 fps, P1:
17.4 fps, max:
73.6 fps
fps
UHD Graphics 630:
11.7 [X] Lenovo Legion 5 15IMH05H 81Y600D7GE Intel Core i5-10300H 2.5GHz
UHD Graphics 630
min:
9.59 fps, P0.1:
9.66 fps, P1:
10 fps, max:
13.9 fps
fps
UHD Graphics 630:
16.4 [X] Lenovo Legion 5 15IMH05H 81Y600D7GE Intel Core i5-10300H 2.5GHz
UHD Graphics 630
fps
UHD Graphics 630:
13.1 [X] Lenovo Legion 5 15IMH05H 81Y600D7GE Intel Core i5-10300H 2.5GHz
UHD Graphics 630
min:
1.47 fps, P0.1:
2.84 fps, P1:
11.3 fps, max:
85.1 fps
fps
UHD Graphics 630:
27.3 [X] Lenovo Legion 5 15IMH05H 81Y600D7GE Intel Core i5-10300H 2.5GHz
UHD Graphics 630
min:
14.3 fps, P0.1:
14.3 fps, P1:
15.1 fps, max:
82.6 fps
fps
UHD Graphics 630:
19.3 [X] Lenovo Legion 5 15IMH05H 81Y600D7GE Intel Core i5-10300H 2.5GHz
UHD Graphics 630
min:
9.8 fps, P0.1:
10.1 fps, P1:
11.4 fps, max:
40.9 fps
fps
UHD Graphics 630:
8.6 [X] Lenovo Legion 5 15IMH05H 81Y600D7GE Intel Core i5-10300H 2.5GHz
UHD Graphics 630
min:
6.11 fps, P0.1:
6.12 fps, P1:
6.23 fps, max:
12.5 fps
fps
UHD Graphics 630:
4.9 [X] Lenovo Legion 5 15IMH05H 81Y600D7GE 2.02
Intel Core i5-10300H 2.5GHz
UHD Graphics 630
min:
3.68 fps, max:
6.91 fps
fps
UHD Graphics 630:
9.8 [X] HP ZBook 17 G5 2XD24AV Intel Core i5-8400H 2.5GHz
UHD Graphics 630
min:
2.18 fps, P0.1:
2.22 fps, P1:
5.4 fps, max:
57.4 fps
fps
UHD Graphics 630:
4.9 [X] HP ZBook 17 G5 2XD24AV Intel Core i5-8400H 2.5GHz
UHD Graphics 630
min:
2.34 fps, P0.1:
2.34 fps, P1:
4.4 fps, max:
123.3 fps
fps
UHD Graphics 630:
3.8 [X] HP ZBook 17 G5 2XD24AV Intel Core i5-8400H 2.5GHz
UHD Graphics 630
min:
2.8 fps, P0.1:
2.82 fps, P1:
2.86 fps, max:
5.11 fps
fps
UHD Graphics 630:
9.8 [X] Lenovo Legion 5 15IMH05H 81Y600D7GE Intel Core i5-10300H 2.5GHz
UHD Graphics 630
min:
8.07 fps, P0.1:
8.07 fps, P1:
8.14 fps, max:
11.5 fps
fps
UHD Graphics 630:
8.8 [X] HP ZBook 17 G5 2XD24AV Intel Core i5-8400H 2.5GHz
UHD Graphics 630
min:
4.2 fps, P0.1:
4.21 fps, P1:
4.35 fps, max:
127.7 fps
fps
UHD Graphics 630:
2.6 [X] HP ZBook 17 G5 2XD24AV Intel Core i5-8400H 2.5GHz
UHD Graphics 630
min:
2.23 fps, P0.1:
2.24 fps, P1:
2.3 fps, max:
3.17 fps
fps
UHD Graphics 630:
8 [X] Acer Aspire 7 A715-72G-75QE Intel Core i7-8750H 2.2GHz
UHD Graphics 630
min:
7.38 fps, P0.1:
7.38 fps, P1:
7.43 fps, max:
8.53 fps
fps
UHD Graphics 630:
5.3 [X] Acer Aspire 7 A715-72G-75QE Intel Core i7-8750H 2.2GHz
UHD Graphics 630
min:
3.38 fps, P0.1:
3.48 fps, P1:
4.27 fps, max:
10.1 fps
fps
UHD Graphics 630:
10.8 [X] Acer Aspire 7 A715-72G-75QE Intel Core i7-8750H 2.2GHz
UHD Graphics 630
min:
4.66 fps, P0.1:
4.67 fps, P1:
5.27 fps, max:
136.1 fps
fps
UHD Graphics 630:
6.9 [X] Acer Aspire 7 A715-72G-75QE Intel Core i7-8750H 2.2GHz
UHD Graphics 630
fps
UHD Graphics 630:
6.7 (!) [X] Lenovo Legion 5 15IMH05H 81Y600D7GE Intel Core i5-10300H 2.5GHz
UHD Graphics 630
min:
2.91 fps, P0.1:
3.96 fps, P1:
5.58 fps, max:
336 fps
fps
UHD Graphics 630:
4.6 [X] HP ZBook 17 G5 2XD24AV Intel Core i5-8400H 2.5GHz
UHD Graphics 630
min:
4.05 fps, P0.1:
4.06 fps, P1:
4.11 fps, max:
5.19 fps
fps
UHD Graphics 630:
14.3 [X] HP ZBook 17 G5 2XD24AV Intel Core i5-8400H 2.5GHz
UHD Graphics 630
min:
9.93 fps, P0.1:
11.3 fps, P1:
13.2 fps, max:
19.5 fps
fps
UHD Graphics 630:
16.6 [X] Acer Aspire 7 A715-72G-75QE Intel Core i7-8750H 2.2GHz
UHD Graphics 630
min:
12.4 fps, P0.1:
12.5 fps, P1:
13 fps, max:
22.1 fps
fps
UHD Graphics 630:
10.7 [X] Acer Aspire 7 A715-72G-75QE Intel Core i7-8750H 2.2GHz
UHD Graphics 630
min:
6.7 fps, P0.1:
6.83 fps, P1:
7.96 fps, max:
29.3 fps
fps
UHD Graphics 630:
8.4 [X] Acer Aspire 7 A715-72G-75QE Intel Core i7-8750H 2.2GHz
UHD Graphics 630
min:
6.12 fps, P0.1:
6.37 fps, P1:
7.08 fps, max:
12.5 fps
fps
UHD Graphics 630:
8 [X] HP ZBook 17 G5 2XD24AV Intel Core i5-8400H 2.5GHz
UHD Graphics 630
fps
UHD Graphics 630:
4.9 [X] HP ZBook 17 G5 2XD24AV Intel Core i5-8400H 2.5GHz
UHD Graphics 630
min:
3.5 fps, max:
7 fps
fps
UHD Graphics 630:
22 [X] Acer Aspire 7 A715-72G-75QE Intel Core i7-8750H 2.2GHz
UHD Graphics 630
min:
15.2 fps, max:
28.6 fps
fps
UHD Graphics 630:
16.2 [X] Acer Aspire 7 A715-72G-75QE Intel Core i7-8750H 2.2GHz
UHD Graphics 630
min:
12.3 fps, max:
21.5 fps
fps
UHD Graphics 630:
12.8 [X] Acer Aspire 7 A715-72G-75QE Intel Core i7-8750H 2.2GHz
UHD Graphics 630
min:
9.8 fps, max:
16.1 fps
fps
UHD Graphics 630:
10 [X] HP ZBook 17 G5 2XD24AV Intel Core i5-8400H 2.5GHz
UHD Graphics 630
min:
7 fps, max:
13 fps
fps
UHD Graphics 630:
40.5 [X] Acer Aspire 7 A715-72G-75QE Intel Core i7-8750H 2.2GHz
UHD Graphics 630
min:
10.3 fps, P0.1:
12.9 fps, P1:
20.5 fps, max:
161.7 fps
fps
UHD Graphics 630:
18 [X] Acer Aspire 7 A715-72G-75QE Intel Core i7-8750H 2.2GHz
UHD Graphics 630
fps
UHD Graphics 630:
10 [X] HP ZBook 17 G5 2XD24AV Intel Core i5-8400H 2.5GHz
UHD Graphics 630
min:
8 fps, max:
14 fps
fps
UHD Graphics 630:
21.3 [X] Acer Aspire 7 A715-72G-75QE Intel Core i7-8750H 2.2GHz
UHD Graphics 630
min:
7.48 fps, P0.1:
8.39 fps, P1:
9.92 fps, max:
217 fps
fps
UHD Graphics 630:
8.7 [X] Acer Aspire 7 A715-72G-75QE Intel Core i7-8750H 2.2GHz
UHD Graphics 630
min:
3.69 fps, P0.1:
3.78 fps, P1:
4.12 fps, max:
165.5 fps
fps
UHD Graphics 630:
21.6 [X] HP ZBook 17 G5 2XD24AV Intel Core i5-8400H 2.5GHz
UHD Graphics 630
min:
4.02 fps, P0.1:
7.13 fps, P1:
17.7 fps, max:
98 fps
fps
UHD Graphics 630:
11.8 [X] Medion Erazer Beast X20 Intel Core i7-10870H 2.2GHz
UHD Graphics 630
min:
3.39 fps, P0.1:
4.05 fps, P1:
7.89 fps, max:
72.8 fps
fps
UHD Graphics 630:
38.5 [X] Medion Erazer Beast X20 Intel Core i7-10870H 2.2GHz
UHD Graphics 630
min:
13.2 fps, P0.1:
16.2 fps, P1:
24.3 fps, max:
74.4 fps
fps
UHD Graphics 630:
16.1 [X] Medion Erazer Beast X20 Intel Core i7-10870H 2.2GHz
UHD Graphics 630
min:
9.69 fps, P0.1:
10.5 fps, P1:
11.9 fps, max:
30 fps
fps
UHD Graphics 630:
9.6 [X] Medion Erazer Beast X20 Intel Core i7-10870H 2.2GHz
UHD Graphics 630
min:
1.075 fps, P0.1:
1.502 fps, P1:
6.88 fps, max:
26.1 fps
fps
UHD Graphics 630:
20.7 [X] Medion Erazer Beast X20 Intel Core i7-10870H 2.2GHz
UHD Graphics 630
min:
1.589 fps, P0.1:
2.12 fps, P1:
7.07 fps, max:
63.8 fps
fps
UHD Graphics 630:
13.2 [X] Medion Erazer Beast X20 Intel Core i7-10870H 2.2GHz
UHD Graphics 630
min:
8.35 fps, P0.1:
8.6 fps, P1:
9.62 fps, max:
19.8 fps
fps
UHD Graphics 630:
21.8 [X] Medion Erazer Beast X20 Intel Core i7-10870H 2.2GHz
UHD Graphics 630
fps
UHD Graphics 630:
8 [X] Medion Erazer Beast X20 Intel Core i7-10870H 2.2GHz
UHD Graphics 630
fps
UHD Graphics 630:
16 [X] Medion Erazer Beast X20 Intel Core i7-10870H 2.2GHz
UHD Graphics 630
min:
5.24 fps, P0.1:
5.42 fps, P1:
10.2 fps, max:
58.9 fps
fps
UHD Graphics 630:
5.7 [X] Medion Erazer Beast X20 Intel Core i7-10870H 2.2GHz
UHD Graphics 630
min:
1.948 fps, P0.1:
1.965 fps, P1:
3.99 fps, max:
50.4 fps
fps
UHD Graphics 630:
59.1 [X] Medion Erazer Beast X20 Intel Core i7-10870H 2.2GHz
UHD Graphics 630
min:
43.8 fps, P0.1:
45.4 fps, P1:
51.2 fps, max:
83.9 fps
fps
UHD Graphics 630:
29.8 [X] Medion Erazer Beast X20 Intel Core i7-10870H 2.2GHz
UHD Graphics 630
min:
23.2 fps, P0.1:
23.6 fps, P1:
24.5 fps, max:
42.7 fps
fps
UHD Graphics 630:
27.5 [X] Medion Erazer Beast X20 Intel Core i7-10870H 2.2GHz
UHD Graphics 630
min:
5.03 fps, P0.1:
12.4 fps, P1:
22.7 fps, max:
190 fps
fps
UHD Graphics 630:
11.9 [X] HP ZBook 17 G5 2XD24AV Intel Core i5-8400H 2.5GHz
UHD Graphics 630
min:
6.7 fps, P0.1:
6.85 fps, P1:
7.72 fps, max:
61.6 fps
fps
UHD Graphics 630:
31.9 [X] Medion Erazer Beast X20 Intel Core i7-10870H 2.2GHz
UHD Graphics 630
min:
3.49 fps, P0.1:
7.2 fps, P1:
11.8 fps, max:
150 fps
fps
UHD Graphics 630:
7 [X] Medion Erazer Beast X20 Intel Core i7-10870H 2.2GHz
UHD Graphics 630
min:
1.281 fps, P0.1:
1.611 fps, P1:
3.09 fps, max:
55.1 fps
fps
UHD Graphics 630:
21.6 [X] Medion Erazer Beast X20 Intel Core i7-10870H 2.2GHz
UHD Graphics 630
min:
4.18 fps, P0.1:
4.21 fps, P1:
4.46 fps, max:
147 fps
fps
UHD Graphics 630:
4.9 [X] Medion Erazer Beast X20 Intel Core i7-10870H 2.2GHz
UHD Graphics 630
min:
1.134 fps, P0.1:
1.138 fps, P1:
1.188 fps, max:
124 fps
fps
UHD Graphics 630:
11.7 [X] Acer Aspire 7 A715-72G-75QE Intel Core i7-8750H 2.2GHz
UHD Graphics 630
min:
4.37 fps, P0.1:
4.48 fps, P1:
7.78 fps, max:
42.7 fps
fps
UHD Graphics 630:
13.7 [X] Medion Erazer Beast X20 Intel Core i7-10870H 2.2GHz
UHD Graphics 630
min:
3.55 fps, P0.1:
5.92 fps, P1:
11.9 fps, max:
24.9 fps
fps
UHD Graphics 630:
7.8 [X] Medion Erazer Beast X20 Intel Core i7-10870H 2.2GHz
UHD Graphics 630
min:
5.62 fps, P0.1:
5.83 fps, P1:
6.44 fps, max:
9.07 fps
fps
UHD Graphics 630:
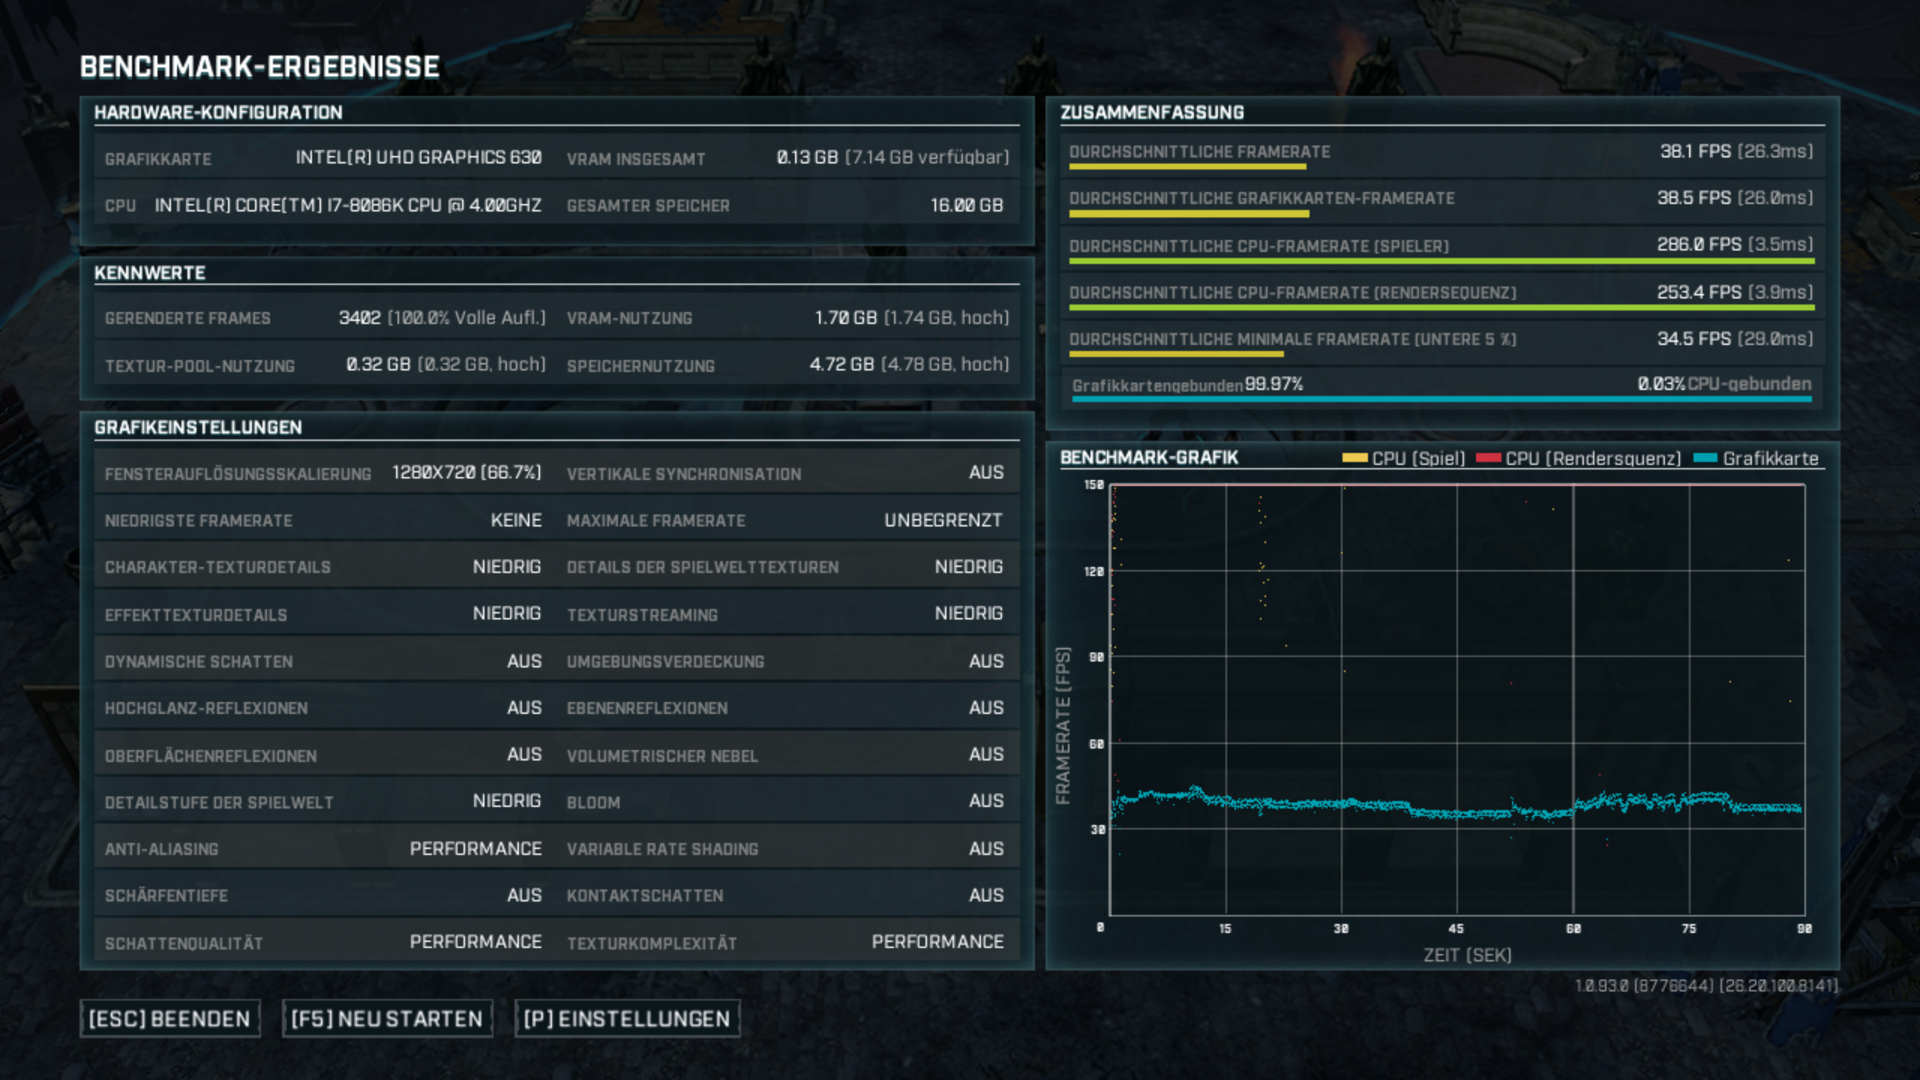
38.1 □ [X] Aorus Z370 Ultra Gaming Desktop DDR4-2666 Intel Core i7-8086K 3.7GHz
UHD Graphics 630
fps
UHD Graphics 630:
13.2 [X] Aorus Z370 Ultra Gaming Desktop DDR4-2666 Intel Core i7-8086K 3.7GHz
UHD Graphics 630
fps
UHD Graphics 630:
7.5 [X] Aorus Z370 Ultra Gaming Desktop DDR4-2666 Intel Core i7-8086K 3.7GHz
UHD Graphics 630
fps
UHD Graphics 630:
5.4 [X] Aorus Z370 Ultra Gaming Desktop DDR4-2666 Intel Core i7-8086K 3.7GHz
UHD Graphics 630
fps
UHD Graphics 630:
16.8 [X] Acer Aspire 7 A715-72G-75QE Intel Core i7-8750H 2.2GHz
UHD Graphics 630
min:
12.1 fps, P0.1:
12.2 fps, P1:
12.4 fps, max:
20.6 fps
fps
UHD Graphics 630:
8.4 [X] Acer Aspire 7 A715-72G-75QE Intel Core i7-8750H 2.2GHz
UHD Graphics 630
min:
6.36 fps, P0.1:
6.37 fps, P1:
6.5 fps, max:
9.79 fps
fps
UHD Graphics 630:
17.3 [X] Aorus Z370 Ultra Gaming Desktop DDR4-2666 Intel Core i7-8086K 3.7GHz
UHD Graphics 630
min:
13 fps, max:
24 fps
fps
UHD Graphics 630:
13.4 [X] Medion Erazer Beast X20 Intel Core i7-10870H 2.2GHz
UHD Graphics 630
min:
11.6 fps, max:
16.5 fps
fps
UHD Graphics 630:
7.4 [X] Medion Erazer Beast X20 Intel Core i7-10870H 2.2GHz
UHD Graphics 630
min:
5.3 fps, max:
6.2 fps
fps
UHD Graphics 630:
9 [X] Medion Erazer Beast X20 Intel Core i7-10870H 2.2GHz
UHD Graphics 630
min:
4.5 fps, P0.1:
4.52 fps, P1:
4.74 fps, max:
53.3 fps
fps
UHD Graphics 630:
7.5 [X] Medion Erazer Beast X20 Intel Core i7-10870H 2.2GHz
UHD Graphics 630
min:
3.54 fps, P0.1:
3.59 fps, P1:
5.21 fps, max:
54.6 fps
fps
UHD Graphics 630:
73.7 [X] Asus G703GXR Intel Core i7-9750H 2.6GHz
UHD Graphics 630
min:
67 fps
fps
UHD Graphics 630:
37.4 [X] Asus G703GXR Intel Core i7-9750H 2.6GHz
UHD Graphics 630
min:
35 fps
fps
UHD Graphics 630:
34.4 [X] Asus G703GXR Intel Core i7-9750H 2.6GHz
UHD Graphics 630
min:
31 fps
fps
UHD Graphics 630:
27 [X] Asus G703GXR Intel Core i7-9750H 2.6GHz
UHD Graphics 630
min:
22 fps
fps
UHD Graphics 630:
17.8 [X] Lenovo Legion Y740-17IRH Intel Core i7-9750H 2.6GHz
UHD Graphics 630
fps
UHD Graphics 630:
6.8 [X] Lenovo Legion Y740-17IRH Intel Core i7-9750H 2.6GHz
UHD Graphics 630
fps
100%
GeForce GTX 1070 Ti (Desktop):
200 [X] i7-7740X Asus X299 Prime Intel Core i7-7740X 4.3GHz
GeForce GTX 1070 Ti (Desktop)
min:
173 fps, max:
219 fps
fps
8%
UHD Graphics 630:
16.2 [X] Lenovo Legion Y740-17IRH Intel Core i7-9750H 2.6GHz
UHD Graphics 630
fps
100%
GeForce GTX 1070 Ti (Desktop):
78 [X] i7-7740X Asus X299 Prime Intel Core i7-7740X 4.3GHz
GeForce GTX 1070 Ti (Desktop)
min:
68 fps, max:
88 fps
fps
100%
GeForce GTX 1070 Ti (Desktop):
58.5 [X] i7-7740X Asus X299 Prime Intel Core i7-7740X 4.3GHz
GeForce GTX 1070 Ti (Desktop)
min:
50 fps, max:
67 fps
fps
100%
GeForce GTX 1070 Ti (Desktop):
37.1 [X] i7-7740X Asus X299 Prime Intel Core i7-7740X 4.3GHz
GeForce GTX 1070 Ti (Desktop)
min:
31 fps, max:
43 fps
fps
100%
GeForce GTX 1070 Ti (Desktop):
17.9 [X] i7-7740X Asus X299 Prime Intel Core i7-7740X 4.3GHz
GeForce GTX 1070 Ti (Desktop)
min:
15 fps, max:
21 fps
fps
100%
GeForce GTX 1070 Ti (Desktop):
244 [X] i7-7740X Asus X299 Prime Intel Core i7-7740X 4.3GHz
GeForce GTX 1070 Ti (Desktop)
min:
195 fps, max:
269 fps
fps
14%
UHD Graphics 630:
35 [X] Lenovo Legion Y740-17IRH Intel Core i7-9750H 2.6GHz
UHD Graphics 630
fps
100%
GeForce GTX 1070 Ti (Desktop):
183 [X] i7-7740X Asus X299 Prime Intel Core i7-7740X 4.3GHz
GeForce GTX 1070 Ti (Desktop)
min:
155 fps, max:
196 fps
fps
7%
UHD Graphics 630:
13 [X] Lenovo Legion Y740-17IRH Intel Core i7-9750H 2.6GHz
UHD Graphics 630
fps
100%
GeForce GTX 1070 Ti (Desktop):
164 [X] i7-7740X Asus X299 Prime Intel Core i7-7740X 4.3GHz
GeForce GTX 1070 Ti (Desktop)
min:
145 fps, max:
176 fps
fps
100%
GeForce GTX 1070 Ti (Desktop):
120 [X] i7-7740X Asus X299 Prime Intel Core i7-7740X 4.3GHz
GeForce GTX 1070 Ti (Desktop)
min:
112 fps, max:
129 fps
fps
100%
GeForce GTX 1070 Ti (Desktop):
94 [X] i7-7740X Asus X299 Prime Intel Core i7-7740X 4.3GHz
GeForce GTX 1070 Ti (Desktop)
min:
86 fps, max:
98 fps
fps
100%
GeForce GTX 1070 Ti (Desktop):
57 [X] i7-7740X Asus X299 Prime Intel Core i7-7740X 4.3GHz
GeForce GTX 1070 Ti (Desktop)
min:
52 fps, max:
60 fps
fps
100%
GeForce GTX 1070 Ti (Desktop):
271 [X] i7-7740X Asus X299 Prime Intel Core i7-7740X 4.3GHz
GeForce GTX 1070 Ti (Desktop)
min:
209 fps, max:
313 fps
fps
66%
UHD Graphics 630:
177.9 [X] Medion Erazer X15805 Intel Core i9-8950HK 2.9GHz
UHD Graphics 630
fps
100%
GeForce GTX 1070 Ti (Desktop):
249 [X] i7-7740X Asus X299 Prime Intel Core i7-7740X 4.3GHz
GeForce GTX 1070 Ti (Desktop)
min:
201 fps, max:
284 fps
fps
60%
UHD Graphics 630:
149.2 [X] Medion Erazer X15805 Intel Core i9-8950HK 2.9GHz
UHD Graphics 630
fps
100%
GeForce GTX 1070 Ti (Desktop):
241 [X] i7-7740X Asus X299 Prime Intel Core i7-7740X 4.3GHz
GeForce GTX 1070 Ti (Desktop)
min:
189 fps, max:
269 fps
fps
46%
UHD Graphics 630:
111.4 [X] Medion Erazer X15805 Intel Core i9-8950HK 2.9GHz
UHD Graphics 630
fps
100%
GeForce GTX 1070 Ti (Desktop):
219 [X] i7-7740X Asus X299 Prime Intel Core i7-7740X 4.3GHz
GeForce GTX 1070 Ti (Desktop)
min:
159 fps, max:
243 fps
fps
47%
UHD Graphics 630:
103.7 [X] Medion Erazer X15805 Intel Core i9-8950HK 2.9GHz
UHD Graphics 630
fps
100%
GeForce GTX 1070 Ti (Desktop):
222 [X] i7-7740X Asus X299 Prime Intel Core i7-7740X 4.3GHz
GeForce GTX 1070 Ti (Desktop)
min:
176 fps, max:
250 fps
fps
100%
GeForce GTX 1070 Ti (Desktop):
221 [X] i7-7740X Asus X299 Prime Intel Core i7-7740X 4.3GHz
GeForce GTX 1070 Ti (Desktop)
min:
161 fps, max:
247 fps
fps
UHD Graphics 630:
43.2 [X] Lenovo Legion Y740-17IRH Intel Core i7-9750H 2.6GHz
UHD Graphics 630
min:
36 fps, max:
48 fps
fps
UHD Graphics 630:
12.4 [X] Lenovo Legion Y740-17IRH Intel Core i7-9750H 2.6GHz
UHD Graphics 630
min:
9 fps, max:
15 fps
fps
100%
GeForce GTX 1070 Ti (Desktop):
86.6 [X] i7-7740X Asus X299 Prime Intel Core i7-7740X 4.3GHz
GeForce GTX 1070 Ti (Desktop)
min:
71 fps, max:
102 fps
fps
100%
GeForce GTX 1070 Ti (Desktop):
63.4 [X] i7-7740X Asus X299 Prime Intel Core i7-7740X 4.3GHz
GeForce GTX 1070 Ti (Desktop)
min:
56 fps, max:
76 fps
fps
100%
GeForce GTX 1070 Ti (Desktop):
41.2 [X] i7-7740X Asus X299 Prime Intel Core i7-7740X 4.3GHz
GeForce GTX 1070 Ti (Desktop)
min:
36 fps, max:
47 fps
fps
100%
GeForce GTX 1070 Ti (Desktop):
20.3 [X] i7-7740X Asus X299 Prime Intel Core i7-7740X 4.3GHz
GeForce GTX 1070 Ti (Desktop)
min:
17 fps, max:
22 fps
fps
UHD Graphics 630:
16.6 [X] Medion Erazer X15805 Intel Core i9-8950HK 2.9GHz
UHD Graphics 630
fps
100%
GeForce GTX 1070 Ti (Desktop):
46 [X] i7-7740X Asus X299 Prime Intel Core i7-7740X 4.3GHz
GeForce GTX 1070 Ti (Desktop)
min:
39 fps, max:
54 fps
fps
100%
GeForce GTX 1070 Ti (Desktop):
40.4 [X] i7-7740X Asus X299 Prime Intel Core i7-7740X 4.3GHz
GeForce GTX 1070 Ti (Desktop)
min:
34 fps, max:
44 fps
fps
100%
GeForce GTX 1070 Ti (Desktop):
24.1 [X] i7-7740X Asus X299 Prime Intel Core i7-7740X 4.3GHz
GeForce GTX 1070 Ti (Desktop)
min:
22 fps, max:
26 fps
fps
UHD Graphics 630:
23 [X] Medion Erazer X15805 Intel Core i9-8950HK 2.9GHz
UHD Graphics 630
fps
UHD Graphics 630:
9 [X] Medion Erazer X15805 Intel Core i9-8950HK 2.9GHz
UHD Graphics 630
fps
UHD Graphics 630:
52.1 [X] Medion Erazer X15805 Intel Core i9-8950HK 2.9GHz
UHD Graphics 630
fps
UHD Graphics 630:
16 [X] Medion Erazer X15805 Intel Core i9-8950HK 2.9GHz
UHD Graphics 630
fps
UHD Graphics 630:
12.9 [X] Medion Erazer X15805 Intel Core i9-8950HK 2.9GHz
UHD Graphics 630
fps
100%
GeForce GTX 1070 Ti (Desktop):
121 [X] i7-7740X Asus X299 Prime Intel Core i7-7740X 4.3GHz
GeForce GTX 1070 Ti (Desktop)
min:
93 fps, max:
174 fps
fps
14%
UHD Graphics 630:
17 [X] Medion Erazer X15805 Intel Core i9-8950HK 2.9GHz
UHD Graphics 630
fps
100%
GeForce GTX 1070 Ti (Desktop):
107 [X] i7-7740X Asus X299 Prime Intel Core i7-7740X 4.3GHz
GeForce GTX 1070 Ti (Desktop)
min:
83 fps, max:
140 fps
fps
7%
UHD Graphics 630:
8 [X] Medion Erazer X15805 Intel Core i9-8950HK 2.9GHz
UHD Graphics 630
fps
100%
GeForce GTX 1070 Ti (Desktop):
103 [X] i7-7740X Asus X299 Prime Intel Core i7-7740X 4.3GHz
GeForce GTX 1070 Ti (Desktop)
min:
84 fps, max:
132 fps
fps
100%
GeForce GTX 1070 Ti (Desktop):
93 [X] i7-7740X Asus X299 Prime Intel Core i7-7740X 4.3GHz
GeForce GTX 1070 Ti (Desktop)
min:
72 fps, max:
127 fps
fps
100%
GeForce GTX 1070 Ti (Desktop):
76 [X] i7-7740X Asus X299 Prime Intel Core i7-7740X 4.3GHz
GeForce GTX 1070 Ti (Desktop)
min:
60 fps, max:
95 fps
fps
100%
GeForce GTX 1070 Ti (Desktop):
42 [X] i7-7740X Asus X299 Prime Intel Core i7-7740X 4.3GHz
GeForce GTX 1070 Ti (Desktop)
min:
34 fps, max:
51 fps
fps
100%
GeForce GTX 1070 Ti (Desktop):
147 [X] i7-7740X Asus X299 Prime Intel Core i7-7740X 4.3GHz
GeForce GTX 1070 Ti (Desktop)
min:
77.86 fps, max:
237.53 fps
fps
10%
UHD Graphics 630:
15.4 [X] Medion Erazer X15805 Intel Core i9-8950HK 2.9GHz
UHD Graphics 630
fps
100%
GeForce GTX 1070 Ti (Desktop):
83 [X] i7-7740X Asus X299 Prime Intel Core i7-7740X 4.3GHz
GeForce GTX 1070 Ti (Desktop)
min:
40.8 fps, max:
146.74 fps
fps
9%
UHD Graphics 630:
7.6 [X] Medion Erazer X15805 Intel Core i9-8950HK 2.9GHz
UHD Graphics 630
fps
100%
GeForce GTX 1070 Ti (Desktop):
63 [X] i7-7740X Asus X299 Prime Intel Core i7-7740X 4.3GHz
GeForce GTX 1070 Ti (Desktop)
min:
32.59 fps, max:
112.4 fps
fps
100%
GeForce GTX 1070 Ti (Desktop):
52.3 [X] i7-7740X Asus X299 Prime Intel Core i7-7740X 4.3GHz
GeForce GTX 1070 Ti (Desktop)
min:
28.83 fps, max:
88.2 fps
fps
100%
GeForce GTX 1070 Ti (Desktop):
40.2 [X] i7-7740X Asus X299 Prime Intel Core i7-7740X 4.3GHz
GeForce GTX 1070 Ti (Desktop)
min:
24.15 fps, max:
62.69 fps
fps
100%
GeForce GTX 1070 Ti (Desktop):
24.6 [X] i7-7740X Asus X299 Prime Intel Core i7-7740X 4.3GHz
GeForce GTX 1070 Ti (Desktop)
min:
16.12 fps, max:
36.5 fps
fps
100%
GeForce GTX 1070 Ti (Desktop):
144 [X] i7-7740X Asus X299 Prime Intel Core i7-7740X 4.3GHz
GeForce GTX 1070 Ti (Desktop)
min:
143 fps, max:
145 fps
fps
24%
UHD Graphics 630:
35.1 [X] Medion Erazer X15805 Intel Core i9-8950HK 2.9GHz
UHD Graphics 630
fps
100%
GeForce GTX 1070 Ti (Desktop):
138 [X] i7-7740X Asus X299 Prime Intel Core i7-7740X 4.3GHz
GeForce GTX 1070 Ti (Desktop)
min:
128 fps, max:
145 fps
fps
9%
UHD Graphics 630:
13.1 [X] Medion Erazer X15805 Intel Core i9-8950HK 2.9GHz
UHD Graphics 630
fps
100%
GeForce GTX 1070 Ti (Desktop):
123 [X] i7-7740X Asus X299 Prime Intel Core i7-7740X 4.3GHz
GeForce GTX 1070 Ti (Desktop)
min:
110 fps, max:
145 fps
fps
100%
GeForce GTX 1070 Ti (Desktop):
121 [X] i7-7740X Asus X299 Prime Intel Core i7-7740X 4.3GHz
GeForce GTX 1070 Ti (Desktop)
min:
109 fps, max:
145 fps
fps
100%
GeForce GTX 1070 Ti (Desktop):
81 [X] i7-7740X Asus X299 Prime Intel Core i7-7740X 4.3GHz
GeForce GTX 1070 Ti (Desktop)
min:
63 fps, max:
100 fps
fps
100%
GeForce GTX 1070 Ti (Desktop):
42.4 [X] i7-7740X Asus X299 Prime Intel Core i7-7740X 4.3GHz
GeForce GTX 1070 Ti (Desktop)
min:
37 fps, max:
52 fps
fps
UHD Graphics 630:
15.5 [X] HP Pavilion Gaming 15-cx0003ng Intel Core i7-8750H 2.2GHz
UHD Graphics 630
fps
UHD Graphics 630:
8.9 [X] HP Pavilion Gaming 15-cx0003ng Intel Core i7-8750H 2.2GHz
UHD Graphics 630
fps
100%
GeForce GTX 1070 Ti (Desktop):
88 [X] i7-7740X Asus X299 Prime Intel Core i7-7740X 4.3GHz
GeForce GTX 1070 Ti (Desktop)
min:
82 fps, max:
94 fps
fps
100%
GeForce GTX 1070 Ti (Desktop):
64 [X] i7-7740X Asus X299 Prime Intel Core i7-7740X 4.3GHz
GeForce GTX 1070 Ti (Desktop)
min:
58 fps, max:
68 fps
fps
100%
GeForce GTX 1070 Ti (Desktop):
35.3 [X] i7-7740X Asus X299 Prime Intel Core i7-7740X 4.3GHz
GeForce GTX 1070 Ti (Desktop)
min:
32 fps, max:
38 fps
fps
100%
GeForce GTX 1070 Ti (Desktop):
110 [X] i7-7740X Asus X299 Prime Intel Core i7-7740X 4.3GHz
GeForce GTX 1070 Ti (Desktop)
min:
84 fps, max:
125 fps
fps
100%
GeForce GTX 1070 Ti (Desktop):
74 [X] i7-7740X Asus X299 Prime Intel Core i7-7740X 4.3GHz
GeForce GTX 1070 Ti (Desktop)
min:
62 fps, max:
84 fps
fps
100%
GeForce GTX 1070 Ti (Desktop):
35.4 [X] i7-7740X Asus X299 Prime Intel Core i7-7740X 4.3GHz
GeForce GTX 1070 Ti (Desktop)
min:
27 fps, max:
41 fps
fps
UHD Graphics 630:
22.6 [X] Medion Erazer X15805 Intel Core i9-8950HK 2.9GHz
UHD Graphics 630
fps
100%
GeForce GTX 1070 Ti (Desktop):
111 [X] i7-7740X Asus X299 Prime Intel Core i7-7740X 4.3GHz
GeForce GTX 1070 Ti (Desktop)
min:
90 fps, max:
162 fps
fps
100%
GeForce GTX 1070 Ti (Desktop):
83 [X] i7-7740X Asus X299 Prime Intel Core i7-7740X 4.3GHz
GeForce GTX 1070 Ti (Desktop)
min:
67 fps, max:
124 fps
fps
100%
GeForce GTX 1070 Ti (Desktop):
47.1 [X] i7-7740X Asus X299 Prime Intel Core i7-7740X 4.3GHz
GeForce GTX 1070 Ti (Desktop)
min:
37 fps, max:
72 fps
fps
UHD Graphics 630:
71.1 [X] HP Pavilion Gaming 15-cx0003ng Intel Core i7-8750H 2.2GHz
UHD Graphics 630
fps
UHD Graphics 630:
23.9 [X] HP Pavilion Gaming 15-cx0003ng Intel Core i7-8750H 2.2GHz
UHD Graphics 630
fps
UHD Graphics 630:
11.3 [X] HP Pavilion Gaming 15-cx0003ng Intel Core i7-8750H 2.2GHz
UHD Graphics 630
fps
UHD Graphics 630:
16.7 [X] HP Pavilion Gaming 15-cx0003ng Intel Core i7-8750H 2.2GHz
UHD Graphics 630
fps
UHD Graphics 630:
8.1 [X] HP Pavilion Gaming 15-cx0003ng Intel Core i7-8750H 2.2GHz
UHD Graphics 630
fps
UHD Graphics 630:
12.8 [X] HP Pavilion Gaming 15-cx0003ng Intel Core i7-8750H 2.2GHz
UHD Graphics 630
fps
UHD Graphics 630:
7.5 [X] HP Pavilion Gaming 15-cx0003ng Intel Core i7-8750H 2.2GHz
UHD Graphics 630
fps
UHD Graphics 630:
25.9 [X] Medion Erazer X15805 Intel Core i9-8950HK 2.9GHz
UHD Graphics 630
fps
UHD Graphics 630:
9.7 [X] Medion Erazer X15805 Intel Core i9-8950HK 2.9GHz
UHD Graphics 630
fps
100%
GeForce GTX 1070 Ti (Desktop):
120 [X] i7-7740X Asus X299 Prime Intel Core i7-7740X 4.3GHz
GeForce GTX 1070 Ti (Desktop)
min:
94 fps, max:
156 fps
fps
100%
GeForce GTX 1070 Ti (Desktop):
80 [X] i7-7740X Asus X299 Prime Intel Core i7-7740X 4.3GHz
GeForce GTX 1070 Ti (Desktop)
min:
61 fps, max:
105 fps
fps
100%
GeForce GTX 1070 Ti (Desktop):
40.1 [X] i7-7740X Asus X299 Prime Intel Core i7-7740X 4.3GHz
GeForce GTX 1070 Ti (Desktop)
min:
28 fps, max:
53 fps
fps
UHD Graphics 630:
11 [X] Asus TUF FX705 Intel Core i7-8750H 2.2GHz
UHD Graphics 630
fps
UHD Graphics 630:
7 [X] Asus TUF FX705 Intel Core i7-8750H 2.2GHz
UHD Graphics 630
fps
100%
GeForce GTX 1070 Ti (Desktop):
63 [X] i7-7740X Asus X299 Prime Intel Core i7-7740X 4.3GHz
GeForce GTX 1070 Ti (Desktop)
min:
35 fps, max:
124 fps
fps
100%
GeForce GTX 1070 Ti (Desktop):
48 [X] i7-7740X Asus X299 Prime Intel Core i7-7740X 4.3GHz
GeForce GTX 1070 Ti (Desktop)
min:
24 fps, max:
81 fps
fps
100%
GeForce GTX 1070 Ti (Desktop):
27 [X] i7-7740X Asus X299 Prime Intel Core i7-7740X 4.3GHz
GeForce GTX 1070 Ti (Desktop)
min:
13 fps, max:
63 fps
fps
100%
GeForce GTX 1070 Ti (Desktop):
100 [X] i7-7740X Asus X299 Prime Intel Core i7-7740X 4.3GHz
GeForce GTX 1070 Ti (Desktop)
min:
87 fps, max:
129 fps
fps
100%
GeForce GTX 1070 Ti (Desktop):
81 [X] i7-7740X Asus X299 Prime Intel Core i7-7740X 4.3GHz
GeForce GTX 1070 Ti (Desktop)
min:
73 fps, max:
103 fps
fps
100%
GeForce GTX 1070 Ti (Desktop):
55 [X] i7-7740X Asus X299 Prime Intel Core i7-7740X 4.3GHz
GeForce GTX 1070 Ti (Desktop)
min:
49 fps, max:
68 fps
fps
UHD Graphics 630:
57.1 [X] Asus TUF FX705 Intel Core i7-8750H 2.2GHz
UHD Graphics 630
fps
UHD Graphics 630:
29.9 [X] Asus TUF FX705 Intel Core i7-8750H 2.2GHz
UHD Graphics 630
fps
UHD Graphics 630:
27.2 [X] Asus TUF FX705 Intel Core i7-8750H 2.2GHz
UHD Graphics 630
fps
100%
GeForce GTX 1070 Ti (Desktop):
267 [X] i7-7740X Asus X299 Prime Intel Core i7-7740X 4.3GHz
GeForce GTX 1070 Ti (Desktop)
min:
248 fps, max:
287 fps
fps
100%
GeForce GTX 1070 Ti (Desktop):
141 [X] i7-7740X Asus X299 Prime Intel Core i7-7740X 4.3GHz
GeForce GTX 1070 Ti (Desktop)
min:
114 fps, max:
165 fps
fps
UHD Graphics 630:
17 [X] Asus TUF FX705 Intel Core i7-8750H 2.2GHz
UHD Graphics 630
fps
UHD Graphics 630:
6 [X] Asus TUF FX705 Intel Core i7-8750H 2.2GHz
UHD Graphics 630
fps
100%
GeForce GTX 1070 Ti (Desktop):
84 [X] i7-7740X Asus X299 Prime Intel Core i7-7740X 4.3GHz
GeForce GTX 1070 Ti (Desktop)
min:
67 fps, max:
142 fps
fps
100%
GeForce GTX 1070 Ti (Desktop):
51 [X] i7-7740X Asus X299 Prime Intel Core i7-7740X 4.3GHz
GeForce GTX 1070 Ti (Desktop)
min:
46 fps, max:
87 fps
fps
100%
GeForce GTX 1070 Ti (Desktop):
28 [X] i7-7740X Asus X299 Prime Intel Core i7-7740X 4.3GHz
GeForce GTX 1070 Ti (Desktop)
min:
24 fps, max:
43 fps
fps
UHD Graphics 630:
31.1 [X] Medion Erazer Beast X20 1.47.22.14 D3D12
Intel Core i7-10870H 2.2GHz
UHD Graphics 630
min:
7.6 fps, P1:
10.5 fps, max:
388 fps
31.3 [X] Asus Maximus XIII Hero 1.47.22.14 D3D12
Intel Core i3-10320 3.8GHz
UHD Graphics 630
min:
7.3 fps, P1:
8.8 fps, max:
495 fps
~ 31 fps
UHD Graphics 630:
12.6 [X] Asus Maximus XIII Hero 1.47.22.14 D3D12
Intel Core i3-10320 3.8GHz
UHD Graphics 630
min:
5 fps, P1:
5 fps, max:
391 fps
14.1 [X] Medion Erazer Beast X20 1.47.22.14 D3D12
Intel Core i7-10870H 2.2GHz
UHD Graphics 630
min:
5 fps, P1:
5 fps, max:
353 fps
~ 13 fps
UHD Graphics 630:
12.3 [X] Medion Erazer Beast X20 1.47.22.14 D3D12
Intel Core i7-10870H 2.2GHz
UHD Graphics 630
min:
5 fps, P1:
5.13 fps, max:
326 fps
fps
UHD Graphics 630:
10.9 [X] Medion Erazer Beast X20 1.47.22.14 D3D12
Intel Core i7-10870H 2.2GHz
UHD Graphics 630
min:
5 fps, P1:
5 fps, max:
351 fps
fps
UHD Graphics 630:
35 [X] Asus TUF FX705 Intel Core i7-8750H 2.2GHz
UHD Graphics 630
fps
UHD Graphics 630:
16 [X] Asus TUF FX705 Intel Core i7-8750H 2.2GHz
UHD Graphics 630
fps
100%
GeForce GTX 1070 Ti (Desktop):
97 [X] i7-7740X Asus X299 Prime Intel Core i7-7740X 4.3GHz
GeForce GTX 1070 Ti (Desktop)
min:
85 fps, max:
102 fps
fps
100%
GeForce GTX 1070 Ti (Desktop):
78 [X] i7-7740X Asus X299 Prime Intel Core i7-7740X 4.3GHz
GeForce GTX 1070 Ti (Desktop)
min:
70 fps, max:
82 fps
fps
100%
GeForce GTX 1070 Ti (Desktop):
49 [X] i7-7740X Asus X299 Prime Intel Core i7-7740X 4.3GHz
GeForce GTX 1070 Ti (Desktop)
min:
44 fps, max:
51 fps
fps
UHD Graphics 630:
20.3 [X] Asus TUF FX705 Intel Core i7-8750H 2.2GHz
UHD Graphics 630
fps
UHD Graphics 630:
7.7 [X] Asus TUF FX705 Intel Core i7-8750H 2.2GHz
UHD Graphics 630
fps
100%
GeForce GTX 1070 Ti (Desktop):
78 [X] i7-7740X Asus X299 Prime Intel Core i7-7740X 4.3GHz
GeForce GTX 1070 Ti (Desktop)
min:
64 fps, max:
99 fps
fps
100%
GeForce GTX 1070 Ti (Desktop):
48.5 [X] i7-7740X Asus X299 Prime Intel Core i7-7740X 4.3GHz
GeForce GTX 1070 Ti (Desktop)
min:
41 fps, max:
59 fps
fps
100%
GeForce GTX 1070 Ti (Desktop):
23.8 [X] i7-7740X Asus X299 Prime Intel Core i7-7740X 4.3GHz
GeForce GTX 1070 Ti (Desktop)
min:
21 fps, max:
28 fps
fps
UHD Graphics 630:
16.6 [X] HP Omen 15 Intel Core i5-8300H 2.3GHz
UHD Graphics 630
fps
UHD Graphics 630:
6.8 [X] HP Omen 15 Intel Core i5-8300H 2.3GHz
UHD Graphics 630
fps
100%
GeForce GTX 1070 Ti (Desktop):
135 [X] i7-7740X Asus X299 Prime Intel Core i7-7740X 4.3GHz
GeForce GTX 1070 Ti (Desktop)
min:
111 fps, max:
171 fps
fps
10%
UHD Graphics 630:
13 14 [X] Gigabyte Aero 15X Intel Core i7-8750H 2.2GHz
UHD Graphics 630
15 ~ 14 fps
100%
GeForce GTX 1070 Ti (Desktop):
114 [X] i7-7740X Asus X299 Prime Intel Core i7-7740X 4.3GHz
GeForce GTX 1070 Ti (Desktop)
min:
95 fps, max:
132 fps
fps
5%
UHD Graphics 630:
6 [X] Gigabyte Aero 15X Intel Core i7-8750H 2.2GHz
UHD Graphics 630
fps
100%
GeForce GTX 1070 Ti (Desktop):
108 [X] i7-7740X Asus X299 Prime Intel Core i7-7740X 4.3GHz
GeForce GTX 1070 Ti (Desktop)
min:
95 fps, max:
122 fps
fps
100%
GeForce GTX 1070 Ti (Desktop):
102 [X] i7-7740X Asus X299 Prime Intel Core i7-7740X 4.3GHz
GeForce GTX 1070 Ti (Desktop)
min:
79 fps, max:
116 fps
fps
100%
GeForce GTX 1070 Ti (Desktop):
75 [X] i7-7740X Asus X299 Prime Intel Core i7-7740X 4.3GHz
GeForce GTX 1070 Ti (Desktop)
min:
67 fps, max:
85 fps
fps
100%
GeForce GTX 1070 Ti (Desktop):
39 [X] i7-7740X Asus X299 Prime Intel Core i7-7740X 4.3GHz
GeForce GTX 1070 Ti (Desktop)
min:
34 fps, max:
45 fps
fps
UHD Graphics 630:
207.9 [X] Medion Erazer X15805 Intel Core i9-8950HK 2.9GHz
UHD Graphics 630
fps
UHD Graphics 630:
25.2 [X] Medion Erazer X15805 Intel Core i9-8950HK 2.9GHz
UHD Graphics 630
fps
UHD Graphics 630:
9.6 [X] Medion Erazer X15805 Intel Core i9-8950HK 2.9GHz
UHD Graphics 630
fps
100%
GeForce GTX 1070 Ti (Desktop):
101 [X] Intel Core i7-4790K 4GHz
GeForce GTX 1070 Ti (Desktop)
fps
21%
UHD Graphics 630:
11.6 12.7 14.3 [X] Aorus Z370 Ultra Gaming Desktop DDR4-2666 Intel Core i7-8086K 3.7GHz
UHD Graphics 630
14.8 17.6 [X] Asus Maximus XIII Hero Intel Core i3-10320 3.8GHz
UHD Graphics 630
22.4 24.5 29.7 [X] HP Pavilion Gaming 15-cx0003ng Intel Core i7-8750H 2.2GHz
UHD Graphics 630
31.3 31.3 ~ 21 fps
100%
GeForce GTX 1070 Ti (Desktop):
89 [X] Intel Core i7-4790K 4GHz
GeForce GTX 1070 Ti (Desktop)
fps
17%
UHD Graphics 630:
10.7 11 11.2 12.2 [X] Aorus Z370 Ultra Gaming Desktop DDR4-2666 Intel Core i7-8086K 3.7GHz
UHD Graphics 630
14.3 14.9 [X] Asus Maximus XIII Hero Intel Core i3-10320 3.8GHz
UHD Graphics 630
15.1 18.9 [X] HP Pavilion Gaming 15-cx0003ng Intel Core i7-8750H 2.2GHz
UHD Graphics 630
20.1 20.1 ~ 15 fps
100%
GeForce GTX 1070 Ti (Desktop):
74.5 [X] Intel Core i7-4790K 4GHz
GeForce GTX 1070 Ti (Desktop)
fps
19%
UHD Graphics 630:
10.3 11 11 12.1 [X] Aorus Z370 Ultra Gaming Desktop DDR4-2666 Intel Core i7-8086K 3.7GHz
UHD Graphics 630
12.8 13.3 13.3 [X] Asus Maximus XIII Hero Intel Core i3-10320 3.8GHz
UHD Graphics 630
17.2 [X] HP Pavilion Gaming 15-cx0003ng Intel Core i7-8750H 2.2GHz
UHD Graphics 630
18.3 18.3 ~ 14 fps
100%
GeForce GTX 1070 Ti (Desktop):
66.7 [X] Intel Core i7-4790K 4GHz
GeForce GTX 1070 Ti (Desktop)
fps
10%
UHD Graphics 630:
7 [X] Aorus Z370 Ultra Gaming Desktop DDR4-2666 Intel Core i7-8086K 3.7GHz
UHD Graphics 630
fps
100%
GeForce GTX 1070 Ti (Desktop):
154 [X] Intel Core i7-4790K 4GHz
GeForce GTX 1070 Ti (Desktop)
min:
101 fps, max:
189 fps
fps
11%
UHD Graphics 630:
16.9 [X] Gigabyte Aero 15X Intel Core i7-8750H 2.2GHz
UHD Graphics 630
fps
100%
GeForce GTX 1070 Ti (Desktop):
100 [X] Intel Core i7-4790K 4GHz
GeForce GTX 1070 Ti (Desktop)
min:
77 fps, max:
115 fps
fps
7%
UHD Graphics 630:
6.9 [X] Gigabyte Aero 15X Intel Core i7-8750H 2.2GHz
UHD Graphics 630
fps
100%
GeForce GTX 1070 Ti (Desktop):
82 [X] Intel Core i7-4790K 4GHz
GeForce GTX 1070 Ti (Desktop)
min:
58 fps, max:
97 fps
fps
100%
GeForce GTX 1070 Ti (Desktop):
59.1 [X] Intel Core i7-4790K 4GHz
GeForce GTX 1070 Ti (Desktop)
min:
44 fps, max:
74 fps
fps
100%
GeForce GTX 1070 Ti (Desktop):
42.4 [X] Intel Core i7-4790K 4GHz
GeForce GTX 1070 Ti (Desktop)
min:
33 fps, max:
50 fps
fps
100%
GeForce GTX 1070 Ti (Desktop):
22.7 [X] Intel Core i7-4790K 4GHz
GeForce GTX 1070 Ti (Desktop)
min:
18 fps, max:
27 fps
fps
100%
GeForce GTX 1070 Ti (Desktop):
146 [X] Intel Core i7-4790K 4GHz
GeForce GTX 1070 Ti (Desktop)
min:
93 fps, max:
194 fps
fps
8%
UHD Graphics 630:
9.5 [X] Gigabyte Aero 15X Intel Core i7-8750H 2.2GHz
UHD Graphics 630
11.3 14 [X] Asus Maximus XIII Hero 1.3
Intel Core i3-10320 3.8GHz
UHD Graphics 630
~ 12 fps
100%
GeForce GTX 1070 Ti (Desktop):
87 [X] Intel Core i7-4790K 4GHz
GeForce GTX 1070 Ti (Desktop)
min:
69 fps, max:
110 fps
fps
6%
UHD Graphics 630:
4.8 [X] Gigabyte Aero 15X Intel Core i7-8750H 2.2GHz
UHD Graphics 630
fps
100%
GeForce GTX 1070 Ti (Desktop):
63 [X] Intel Core i7-4790K 4GHz
GeForce GTX 1070 Ti (Desktop)
max:
92 fps
fps
100%
GeForce GTX 1070 Ti (Desktop):
27.7 [X] Intel Core i7-4790K 4GHz
GeForce GTX 1070 Ti (Desktop)
max:
42 fps
fps
100%
GeForce GTX 1070 Ti (Desktop):
109 [X] Intel Core i7-4790K 4GHz
GeForce GTX 1070 Ti (Desktop)
min:
78 fps, max:
132 fps
fps
100%
GeForce GTX 1070 Ti (Desktop):
72 [X] Intel Core i7-4790K 4GHz
GeForce GTX 1070 Ti (Desktop)
min:
61 fps, max:
89 fps
fps
100%
GeForce GTX 1070 Ti (Desktop):
36 [X] Intel Core i7-4790K 4GHz
GeForce GTX 1070 Ti (Desktop)
min:
32 fps, max:
39 fps
fps
UHD Graphics 630:
19.9 [X] Gigabyte Aero 15X Intel Core i7-8750H 2.2GHz
UHD Graphics 630
fps
UHD Graphics 630:
6.5 [X] Gigabyte Aero 15X Intel Core i7-8750H 2.2GHz
UHD Graphics 630
fps
100%
GeForce GTX 1070 Ti (Desktop):
117 [X] Intel Core i7-4790K 4GHz
GeForce GTX 1070 Ti (Desktop)
min:
106 fps, max:
130 fps
fps
100%
GeForce GTX 1070 Ti (Desktop):
77 [X] Intel Core i7-4790K 4GHz
GeForce GTX 1070 Ti (Desktop)
min:
70 fps, max:
85 fps
fps
100%
GeForce GTX 1070 Ti (Desktop):
38 [X] Intel Core i7-4790K 4GHz
GeForce GTX 1070 Ti (Desktop)
min:
34 fps, max:
44 fps
fps
UHD Graphics 630:
19.3 [X] Gigabyte Aero 15X Intel Core i7-8750H 2.2GHz
UHD Graphics 630
fps
UHD Graphics 630:
8.9 [X] Gigabyte Aero 15X Intel Core i7-8750H 2.2GHz
UHD Graphics 630
fps
100%
GeForce GTX 1070 Ti (Desktop):
122 [X] Intel Core i7-4790K 4GHz
GeForce GTX 1070 Ti (Desktop)
min:
86 fps, max:
155 fps
fps
100%
GeForce GTX 1070 Ti (Desktop):
85 [X] Intel Core i7-4790K 4GHz
GeForce GTX 1070 Ti (Desktop)
min:
57 fps, max:
102 fps
fps
100%
GeForce GTX 1070 Ti (Desktop):
45 [X] Intel Core i7-4790K 4GHz
GeForce GTX 1070 Ti (Desktop)
min:
30 fps, max:
52 fps
fps
UHD Graphics 630:
29.8 [X] Gigabyte Aero 15X Intel Core i7-8750H 2.2GHz
UHD Graphics 630
fps
UHD Graphics 630:
17.4 [X] Gigabyte Aero 15X Intel Core i7-8750H 2.2GHz
UHD Graphics 630
fps
UHD Graphics 630:
17.7 [X] Gigabyte Aero 15X Intel Core i7-8750H 2.2GHz
UHD Graphics 630
fps
UHD Graphics 630:
9.1 [X] Gigabyte Aero 15X Intel Core i7-8750H 2.2GHz
UHD Graphics 630
fps
100%
GeForce GTX 1070 Ti (Desktop):
103 [X] Intel Core i7-4790K 4GHz
GeForce GTX 1070 Ti (Desktop)
min:
60 fps, max:
143 fps
fps
10%
UHD Graphics 630:
10 [X] Gigabyte Aero 15X Intel Core i7-8750H 2.2GHz
UHD Graphics 630
fps
100%
GeForce GTX 1070 Ti (Desktop):
92 [X] Intel Core i7-4790K 4GHz
GeForce GTX 1070 Ti (Desktop)
min:
55 fps, max:
133 fps
fps
8%
UHD Graphics 630:
7 [X] Gigabyte Aero 15X Intel Core i7-8750H 2.2GHz
UHD Graphics 630
fps
100%
GeForce GTX 1070 Ti (Desktop):
88 [X] Intel Core i7-4790K 4GHz
GeForce GTX 1070 Ti (Desktop)
min:
53 fps, max:
126 fps
fps
100%
GeForce GTX 1070 Ti (Desktop):
75 [X] Intel Core i7-4790K 4GHz
GeForce GTX 1070 Ti (Desktop)
min:
30 fps, max:
117 fps
fps
100%
GeForce GTX 1070 Ti (Desktop):
58 [X] Intel Core i7-4790K 4GHz
GeForce GTX 1070 Ti (Desktop)
min:
33 fps, max:
104 fps
fps
100%
GeForce GTX 1070 Ti (Desktop):
34 [X] Intel Core i7-4790K 4GHz
GeForce GTX 1070 Ti (Desktop)
min:
24 fps, max:
51 fps
fps
UHD Graphics 630:
17 [X] HP Omen 15 Intel Core i5-8300H 2.3GHz
UHD Graphics 630
fps
UHD Graphics 630:
9.2 [X] HP Omen 15 Intel Core i5-8300H 2.3GHz
UHD Graphics 630
fps
UHD Graphics 630:
14.5 [X] Gigabyte Aero 15X Intel Core i7-8750H 2.2GHz
UHD Graphics 630
fps
UHD Graphics 630:
6.8 [X] Gigabyte Aero 15X Intel Core i7-8750H 2.2GHz
UHD Graphics 630
fps
UHD Graphics 630:
11.4 [X] Gigabyte Aero 15X Intel Core i7-8750H 2.2GHz
UHD Graphics 630
fps
Iris Plus Graphics 640:
13.8 fps
UHD Graphics 630:
6.1 [X] Gigabyte Aero 15X Intel Core i7-8750H 2.2GHz
UHD Graphics 630
fps
100%
GeForce GTX 1070 Ti (Desktop):
165 [X] Intel Core i7-4790K 4GHz
GeForce GTX 1070 Ti (Desktop)
min:
76 fps, max:
225 fps
fps
12%
UHD Graphics 630:
20 [X] Gigabyte Aero 15X Intel Core i7-8750H 2.2GHz
UHD Graphics 630
fps
17%
Iris Plus Graphics 640:
28 fps
100%
GeForce GTX 1070 Ti (Desktop):
136 [X] Intel Core i7-4790K 4GHz
GeForce GTX 1070 Ti (Desktop)
min:
66 fps, max:
190 fps
fps
9%
UHD Graphics 630:
12 [X] Gigabyte Aero 15X Intel Core i7-8750H 2.2GHz
UHD Graphics 630
fps
100%
GeForce GTX 1070 Ti (Desktop):
109 [X] Intel Core i7-4790K 4GHz
GeForce GTX 1070 Ti (Desktop)
min:
49 fps, max:
169 fps
fps
100%
GeForce GTX 1070 Ti (Desktop):
85 [X] Intel Core i7-4790K 4GHz
GeForce GTX 1070 Ti (Desktop)
min:
43 fps, max:
169 fps
fps
100%
GeForce GTX 1070 Ti (Desktop):
34 [X] Intel Core i7-4790K 4GHz
GeForce GTX 1070 Ti (Desktop)
min:
21 fps, max:
50 fps
fps
UHD Graphics 630:
67.3 [X] no model Intel Core i5-8400 2.8GHz
UHD Graphics 630
min:
59 fps, max:
85 fps
82 [X] no model Intel Core i7-8700K 3.7GHz
UHD Graphics 630
min:
66 fps, max:
91 fps
~ 75 fps
Iris Plus Graphics 640:
69.5 (!) [X] Microsoft Surface Laptop i7 Intel Core i7-7660U 2.5GHz
Iris Plus Graphics 640
min:
59 fps, max:
78 fps
fps
UHD Graphics 630:
39.4 [X] no model Intel Core i5-8400 2.8GHz
UHD Graphics 630
min:
31 fps, max:
44 fps
44 [X] no model Intel Core i7-8700K 3.7GHz
UHD Graphics 630
min:
36 fps, max:
50 fps
~ 42 fps
Iris Plus Graphics 640:
38.8 (!) [X] Microsoft Surface Laptop i7 Intel Core i7-7660U 2.5GHz
Iris Plus Graphics 640
min:
34 fps, max:
43 fps
fps
UHD Graphics 630:
30.9 [X] no model Intel Core i5-8400 2.8GHz
UHD Graphics 630
min:
24 fps, max:
35 fps
33.7 [X] no model Intel Core i7-8700K 3.7GHz
UHD Graphics 630
min:
25 fps, max:
38 fps
~ 32 fps
UHD Graphics 630:
25.1 [X] no model Intel Core i5-8400 2.8GHz
UHD Graphics 630
min:
20 fps, max:
28 fps
28.8 [X] no model Intel Core i7-8700K 3.7GHz
UHD Graphics 630
min:
23 fps, max:
35 fps
~ 27 fps
100%
GeForce GTX 1070 Ti (Desktop):
47.1 [X] Intel Core i7-4790K 4GHz
GeForce GTX 1070 Ti (Desktop)
min:
44 fps, max:
51 fps
fps
100%
GeForce GTX 1070 Ti (Desktop):
17.3 [X] Intel Core i7-4790K 4GHz
GeForce GTX 1070 Ti (Desktop)
min:
16 fps, max:
18 fps
fps
UHD Graphics 630:
36 [X] no model Intel Core i5-8400 2.8GHz
UHD Graphics 630
min:
31 fps, max:
40 fps
41 [X] no model Intel Core i7-8700K 3.7GHz
UHD Graphics 630
min:
34 fps, max:
49 fps
~ 39 fps
Iris Plus Graphics 640:
33 38 ~ 36 fps
Iris Plus Graphics 640:
15 15 ~ 15 fps
100%
GeForce GTX 1070 Ti (Desktop):
106 [X] Intel Core i7-4790K 4GHz
GeForce GTX 1070 Ti (Desktop)
min:
95 fps, max:
113 fps
fps
100%
GeForce GTX 1070 Ti (Desktop):
52 [X] Intel Core i7-4790K 4GHz
GeForce GTX 1070 Ti (Desktop)
min:
47 fps, max:
55 fps
fps
UHD Graphics 630:
24.9 [X] no model Intel Core i7-8700K 3.7GHz
UHD Graphics 630
min:
20 fps, max:
31 fps
fps
Iris Plus Graphics 640:
22.9 fps
UHD Graphics 630:
113 [X] no model Intel Core i5-8400 2.8GHz
UHD Graphics 630
min:
96 fps
fps
UHD Graphics 630:
88 [X] no model Intel Core i7-8700K 3.7GHz
UHD Graphics 630
min:
78 fps
97 [X] no model Intel Core i5-8400 2.8GHz
UHD Graphics 630
min:
86 fps
~ 93 fps
Iris Plus Graphics 640:
99 fps
UHD Graphics 630:
51.6 (!) [X] no model Intel Core i5-8400 2.8GHz
UHD Graphics 630
min:
46 fps
fps
Iris Plus Graphics 640:
48 fps
UHD Graphics 630:
26 (!) [X] no model Intel Core i5-8400 2.8GHz
UHD Graphics 630
min:
24 fps
fps
Iris Plus Graphics 640:
31.8 fps
100%
GeForce GTX 1070 Ti (Desktop):
152 [X] Intel Core i7-4790K 4GHz
GeForce GTX 1070 Ti (Desktop)
min:
130 fps
fps
UHD Graphics 630:
52 [X] no model Intel Core i5-8400 2.8GHz
UHD Graphics 630
min:
49 fps, max:
55 fps
fps
UHD Graphics 630:
13.8 [X] no model Intel Core i5-8400 2.8GHz
UHD Graphics 630
min:
11 fps, max:
20 fps
fps
100%
GeForce GTX 1070 Ti (Desktop):
57.9 [X] Intel Core i7-4790K 4GHz
GeForce GTX 1070 Ti (Desktop)
min:
51 fps, max:
69 fps
fps
UHD Graphics 630:
67.8 [X] no model Intel Core i5-8400 2.8GHz
UHD Graphics 630
min:
59 fps, max:
78 fps
fps
UHD Graphics 630:
38.6 [X] no model Intel Core i5-8400 2.8GHz
UHD Graphics 630
min:
31 fps, max:
48 fps
fps
100%
GeForce GTX 1070 Ti (Desktop):
223 [X] Intel Core i7-4790K 4GHz
GeForce GTX 1070 Ti (Desktop)
min:
176 fps, max:
252 fps
fps
12%
UHD Graphics 630:
24.9 [X] no model Intel Core i5-8400 2.8GHz
UHD Graphics 630
min:
19 fps, max:
32 fps
27.9 [X] no model Intel Core i7-8700K 3.7GHz
UHD Graphics 630
min:
22 fps, max:
34 fps
~ 26 fps
100%
GeForce GTX 1070 Ti (Desktop):
92 [X] Intel Core i7-4790K 4GHz
GeForce GTX 1070 Ti (Desktop)
min:
76 fps, max:
133 fps
fps
UHD Graphics 630:
28.9 [X] Gigabyte Aero 15X Intel Core i7-8750H 2.2GHz
UHD Graphics 630
fps
Iris Plus Graphics 640:
39.9 45.4 ~ 43 fps
UHD Graphics 630:
11.3 [X] Gigabyte Aero 15X Intel Core i7-8750H 2.2GHz
UHD Graphics 630
fps
Iris Plus Graphics 640:
17.9 18.1 ~ 18 fps
Iris Plus Graphics 640:
14.8 fps
UHD Graphics 630:
43.7 [X] no model Intel Core i7-8700K 3.7GHz
UHD Graphics 630
min:
33 fps, max:
82 fps
fps
Iris Plus Graphics 640:
33.8 fps
UHD Graphics 630:
18.3 [X] no model Intel Core i7-8700K 3.7GHz
UHD Graphics 630
max:
29 fps
fps
Iris Plus Graphics 640:
20.4 fps
UHD Graphics 630:
19.1 [X] no model Intel Core i7-8700K 3.7GHz
UHD Graphics 630
min:
13 fps, max:
24 fps
fps
Iris Plus Graphics 640:
16 16.6 ~ 16 fps
100%
GeForce GTX 1070 Ti (Desktop):
54.2 [X] Intel Core i7-4790K 4GHz
GeForce GTX 1070 Ti (Desktop)
min:
47 fps, max:
62 fps
fps
100%
GeForce GTX 1070 Ti (Desktop):
35.8 [X] Intel Core i7-4790K 4GHz
GeForce GTX 1070 Ti (Desktop)
min:
27 fps, max:
40 fps
fps
UHD Graphics 630:
30.7 [X] no model Intel Core i7-8700K 3.7GHz
UHD Graphics 630
min:
19 fps, max:
42 fps
fps
Iris Plus Graphics 640:
30.8 33.5 ~ 32 fps
UHD Graphics 630:
11.6 [X] no model Intel Core i7-8700K 3.7GHz
UHD Graphics 630
min:
9 fps, max:
14 fps
fps
Iris Plus Graphics 640:
11.8 12.7 ~ 12 fps
100%
GeForce GTX 1070 Ti (Desktop):
156 [X] Intel Core i7-4790K 4GHz
GeForce GTX 1070 Ti (Desktop)
min:
92 fps, max:
189 fps
fps
100%
GeForce GTX 1070 Ti (Desktop):
122 [X] Intel Core i7-4790K 4GHz
GeForce GTX 1070 Ti (Desktop)
min:
75 fps, max:
163 fps
fps
100%
GeForce GTX 1070 Ti (Desktop):
47.9 [X] Intel Core i7-4790K 4GHz
GeForce GTX 1070 Ti (Desktop)
min:
39 fps, max:
60 fps
fps
UHD Graphics 630:
29.5 [X] Gigabyte Aero 15X Intel Core i7-8750H 2.2GHz
UHD Graphics 630
fps
UHD Graphics 630:
12.6 [X] Gigabyte Aero 15X Intel Core i7-8750H 2.2GHz
UHD Graphics 630
fps
100%
GeForce GTX 1070 Ti (Desktop):
67.8 [X] Intel Core i7-4790K 4GHz
GeForce GTX 1070 Ti (Desktop)
min:
51 fps, max:
97 fps
fps
Iris Plus Graphics 640:
42.9 45 ~ 44 fps
Iris Plus Graphics 640:
31.4 fps
Iris Plus Graphics 640:
22.9 fps
UHD Graphics 630:
93 [X] no model Intel Core i5-8400 2.8GHz
UHD Graphics 630
min:
88 fps, max:
115 fps
fps
Iris Plus Graphics 640:
121 fps
UHD Graphics 630:
66 [X] no model Intel Core i5-8400 2.8GHz
UHD Graphics 630
min:
59 fps, max:
80 fps
fps
Iris Plus Graphics 640:
91 fps
UHD Graphics 630:
24.6 [X] no model Intel Core i5-8400 2.8GHz
UHD Graphics 630
min:
21 fps, max:
30 fps
28.4 [X] no model Intel Core i7-8700K 3.7GHz
UHD Graphics 630
min:
25 fps, max:
34 fps
~ 27 fps
Iris Plus Graphics 640:
31.6 fps
UHD Graphics 630:
12.4 [X] no model Intel Core i5-8400 2.8GHz
UHD Graphics 630
min:
11 fps, max:
16 fps
14.9 [X] no model Intel Core i7-8700K 3.7GHz
UHD Graphics 630
min:
13 fps, max:
19 fps
~ 14 fps
Iris Plus Graphics 640:
17.8 fps
100%
GeForce GTX 1070 Ti (Desktop):
80 [X] Intel Core i7-4790K 4GHz
GeForce GTX 1070 Ti (Desktop)
min:
79 fps, max:
81 fps
fps
UHD Graphics 630:
39.3 [X] no model Intel Core i7-8700K 3.7GHz
UHD Graphics 630
min:
37 fps, max:
43 fps
fps
UHD Graphics 630:
23.5 [X] no model Intel Core i7-8700K 3.7GHz
UHD Graphics 630
min:
21 fps, max:
26 fps
fps
Iris Plus Graphics 640:
19.6 24.2 ~ 22 fps
Iris Plus Graphics 640:
9.2 11.1 ~ 10 fps
UHD Graphics 630:
0 (!) [X] no model Intel Core i7-8700K 3.7GHz
UHD Graphics 630
39.6 [X] HP Pavilion Gaming 15-cx0003ng Intel Core i7-8750H 2.2GHz
UHD Graphics 630
~ 20 fps
UHD Graphics 630:
14.4 [X] HP Pavilion Gaming 15-cx0003ng Intel Core i7-8750H 2.2GHz
UHD Graphics 630
fps
100%
GeForce GTX 1070 Ti (Desktop):
108 [X] Intel Core i7-4790K 4GHz
GeForce GTX 1070 Ti (Desktop)
min:
86 fps, max:
184 fps
fps
100%
GeForce GTX 1070 Ti (Desktop):
91 [X] Intel Core i7-4790K 4GHz
GeForce GTX 1070 Ti (Desktop)
min:
70 fps, max:
133 fps
fps
UHD Graphics 630:
18.8 [X] no model Intel Core i5-8400 2.8GHz
UHD Graphics 630
min:
14.4 fps, max:
25.9 fps
21.7 [X] no model Intel Core i7-8700K 3.7GHz
UHD Graphics 630
min:
16 fps, max:
30 fps
~ 20 fps
Iris Plus Graphics 640:
20.2 fps
100%
GeForce GTX 1070 Ti (Desktop):
67.9 [X] DX11
Intel Core i7-4790K 4GHz
GeForce GTX 1070 Ti (Desktop)
min:
53 fps, max:
87 fps
fps
100%
GeForce GTX 1070 Ti (Desktop):
31.9 [X] DX11
Intel Core i7-4790K 4GHz
GeForce GTX 1070 Ti (Desktop)
min:
27 fps, max:
38 fps
fps
UHD Graphics 630:
19.8 [X] HP Omen 15 Intel Core i5-8300H 2.3GHz
UHD Graphics 630
fps
UHD Graphics 630:
13.7 [X] HP Omen 15 Intel Core i5-8300H 2.3GHz
UHD Graphics 630
fps
UHD Graphics 630:
62 [X] no model Intel Core i5-8400 2.8GHz
UHD Graphics 630
min:
48 fps, max:
78 fps
fps
UHD Graphics 630:
41.5 [X] no model Intel Core i5-8400 2.8GHz
UHD Graphics 630
min:
33 fps, max:
51 fps
fps
UHD Graphics 630:
19.5 [X] no model Intel Core i5-8400 2.8GHz
UHD Graphics 630
min:
16 fps, max:
24 fps
fps
100%
GeForce GTX 1070 Ti (Desktop):
182 [X] Intel Core i7-4790K 4GHz
GeForce GTX 1070 Ti (Desktop)
min:
149 fps, max:
213 fps
fps
11%
Iris Plus Graphics 640:
19.5 fps
100%
GeForce GTX 1070 Ti (Desktop):
88.7 [X] Intel Core i7-4790K 4GHz
GeForce GTX 1070 Ti (Desktop)
min:
77 fps, max:
103 fps
fps
UHD Graphics 630:
23.3 [X] Gigabyte Aero 15X Intel Core i7-8750H 2.2GHz
UHD Graphics 630
fps
UHD Graphics 630:
18.1 [X] Gigabyte Aero 15X Intel Core i7-8750H 2.2GHz
UHD Graphics 630
fps
UHD Graphics 630:
27.1 [X] no model Intel Core i7-8700K 3.7GHz
UHD Graphics 630
min:
18 fps, max:
34 fps
fps
Iris Plus Graphics 640:
24.9 fps
100%
GeForce GTX 1070 Ti (Desktop):
94.6 [X] Intel Core i7-4790K 4GHz
GeForce GTX 1070 Ti (Desktop)
min:
53 fps, max:
133 fps
fps
100%
GeForce GTX 1070 Ti (Desktop):
45.6 [X] Intel Core i7-4790K 4GHz
GeForce GTX 1070 Ti (Desktop)
min:
21 fps, max:
59 fps
fps
UHD Graphics 630:
23 [X] no model Intel Core i5-8400 2.8GHz
UHD Graphics 630
min:
21 fps, max:
27 fps
26 [X] no model Intel Core i7-8700K 3.7GHz
UHD Graphics 630
min:
23 fps, max:
30 fps
~ 25 fps
Iris Plus Graphics 640:
28 fps
Iris Plus Graphics 640:
13 fps
100%
GeForce GTX 1070 Ti (Desktop):
98 [X] Intel Core i7-4790K 4GHz
GeForce GTX 1070 Ti (Desktop)
min:
80 fps, max:
113 fps
fps
100%
GeForce GTX 1070 Ti (Desktop):
41 [X] Intel Core i7-4790K 4GHz
GeForce GTX 1070 Ti (Desktop)
min:
39 fps, max:
45 fps
fps
UHD Graphics 630:
21.9 [X] no model Intel Core i5-8400 2.8GHz
UHD Graphics 630
min:
20 fps, max:
26 fps
27.4 [X] no model Intel Core i7-8700K 3.7GHz
UHD Graphics 630
min:
24 fps, max:
31 fps
~ 25 fps
Iris Plus Graphics 640:
23.5 25.8 ~ 25 fps
Iris Plus Graphics 640:
16.7 19.4 ~ 18 fps
Iris Plus Graphics 640:
9.1 fps
100%
GeForce GTX 1070 Ti (Desktop):
111 [X] DX11
Intel Core i7-4790K 4GHz
GeForce GTX 1070 Ti (Desktop)
min:
101 fps, max:
119 fps
fps
100%
GeForce GTX 1070 Ti (Desktop):
46.5 [X] DX11
Intel Core i7-4790K 4GHz
GeForce GTX 1070 Ti (Desktop)
min:
41 fps, max:
52 fps
fps
UHD Graphics 630:
51.7 [X] no model Intel Core i7-8700K 3.7GHz
UHD Graphics 630
min:
19 fps, max:
150 fps
fps
UHD Graphics 630:
32.5 [X] no model Intel Core i7-8700K 3.7GHz
UHD Graphics 630
min:
13 fps, max:
138 fps
fps
100%
GeForce GTX 1070 Ti (Desktop):
177 [X] Intel Core i7-4790K 4GHz
GeForce GTX 1070 Ti (Desktop)
min:
106 fps, max:
305 fps
fps
8%
Iris Plus Graphics 640:
14.2 fps
100%
GeForce GTX 1070 Ti (Desktop):
77 [X] Intel Core i7-4790K 4GHz
GeForce GTX 1070 Ti (Desktop)
min:
54 fps, max:
113 fps
fps
Iris Plus Graphics 640:
44.7 fps
Iris Plus Graphics 640:
26.2 fps
Iris Plus Graphics 640:
12.9 fps
UHD Graphics 630:
32.4 [X] HP Pavilion Gaming 15-cx0003ng Intel Core i7-8750H 2.2GHz
UHD Graphics 630
fps
UHD Graphics 630:
16.9 [X] HP Pavilion Gaming 15-cx0003ng Intel Core i7-8750H 2.2GHz
UHD Graphics 630
fps
UHD Graphics 630:
83.7 [X] HP Pavilion Gaming 15-cx0003ng Intel Core i7-8750H 2.2GHz
UHD Graphics 630
fps
UHD Graphics 630:
51.4 [X] HP Pavilion Gaming 15-cx0003ng Intel Core i7-8750H 2.2GHz
UHD Graphics 630
fps
UHD Graphics 630:
23.2 [X] HP Pavilion Gaming 15-cx0003ng Intel Core i7-8750H 2.2GHz
UHD Graphics 630
fps
UHD Graphics 630:
60 [X] HP Pavilion Gaming 15-cx0003ng Intel Core i7-8750H 2.2GHz
UHD Graphics 630
fps
UHD Graphics 630:
40.7 [X] HP Pavilion Gaming 15-cx0003ng Intel Core i7-8750H 2.2GHz
UHD Graphics 630
fps
UHD Graphics 630:
13.4 [X] HP Pavilion Gaming 15-cx0003ng Intel Core i7-8750H 2.2GHz
UHD Graphics 630
fps
100%
GeForce GTX 1070 Ti (Desktop):
142.7 [X] Intel Core i7-4790K 4GHz
GeForce GTX 1070 Ti (Desktop)
min:
125.8 fps
fps
57%
UHD Graphics 630:
70.4 70.7 [X] no model Intel Core i5-8400 2.8GHz
UHD Graphics 630
min:
61.7 fps
76.7 77 78 79 81.1 [X] no model Intel Core i7-8700K 3.7GHz
UHD Graphics 630
min:
69.7 fps
83 83.1 89 [X] Aorus Z370 Ultra Gaming Desktop DDR4-2666 Intel Core i7-8086K 3.7GHz
UHD Graphics 630
min:
79.4 fps
99.1 [X] Asus Maximus XIII Hero Intel Core i3-10320 3.8GHz
UHD Graphics 630
min:
82.6 fps, max:
-1 fps
~ 81 fps
56%
Iris Plus Graphics 640:
68 92 ~ 80 fps
100%
GeForce GTX 1070 Ti (Desktop):
134.2 [X] Intel Core i7-4790K 4GHz
GeForce GTX 1070 Ti (Desktop)
min:
115.5 fps
fps
37%
UHD Graphics 630:
44.8 45.8 [X] no model Intel Core i5-8400 2.8GHz
UHD Graphics 630
min:
42 fps
48 48 49.5 49.7 [X] no model Intel Core i7-8700K 3.7GHz
UHD Graphics 630
min:
45.2 fps
50 50.1 52.1 55.8 [X] Aorus Z370 Ultra Gaming Desktop DDR4-2666 Intel Core i7-8086K 3.7GHz
UHD Graphics 630
min:
51.2 fps
60.3 [X] Asus Maximus XIII Hero Intel Core i3-10320 3.8GHz
UHD Graphics 630
min:
54.2 fps, max:
-1 fps
~ 50 fps
44%
Iris Plus Graphics 640:
55 63.7 ~ 59 fps
100%
GeForce GTX 1070 Ti (Desktop):
126.6 [X] Intel Core i7-4790K 4GHz
GeForce GTX 1070 Ti (Desktop)
min:
111.1 fps
fps
16%
UHD Graphics 630:
7.8 19.7 20 [X] no model Intel Core i5-8400 2.8GHz
UHD Graphics 630
min:
18.6 fps
20 20.2 21 21 21.3 22.9 [X] Asus Maximus XIII Hero Intel Core i3-10320 3.8GHz
UHD Graphics 630
min:
21.3 fps, max:
-1 fps
23.7 [X] no model Intel Core i7-8700K 3.7GHz
UHD Graphics 630
min:
21.8 fps
23.8 [X] Aorus Z370 Ultra Gaming Desktop DDR4-2666 Intel Core i7-8086K 3.7GHz
UHD Graphics 630
min:
22.3 fps
~ 20 fps
23%
Iris Plus Graphics 640:
27.6 29.5 ~ 29 fps
100%
GeForce GTX 1070 Ti (Desktop):
121.2 [X] Intel Core i7-4790K 4GHz
GeForce GTX 1070 Ti (Desktop)
min:
105.8 fps
fps
15%
UHD Graphics 630:
6.8 17.4 17.5 17.6 [X] no model Intel Core i5-8400 2.8GHz
UHD Graphics 630
min:
16.4 fps
17.9 18.8 19.1 19.1 20.1 [X] Asus Maximus XIII Hero Intel Core i3-10320 3.8GHz
UHD Graphics 630
min:
18.9 fps, max:
-1 fps
20.9 [X] Aorus Z370 Ultra Gaming Desktop DDR4-2666 Intel Core i7-8086K 3.7GHz
UHD Graphics 630
min:
19.6 fps
21 [X] no model Intel Core i7-8700K 3.7GHz
UHD Graphics 630
min:
19.4 fps
~ 18 fps
17%
Iris Plus Graphics 640:
19.8 23 ~ 21 fps
100%
GeForce GTX 1070 Ti (Desktop):
105 [X] Intel Core i7-4790K 4GHz
GeForce GTX 1070 Ti (Desktop)
min:
95 fps
fps
7%
UHD Graphics 630:
6.5 7.5 [X] Aorus Z370 Ultra Gaming Desktop DDR4-2666 Intel Core i7-8086K 3.7GHz
UHD Graphics 630
min:
7.1 fps
~ 7 fps
100%
GeForce GTX 1070 Ti (Desktop):
293 [X] Intel Core i7-4790K 4GHz
GeForce GTX 1070 Ti (Desktop)
min:
269 fps, max:
321 fps
fps
5%
UHD Graphics 630:
15.2 [X] Gigabyte Aero 15X Intel Core i7-8750H 2.2GHz
UHD Graphics 630
16 17.3 ~ 16 fps
UHD Graphics 630:
9.9 [X] Gigabyte Aero 15X Intel Core i7-8750H 2.2GHz
UHD Graphics 630
10.8 ~ 10 fps
Iris Plus Graphics 640:
13.4 fps
100%
GeForce GTX 1070 Ti (Desktop):
71.8 [X] Intel Core i7-4790K 4GHz
GeForce GTX 1070 Ti (Desktop)
min:
61 fps, max:
80 fps
fps
6%
Iris Plus Graphics 640:
4 fps
100%
GeForce GTX 1070 Ti (Desktop):
47.1 [X] Intel Core i7-4790K 4GHz
GeForce GTX 1070 Ti (Desktop)
min:
42 fps, max:
51 fps
fps
UHD Graphics 630:
153.6 [X] HP Pavilion Gaming 15-cx0003ng Intel Core i7-8750H 2.2GHz
UHD Graphics 630
fps
UHD Graphics 630:
35.6 [X] HP Pavilion Gaming 15-cx0003ng Intel Core i7-8750H 2.2GHz
UHD Graphics 630
fps
UHD Graphics 630:
15.2 [X] HP Pavilion Gaming 15-cx0003ng Intel Core i7-8750H 2.2GHz
UHD Graphics 630
fps
UHD Graphics 630:
44.9 [X] HP Pavilion Gaming 15-cx0003ng Intel Core i7-8750H 2.2GHz
UHD Graphics 630
57.7 [X] Medion Erazer Beast X20 Intel Core i7-10870H 2.2GHz
UHD Graphics 630
min:
7.91 fps, P1:
34.5 fps, max:
201 fps
~ 51 fps
Iris Plus Graphics 640:
56.7 fps
UHD Graphics 630:
34.6 [X] HP Pavilion Gaming 15-cx0003ng Intel Core i7-8750H 2.2GHz
UHD Graphics 630
45.9 [X] Medion Erazer Beast X20 Intel Core i7-10870H 2.2GHz
UHD Graphics 630
min:
5.79 fps, P1:
27.8 fps, max:
213 fps
~ 40 fps
Iris Plus Graphics 640:
28.9 fps
UHD Graphics 630:
7.9 [X] HP Pavilion Gaming 15-cx0003ng Intel Core i7-8750H 2.2GHz
UHD Graphics 630
10.2 [X] Medion Erazer Beast X20 Intel Core i7-10870H 2.2GHz
UHD Graphics 630
min:
6.95 fps, P1:
7.94 fps, max:
242 fps
~ 9 fps
Iris Plus Graphics 640:
11.8 fps
UHD Graphics 630:
4.2 [X] Medion Erazer Beast X20 Intel Core i7-10870H 2.2GHz
UHD Graphics 630
min:
2.16 fps, P1:
2.9 fps, max:
23.4 fps
fps
100%
GeForce GTX 1070 Ti (Desktop):
67 [X] i7-7740X Asus X299 Prime Intel Core i7-7740X 4.3GHz
GeForce GTX 1070 Ti (Desktop)
min:
11.7 fps, P1:
27 fps, max:
202 fps
fps
UHD Graphics 630:
41.8 [X] Medion Erazer X15805 Intel Core i9-8950HK 2.9GHz
UHD Graphics 630
fps
UHD Graphics 630:
28.7 [X] Medion Erazer X15805 Intel Core i9-8950HK 2.9GHz
UHD Graphics 630
fps
UHD Graphics 630:
9.8 [X] Medion Erazer X15805 Intel Core i9-8950HK 2.9GHz
UHD Graphics 630
fps
UHD Graphics 630:
39.6 [X] HP Pavilion Gaming 15-cx0003ng Intel Core i7-8750H 2.2GHz
UHD Graphics 630
fps
UHD Graphics 630:
23.7 [X] HP Pavilion Gaming 15-cx0003ng Intel Core i7-8750H 2.2GHz
UHD Graphics 630
fps
UHD Graphics 630:
171 [X] HP Pavilion Gaming 15-cx0003ng Intel Core i7-8750H 2.2GHz
UHD Graphics 630
fps
UHD Graphics 630:
65 [X] HP Pavilion Gaming 15-cx0003ng Intel Core i7-8750H 2.2GHz
UHD Graphics 630
fps
UHD Graphics 630:
29.1 [X] HP Pavilion Gaming 15-cx0003ng Intel Core i7-8750H 2.2GHz
UHD Graphics 630
fps
Iris Plus Graphics 640:
28.6 fps
Iris Plus Graphics 640:
20.2 20.8 ~ 21 fps
Iris Plus Graphics 640:
43.1 60.3 ~ 52 fps
Iris Plus Graphics 640:
29.7 42 ~ 36 fps
Iris Plus Graphics 640:
23.2 30.7 ~ 27 fps
Iris Plus Graphics 640:
8.2 9.9 ~ 9 fps
UHD Graphics 630:
58.7 64.6 69.8 [X] no model Intel Core i7-8700K 3.7GHz
UHD Graphics 630
82.4 ~ 69 fps
Iris Plus Graphics 640:
61 68.2 ~ 65 fps
UHD Graphics 630:
34.4 34.7 40.1 41.8 [X] no model Intel Core i7-8700K 3.7GHz
UHD Graphics 630
41.8 [X] no model Intel Core i7-8700K 3.7GHz
UHD Graphics 630
~ 39 fps
Iris Plus Graphics 640:
40.2 45.1 ~ 43 fps
UHD Graphics 630:
27.3 29.9 33.9 37.1 [X] no model Intel Core i7-8700K 3.7GHz
UHD Graphics 630
~ 32 fps
Iris Plus Graphics 640:
33.5 38.3 ~ 36 fps
100%
GeForce GTX 1070 Ti (Desktop):
132 [X] Intel Core i7-4790K 4GHz
GeForce GTX 1070 Ti (Desktop)
min:
58 fps, max:
235 fps
fps
8%
UHD Graphics 630:
8.1 9.8 10.8 15 [X] no model Intel Core i7-8700K 3.7GHz
UHD Graphics 630
min:
8 fps, max:
52 fps
~ 11 fps
9%
Iris Plus Graphics 640:
10.7 12.5 ~ 12 fps
UHD Graphics 630:
100.1 [X] HP Pavilion Gaming 15-cx0003ng Intel Core i7-8750H 2.2GHz
UHD Graphics 630
fps
Iris Plus Graphics 640:
103 132.6 ~ 118 fps
UHD Graphics 630:
49.1 [X] HP Pavilion Gaming 15-cx0003ng Intel Core i7-8750H 2.2GHz
UHD Graphics 630
fps
Iris Plus Graphics 640:
54.1 68.7 ~ 61 fps
UHD Graphics 630:
28.7 [X] HP Pavilion Gaming 15-cx0003ng Intel Core i7-8750H 2.2GHz
UHD Graphics 630
fps
Iris Plus Graphics 640:
37 47.1 ~ 42 fps
Iris Plus Graphics 640:
17.2 21.6 ~ 19 fps
UHD Graphics 630:
146.8 [X] HP Pavilion Gaming 15-cx0003ng Intel Core i7-8750H 2.2GHz
UHD Graphics 630
fps
UHD Graphics 630:
102.4 [X] HP Pavilion Gaming 15-cx0003ng Intel Core i7-8750H 2.2GHz
UHD Graphics 630
fps
UHD Graphics 630:
54.1 [X] HP Pavilion Gaming 15-cx0003ng Intel Core i7-8750H 2.2GHz
UHD Graphics 630
fps
UHD Graphics 630:
28.6 [X] HP Pavilion Gaming 15-cx0003ng Intel Core i7-8750H 2.2GHz
UHD Graphics 630
fps
UHD Graphics 630:
93.3 [X] HP Pavilion Gaming 15-cx0003ng Intel Core i7-8750H 2.2GHz
UHD Graphics 630
fps
UHD Graphics 630:
59.9 [X] HP Pavilion Gaming 15-cx0003ng Intel Core i7-8750H 2.2GHz
UHD Graphics 630
fps
UHD Graphics 630:
56.6 [X] HP Pavilion Gaming 15-cx0003ng Intel Core i7-8750H 2.2GHz
UHD Graphics 630
fps
UHD Graphics 630:
31.5 [X] HP Pavilion Gaming 15-cx0003ng Intel Core i7-8750H 2.2GHz
UHD Graphics 630
fps
Iris Plus Graphics 640:
35.2 fps
UHD Graphics 630:
63.3 [X] HP Pavilion Gaming 15-cx0003ng Intel Core i7-8750H 2.2GHz
UHD Graphics 630
fps
UHD Graphics 630:
31.9 [X] HP Pavilion Gaming 15-cx0003ng Intel Core i7-8750H 2.2GHz
UHD Graphics 630
fps
UHD Graphics 630:
18.5 [X] HP Pavilion Gaming 15-cx0003ng Intel Core i7-8750H 2.2GHz
UHD Graphics 630
fps
UHD Graphics 630:
9.7 [X] HP Pavilion Gaming 15-cx0003ng Intel Core i7-8750H 2.2GHz
UHD Graphics 630
fps
UHD Graphics 630:
241.5 [X] HP Pavilion Gaming 15-cx0003ng Intel Core i7-8750H 2.2GHz
UHD Graphics 630
fps
UHD Graphics 630:
59.5 [X] HP Pavilion Gaming 15-cx0003ng Intel Core i7-8750H 2.2GHz
UHD Graphics 630
fps
UHD Graphics 630:
34.9 [X] HP Pavilion Gaming 15-cx0003ng Intel Core i7-8750H 2.2GHz
UHD Graphics 630
fps
Iris Plus Graphics 640:
28.5 fps
Average Gaming NVIDIA GeForce GTX 1070 Ti (Desktop) → 100% Average Gaming 30-70 fps → 100%
Average Gaming Intel UHD Graphics 630 → 18% Average Gaming 30-70 fps → 25%
Average Gaming Intel Iris Plus Graphics 640 → 19% Average Gaming 30-70 fps → 44%
For more games that might be playable and a list of all games and graphics cards visit our Gaming List
v1.26
log 15. 05:46:44
#0 checking url part for id 8258 +0s ... 0s
#1 checking url part for id 8126 +0s ... 0s
#2 checking url part for id 7656 +0s ... 0s
#3 not redirecting to Ajax server +0s ... 0s
#4 did not recreate cache, as it is less than 5 days old! Created at Mon, 13 May 2024 05:40:51 +0200 +0.001s ... 0.001s
#5 composed specs +0.215s ... 0.216s
#6 did output specs +0s ... 0.216s
#7 start showIntegratedCPUs +0s ... 0.216s
#8 getting avg benchmarks for device 8258 +0.068s ... 0.284s
#9 got single benchmarks 8258 +0.011s ... 0.295s
#10 getting avg benchmarks for device 8126 +0.021s ... 0.316s
#11 got single benchmarks 8126 +0.06s ... 0.376s
#12 getting avg benchmarks for device 7656 +0.002s ... 0.378s
#13 got single benchmarks 7656 +0.023s ... 0.401s
#14 got avg benchmarks for devices +0s ... 0.401s
#15 min, max, avg, median took s +0.47s ... 0.872s
#16 before gaming benchmark output +0s ... 0.872s
#17 Got 646 rows for game benchmarks. +0.117s ... 0.988s
#18 composed SQL query for gamebenchmarks +0s ... 0.988s
#19 got data and put it in $dataArray +0.099s ... 1.087s
#20 benchmarks composed for output. +0.311s ... 1.399s
#21 calculated avg scores. +0s ... 1.399s
#22 return log +0.004s ... 1.402s
Please share our article, every link counts!
Redaktion, 2017-09- 8 (Update: 2023-07- 1)
 Deutsch
 English
 Español
 Français
 Italiano
 Nederlands
 Polski
 Português
 Русский
 Türkçe
 Svenska
 Chinese
 Magyar