AMD Radeon R7 (Bristol Ridge) vs Intel HD Graphics (Bay Trail) vs Intel HD Graphics (Haswell)
AMD Radeon R7 (Bristol Ridge) ► remove from comparison
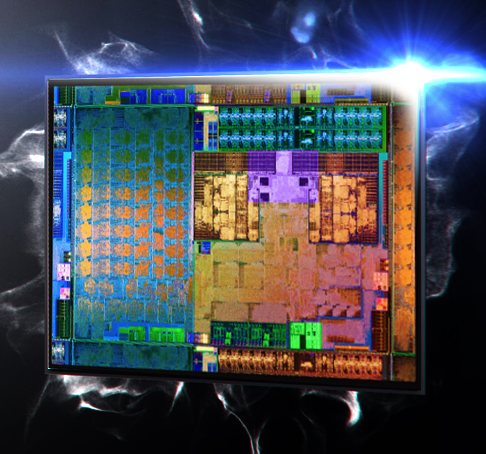
The AMD Radeon R7 (Bristol Ridge) is an integrated graphics card for the fastest mobile AMD Carrizo APUs. At its launch, the R7 is available on the top model FX9830P with 512 GCN shader units and a core clock of 900 MHz. The technical specifications do not differ from the AMD Radeon R7 in Carrizo, but the clock is up to 100 MHz higher. Depending on the cooling and the configurable TDP (12-45 Watts), the performance can differ quite a lot. The performance also depends on the memory (best performance with dual-channel DDR4).
Architecture and Features
According to AMD, the Radeon R7 consists of eight cores based on the third GCN generation (often called GCN 1.2 or 2.0 in the press). It is therefore very similar to the Tonga desktop chip and supports DirectX 12 (FL 12_0). Furthermore, its shaders can be used with Mantle, OpenGL and OpenCL. HSA 1.0 is supported for running code on both CPU and GPU cores simultaneously.
Compared to the Kaveri generation (Kaveri R7 with GCN 1.1), the new color compression in particular results in better memory utilization and improves the gaming performance by 5-7 %.
The improved video decoder of Carrizo/Bristol Ridge now includes UVD 6 (Unified Video Decoder), which can decode HVEC / H.265 up to 4K in hardware. Furthermore, the VCE (Video Codec Engine) has been improved for faster transcoding of H.264. More information on architecture and features of the Bristol Ridge architecture can be found in our launch article.
Performance
Depending on the configurable TDP of the Bristol Ridge chips between 12 up to 45 Watts, there can be significant differences in games. Overall, the results are slightly better compared to the Carrizo Radeon R7 due to the higher clocks for comparable model. You can still use the Kaveri R7 benchmarks to check the gaming performance.
Power Consumption
Depending on the configurable TDP (cTDP), the 28 nm chip is specified at 12-45 Watts. It can therefore be used for thin and light notebooks as well as medium-sized devices or All-in-Ones (AiO).
Intel HD Graphics (Bay Trail) ► remove from comparison
The Intel HD Graphics (Bay Trail) is a low-end integrated Bay Trail graphics card found in certain Atom models (Z3770 ), nettops (J2850 ) and notebook SoCs (N3510 ). It supports DirectX 11 and is based on the Ivy Bridge GPU. Clock rates and shader cores, however, are considerably lower.
Compared to Ivy Bridge, which offers either 6 or 16 Execution Units, the HD Graphics (Bay Trail) comes with only 4 EUs. The core clock is significantly lower as well. Depending on the specific model, the maximum Turbo Boost is 896 MHz or less and the memory controller can support DDR3(L), DDR3L-RS or LPDDR3 in single- or dual-channel operation.
The fastest notebook models equipped with this GPU nearly match the performance of the HD Graphics (Sandy Bridge) and the AMD Radeon HD 6310 . Therefore, older and less demanding Windows games like World of Warcraft or Half-Life 2 can be played fluently in very low settings. Performance is not sufficient for most modern titles.
Compared to competing ARM SoCs, Bay Trail outperforms the Adreno 320 (which can be found in different Qualcomm SoCs like the Snapdragon 600 ) and offers a performance similar to the Tegra 4 GPU. That is enough power to run even the most demanding Android games smoothly in very high resolutions as of 2013.
The integrated video decoder supports all popular codecs such as MPEG2, H.264, VC1, VP8 and MVC and is suitable for resolutions up to 4K up to 100 Mbit/s. The user can connect up to two displays via HDMI 1.4 (max. 1920 x 1080) or DisplayPort 1.2 (max. 2560 x 1600). Another new feature is the support for Wireless Display and Quick Sync, Intel's fast and power efficient H-264 hardware encoder. Some of these features are not available on all models.
Depending on the model, the power consumption of the entire SoC is somewhere between 2 and 10 W. The most efficient versions are therefore suitable for passively cooled tablets, whereas faster variants are used in larger subnotebooks with active cooling.
Intel HD Graphics (Haswell) ► remove from comparison
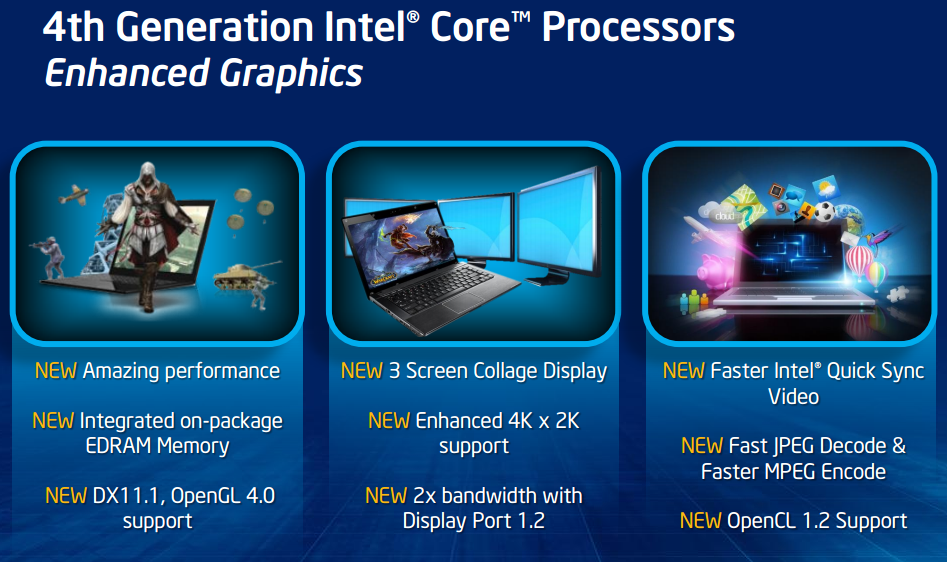
The Intel HD Graphics (Haswell) is an integrated graphics card in the Haswell codenamed processors (Celeron and Pentium). It is the successor the the Intel HD Graphics in the Ivy Bridge CPUs and performs slightly better. Depending on the processor model, the base and turbo clock rates may differ, resulting in varying graphics performance between CPU models.
In comparison to the HD 4000, the graphics core has been modified extensively. The GPU supports DirectX 11.1, OpenCL 1.2 and OpenGL 4.0. It also features an improved decoder for 4K videos and the fast Quick Sync encoder (deactivated in many entry level models).
The Performance of the HD Graphics (Haswell) is similar to the old HD Graphics 3000 or the AMD Radeon HD 8250 . Only a few modern games like Dota 2 can be played fluently in very low details and resolutions.
Due to the 22nm 3D Tri-Gate production process, the power consumption should be relatively low (the development was focused on performance per Watt). The GPU can be found in ULV models and regular (37 W) dual core CPUs.
AMD Radeon R7 (Bristol Ridge) Intel HD Graphics (Bay Trail) Intel HD Graphics (Haswell) HD Graphics Series Codename Bristol Ridge Bay Trail Haswell GT1 Architecture GCN 1.2 Gen. 7 Ivy Bridge Gen. 7.5 Haswell Pipelines 512 - unified 4 - unified 10 - unified Core Speed 900 (Boost) MHz 311 - 896 (Boost) MHz 200 - 1000 (Boost) MHz Memory Bus Width 64/128 Bit 32/64/128 Bit 64/128 Bit Shared Memory yes yes yes API DirectX 12 (FL 12_0), OpenGL 4.4 DirectX 11, Shader 5.0, OpenGL 4.0, ES 3.0 DirectX 11.1, Shader 5.0 Power Consumption 12-45 Watt Transistors 2.4 Billion technology 28 nm 22 nm 22 nm Features UVD 6, VCE Notebook Size medium sized Date of Announcement 01.06.2016 11.09.2013 01.10.2012
CPU in Radeon R7 (Bristol Ridge) GPU Base Speed GPU Boost / Turbo AMD FX-9830P 4 x 3000 MHz, 25-45 W ? MHz 900 MHz AMD PRO A12-9830B 4 x 3000 MHz, 25-45 W ? MHz 900 MHz AMD FX-9800P 4 x 2700 MHz, 15 W ? MHz 758 MHz » show 3 more AMD PRO A12-9800B 4 x 2700 MHz, 15 W ? MHz 758 MHz AMD A12-9720P 4 x 2700 MHz, 15 W ? MHz 758 MHz AMD A12-9700P 4 x 2500 MHz, 15 W ? MHz 758 MHz min. - max. ? MHz 758 - 900 MHz
CPU in HD Graphics (Bay Trail) GPU Base Speed GPU Boost / Turbo Intel Pentium N3540 4 x 2160 MHz, 7.5 W 313 MHz 896 MHz Intel Pentium J2900 4 x 2410 MHz, 10 W 688 MHz 896 MHz Intel Pentium N3530 4 x 2160 MHz, 7.5 W 313 MHz 896 MHz » show 43 more Intel Pentium J2850 4 x 2400 MHz, 10 W 688 MHz 792 MHz Intel Pentium N3520 4 x 2167 MHz, 7.5 W 313 MHz 854 MHz Intel Celeron J1900 4 x 2000 MHz, 10 W 688 MHz 854 MHz Intel Atom Z3795 4 x 1590 MHz, <4 W 311 MHz 778 MHz Intel Atom Z3785 4 x 1490 MHz, <4 W 313 MHz 833 MHz Intel Atom Z3775 4 x 1460 MHz, <4 W 311 MHz 778 MHz Intel Atom Z3775D 4 x 1490 MHz, <4 W 311 MHz 792 MHz Intel Atom Z3770 4 x 1460 MHz, <4 W 311 MHz 667 MHz Intel Atom Z3770D 4 x 1500 MHz, 4 W 313 MHz 688 MHz Intel Celeron N2940 4 x 1830 MHz, 7.5 W 313 MHz 854 MHz Intel Celeron N2930 4 x 1830 MHz, 7.5 W 313 MHz 854 MHz Intel Celeron J1850 4 x 2000 MHz, 10 W 688 MHz 792 MHz Intel Pentium N3510 4 x 2000 MHz, 7.5 W 313 MHz 750 MHz Intel Celeron N2920 4 x 1860 MHz, 7.5 W 313 MHz 854 MHz Intel Atom E3845 4 x 1910 MHz, 10 W 542 MHz 792 MHz Intel Atom Z3736F 4 x 1330 MHz, 4 W 313 MHz 646 MHz Intel Atom Z3736G 4 x 1330 MHz, <4 W 313 MHz 646 MHz Intel Atom Z3745 4 x 1330 MHz, <4 W 311 MHz 778 MHz Intel Atom Z3745D 4 x 1330 MHz, <4 W 311 MHz 792 MHz Intel Atom Z3740 4 x 1330 MHz, <4 W 311 MHz 667 MHz Intel Atom Z3740D 4 x 1330 MHz, <4 W 313 MHz 688 MHz Intel Atom Z3735D 4 x 1330 MHz, <4 W 311 MHz 646 MHz Intel Atom Z3735E 4 x 1330 MHz, <4 W 311 MHz 646 MHz Intel Atom Z3735F 4 x 1330 MHz, <4 W 311 MHz 646 MHz Intel Atom Z3735G 4 x 1330 MHz, <4 W 311 MHz 646 MHz Intel Celeron J1800 2 x 2410 MHz, 10 W 688 MHz 792 MHz Intel Celeron N2840 2 x 2160 MHz, 7.5 W 313 MHz 792 MHz Intel Celeron J1750 2 x 2410 MHz, 10 W 688 MHz 750 MHz Intel Celeron N2910 4 x 1600 MHz, 7.5 W 313 MHz 756 MHz Intel Celeron N2830 2 x 2160 MHz, 7.5 W 313 MHz 750 MHz Intel Celeron N2820 2 x 2170 MHz, 7.5 W 313 MHz 756 MHz Intel Celeron N2815 2 x 1860 MHz, 7.5 W 313 MHz 756 MHz Intel Celeron N2810 2 x 2000 MHz, 7.5 W 313 MHz 756 MHz Intel Atom Z3680 2 x 1330 MHz, 4 W 311 MHz 667 MHz Intel Atom Z3680D 2 x 1330 MHz, 4 W 313 MHz 688 MHz Intel Celeron N2808 2 x 1580 MHz, 4.3 W 313 MHz 792 MHz Intel Celeron N2807 2 x 1580 MHz, 4.3 W 313 MHz 750 MHz Intel Celeron N2806 2 x 1580 MHz, 4.5 W 313 MHz 756 MHz Intel Atom E3827 2 x 1750 MHz, 8 W 542 MHz 792 MHz Intel Atom E3826 2 x 1460 MHz, 7 W 533 MHz 667 MHz Intel Celeron N2805 2 x 1460 MHz, 4.3 W 313 MHz 667 MHz Intel Atom E3825 2 x 1330 MHz, 6 W ? MHz 533 MHz Intel Atom E3815 1 x 1460 MHz, 5 W ? MHz 400 MHz min. - max. 311 - ? MHz 400 - 900 MHz
CPU in HD Graphics (Haswell) GPU Base Speed GPU Boost / Turbo Intel Pentium 3560M 2 x 2400 MHz, 37 W 400 MHz 1100 MHz Intel Pentium 3550M 2 x 2300 MHz, 37 W 400 MHz 1100 MHz Intel Celeron 2970M 2 x 2200 MHz, 37 W 400 MHz 1100 MHz » show 10 more Intel Celeron 2950M 2 x 2000 MHz, 37 W 400 MHz 1100 MHz Intel Pentium 3558U 2 x 1700 MHz, 15 W 200 MHz 1000 MHz Intel Pentium 3556U 2 x 1700 MHz, 15 W 200 MHz 1000 MHz Intel Celeron 2981U 2 x 1600 MHz, 15 W 200 MHz 1000 MHz Intel Celeron 2980U 2 x 1600 MHz, 15 W 200 MHz 1000 MHz Intel Celeron 2957U 2 x 1400 MHz, 15 W 200 MHz 1000 MHz Intel Celeron 2955U 2 x 1400 MHz, 15 W 200 MHz 1000 MHz Intel Pentium 3561Y 2 x 1200 MHz, 11.5 W 200 MHz 850 MHz Intel Pentium 3560Y 2 x 1200 MHz, 11.5 W 200 MHz 850 MHz Intel Celeron 2961Y 2 x 1100 MHz, 11.5 W 200 MHz 850 MHz min. - max. 200 - ? MHz 400 - 1100 MHz
Benchmarks Performance Rating - 3DMark 11 + Fire Strike + Time Spy - Radeon R7 (Bristol Ridge)
0.5 pt (1%)
...
AMD Radeon R7 (Bristol Ridge)
...
max:
Performance Rating - 3DMark 11 + Fire Strike + Time Spy - HD Graphics (Bay Trail)
0.1 pt (0%)
Intel HD Graphics (Bay Trail)
...
max:
Performance Rating - 3DMark 11 + Fire Strike + Time Spy - HD Graphics (Haswell)
0.2 pt (0%)
...
Intel HD Graphics (Haswell)
...
max:
3DMark - 3DMark Time Spy Score
min: 338 avg: 364.7 median: 358 (1%) max: 398 Points
3DMark - 3DMark Time Spy Graphics
min: 325 avg: 343.7 median: 347 (1%) max: 359 Points
3DMark - 3DMark Ice Storm Unlimited Graphics
min: 34845 avg: 49654 median: 52245.5 (6%) max: 59281 Points
min: 11835 avg: 14513 median: 14748.5 (2%) max: 17613 Points
43493 Points (5%)
3DMark - 3DMark Ice Storm Extreme Graphics
min: 32062 avg: 34971 median: 32389 (4%) max: 40461 Points
min: 4751 avg: 7342 median: 7498 (1%) max: 9234 Points
3DMark - 3DMark Cloud Gate Score
min: 3162 avg: 4026 median: 3942 (4%) max: 5173 Points
min: 354 avg: 1182 median: 1188 (1%) max: 1703 Points
min: 2141 avg: 2403 median: 2335.5 (2%) max: 3011 Points
3DMark - 3DMark Cloud Gate Graphics
min: 3477 avg: 5531 median: 5311 (1%) max: 8107 Points
min: 362 avg: 1230 median: 1228.5 (0%) max: 1670 Points
min: 3111 avg: 3415 median: 3278 (1%) max: 4199 Points
3DMark - 3DMark Fire Strike Standard Score
min: 667 avg: 938 median: 866 (2%) max: 1230 Points
min: 83 avg: 185 median: 147 (0%) max: 495 Points
min: 300 avg: 323.8 median: 314 (1%) max: 383 Points
3DMark - 3DMark Fire Strike Standard Graphics
min: 750 avg: 1081 median: 1013 (1%) max: 1466 Points
min: 90 avg: 149.1 median: 149 (0%) max: 200 Points
min: 340 avg: 370.8 median: 362.5 (0%) max: 433 Points
3DMark - 3DMark Ice Storm Graphics
min: 44545 avg: 48082 median: 46007 (6%) max: 53693 Points
min: 5056 avg: 15391 median: 16047 (2%) max: 21351 Points
min: 29291 avg: 34138 median: 34675 (4%) max: 40515 Points
3DMark 11 - 3DM11 Performance Score
min: 1737 avg: 1859 median: 1794 (2%) max: 2130 Points
min: 143 avg: 222.6 median: 216 (0%) max: 280 Points
min: 435 avg: 543 median: 544 (1%) max: 688 Points
3DMark 11 - 3DM11 Performance GPU
min: 1820 avg: 1913 median: 1852 (2%) max: 2210 Points
min: 122 avg: 192.1 median: 186.5 (0%) max: 237 Points
min: 384 avg: 479.6 median: 484 (0%) max: 602 Points
3DMark Vantage + AMD Radeon R7 (Bristol Ridge) 3DMark Vantage - 3DM Vant. Perf. total
5568 Points (2%)
3DM Vant. Perf. total + Intel HD Graphics (Bay Trail) min: 507 avg: 666 median: 637 (0%) max: 846 Points
3DM Vant. Perf. total + Intel HD Graphics (Haswell)
min: 2146 avg: 2163 median: 2163 (1%) max: 2180 Points
3DM Vant. Perf. GPU no PhysX + AMD Radeon R7 (Bristol Ridge) 3DMark Vantage - 3DM Vant. Perf. GPU no PhysX
5111 Points (3%)
3DM Vant. Perf. GPU no PhysX + Intel HD Graphics (Bay Trail) min: 395 avg: 512 median: 503 (0%) max: 667 Points
3DM Vant. Perf. GPU no PhysX + Intel HD Graphics (Haswell)
min: 1848 avg: 1859 median: 1859 (1%) max: 1870 Points
3DMark 2001SE - 3DMark 2001 - Standard
7727 Points (8%)
3DMark 03 - 3DMark 03 - Standard
min: 4226 avg: 4997 median: 5220 (3%) max: 5323 Points
3DMark 05 - 3DMark 05 - Standard
min: 2666 avg: 3195 median: 3331 (4%) max: 3445 Points
3DMark 06 3DMark 06 - Standard 1280x1024 + AMD Radeon R7 (Bristol Ridge)
min: 5635 avg: 6645 median: 6644.5 (9%) max: 7654 Points
3DMark 06 - Standard 1280x1024 + Intel HD Graphics (Bay Trail)
min: 814 avg: 1785 median: 1866 (2%) max: 2151 Points
3DMark 06 - Standard 1280x1024 + Intel HD Graphics (Haswell)
min: 2917 avg: 3274 median: 3357.5 (4%) max: 3463 Points
3DMark 06 - Score Unknown Settings + Intel HD Graphics (Bay Trail)
2108 Points (3%)
3DMark 06 - Standard 1280x800 + Intel HD Graphics (Bay Trail)
2087 Points (3%)
Unigine Valley 1.0 - Unigine Valley 1.0 DX
3.5 fps (1%)
Unigine Heaven 3.0 - Unigine Heaven 3.0 DX 11
13.9 fps (5%)
3.6 fps (1%)
Unigine Heaven 2.1 - Heaven 2.1 high
19.5 fps (4%)
min: 2.4 avg: 2.8 median: 2.8 (1%) max: 3.4 fps
Windows 7 Experience Index - Win7 Gaming graphics
6.3 Points (80%)
Windows 7 Experience Index - Win7 Graphics
4.7 Points (59%)
Cinebench R10 Cinebench R10 Shading (32bit) + AMD Radeon R7 (Bristol Ridge) Cinebench R10 - Cinebench R10 Shading (32bit)
min: 4680 avg: 4943 median: 4845 (3%) max: 5403 Points
Cinebench R10 Shading (32bit) + Intel HD Graphics (Bay Trail)
min: 898 avg: 2014 median: 1991.5 (1%) max: 2889 Points
Cinebench R10 Shading (32bit) + Intel HD Graphics (Haswell)
min: 3867 avg: 4235 median: 4215.5 (3%) max: 4642 Points
Cinebench R11.5 Cinebench R11.5 OpenGL 64 Bit + AMD Radeon R7 (Bristol Ridge) Cinebench R11.5 - Cinebench R11.5 OpenGL 64 Bit
min: 18.06 avg: 20.1 median: 18.3 (6%) max: 25.65 fps
Cinebench R11.5 OpenGL 64 Bit + Intel HD Graphics (Bay Trail)
min: 0.37 avg: 6.2 median: 6.4 (2%) max: 7.69 fps
Cinebench R11.5 OpenGL 64 Bit + Intel HD Graphics (Haswell)
min: 9.38 avg: 11.4 median: 11.6 (4%) max: 12.78 fps
Cinebench R15 + AMD Radeon R7 (Bristol Ridge) Cinebench R15 - Cinebench R15 OpenGL 64 Bit
min: 22.88 avg: 25.1 median: 23.2 (1%) max: 31.43 fps
Cinebench R15 OpenGL 64 Bit + Intel HD Graphics (Bay Trail) min: 2.88 avg: 5 median: 5.5 (0%) max: 6.55 fps
Cinebench R15 OpenGL 64 Bit + Intel HD Graphics (Haswell)
min: 10.28 avg: 13.2 median: 13.9 (1%) max: 14.59 fps
Cinebench R15 OpenGL Ref. Match 64 Bit + AMD Radeon R7 (Bristol Ridge) Cinebench R15 - Cinebench R15 OpenGL Ref. Match 64 Bit
98 % (98%)
Cinebench R15 OpenGL Ref. Match 64 Bit + Intel HD Graphics (Bay Trail)
min: 63 avg: 96.1 median: 97.8 (98%) max: 97.8 %
Cinebench R15 OpenGL Ref. Match 64 Bit + Intel HD Graphics (Haswell)
98 % (98%)
GFXBench - GFXBench Car Chase Offscreen
23.8 fps (3%)
11.6 fps (1%)
GFXBench 3.1 - GFXBench Manhattan ES 3.1 Offscreen
24.3 fps (1%)
5.2 fps (0%)
20.1 fps (0%)
GFXBench 3.0 - GFXBench 3.0 Manhattan Offscreen
25.9 fps (2%)
min: 6 avg: 9.7 median: 8.8 (1%) max: 16 fps
28.7 fps (2%)
GFXBench (DX / GLBenchmark) 2.7 + AMD Radeon R7 (Bristol Ridge) GFXBench (DX / GLBenchmark) 2.7 - GFXBench T-Rex HD Offscreen C24Z16
90 fps (1%)
GFXBench T-Rex HD Offscreen C24Z16 + Intel HD Graphics (Bay Trail) min: 6 avg: 15.7 median: 16 (0%) max: 20.2 fps
GFXBench T-Rex HD Offscreen C24Z16 + Intel HD Graphics (Haswell) 53.5 fps (0%)
Basemark ES 2.0 - Basemark ES 2.0
min: 45.08 avg: 49.1 median: 49.1 (81%) max: 53.1 fps
Basemark X 1.0 - Basemark X 1.0 Off-Screen
10.1 fps (48%)
Basemark X 1.1 - Basemark X 1.1 High Quality
min: 3008 avg: 6663 median: 8456 (19%) max: 8524 Points
Basemark X 1.1 - Basemark X 1.1 Medium Quality
min: 4802 avg: 12880 median: 14509 (32%) max: 17701 Points
NenaMark2 - NenaMark2 Score
min: 59 avg: 59.4 median: 59.4 (88%) max: 59.7 fps
LuxMark v2.0 64Bit - LuxMark v2.0 Room GPU
min: 175 avg: 178.5 median: 178.5 (1%) max: 182 Samples/s
min: 25 avg: 28.5 median: 27 (0%) max: 35 Samples/s
min: 77 avg: 93 median: 93 (0%) max: 109 Samples/s
LuxMark v2.0 64Bit - LuxMark v2.0 Sala GPU
min: 358 avg: 362.5 median: 362.5 (1%) max: 367 Samples/s
min: 26 avg: 29 median: 29 (0%) max: 34 Samples/s
min: 115 avg: 140 median: 140 (0%) max: 165 Samples/s
ComputeMark v2.1 - ComputeMark v2.1 Result
min: 1093 avg: 1346 median: 1450 (2%) max: 1495 Points
min: 160 avg: 172.8 median: 174 (0%) max: 192 Points
min: 355 avg: 370 median: 370 (0%) max: 385 Points
PassMark PerformanceTest Mobile V1 - PerformanceTest Mobile V1 2D Graphics Tests
min: 3822 avg: 4036 median: 3866 (4%) max: 4588 Points
PassMark PerformanceTest Mobile V1 - PerformanceTest Mobile V1 3D Graphics Tests
min: 1058 avg: 1251 median: 1228 (2%) max: 1488 Points
Smartbench 2012 - Smartbench 2012 Gaming Index
min: 2679 avg: 3414 median: 3385 (74%) max: 4274 Points
Power Consumption - Furmark Stress Test Power Consumption - external Monitor *
43.7 Watt (6%)
Power Consumption - The Witcher 3 Power Consumption - external Monitor *
29.1 Watt (4%)
30.5 Watt (4%)
Clock Speed - GPU Clock Witcher 3 ultra
472 MHz (19%)
Average Benchmarks AMD Radeon R7 (Bristol Ridge) → 100% n=21 Average Benchmarks Intel HD Graphics (Bay Trail) → 25% n=21 Average Benchmarks Intel HD Graphics (Haswell) → 58% n=21
- Range of benchmark values for this graphics card
- Average benchmark values for this graphics card
* Smaller numbers mean a higher performance
1 This benchmark is not used for the average calculation
Game Benchmarks The following benchmarks stem from our benchmarks of review laptops. The performance depends on the used graphics memory, clock rate, processor, system settings, drivers, and operating systems. So the results don't have to be representative for all laptops with this GPU. For detailed information on the benchmark results, click on the fps number.
HD Graphics (Haswell):
0 (!) [X] MSI CX61 2QC 2970M MS-16GD Intel Celeron 2970M 2.2GHz
HD Graphics (Haswell)
fps
HD Graphics (Haswell):
4.9 (!) [X] MSI CX61 2QC 2970M MS-16GD Intel Celeron 2970M 2.2GHz
HD Graphics (Haswell)
min:
1 fps, max:
7 fps
fps
HD Graphics (Haswell):
14.3 [X] MSI CX61 2QC 2970M MS-16GD Intel Celeron 2970M 2.2GHz
HD Graphics (Haswell)
fps
HD Graphics (Haswell):
8 [X] MSI CX61 2QC 2970M MS-16GD Intel Celeron 2970M 2.2GHz
HD Graphics (Haswell)
fps
100%
Radeon R7 (Bristol Ridge):
13.1 [X] Acer Aspire E15 E5-553G-15FM AMD A12-9700P 2.5GHz
Radeon R7 (Bristol Ridge)
min:
8 fps, max:
16 fps
fps
45%
HD Graphics (Haswell):
5.9 [X] MSI CX61 2QC 2970M MS-16GD Intel Celeron 2970M 2.2GHz
HD Graphics (Haswell)
min:
5 fps, max:
7 fps
fps
HD Graphics (Haswell):
13 [X] MSI CX61 2QC 2970M MS-16GD Intel Celeron 2970M 2.2GHz
HD Graphics (Haswell)
min:
7 fps, max:
13 fps
fps
100%
Radeon R7 (Bristol Ridge):
13.8 [X] Acer Aspire E15 E5-553G-15FM AMD A12-9700P 2.5GHz
Radeon R7 (Bristol Ridge)
min:
10 fps, max:
19 fps
fps
100%
Radeon R7 (Bristol Ridge):
46.2 [X] Acer Aspire E15 E5-553G-15FM AMD A12-9700P 2.5GHz
Radeon R7 (Bristol Ridge)
min:
41 fps
fps
58%
HD Graphics (Bay Trail):
26.7 [X] Intel NUC Kit DN2820FYKH Intel Celeron N2820 2.2GHz
HD Graphics (Bay Trail)
min:
23 fps
fps
134%
HD Graphics (Haswell):
62 [X] MSI CX61 2QC 2970M MS-16GD Intel Celeron 2970M 2.2GHz
HD Graphics (Haswell)
min:
54 fps
fps
HD Graphics (Bay Trail):
23.4 [X] Intel NUC Kit DN2820FYKH Intel Celeron N2820 2.2GHz
HD Graphics (Bay Trail)
min:
21 fps
fps
HD Graphics (Haswell):
28.6 [X] MSI CX61 2QC 2970M MS-16GD Intel Celeron 2970M 2.2GHz
HD Graphics (Haswell)
min:
19 fps
fps
100%
Radeon R7 (Bristol Ridge):
34 [X] Acer Aspire E15 E5-553G-15FM AMD A12-9700P 2.5GHz
Radeon R7 (Bristol Ridge)
min:
30 fps
fps
100%
Radeon R7 (Bristol Ridge):
40.9 [X] Acer Aspire E15 E5-553G-15FM AMD A12-9700P 2.5GHz
Radeon R7 (Bristol Ridge)
min:
37 fps, max:
45 fps
fps
15%
HD Graphics (Bay Trail):
6 [X] Intel NUC Kit DN2820FYKH Intel Celeron N2820 2.2GHz
HD Graphics (Bay Trail)
fps
40%
HD Graphics (Haswell):
16.4 [X] MSI CX61 2QC 2970M MS-16GD Intel Celeron 2970M 2.2GHz
HD Graphics (Haswell)
min:
14 fps, max:
19 fps
fps
100%
Radeon R7 (Bristol Ridge):
57 [X] Acer Aspire E15 E5-553G-15FM AMD A12-9700P 2.5GHz
Radeon R7 (Bristol Ridge)
min:
16 fps, max:
71 fps
fps
22%
HD Graphics (Bay Trail):
12.6 [X] Intel NUC Kit DN2820FYKH Intel Celeron N2820 2.2GHz
HD Graphics (Bay Trail)
min:
7 fps, max:
15 fps
fps
79%
HD Graphics (Haswell):
45.1 [X] MSI CX61 2QC 2970M MS-16GD Intel Celeron 2970M 2.2GHz
HD Graphics (Haswell)
min:
37 fps, max:
54 fps
fps
100%
Radeon R7 (Bristol Ridge):
33.2 [X] Acer Aspire E15 E5-553G-15FM AMD A12-9700P 2.5GHz
Radeon R7 (Bristol Ridge)
min:
15 fps, max:
45 fps
fps
48%
HD Graphics (Haswell):
15.9 [X] MSI CX61 2QC 2970M MS-16GD Intel Celeron 2970M 2.2GHz
HD Graphics (Haswell)
min:
13 fps, max:
19 fps
fps
100%
Radeon R7 (Bristol Ridge):
18.1 [X] Acer Aspire E15 E5-553G-15FM AMD A12-9700P 2.5GHz
Radeon R7 (Bristol Ridge)
min:
8 fps, max:
25 fps
fps
HD Graphics (Haswell):
0 (!) [X] MSI CX61 2QC 2970M MS-16GD Intel Celeron 2970M 2.2GHz
HD Graphics (Haswell)
fps
100%
Radeon R7 (Bristol Ridge):
11.9 fps
100%
Radeon R7 (Bristol Ridge):
5.3 fps
100%
Radeon R7 (Bristol Ridge):
20.6 fps
100%
Radeon R7 (Bristol Ridge):
7.1 fps
100%
Radeon R7 (Bristol Ridge):
31.9 36.7 [X] Acer Aspire E15 E5-553G-15FM AMD A12-9700P 2.5GHz
Radeon R7 (Bristol Ridge)
min:
31 fps, max:
42 fps
~ 34 fps
52%
HD Graphics (Haswell):
17.8 [X] MSI CX61 2QC 2970M MS-16GD Intel Celeron 2970M 2.2GHz
HD Graphics (Haswell)
min:
15 fps, max:
21 fps
fps
100%
Radeon R7 (Bristol Ridge):
12.2 fps
100%
Radeon R7 (Bristol Ridge):
11 fps
100%
Radeon R7 (Bristol Ridge):
8.8 fps
100%
Radeon R7 (Bristol Ridge):
34 fps
100%
Radeon R7 (Bristol Ridge):
30.3 fps
100%
Radeon R7 (Bristol Ridge):
10.5 fps
100%
Radeon R7 (Bristol Ridge):
63.2 fps
61%
HD Graphics (Haswell):
38.6 [X] MSI CX61 2QC 2970M MS-16GD Intel Celeron 2970M 2.2GHz
HD Graphics (Haswell)
min:
35 fps, max:
52 fps
fps
100%
Radeon R7 (Bristol Ridge):
47.5 fps
45%
HD Graphics (Haswell):
21.6 [X] MSI CX61 2QC 2970M MS-16GD Intel Celeron 2970M 2.2GHz
HD Graphics (Haswell)
min:
19 fps, max:
28 fps
fps
100%
Radeon R7 (Bristol Ridge):
22 fps
29%
HD Graphics (Haswell):
6.3 [X] MSI CX61 2QC 2970M MS-16GD Intel Celeron 2970M 2.2GHz
HD Graphics (Haswell)
min:
5 fps, max:
8 fps
fps
100%
Radeon R7 (Bristol Ridge):
23.3 fps
61%
HD Graphics (Haswell):
14.1 [X] MSI CX61 2QC 2970M MS-16GD Intel Celeron 2970M 2.2GHz
HD Graphics (Haswell)
min:
12 fps, max:
15 fps
fps
100%
Radeon R7 (Bristol Ridge):
16.7 fps
100%
Radeon R7 (Bristol Ridge):
8.3 fps
100%
Radeon R7 (Bristol Ridge):
30.5 fps
100%
Radeon R7 (Bristol Ridge):
14.6 fps
100%
Radeon R7 (Bristol Ridge):
7.6 fps
100%
Radeon R7 (Bristol Ridge):
10 15.5 ~ 13 fps
100%
Radeon R7 (Bristol Ridge):
7 11.6 ~ 9 fps
100%
Radeon R7 (Bristol Ridge):
6.4 fps
100%
Radeon R7 (Bristol Ridge):
16.9 fps
73%
HD Graphics (Haswell):
12.4 [X] MSI CX61 2QC 2970M MS-16GD Intel Celeron 2970M 2.2GHz
HD Graphics (Haswell)
min:
11 fps, max:
14 fps
fps
100%
Radeon R7 (Bristol Ridge):
11.7 fps
61%
HD Graphics (Haswell):
7.1 [X] MSI CX61 2QC 2970M MS-16GD Intel Celeron 2970M 2.2GHz
HD Graphics (Haswell)
min:
6 fps, max:
8 fps
fps
HD Graphics (Haswell):
26.1 [X] MSI CX61 2QC 2970M MS-16GD Intel Celeron 2970M 2.2GHz
HD Graphics (Haswell)
min:
19 fps, max:
33 fps
fps
HD Graphics (Haswell):
16.3 [X] MSI CX61 2QC 2970M MS-16GD Intel Celeron 2970M 2.2GHz
HD Graphics (Haswell)
min:
12 fps, max:
21 fps
fps
HD Graphics (Haswell):
0 (!) [X] MSI CX61 2QC 2970M MS-16GD Intel Celeron 2970M 2.2GHz
HD Graphics (Haswell)
fps
100%
Radeon R7 (Bristol Ridge):
8 fps
HD Graphics (Haswell):
6 [X] MSI CX61 2QC 2970M MS-16GD Intel Celeron 2970M 2.2GHz
HD Graphics (Haswell)
min:
3 fps, max:
9 fps
fps
100%
Radeon R7 (Bristol Ridge):
17.4 fps
49%
HD Graphics (Haswell):
8.5 [X] MSI CX61 2QC 2970M MS-16GD Intel Celeron 2970M 2.2GHz
HD Graphics (Haswell)
min:
6 fps, max:
11 fps
fps
100%
Radeon R7 (Bristol Ridge):
10.6 fps
100%
Radeon R7 (Bristol Ridge):
15 fps
60%
HD Graphics (Haswell):
9 [X] MSI CX61 2QC 2970M MS-16GD Intel Celeron 2970M 2.2GHz
HD Graphics (Haswell)
min:
8 fps, max:
11 fps
fps
100%
Radeon R7 (Bristol Ridge):
9 fps
100%
Radeon R7 (Bristol Ridge):
8 fps
100%
Radeon R7 (Bristol Ridge):
18.4 fps
100%
Radeon R7 (Bristol Ridge):
6.9 fps
100%
Radeon R7 (Bristol Ridge):
4.9 fps
45%
HD Graphics (Haswell):
9.4 [X] MSI CX61 2QC 2970M MS-16GD Intel Celeron 2970M 2.2GHz
HD Graphics (Haswell)
min:
8 fps, max:
11 fps
fps
41%
HD Graphics (Haswell):
5.3 [X] MSI CX61 2QC 2970M MS-16GD Intel Celeron 2970M 2.2GHz
HD Graphics (Haswell)
fps
100%
Radeon R7 (Bristol Ridge):
6.2 7 7.1 ~ 7 fps
36%
HD Graphics (Haswell):
2.5 [X] MSI CX61 2QC 2970M MS-16GD Intel Celeron 2970M 2.2GHz
HD Graphics (Haswell)
fps
HD Graphics (Haswell):
1.8 [X] MSI CX61 2QC 2970M MS-16GD Intel Celeron 2970M 2.2GHz
HD Graphics (Haswell)
fps
100%
Radeon R7 (Bristol Ridge):
47.1 fps
29%
HD Graphics (Haswell):
13.7 [X] MSI CX61 2QC 2970M MS-16GD Intel Celeron 2970M 2.2GHz
HD Graphics (Haswell)
min:
5 fps, max:
75 fps
fps
100%
Radeon R7 (Bristol Ridge):
20.8 fps
43%
HD Graphics (Haswell):
8.9 [X] MSI CX61 2QC 2970M MS-16GD Intel Celeron 2970M 2.2GHz
HD Graphics (Haswell)
min:
4 fps, max:
65 fps
fps
100%
Radeon R7 (Bristol Ridge):
14.7 fps
100%
Radeon R7 (Bristol Ridge):
16 fps
73%
HD Graphics (Haswell):
11.7 [X] MSI CX61 2QC 2970M MS-16GD Intel Celeron 2970M 2.2GHz
HD Graphics (Haswell)
min:
10 fps, max:
14 fps
fps
100%
Radeon R7 (Bristol Ridge):
13.2 fps
100%
Radeon R7 (Bristol Ridge):
22.9 fps
0%
HD Graphics (Haswell):
0 (!) [X] MSI CX61 2QC 2970M MS-16GD Intel Celeron 2970M 2.2GHz
HD Graphics (Haswell)
fps
100%
Radeon R7 (Bristol Ridge):
21.2 fps
100%
Radeon R7 (Bristol Ridge):
10.5 fps
HD Graphics (Bay Trail):
0 (!) [X] Intel NUC Kit DN2820FYKH Intel Celeron N2820 2.2GHz
HD Graphics (Bay Trail)
fps
100%
Radeon R7 (Bristol Ridge):
26.1 fps
100%
Radeon R7 (Bristol Ridge):
14.4 fps
100%
Radeon R7 (Bristol Ridge):
6.7 fps
100%
Radeon R7 (Bristol Ridge):
47.1 fps
26%
HD Graphics (Bay Trail):
12.1 [X] Intel NUC Kit DN2820FYKH Intel Celeron N2820 2.2GHz
HD Graphics (Bay Trail)
min:
5 fps, max:
18 fps
fps
88%
HD Graphics (Haswell):
41.4 [X] MSI CX61 2QC 2970M MS-16GD Intel Celeron 2970M 2.2GHz
HD Graphics (Haswell)
min:
21 fps, max:
51 fps
fps
100%
Radeon R7 (Bristol Ridge):
35.4 fps
68%
HD Graphics (Haswell):
24.1 [X] MSI CX61 2QC 2970M MS-16GD Intel Celeron 2970M 2.2GHz
HD Graphics (Haswell)
min:
11 fps, max:
35 fps
fps
100%
Radeon R7 (Bristol Ridge):
20.9 fps
55%
HD Graphics (Haswell):
11.4 [X] MSI CX61 2QC 2970M MS-16GD Intel Celeron 2970M 2.2GHz
HD Graphics (Haswell)
min:
5 fps, max:
18 fps
fps
100%
Radeon R7 (Bristol Ridge):
45.5 fps
24%
HD Graphics (Bay Trail):
10.8 [X] Intel NUC Kit DN2820FYKH Intel Celeron N2820 2.2GHz
HD Graphics (Bay Trail)
min:
10 fps, max:
12 fps
fps
100%
Radeon R7 (Bristol Ridge):
36.4 fps
100%
Radeon R7 (Bristol Ridge):
14.3 fps
100%
Radeon R7 (Bristol Ridge):
47.9 [X] Acer Aspire E15 E5-553G-15FM AMD A12-9700P 2.5GHz
Radeon R7 (Bristol Ridge)
min:
38 fps
fps
52%
HD Graphics (Bay Trail):
24.7 [X] Intel NUC Kit DN2820FYKH Intel Celeron N2820 2.2GHz
HD Graphics (Bay Trail)
min:
22.2 fps
fps
HD Graphics (Bay Trail):
9.7 [X] Intel NUC Kit DN2820FYKH Intel Celeron N2820 2.2GHz
HD Graphics (Bay Trail)
min:
8.8 fps
fps
100%
Radeon R7 (Bristol Ridge):
16 [X] Acer Aspire E15 E5-553G-15FM AMD A12-9700P 2.5GHz
Radeon R7 (Bristol Ridge)
min:
14 fps
fps
34%
HD Graphics (Bay Trail):
5.5 [X] Intel NUC Kit DN2820FYKH Intel Celeron N2820 2.2GHz
HD Graphics (Bay Trail)
min:
-1.4 fps
fps
100%
Radeon R7 (Bristol Ridge):
13.9 [X] Acer Aspire E15 E5-553G-15FM AMD A12-9700P 2.5GHz
Radeon R7 (Bristol Ridge)
min:
11 fps
fps
39%
HD Graphics (Bay Trail):
5.4 [X] Intel NUC Kit DN2820FYKH Intel Celeron N2820 2.2GHz
HD Graphics (Bay Trail)
min:
-3 fps
fps
100%
Radeon R7 (Bristol Ridge):
9 12 ~ 11 fps
100%
Radeon R7 (Bristol Ridge):
3 11 ~ 7 fps
100%
Radeon R7 (Bristol Ridge):
11.9 14 ~ 13 fps
68%
HD Graphics (Haswell):
8.9 [X] MSI CX61 2QC 2970M MS-16GD Intel Celeron 2970M 2.2GHz
HD Graphics (Haswell)
min:
5 fps, max:
12 fps
fps
100%
Radeon R7 (Bristol Ridge):
7.6 9.2 ~ 8 fps
75%
HD Graphics (Haswell):
5.2 [X] MSI CX61 2QC 2970M MS-16GD Intel Celeron 2970M 2.2GHz
HD Graphics (Haswell)
min:
3 fps, max:
8 fps
5.8 ~ 6 fps
HD Graphics (Haswell):
3.1 fps
100%
Radeon R7 (Bristol Ridge):
79 fps
29%
HD Graphics (Bay Trail):
22 [X] Intel NUC Kit DN2820FYKH Intel Celeron N2820 2.2GHz
HD Graphics (Bay Trail)
min:
16 fps, max:
33 fps
24.2 ~ 23 fps
66%
HD Graphics (Haswell):
52.4 fps
100%
Radeon R7 (Bristol Ridge):
27.3 fps
22%
HD Graphics (Bay Trail):
0 (!) [X] Intel NUC Kit DN2820FYKH Intel Celeron N2820 2.2GHz
HD Graphics (Bay Trail)
12.5 ~ 6 fps
47%
HD Graphics (Haswell):
12.8 fps
100%
Radeon R7 (Bristol Ridge):
15.2 fps
100%
Radeon R7 (Bristol Ridge):
41.5 fps
100%
Radeon R7 (Bristol Ridge):
38.1 fps
100%
Radeon R7 (Bristol Ridge):
10 fps
100%
Radeon R7 (Bristol Ridge):
37.7 fps
19%
HD Graphics (Bay Trail):
7.3 fps
42%
HD Graphics (Haswell):
15.9 fps
100%
Radeon R7 (Bristol Ridge):
32.1 fps
16%
HD Graphics (Bay Trail):
5.1 fps
35%
HD Graphics (Haswell):
11.2 fps
100%
Radeon R7 (Bristol Ridge):
12.9 fps
HD Graphics (Bay Trail):
3.2 fps
HD Graphics (Haswell):
7.7 fps
HD Graphics (Bay Trail):
1.7 fps
HD Graphics (Haswell):
5.7 fps
HD Graphics (Bay Trail):
8.1 fps
HD Graphics (Haswell):
9.7 fps
HD Graphics (Bay Trail):
4.7 fps
HD Graphics (Haswell):
8.4 fps
100%
Radeon R7 (Bristol Ridge):
29.9 fps
23%
HD Graphics (Bay Trail):
7 fps
36%
HD Graphics (Haswell):
10.9 fps
100%
Radeon R7 (Bristol Ridge):
27.3 fps
17%
HD Graphics (Bay Trail):
4.6 fps
26%
HD Graphics (Haswell):
7 fps
100%
Radeon R7 (Bristol Ridge):
16.7 fps
HD Graphics (Bay Trail):
5.6 fps
HD Graphics (Bay Trail):
3.8 fps
HD Graphics (Bay Trail):
4.3 fps
HD Graphics (Bay Trail):
2.4 fps
100%
Radeon R7 (Bristol Ridge):
16 fps
HD Graphics (Bay Trail):
9.6 11.5 ~ 11 fps
HD Graphics (Bay Trail):
4.3 fps
100%
Radeon R7 (Bristol Ridge):
62 fps
21%
HD Graphics (Bay Trail):
12 14 ~ 13 fps
50%
HD Graphics (Haswell):
31 fps
100%
Radeon R7 (Bristol Ridge):
41 fps
29%
HD Graphics (Bay Trail):
12 fps
49%
HD Graphics (Haswell):
20 fps
100%
Radeon R7 (Bristol Ridge):
31 fps
HD Graphics (Bay Trail):
5.2 fps
HD Graphics (Bay Trail):
3.6 fps
HD Graphics (Bay Trail):
3.7 fps
HD Graphics (Haswell):
9 fps
HD Graphics (Bay Trail):
2.5 fps
HD Graphics (Haswell):
5.8 fps
100%
Radeon R7 (Bristol Ridge):
32 fps
28%
HD Graphics (Bay Trail):
9.1 fps
68%
HD Graphics (Haswell):
21.6 fps
100%
Radeon R7 (Bristol Ridge):
20 fps
26%
HD Graphics (Bay Trail):
5.1 fps
65%
HD Graphics (Haswell):
12.9 fps
100%
Radeon R7 (Bristol Ridge):
21.7 fps
39%
HD Graphics (Bay Trail):
8.5 fps
62%
HD Graphics (Haswell):
13.5 fps
100%
Radeon R7 (Bristol Ridge):
14.7 fps
41%
HD Graphics (Bay Trail):
6.1 fps
56%
HD Graphics (Haswell):
8.3 fps
HD Graphics (Bay Trail):
12.4 fps
HD Graphics (Haswell):
16.4 fps
HD Graphics (Bay Trail):
8.5 fps
HD Graphics (Haswell):
11.3 fps
100%
Radeon R7 (Bristol Ridge):
122.3 fps
45%
HD Graphics (Bay Trail):
53.7 56 ~ 55 fps
101%
HD Graphics (Haswell):
123.6 fps
100%
Radeon R7 (Bristol Ridge):
44.8 fps
16%
HD Graphics (Bay Trail):
6.6 7 ~ 7 fps
58%
HD Graphics (Haswell):
26.2 fps
100%
Radeon R7 (Bristol Ridge):
23.2 fps
HD Graphics (Bay Trail):
8.4 fps
HD Graphics (Haswell):
13.3 fps
HD Graphics (Bay Trail):
5.9 fps
HD Graphics (Haswell):
9.7 fps
100%
Radeon R7 (Bristol Ridge):
91.3 fps
41%
HD Graphics (Bay Trail):
31.6 41.8 ~ 37 fps
64%
HD Graphics (Haswell):
58.2 fps
100%
Radeon R7 (Bristol Ridge):
40.6 fps
32%
HD Graphics (Bay Trail):
12.5 12.5 ~ 13 fps
48%
HD Graphics (Haswell):
19.6 fps
100%
Radeon R7 (Bristol Ridge):
21.6 fps
HD Graphics (Bay Trail):
8.3 fps
HD Graphics (Haswell):
2.2 fps
HD Graphics (Bay Trail):
4.6 fps
HD Graphics (Bay Trail):
11.1 fps
HD Graphics (Haswell):
19.9 fps
HD Graphics (Bay Trail):
9.6 fps
HD Graphics (Haswell):
14 fps
HD Graphics (Bay Trail):
25.2 fps
HD Graphics (Haswell):
35.2 fps
HD Graphics (Bay Trail):
9.2 fps
HD Graphics (Haswell):
13.6 fps
HD Graphics (Haswell):
9 fps
HD Graphics (Haswell):
23.1 fps
HD Graphics (Haswell):
13.7 fps
100%
Radeon R7 (Bristol Ridge):
13 15.3 ~ 14 fps
29%
HD Graphics (Bay Trail):
3.1 [X] Medion Akoya S6213T MD98716 Intel Pentium N3530 2.2GHz
HD Graphics (Bay Trail)
5.1 ~ 4 fps
72%
HD Graphics (Haswell):
10.1 fps
100%
Radeon R7 (Bristol Ridge):
10 12.6 ~ 11 fps
30%
HD Graphics (Bay Trail):
3.3 fps
52%
HD Graphics (Haswell):
5.7 fps
100%
Radeon R7 (Bristol Ridge):
8 12.3 ~ 10 fps
HD Graphics (Bay Trail):
8.7 fps
HD Graphics (Bay Trail):
5.8 fps
HD Graphics (Bay Trail):
12.8 fps
HD Graphics (Haswell):
22.1 fps
HD Graphics (Bay Trail):
6 fps
HD Graphics (Haswell):
13 fps
HD Graphics (Haswell):
11.1 fps
21%
HD Graphics (Bay Trail):
7.3 fps
59%
HD Graphics (Haswell):
12.8 27.8 [X] MSI CX61 2QC 2970M MS-16GD Intel Celeron 2970M 2.2GHz
HD Graphics (Haswell)
~ 20 fps
61%
HD Graphics (Haswell):
10 18.2 [X] MSI CX61 2QC 2970M MS-16GD Intel Celeron 2970M 2.2GHz
HD Graphics (Haswell)
~ 14 fps
79%
HD Graphics (Haswell):
11.8 [X] MSI CX61 2QC 2970M MS-16GD Intel Celeron 2970M 2.2GHz
HD Graphics (Haswell)
fps
100%
Radeon R7 (Bristol Ridge):
5.1 5.6 7.7 ~ 6 fps
65%
HD Graphics (Haswell):
3.9 [X] MSI CX61 2QC 2970M MS-16GD Intel Celeron 2970M 2.2GHz
HD Graphics (Haswell)
fps
100%
Radeon R7 (Bristol Ridge):
48 fps
29%
HD Graphics (Bay Trail):
14 fps
44%
HD Graphics (Haswell):
21 fps
100%
Radeon R7 (Bristol Ridge):
29 fps
28%
HD Graphics (Bay Trail):
8 fps
41%
HD Graphics (Haswell):
12 fps
100%
Radeon R7 (Bristol Ridge):
15 fps
HD Graphics (Bay Trail):
12 fps
HD Graphics (Haswell):
27 fps
HD Graphics (Haswell):
18 fps
HD Graphics (Haswell):
14 fps
HD Graphics (Bay Trail):
12.6 18.7 19.9 29.8 33.6 60 [X] Medion Akoya P2211T MD98602 Intel Celeron N2910 1.6GHz
HD Graphics (Bay Trail)
~ 29 fps
HD Graphics (Bay Trail):
10.5 19.5 33 [X] Medion Akoya P2211T MD98602 Intel Celeron N2910 1.6GHz
HD Graphics (Bay Trail)
~ 21 fps
HD Graphics (Haswell):
57.7 fps
HD Graphics (Bay Trail):
7.8 12.8 22 [X] Medion Akoya P2211T MD98602 Intel Celeron N2910 1.6GHz
HD Graphics (Bay Trail)
~ 14 fps
HD Graphics (Haswell):
37 fps
HD Graphics (Bay Trail):
7.7 fps
HD Graphics (Haswell):
22.4 fps
HD Graphics (Haswell):
16.9 fps
HD Graphics (Bay Trail):
6.3 fps
HD Graphics (Haswell):
14 fps
HD Graphics (Haswell):
7.8 fps
HD Graphics (Bay Trail):
10.2 fps
HD Graphics (Haswell):
15.9 fps
HD Graphics (Bay Trail):
6.1 fps
HD Graphics (Haswell):
8.9 fps
HD Graphics (Bay Trail):
11 fps
HD Graphics (Haswell):
14.2 fps
HD Graphics (Bay Trail):
7.8 fps
HD Graphics (Haswell):
11.5 fps
HD Graphics (Bay Trail):
18.2 [X] Medion Akoya P2211T MD98602 Intel Celeron N2910 1.6GHz
HD Graphics (Bay Trail)
20.8 28.4 31.9 [X] Asus Transformer Book T200TA PL Intel Atom Z3775 1.5GHz
HD Graphics (Bay Trail)
~ 25 fps
HD Graphics (Haswell):
36.9 fps
HD Graphics (Bay Trail):
9.5 [X] Medion Akoya P2211T MD98602 Intel Celeron N2910 1.6GHz
HD Graphics (Bay Trail)
10.4 13.7 19.4 [X] Asus Transformer Book T200TA PL Intel Atom Z3775 1.5GHz
HD Graphics (Bay Trail)
~ 13 fps
HD Graphics (Haswell):
24.2 fps
100%
Radeon R7 (Bristol Ridge):
11 fps
40%
HD Graphics (Bay Trail):
4.4 [X] Medion Akoya E6239T Intel Pentium N3510 2GHz
HD Graphics (Bay Trail)
fps
65%
HD Graphics (Haswell):
7.2 fps
100%
Radeon R7 (Bristol Ridge):
11 fps
100%
Radeon R7 (Bristol Ridge):
6 fps
HD Graphics (Bay Trail):
14.1 16.2 17.9 20.4 [X] Medion Akoya E6239T Intel Pentium N3510 2GHz
HD Graphics (Bay Trail)
23.2 ~ 18 fps
HD Graphics (Haswell):
38 38.5 ~ 38 fps
HD Graphics (Bay Trail):
12.5 12.6 [X] Medion Akoya E6239T Intel Pentium N3510 2GHz
HD Graphics (Bay Trail)
~ 13 fps
HD Graphics (Haswell):
18.6 19.6 ~ 19 fps
HD Graphics (Haswell):
13.2 fps
100%
Radeon R7 (Bristol Ridge):
16 fps
31%
HD Graphics (Bay Trail):
5 fps
70%
HD Graphics (Haswell):
11.2 fps
100%
Radeon R7 (Bristol Ridge):
12 fps
55%
HD Graphics (Haswell):
23 32.8 [X] MSI CX61 2QC 2970M MS-16GD Intel Celeron 2970M 2.2GHz
HD Graphics (Haswell)
~ 28 fps
40%
HD Graphics (Haswell):
10.3 14.2 [X] MSI CX61 2QC 2970M MS-16GD Intel Celeron 2970M 2.2GHz
HD Graphics (Haswell)
~ 12 fps
46%
HD Graphics (Haswell):
11.9 [X] MSI CX61 2QC 2970M MS-16GD Intel Celeron 2970M 2.2GHz
HD Graphics (Haswell)
fps
13%
HD Graphics (Bay Trail):
1.2 fps
41%
HD Graphics (Haswell):
3.7 [X] MSI CX61 2QC 2970M MS-16GD Intel Celeron 2970M 2.2GHz
HD Graphics (Haswell)
fps
HD Graphics (Bay Trail):
39 56.2 69 [X] Baytrail Reference Tablet Intel Atom Z3770 1.5GHz
HD Graphics (Bay Trail)
~ 55 fps
HD Graphics (Haswell):
96.5 fps
HD Graphics (Bay Trail):
12.3 12.8 14 [X] Baytrail Reference Tablet Intel Atom Z3770 1.5GHz
HD Graphics (Bay Trail)
min:
8 fps
~ 13 fps
HD Graphics (Haswell):
28.3 fps
HD Graphics (Haswell):
15 fps
HD Graphics (Haswell):
59.6 fps
HD Graphics (Haswell):
11.2 fps
100%
Radeon R7 (Bristol Ridge):
54.9 74.1 ~ 65 fps
100%
Radeon R7 (Bristol Ridge):
29.8 36.9 ~ 33 fps
100%
Radeon R7 (Bristol Ridge):
20.9 28.1 ~ 25 fps
100%
Radeon R7 (Bristol Ridge):
10.7 12.7 ~ 12 fps
3%
HD Graphics (Bay Trail):
0.3 fps
HD Graphics (Haswell):
12.2 fps
HD Graphics (Haswell):
7.6 fps
HD Graphics (Bay Trail):
15.1 23.6 ~ 19 fps
HD Graphics (Haswell):
38.7 fps
HD Graphics (Bay Trail):
5.2 9.7 ~ 7 fps
HD Graphics (Haswell):
17.7 fps
HD Graphics (Haswell):
13.1 fps
HD Graphics (Bay Trail):
10.3 fps
HD Graphics (Haswell):
18.7 fps
HD Graphics (Bay Trail):
6.2 fps
HD Graphics (Haswell):
11.4 fps
HD Graphics (Bay Trail):
10.1 fps
HD Graphics (Haswell):
12.3 fps
HD Graphics (Bay Trail):
6 fps
HD Graphics (Haswell):
9.9 fps
HD Graphics (Bay Trail):
12.4 fps
HD Graphics (Haswell):
25.6 fps
HD Graphics (Bay Trail):
7.3 fps
HD Graphics (Haswell):
17.6 fps
HD Graphics (Bay Trail):
12.5 14.3 ~ 13 fps
HD Graphics (Haswell):
22.3 fps
HD Graphics (Bay Trail):
9.8 11.2 ~ 11 fps
HD Graphics (Haswell):
16.8 fps
HD Graphics (Bay Trail):
42 fps
HD Graphics (Bay Trail):
26.1 [X] Intel NUC Kit DN2820FYKH Intel Celeron N2820 2.2GHz
HD Graphics (Bay Trail)
min:
16 fps, max:
38 fps
46.6 ~ 36 fps
HD Graphics (Haswell):
46.2 fps
HD Graphics (Bay Trail):
20 [X] Intel NUC Kit DN2820FYKH Intel Celeron N2820 2.2GHz
HD Graphics (Bay Trail)
min:
13 fps, max:
29 fps
23.9 ~ 22 fps
HD Graphics (Haswell):
34.7 fps
HD Graphics (Haswell):
22.5 fps
HD Graphics (Bay Trail):
12.9 13.2 ~ 13 fps
HD Graphics (Bay Trail):
7.5 8.1 ~ 8 fps
HD Graphics (Bay Trail):
28 fps
HD Graphics (Haswell):
31 fps
HD Graphics (Haswell):
18.8 fps
HD Graphics (Haswell):
11.7 fps
100%
Radeon R7 (Bristol Ridge):
70 fps
21%
HD Graphics (Bay Trail):
9.2 10.7 14.8 15.6 16.5 [X] Medion Akoya P2214T MD 99430 Intel Celeron N2940 1.8GHz
HD Graphics (Bay Trail)
18.4 19.3 [X] Intel NUC Kit DN2820FYKH Intel Celeron N2820 2.2GHz
HD Graphics (Bay Trail)
min:
14 fps, max:
23 fps
~ 15 fps
53%
HD Graphics (Haswell):
36.9 fps
100%
Radeon R7 (Bristol Ridge):
54.6 fps
18%
HD Graphics (Bay Trail):
6 9.5 [X] Medion Akoya P2214T MD 99430 Intel Celeron N2940 1.8GHz
HD Graphics (Bay Trail)
10.3 11.4 12 ~ 10 fps
42%
HD Graphics (Haswell):
23 fps
100%
Radeon R7 (Bristol Ridge):
45.5 fps
20%
HD Graphics (Bay Trail):
7.9 [X] Medion Akoya P2214T MD 99430 Intel Celeron N2940 1.8GHz
HD Graphics (Bay Trail)
9.6 ~ 9 fps
43%
HD Graphics (Haswell):
19.5 fps
100%
Radeon R7 (Bristol Ridge):
41.3 fps
12%
HD Graphics (Bay Trail):
5 [X] Medion Akoya P2214T MD 99430 Intel Celeron N2940 1.8GHz
HD Graphics (Bay Trail)
5.9 ~ 5 fps
HD Graphics (Haswell):
12.5 fps
HD Graphics (Bay Trail):
8.5 12.4 ~ 10 fps
HD Graphics (Bay Trail):
8.1 fps
HD Graphics (Bay Trail):
5.8 fps
HD Graphics (Bay Trail):
2.3 fps
HD Graphics (Haswell):
36 fps
HD Graphics (Haswell):
16 fps
HD Graphics (Haswell):
9.8 fps
HD Graphics (Bay Trail):
1.1 fps
100%
Radeon R7 (Bristol Ridge):
28 fps
39%
HD Graphics (Bay Trail):
11 11.8 ~ 11 fps
79%
HD Graphics (Haswell):
21.7 22.2 ~ 22 fps
100%
Radeon R7 (Bristol Ridge):
19 fps
53%
HD Graphics (Bay Trail):
10 fps
58%
HD Graphics (Haswell):
11.2 11.3 ~ 11 fps
100%
Radeon R7 (Bristol Ridge):
13 fps
52%
HD Graphics (Haswell):
6.8 fps
HD Graphics (Bay Trail):
8 fps
HD Graphics (Bay Trail):
4.8 fps
100%
Radeon R7 (Bristol Ridge):
36 fps
100%
Radeon R7 (Bristol Ridge):
29 fps
100%
Radeon R7 (Bristol Ridge):
15 fps
HD Graphics (Bay Trail):
19.7 fps
HD Graphics (Haswell):
36.8 fps
HD Graphics (Haswell):
16.7 fps
HD Graphics (Bay Trail):
24.1 36.9 ~ 31 fps
HD Graphics (Haswell):
51.9 fps
HD Graphics (Bay Trail):
12.9 13.3 ~ 13 fps
HD Graphics (Haswell):
27.4 fps
HD Graphics (Haswell):
14.8 fps
HD Graphics (Haswell):
49.2 fps
HD Graphics (Bay Trail):
9.3 fps
HD Graphics (Bay Trail):
5 10.5 [X] Asus Transformer Book T200TA PL Intel Atom Z3775 1.5GHz
HD Graphics (Bay Trail)
~ 8 fps
HD Graphics (Bay Trail):
5.6 [X] Asus Transformer Book T200TA PL Intel Atom Z3775 1.5GHz
HD Graphics (Bay Trail)
fps
HD Graphics (Bay Trail):
3.7 [X] Asus Transformer Book T200TA PL Intel Atom Z3775 1.5GHz
HD Graphics (Bay Trail)
fps
HD Graphics (Bay Trail):
6 9 9 ~ 8 fps
HD Graphics (Bay Trail):
3 fps
HD Graphics (Bay Trail):
12 [X] Asus Transformer Book T200TA PL Intel Atom Z3775 1.5GHz
HD Graphics (Bay Trail)
fps
HD Graphics (Bay Trail):
9 [X] Asus Transformer Book T200TA PL Intel Atom Z3775 1.5GHz
HD Graphics (Bay Trail)
fps
HD Graphics (Bay Trail):
12.8 fps
HD Graphics (Haswell):
28 fps
HD Graphics (Bay Trail):
9 fps
HD Graphics (Haswell):
21.2 fps
HD Graphics (Haswell):
42.6 fps
HD Graphics (Haswell):
17.8 fps
HD Graphics (Haswell):
113 fps
HD Graphics (Bay Trail):
10.3 14 [X] Medion Akoya E1232T-MD99410 Intel Celeron N2807 1.6GHz
HD Graphics (Bay Trail)
17.7 18 18.1 18.1 18.7 18.8 [X] Captiva PAD 10.1 Windows Intel Atom Z3735D 1.3GHz
HD Graphics (Bay Trail)
19.3 19.4 19.4 19.8 19.8 20.5 20.5 [X] cmx WinTek 101-1016 Intel Atom Z3735F 1.3GHz
HD Graphics (Bay Trail)
20.6 21 [X] ODYS Winpad V10 Intel Atom Z3735F 1.3GHz
HD Graphics (Bay Trail)
21.5 23.6 ~ 19 fps
HD Graphics (Haswell):
45.1 fps
HD Graphics (Bay Trail):
6.4 [X] Captiva PAD 10.1 Windows Intel Atom Z3735D 1.3GHz
HD Graphics (Bay Trail)
7.7 ~ 7 fps
HD Graphics (Bay Trail):
18.9 19 ~ 19 fps
HD Graphics (Bay Trail):
7.6 8.7 ~ 8 fps
HD Graphics (Bay Trail):
33 33 35 38 [X] MSI S100 Intel Atom Z3740D 1.3GHz
HD Graphics (Bay Trail)
44 46.2 47 48 49 49 [X] Intel NUC Kit DN2820FYKH Intel Celeron N2820 2.2GHz
HD Graphics (Bay Trail)
min:
39 fps, max:
59 fps
50 [X] Baytrail Reference Tablet Intel Atom Z3770 1.5GHz
HD Graphics (Bay Trail)
min:
36 fps
52 ~ 44 fps
HD Graphics (Haswell):
93.7 fps
HD Graphics (Bay Trail):
9.6 [X] Intel NUC Kit DN2820FYKH Intel Celeron N2820 2.2GHz
HD Graphics (Bay Trail)
min:
3 fps, max:
13 fps
11.5 [X] Baytrail Reference Tablet Intel Atom Z3770 1.5GHz
HD Graphics (Bay Trail)
min:
8 fps
20 22 23 25.3 26 26 28 [X] MSI S100 Intel Atom Z3740D 1.3GHz
HD Graphics (Bay Trail)
34 ~ 23 fps
HD Graphics (Haswell):
39.2 fps
HD Graphics (Bay Trail):
12 12 13.5 ~ 13 fps
HD Graphics (Bay Trail):
5.6 7 ~ 6 fps
HD Graphics (Bay Trail):
190 [X] Baytrail Reference Tablet Intel Atom Z3770 1.5GHz
HD Graphics (Bay Trail)
fps
Average Gaming AMD Radeon R7 (Bristol Ridge) → 100% Average Gaming 30-70 fps → 100%
Average Gaming Intel HD Graphics (Bay Trail) → 27% Average Gaming 30-70 fps → 43%
Average Gaming Intel HD Graphics (Haswell) → 55% Average Gaming 30-70 fps → 74%
For more games that might be playable and a list of all games and graphics cards visit our Gaming List
v1.26
log 22. 22:04:03
#0 checking url part for id 7442 +0s ... 0s
#1 checking url part for id 4922 +0s ... 0s
#2 checking url part for id 4622 +0s ... 0s
#3 not redirecting to Ajax server +0s ... 0s
#4 did not recreate cache, as it is less than 5 days old! Created at Wed, 22 May 2024 05:38:57 +0200 +0.001s ... 0.001s
#5 composed specs +0.202s ... 0.204s
#6 did output specs +0s ... 0.204s
#7 start showIntegratedCPUs +0s ... 0.204s
#8 getting avg benchmarks for device 7442 +0.073s ... 0.276s
#9 got single benchmarks 7442 +0.023s ... 0.299s
#10 getting avg benchmarks for device 4922 +0.013s ... 0.312s
#11 got single benchmarks 4922 +0.293s ... 0.605s
#12 getting avg benchmarks for device 4622 +0.016s ... 0.621s
#13 got single benchmarks 4622 +0.042s ... 0.664s
#14 got avg benchmarks for devices +0s ... 0.664s
#15 min, max, avg, median took s +0.582s ... 1.246s
#16 before gaming benchmark output +0s ... 1.246s
#17 Got 766 rows for game benchmarks. +0.074s ... 1.32s
#18 composed SQL query for gamebenchmarks +0s ... 1.32s
#19 got data and put it in $dataArray +0.088s ... 1.408s
#20 benchmarks composed for output. +0.264s ... 1.672s
#21 calculated avg scores. +0s ... 1.672s
#22 return log +0.004s ... 1.676s
Please share our article, every link counts!
Redaktion, 2017-09- 8 (Update: 2023-07- 1)
 Deutsch
 English
 Español
 Français
 Italiano
 Nederlands
 Polski
 Português
 Русский
 Türkçe
 Svenska
 Chinese
 Magyar