Notebookcheck Logo

Intel Core i5-7200U vs AMD A10-9620P vs Intel Core i7-7500U

Intel Core i5-7200U

► remove from comparison Intel i5-7200U

The Intel Core i5-7200U is a dual-core processor of the Kaby Lake architecture. It offers two CPU cores clocked at 2.5 - 3.1 GHz and integrates HyperThreading to work with up to 4 threads at once. The architectural differences are rather small compared to the Skylake generation, therefore the performance per MHz is very similar. The SoC includes a dual channel DDR4 memory controller and Intel HD Graphics 620 graphics card (clocked at 300 - 1000 MHz). It is manufactured in an improved 14nm FinFET process at Intel. Compared to the old Skylake based Core i5-6200U, the i5-7200U offers a 300 MHz higher clock speed.

AMD A10-9620P

► remove from comparison AMD A10-9620P

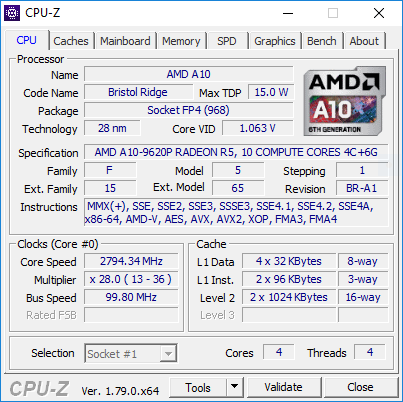
The AMD A10-9620P is a mid-range APU of the Bristol Ridge series (7th generation of APUs) with 4 CPU-cores (two Excavator modules) clocked at 2.5 - 3.4 GHz. In our tests the A10-9620P even hit 3.6 GHz.

It was announced in 2017 and is based on the same silicon as Carrizo but with more and refined features. It is a ULV-chip with a TDP of 15 Watt and integrates a Radeon R5 graphics card (384 shader cores / 6 compute cores) and a dual-channel DDR4-18600 memory controller. As Carrizo its a full featured SoC that offers all I/O ports on the chip.

The A10-9620P is a bit faster than the old 15-Watt top model of Carrizo, the FX-8800P. See our Bristol Ridge article for more information on the architecture and improvements compared to Carrizo.

Intel Core i7-7500U

► remove from comparison Intel i7-7500U

The Intel Core i7-7500U is a dual-core processor of the Kaby Lake architecture. It offers two CPU cores clocked at 2.7 - 3.5 GHz and integrates HyperThreading to work with up to 4 threads at once. The architectural differences are rather small compared to the Skylake generation, therefore the performance per MHz is very similar. The SoC includes a dual channel DDR4 memory controller and Intel HD Graphics 620 graphics card (clocked at 300 - 1050 MHz). It is manufactured in an improved 14nm FinFET process (14nm+) at Intel. Compared to the old Skylake Core i7-6500U (2.5 - 3.1 GHz), the i7-7500U clock speed is up to 400 MHz higher.

ModelIntel Core i5-7200UAMD A10-9620PIntel Core i7-7500U
SeriesIntel Kaby LakeAMD Bristol RidgeIntel Kaby Lake
CodenameKaby LakeBristol RidgeKaby Lake
Series: Kaby Lake Kaby Lake
Intel Core i7-7700K4.2 - 4.5 GHz4 / 8 cores8 MB L3
Intel Core i7-77003.6 - 4.2 GHz4 / 8 cores8 MB L3
Intel Xeon E3-1535M v63.1 - 4.2 GHz4 / 8 cores8 MB L3
Intel Core i7-7920HQ3.1 - 4.1 GHz4 / 8 cores8 MB L3
Intel Core i7-7700T2.9 - 3.8 GHz4 / 8 cores8 MB L3
Intel Core i5-7600K3.8 - 4.2 GHz4 / 4 cores8 MB L3
Intel Xeon E3-1505M v63 - 4 GHz4 / 8 cores8 MB L3
Intel Core i7-7820HQ2.9 - 3.9 GHz4 / 8 cores8 MB L3
Intel Core i7-7820HK2.9 - 3.9 GHz4 / 8 cores8 MB L3
Intel Core i7-7700HQ2.8 - 3.8 GHz4 / 8 cores6 MB L3
Intel Core i5-75003.4 - 3.8 GHz4 / 4 cores6 MB L3
Intel Core i5-7440HQ2.8 - 3.8 GHz4 / 4 cores6 MB L3
Intel Core i7-7567U3.5 - 4 GHz2 / 4 cores4 MB L3
Intel Core i7-7660U2.5 - 4 GHz2 / 4 cores4 MB L3
Intel Core i7-7600U2.8 - 3.9 GHz2 / 4 cores4 MB L3
Intel Core i5-7300HQ2.5 - 3.5 GHz4 / 4 cores6 MB L3
Intel Core i5-7500T2.7 - 3.3 GHz4 / 4 cores6 MB L3
Intel Core i5-7287U3.3 - 3.7 GHz2 / 4 cores4 MB L3
Intel Core i7-7560U2.4 - 3.8 GHz2 / 4 cores4 MB L3
Intel Core i5-7267U3.1 - 3.5 GHz2 / 4 cores4 MB L3
Intel Core i5-7360U2.3 - 3.6 GHz2 / 4 cores4 MB L3
Intel Core i7-7500U2.7 - 3.5 GHz2 / 4 cores4 MB L3
Intel Core i5-7300U2.6 - 3.5 GHz2 / 4 cores3 MB L3
Intel Core i5-7260U2.2 - 3.4 GHz2 / 4 cores4 MB L3
Intel Core i5-7200U « 2.5 - 3.1 GHz2 / 4 cores3 MB L3
Intel Core i3-7100H3 GHz2 / 4 cores3 MB L3
Intel Core i3-7167U2.8 GHz2 / 4 cores3 MB L3
Intel Core i7-7Y751.3 - 3.6 GHz2 / 4 cores4 MB L3
Intel Core i5-7Y571.2 - 3.3 GHz2 / 4 cores4 MB L3
Intel Core i5-7Y541.2 - 3.2 GHz2 / 4 cores4 MB L3
Intel Core i3-7100U2.4 GHz2 / 4 cores3 MB L3
Intel Core m3-7Y321 - 3 GHz2 / 4 cores4 MB L3
Intel Pentium Gold 4415U2.3 GHz2 / 4 cores2 MB L3
Intel Core m3-7Y301 - 2.6 GHz2 / 4 cores4 MB L3
Intel Celeron 3965U2.2 GHz2 / 2 cores2 MB L3
Intel Core i3-7020U2.3 GHz2 / 4 cores3 MB L3
Intel Celeron 3867U1.8 GHz2 / 2 cores2 MB L3
Intel Celeron 3865U1.8 GHz2 / 2 cores2 MB L3
Intel Pentium Gold 4425Y1.7 GHz2 / 4 cores2 MB L3
Intel Pentium Gold 4415Y1.6 GHz2 / 4 cores2 MB L3
Intel Pentium Gold 4410Y1.5 GHz2 / 4 cores2 MB L3
Intel Celeron 3965Y1.5 GHz2 / 2 cores2 MB L3
AMD FX-9830P3 - 3.7 GHz4 / 4 cores
AMD PRO A12-9830B3 - 3.7 GHz4 / 4 cores
AMD FX-9800P2.7 - 3.6 GHz4 / 4 cores
AMD PRO A12-9800B2.7 - 3.6 GHz4 / 4 cores
AMD A12-9720P2.7 - 3.6 GHz4 / 4 cores
AMD A12-9700P2.5 - 3.4 GHz4 / 4 cores
AMD A10-9620P « 2.5 - 3.4 GHz4 / 4 cores
AMD A10-9600P2.4 - 3.3 GHz4 / 4 cores
AMD PRO A8-9600B2.4 - 3.3 GHz4 / 4 cores
Intel Core i7-7700K4.2 - 4.5 GHz4 / 8 cores8 MB L3
Intel Core i7-77003.6 - 4.2 GHz4 / 8 cores8 MB L3
Intel Xeon E3-1535M v63.1 - 4.2 GHz4 / 8 cores8 MB L3
Intel Core i7-7920HQ3.1 - 4.1 GHz4 / 8 cores8 MB L3
Intel Core i7-7700T2.9 - 3.8 GHz4 / 8 cores8 MB L3
Intel Core i5-7600K3.8 - 4.2 GHz4 / 4 cores8 MB L3
Intel Xeon E3-1505M v63 - 4 GHz4 / 8 cores8 MB L3
Intel Core i7-7820HQ2.9 - 3.9 GHz4 / 8 cores8 MB L3
Intel Core i7-7820HK2.9 - 3.9 GHz4 / 8 cores8 MB L3
Intel Core i7-7700HQ2.8 - 3.8 GHz4 / 8 cores6 MB L3
Intel Core i5-75003.4 - 3.8 GHz4 / 4 cores6 MB L3
Intel Core i5-7440HQ2.8 - 3.8 GHz4 / 4 cores6 MB L3
Intel Core i7-7567U3.5 - 4 GHz2 / 4 cores4 MB L3
Intel Core i7-7660U2.5 - 4 GHz2 / 4 cores4 MB L3
Intel Core i7-7600U2.8 - 3.9 GHz2 / 4 cores4 MB L3
Intel Core i5-7300HQ2.5 - 3.5 GHz4 / 4 cores6 MB L3
Intel Core i5-7500T2.7 - 3.3 GHz4 / 4 cores6 MB L3
Intel Core i5-7287U3.3 - 3.7 GHz2 / 4 cores4 MB L3
Intel Core i7-7560U2.4 - 3.8 GHz2 / 4 cores4 MB L3
Intel Core i5-7267U3.1 - 3.5 GHz2 / 4 cores4 MB L3
Intel Core i5-7360U2.3 - 3.6 GHz2 / 4 cores4 MB L3
Intel Core i7-7500U « 2.7 - 3.5 GHz2 / 4 cores4 MB L3
Intel Core i5-7300U2.6 - 3.5 GHz2 / 4 cores3 MB L3
Intel Core i5-7260U2.2 - 3.4 GHz2 / 4 cores4 MB L3
Intel Core i5-7200U2.5 - 3.1 GHz2 / 4 cores3 MB L3
Intel Core i3-7100H3 GHz2 / 4 cores3 MB L3
Intel Core i3-7167U2.8 GHz2 / 4 cores3 MB L3
Intel Core i7-7Y751.3 - 3.6 GHz2 / 4 cores4 MB L3
Intel Core i5-7Y571.2 - 3.3 GHz2 / 4 cores4 MB L3
Intel Core i5-7Y541.2 - 3.2 GHz2 / 4 cores4 MB L3
Intel Core i3-7100U2.4 GHz2 / 4 cores3 MB L3
Intel Core m3-7Y321 - 3 GHz2 / 4 cores4 MB L3
Intel Pentium Gold 4415U2.3 GHz2 / 4 cores2 MB L3
Intel Core m3-7Y301 - 2.6 GHz2 / 4 cores4 MB L3
Intel Celeron 3965U2.2 GHz2 / 2 cores2 MB L3
Intel Core i3-7020U2.3 GHz2 / 4 cores3 MB L3
Intel Celeron 3867U1.8 GHz2 / 2 cores2 MB L3
Intel Celeron 3865U1.8 GHz2 / 2 cores2 MB L3
Intel Pentium Gold 4425Y1.7 GHz2 / 4 cores2 MB L3
Intel Pentium Gold 4415Y1.6 GHz2 / 4 cores2 MB L3
Intel Pentium Gold 4410Y1.5 GHz2 / 4 cores2 MB L3
Intel Celeron 3965Y1.5 GHz2 / 2 cores2 MB L3
Clock2500 - 3100 MHz2500 - 3400 MHz2700 - 3500 MHz
L1 Cache128 KB128 KB
L2 Cache512 KB2 MB512 KB
L3 Cache3 MB4 MB
Cores / Threads2 / 44 / 42 / 4
TDP15 Watt15 Watt15 Watt
Technology14 nm28 nm14 nm
max. Temp.100 °C90 °C100 °C
SocketBGA1356FP4BGA1356
FeaturesDual-Channel DDR4 Memory Controller, HyperThreading, AVX, AVX2, Quick Sync, Virtualization, AES-NIDual-Channel DDR3/DDR4-1866 Memory Controller, PCIe 3.0 x8Dual-Channel DDR4 Memory Controller, HyperThreading, AVX, AVX2, Quick Sync, Virtualization, AES-NI
iGPUIntel HD Graphics 620 (300 - 1000 MHz)AMD Radeon R5 (Bristol Ridge) ( - 758 MHz)Intel HD Graphics 620 (300 - 1050 MHz)
Architecturex86x86x86
$281 U.S.$393 U.S.
Announced
Manufacturerark.intel.comark.intel.com
Transistors3100 Million
Die Size250 mm2

Benchmarks

Cinebench R15 - Cinebench R15 CPU Multi 64 Bit
min: 268     avg: 324.5     median: 327 (2%)     max: 337 Points
230 Points (1%)
min: 265     avg: 338.4     median: 340 (2%)     max: 376 Points
Cinebench R15 - Cinebench R15 CPU Single 64 Bit
min: 88     avg: 126.3     median: 128 (39%)     max: 132 Points
72 Points (22%)
min: 110     avg: 141.8     median: 144 (43%)     max: 149 Points
Cinebench R11.5 - Cinebench R11.5 CPU Multi 64 Bit
min: 2.85     avg: 3.6     median: 3.7 (5%)     max: 3.7 Points
2.7 Points (3%)
min: 3.4     avg: 3.7     median: 3.8 (5%)     max: 4.05 Points
Cinebench R11.5 - Cinebench R11.5 CPU Single 64 Bit
min: 1.2     avg: 1.4     median: 1.5 (36%)     max: 1.49 Points
0.8 Points (20%)
min: 1.35     avg: 1.6     median: 1.7 (41%)     max: 1.69 Points
Cinebench R10 - Cinebench R10 Rend. Single (32bit)
min: 4787     avg: 4976     median: 4985.5 (30%)     max: 5022 Points
2277 Points (14%)
min: 4835     avg: 5605     median: 5647 (34%)     max: 5722 Points
Cinebench R10 - Cinebench R10 Rend. Multi (32bit)
min: 9213     avg: 11161     median: 11308 (8%)     max: 11955 Points
7420 Points (5%)
min: 9726     avg: 11831     median: 11745.5 (9%)     max: 12981 Points
Cinebench R10 - Cinebench R10 Rend. Multi (64bit)
min: 11910     avg: 13678     median: 13808 (10%)     max: 14554 Points
min: 14099     avg: 15061     median: 15362 (11%)     max: 15817 Points
Cinebench R10 - Cinebench R10 Rend. Single (64bit)
min: 5663     avg: 6343     median: 6415.5 (8%)     max: 6524 Points
min: 6047     avg: 7000     median: 7265 (9%)     max: 7305 Points
wPrime 2.10 - wPrime 2.0 1024m *
min: 460.9     avg: 495     median: 491.2 (6%)     max: 537 s
470.9 s (6%)
min: 423.8     avg: 492.6     median: 485.8 (6%)     max: 602 s
wPrime 2.10 - wPrime 2.0 32m *
min: 14.66     avg: 15.6     median: 15.5 (3%)     max: 17.62 s
14.4 s (3%)
min: 13.11     avg: 14.3     median: 14 (3%)     max: 16.8 s
wPrime 1.55 - wPrime 1.55 1024m *
464.8 s (2%)
wPrime 1.55 - wPrime 1.55 32m *
14.9 s (8%)
min: 1983     avg: 2542     median: 2561 (4%)     max: 3011 Points
X264 HD Benchmark 4.0 - x264 Pass 2
min: 19     avg: 21.3     median: 21.6 (8%)     max: 22 fps
16.3 fps (6%)
min: 20     avg: 22     median: 21.7 (8%)     max: 23.95 fps
X264 HD Benchmark 4.0 - x264 Pass 1
min: 100     avg: 112.7     median: 113.1 (26%)     max: 117 fps
76.6 fps (18%)
min: 109     avg: 118.7     median: 117 (27%)     max: 133.2 fps
min: 0.204     avg: 0.2     median: 0.2 (0%)     max: 0.222 GB/s
min: 0.323     avg: 0.4     median: 0.4 (6%)     max: 0.375 GB/s
min: 1.9     avg: 2.1     median: 2.1 (5%)     max: 2.2 GB/s
3DMark 06 - CPU - 3DMark 06 - CPU
min: 3700     avg: 4299     median: 4347.5 (9%)     max: 4407 Points
min: 3690     avg: 4423     median: 4579 (10%)     max: 4921 Points
Super Pi mod 1.5 XS 1M - Super Pi mod 1.5 XS 1M *
min: 12     avg: 12.3     median: 12.3 (3%)     max: 12.61 s
18.2 s (4%)
min: 10     avg: 10.8     median: 10.8 (2%)     max: 11.52 s
Super Pi mod 1.5 XS 2M - Super Pi mod 1.5 XS 2M *
min: 27.36     avg: 28.2     median: 28 (1%)     max: 29.69 s
40.3 s (2%)
min: 24.2     avg: 24.8     median: 24.8 (1%)     max: 25.3 s
Super Pi Mod 1.5 XS 32M - Super Pi mod 1.5 XS 32M *
min: 610     avg: 645     median: 643.5 (3%)     max: 722 s
977 s (4%)
min: 543     avg: 577     median: 575 (3%)     max: 615 s
3DMark Vantage - 3DM Vant. Perf. CPU no Physx
min: 9939     avg: 11370     median: 11779 (10%)     max: 12049 Points
min: 11456     avg: 12603     median: 12732 (11%)     max: 13682 Points
3DMark 11 - 3DM11 Performance Physics
min: 3242     avg: 4145     median: 4107 (11%)     max: 4695 Points
2399 Points (6%)
min: 2983     avg: 4494     median: 4538 (12%)     max: 5246 Points
3DMark - 3DMark Ice Storm Physics
min: 28394     avg: 37794     median: 37804 (31%)     max: 42974 Points
22553 Points (18%)
min: 28860     avg: 39597     median: 40263 (33%)     max: 47877 Points
3DMark - 3DMark Ice Storm Extreme Physics
min: 26941     avg: 36877     median: 37260 (30%)     max: 42166 Points
24032 Points (19%)
min: 28817     avg: 40062     median: 40419 (33%)     max: 46962 Points
3DMark - 3DMark Ice Storm Unlimited Physics
min: 36369     avg: 41562     median: 42260 (36%)     max: 43942 Points
min: 41855     avg: 46680     median: 47434 (40%)     max: 49751 Points
3DMark - 3DMark Cloud Gate Physics
min: 2622     avg: 3414     median: 3503 (9%)     max: 3684 Points
2338 Points (6%)
min: 296     avg: 3628     median: 3748 (9%)     max: 4143 Points
3DMark - 3DMark Fire Strike Standard Physics
min: 3866     avg: 4887     median: 4979 (9%)     max: 5252 Points
3175 Points (6%)
min: 4005     avg: 5389     median: 5453 (10%)     max: 5882 Points
min: 1508     avg: 1810     median: 1852 (8%)     max: 2060 Points
Geekbench 4.4 - Geekbench 4.1 - 4.4 64 Bit Single-Core
min: 3648     avg: 3799     median: 3809 (38%)     max: 3958 Points
min: 4415     avg: 4440     median: 4440 (44%)     max: 4465 Points
Geekbench 4.4 - Geekbench 4.1 - 4.4 64 Bit Multi-Core
min: 7066     avg: 7413     median: 7516 (8%)     max: 7767 Points
min: 8740     avg: 8762     median: 8762 (10%)     max: 8784 Points
Geekbench 4.0 - Geekbench 4.0 64 Bit Single-Core
min: 3484     avg: 3661     median: 3630 (49%)     max: 3902 Points
min: 4033     avg: 4191     median: 4151 (56%)     max: 4375 Points
Geekbench 4.0 - Geekbench 4.0 64 Bit Multi-Core
min: 6425     avg: 6947     median: 6806 (17%)     max: 7439 Points
min: 7282     avg: 7983     median: 8070 (20%)     max: 8449 Points
Geekbench 3 - Geekbench 3 32 Bit Multi-Core
min: 6297     avg: 6584     median: 6480.5 (12%)     max: 6932 Points
min: 6872     avg: 7442     median: 7635 (14%)     max: 7835 Points
Geekbench 3 - Geekbench 3 32 Bit Single-Core
min: 2812     avg: 2983     median: 2906 (57%)     max: 3209 Points
min: 3211     avg: 3462     median: 3526 (69%)     max: 3706 Points
Geekbench 3 - Geekbench 3 64 Bit Multi-Core
min: 6695     avg: 6772     median: 6772 (11%)     max: 6849 Points
min: 7645     avg: 7946     median: 7945.5 (12%)     max: 8246 Points
Geekbench 3 - Geekbench 3 64 Bit Single-Core
min: 3037     avg: 3144     median: 3143.5 (47%)     max: 3250 Points
min: 3587     avg: 3731     median: 3731 (56%)     max: 3875 Points
PassMark PerformanceTest 9 - PerformanceTest 9.0 CPU Mark
4907 Points (26%)
Mozilla Kraken 1.1 - Kraken 1.1 Total Score *
min: 1109     avg: 1211     median: 1196 (1%)     max: 1542 ms
min: 960     avg: 1044     median: 1041.5 (1%)     max: 1283 ms
Sunspider - Sunspider 1.0 Total Score *
min: 77.7     avg: 124.3     median: 86.3 (1%)     max: 826 ms
min: 69.7     avg: 82.7     median: 78 (1%)     max: 141.7 ms
Octane V2 - Octane V2 Total Score
min: 21890     avg: 29883     median: 30957 (28%)     max: 32838 Points
min: 28609     avg: 34302     median: 35028 (31%)     max: 37473 Points
PCMark for Android - PCM f. Android Work Score
242 Points (1%)
Power Consumption - Prime95 Power Consumption - external Monitor *
26.8 Watt (5%)
Power Consumption - Cinebench R15 Multi Power Consumption - external Monitor *
25.5 Watt (5%)
Power Consumption - Cinebench R15 Multi Power Efficiency - external Monitor
12.8 Points per Watt (10%)

Average Benchmarks Intel Core i5-7200U → 100% n=19

Average Benchmarks AMD A10-9620P → 73% n=19

Average Benchmarks Intel Core i7-7500U → 106% n=19

- Range of benchmark values for this graphics card
- Average benchmark values for this graphics card
* Smaller numbers mean a higher performance
1 This benchmark is not used for the average calculation

v1.26
log 03. 10:09:53

#0 checking url part for id 8152 +0s ... 0s

#1 checking url part for id 9188 +0s ... 0s

#2 checking url part for id 8149 +0s ... 0s

#3 not redirecting to Ajax server +0s ... 0s

#4 did not recreate cache, as it is less than 5 days old! Created at Wed, 01 May 2024 05:34:47 +0200 +0.001s ... 0.001s

#5 composed specs +0.044s ... 0.045s

#6 did output specs +0s ... 0.045s

#7 getting avg benchmarks for device 8152 +0.005s ... 0.05s

#8 got single benchmarks 8152 +0.409s ... 0.459s

#9 getting avg benchmarks for device 9188 +0.003s ... 0.462s

#10 got single benchmarks 9188 +0.009s ... 0.47s

#11 getting avg benchmarks for device 8149 +0.004s ... 0.474s

#12 got single benchmarks 8149 +0.221s ... 0.695s

#13 got avg benchmarks for devices +0s ... 0.695s

#14 min, max, avg, median took s +0.393s ... 1.088s

#15 return log +0s ... 1.088s

Please share our article, every link counts!
> Expert Reviews and News on Laptops, Smartphones and Tech Innovations > Benchmarks / Tech > Processor Comparison - Head 2 Head
Redaktion, 2017-09- 8 (Update: 2023-07- 1)