NVIDIA GeForce GTX 1050 Ti (Desktop) vs NVIDIA GeForce GTX 1650 Max-Q vs NVIDIA GeForce GTX 1070 SLI (Laptop)
NVIDIA GeForce GTX 1050 Ti (Desktop) ► remove from comparison
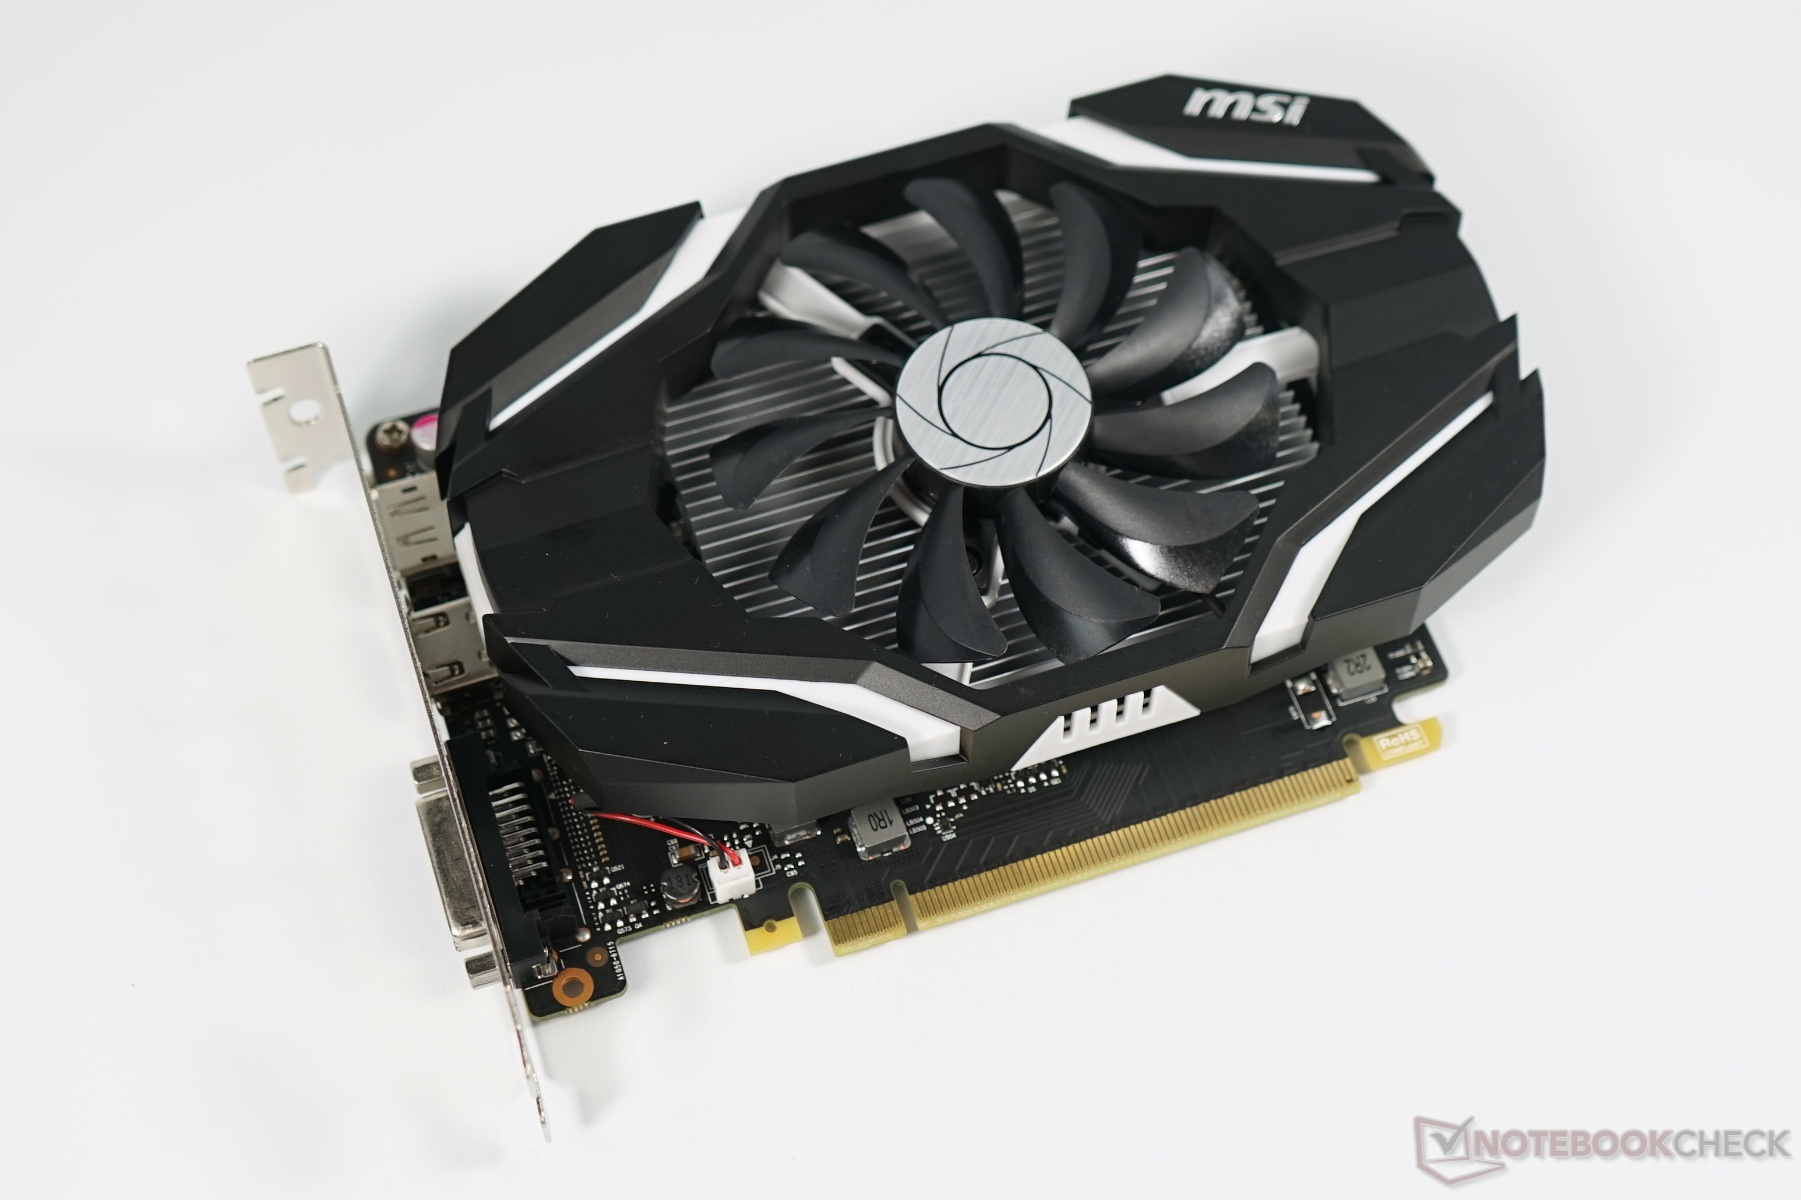
The Nvidia GeForce GTX 1050 Ti (N17P-G1) for desktops is an entry level gaming graphics card that was announced late 2016. It is based on the GP107 chip using the Pascal architecture and manufactured in 14nm FinFET at Samsung (the bigger Pascal chips are manufactured in 16nm at TSMC). Usually it is equipped with 4 GB GDDR5 memory with a 7 Gbps data rate. The mobile GTX 1050 Ti version should be announced later (beginning of 2017) and feature similar specs.
The performance of the GTX 1050 lies between the Radeon RX 460 and the RX 470 on a similar level of the old GeForce GTX 960 (or 970M ). Therefore, the card is most suited for 1080p gaming at high detail settings (but not maximum settings).
See our extensive review of the MSI GeForce GTX 1050 Ti for more information on power consumption, benchmarks and noise level.
NVIDIA GeForce GTX 1650 Max-Q ► remove from comparison
The Nvidia GeForce GTX 1650 with Max-Q design is a mobile graphics card that is based on the Turing architecture (TU117 chip). Compared to the faster RTX 2000 GPUs (e.g. RTX 2060 ), the 1650 integrates no Raytracing or Tensor cores. Compared to the desktop version, the mobile and Max-Q versions use all 1024 shaders of the TU117 chip. It is designed for thin and light laptops and about 10-15% slower than a regular GTX 1650 for laptops (depending on the cooling capabilities). According to the specifications, the Max-Q variant clocks 20% slower for the base speed and 27% for the boost speed.
Beginning March 2020, the GTX 1650 Max-Q is also available with fast 4GB GDDR6 (N18P-G61).
The performance should be slightly faster than the old GeForce GTX 1050 Ti Max-Q .
The Turing generation did not only introduce raytracing for the RTX cards, but also optimized the architecture of the cores and caches. According to Nvidia the CUDA cores offer now a concurrent execution of floating point and integer operations for increased performance in compute-heavy workloads of modern games. Furthermore, the caches were reworked (new unified memory architecture with twice the cache compared to Pascal). This leads to 50% more instructions per clock and a 40% more power efficient usage compared to Pascal.
Compared to the bigger Turing chips (like the TU116 of the GTX 1660 Ti and the RTX lineup), the TU117 does not include the new NVENC encoder but an older one similar to the one used in Pascal and Volta.
Nvidia specifies a power consumption of 35 Watt TGP (Total Graphics Power) and therefore 15 Watts lower than a normal (Max-P) 1650 for laptops . Therefore, the Max-Q variant is well suited for thin and light laptops. The TU117 chip is manufactured in 12nm FFN at TSMC.
NVIDIA GeForce GTX 1070 SLI (Laptop) ► remove from comparison
The Nvidia GeForce GTX 1070 SLI for laptops is a combination of two GTX 1070 graphics cards in SLI mode. Each card renders one frame at a time (AFR mode) but depends for most games on a good profile in the driver. Therefore, the performance can range from no gains over a single GTX 1070 to up to 90% faster performance. In most games with SLI support, the GTX 1070 SLI is therefore faster than a single GTX 1080. However, sometimes the combination also suffers from micro-stuttering .
The technical details of the card are identical to a single GTX 1070 (see for more information) and the power consumption is doubled. Therefore, the 1070 SLI combination is only found in huge clunky laptops.
NVIDIA GeForce GTX 1050 Ti (Desktop) NVIDIA GeForce GTX 1650 Max-Q NVIDIA GeForce GTX 1070 SLI (Laptop) GeForce GTX 1000 Series Codename N17P-G1 N18P-G0 / N18P-G61 Pascal GP104 SLI Architecture Pascal Turing Pascal Pipelines 768 - unified 1024 - unified 4096 - unified Core Speed 1290 - 1392 (Boost) MHz 1020 - 1245 (Boost) MHz 1443 - 1645 (Boost) MHz Memory Speed 7008 MHz 8000 effective = 1750 MHz 8000 MHz Memory Bus Width 128 Bit 128 Bit 256 Bit Memory Type GDDR5 GDDR5, GDDR6 GDDR5 Max. Amount of Memory 4 GB 4 GB 2x 8192 MB Shared Memory no no no API DirectX 12_1, OpenGL 4.5 DirectX 12_1, OpenGL 4.6 DirectX 12_1, OpenGL 4.5 technology 16 nm 12 nm 16 nm Features Multi-Projection, VR Ready, G-SYNC, Vulkan, Multi Monitor Multi-Projection, VR Ready, G-SYNC, Vulkan, Multi Monitor, CUDA, 3D Vision, PhysX, GeForce Experience, Surround, GameStream, GPU Boost 2.0, Adaptive Vertical Sync, SLI Date of Announcement 25.10.2016 23.04.2019 16.08.2016 TMUs 64 ROPs 32 Memory Bandwidth 112.1 GB/s Power Consumption 35 Watt PCIe 3.0 Notebook Size medium sized large Link to Manufacturer Page www.nvidia.com Transistors 14.4 Billion
Benchmarks Performance Rating - 3DMark 11 + Fire Strike + Time Spy - GeForce GTX 1650 Max-Q
3.5 pt (11%)
...
NVIDIA GeForce GTX 1650 Max-Q
...
Performance Rating - 3DMark 11 + Fire Strike + Time Spy - GeForce GTX 1070 SLI (Laptop)
15 pt (45%)
...
NVIDIA GeForce GTX 1070 SLI (Laptop)
...
3DMark - 3DMark Time Spy Score
min: 2474 avg: 2568 median: 2568 (7%) max: 2662 Points
min: 2859 avg: 3130 median: 3070 (9%) max: 3494 Points
min: 8781 avg: 8856 median: 8856 (26%) max: 8931 Points
3DMark - 3DMark Time Spy Graphics
min: 2277 avg: 2309 median: 2308.5 (6%) max: 2340 Points
min: 2836 avg: 2998 median: 3016 (8%) max: 3238 Points
min: 10307 avg: 10455 median: 10455 (28%) max: 10603 Points
3DMark - 3DMark Ice Storm Unlimited Graphics
352876 Points (40%)
min: 370469 avg: 377330 median: 373879 (42%) max: 391093 Points
GPU TDP ? TDP 40 W 94% 100%
3DMark - 3DMark Ice Storm Extreme Graphics
min: 40461 avg: 62256 median: 59656 (8%) max: 86650 Points
GPU TDP ? TDP 40 W 100% 55%
359951 Points (46%)
GPU TDP ? TDP 40 W 100% 24%
3DMark - 3DMark Cloud Gate Score
24195 Points (26%)
min: 14259 avg: 20728 median: 20883 (22%) max: 29013 Points
GPU TDP ? TDP 40 W 88% 100%
min: 31696 avg: 32422 median: 32510 (35%) max: 33061 Points
GPU TDP ? TDP 40 W 98% 100%
3DMark - 3DMark Cloud Gate Graphics
50939 Points (13%)
min: 21759 avg: 39625 median: 45243.5 (12%) max: 53981 Points
GPU TDP ? TDP 40 W 100% 75%
min: 149345 avg: 153545 median: 152370 (40%) max: 158919 Points
GPU TDP ? TDP 40 W 100% 49%
3DMark - 3DMark Fire Strike Standard Score
min: 6644 avg: 6783 median: 6816 (12%) max: 6888 Points
min: 6300 avg: 7026 median: 7004.5 (12%) max: 7784 Points
GPU TDP ? TDP 40 W 89% 100%
min: 20379 avg: 20776 median: 20816 (37%) max: 21132 Points
GPU TDP ? TDP 40 W 100% 83%
3DMark - 3DMark Fire Strike Standard Graphics
min: 7293 avg: 7491 median: 7485 (8%) max: 7696 Points
min: 6985 avg: 7853 median: 7779 (9%) max: 8618 Points
GPU TDP ? TDP 40 W 92% 100%
min: 32640 avg: 33718 median: 32969 (37%) max: 35545 Points
GPU TDP ? TDP 40 W 100% 68%
3DMark - 3DMark Ice Storm Graphics
min: 40513 avg: 68009 median: 64975.5 (8%) max: 101571 Points
GPU TDP ? TDP 40 W 100% 53%
min: 378149 avg: 400739 median: 410383 (49%) max: 413686 Points
GPU TDP ? TDP 40 W 100% 17%
3DMark 11 - 3DM11 Performance Score
min: 9151 avg: 9481 median: 9480.5 (13%) max: 9810 Points
min: 9381 avg: 10635 median: 10471 (15%) max: 11966 Points
GPU TDP ? TDP 40 W 96% 100%
min: 23326 avg: 23835 median: 23911 (33%) max: 24267 Points
GPU TDP ? TDP 40 W 100% 85%
3DMark 11 - 3DM11 Performance GPU
min: 9212 avg: 9453 median: 9453 (8%) max: 9694 Points
min: 10248 avg: 11171 median: 11082.5 (10%) max: 12259 Points
GPU TDP ? TDP 40 W 100% 99%
min: 41469 avg: 43219 median: 42910 (37%) max: 45279 Points
GPU TDP ? TDP 40 W 100% 66%
3DMark Vantage + NVIDIA GeForce GTX 1650 Max-Q 3DMark Vantage - 3DM Vant. Perf. total
30957 Points (9%)
3DM Vant. Perf. total + NVIDIA GeForce GTX 1070 SLI (Laptop)
56476 Points (16%)
3DM Vant. Perf. GPU no PhysX + NVIDIA GeForce GTX 1650 Max-Q 3DMark Vantage - 3DM Vant. Perf. GPU no PhysX
33321 Points (19%)
3DM Vant. Perf. GPU no PhysX + NVIDIA GeForce GTX 1070 SLI (Laptop)
77533 Points (44%)
3DMark 06 3DMark 06 - Standard 1280x1024 + NVIDIA GeForce GTX 1050 Ti (Desktop)
min: 36277 avg: 38484 median: 38483.5 (50%) max: 40690 Points
3DMark 06 - Standard 1280x1024 + NVIDIA GeForce GTX 1650 Max-Q
min: 31487 avg: 32041 median: 32040.5 (42%) max: 32594 Points
Unigine Valley 1.0 - Unigine Valley 1.0 DX
40.7 fps (13%)
SPECviewperf 11 + NVIDIA GeForce GTX 1070 SLI (Laptop) SPECviewperf 11 - specvp11 snx-01
13.2 fps (8%)
specvp11 tcvis-02 + NVIDIA GeForce GTX 1070 SLI (Laptop) SPECviewperf 11 - specvp11 tcvis-02
3.7 fps (2%)
specvp11 sw-02 + NVIDIA GeForce GTX 1070 SLI (Laptop) SPECviewperf 11 - specvp11 sw-02
24.7 fps (19%)
specvp11 proe-05 + NVIDIA GeForce GTX 1070 SLI (Laptop) SPECviewperf 11 - specvp11 proe-05
3.4 fps (4%)
specvp11 maya-03 + NVIDIA GeForce GTX 1070 SLI (Laptop) SPECviewperf 11 - specvp11 maya-03
15.3 fps (12%)
specvp11 lightwave-01 + NVIDIA GeForce GTX 1070 SLI (Laptop) SPECviewperf 11 - specvp11 lightwave-01
28.9 fps (31%)
specvp11 ensight-04 + NVIDIA GeForce GTX 1070 SLI (Laptop) SPECviewperf 11 - specvp11 ensight-04
72.8 fps (35%)
specvp11 catia-03 + NVIDIA GeForce GTX 1070 SLI (Laptop) SPECviewperf 11 - specvp11 catia-03
20.3 fps (11%)
SPECviewperf 12 + NVIDIA GeForce GTX 1070 SLI (Laptop) SPECviewperf 12 - specvp12 sw-03
64.7 fps (16%)
specvp12 snx-02 + NVIDIA GeForce GTX 1070 SLI (Laptop) SPECviewperf 12 - specvp12 snx-02
8.7 fps (1%)
specvp12 showcase-01 + NVIDIA GeForce GTX 1070 SLI (Laptop) SPECviewperf 12 - specvp12 showcase-01
82.3 fps (18%)
specvp12 mediacal-01 + NVIDIA GeForce GTX 1070 SLI (Laptop) SPECviewperf 12 - specvp12 mediacal-01
43.5 fps (11%)
specvp12 maya-04 + NVIDIA GeForce GTX 1070 SLI (Laptop) SPECviewperf 12 - specvp12 maya-04
144.7 fps (39%)
specvp12 energy-01 + NVIDIA GeForce GTX 1070 SLI (Laptop) SPECviewperf 12 - specvp12 energy-01
9.2 fps (8%)
specvp12 creo-01 + NVIDIA GeForce GTX 1070 SLI (Laptop) SPECviewperf 12 - specvp12 creo-01
56.4 fps (23%)
specvp12 catia-04 + NVIDIA GeForce GTX 1070 SLI (Laptop) SPECviewperf 12 - specvp12 catia-04
84.1 fps (14%)
SPECviewperf 13 specvp13 sw-04 + NVIDIA GeForce GTX 1650 Max-Q SPECviewperf 13 - specvp13 sw-04
53 fps (14%)
specvp13 snx-03 + NVIDIA GeForce GTX 1650 Max-Q SPECviewperf 13 - specvp13 snx-03
10.7 fps (1%)
specvp13 showcase-02 + NVIDIA GeForce GTX 1650 Max-Q SPECviewperf 13 - specvp13 showcase-02
33.7 fps (7%)
specvp13 medical-02 + NVIDIA GeForce GTX 1650 Max-Q SPECviewperf 13 - specvp13 medical-02
22.8 fps (5%)
specvp13 maya-05 + NVIDIA GeForce GTX 1650 Max-Q SPECviewperf 13 - specvp13 maya-05
88.2 fps (10%)
specvp13 creo-02 + NVIDIA GeForce GTX 1650 Max-Q SPECviewperf 13 - specvp13 creo-02
68.9 fps (10%)
specvp13 catia-05 + NVIDIA GeForce GTX 1650 Max-Q SPECviewperf 13 - specvp13 catia-05
53.9 fps (6%)
specvp13 3dsmax-06 + NVIDIA GeForce GTX 1650 Max-Q SPECviewperf 13 - specvp13 3dsmax-06
71.3 fps (12%)
Cinebench R10 Cinebench R10 Shading (32bit) + NVIDIA GeForce GTX 1650 Max-Q Cinebench R10 - Cinebench R10 Shading (32bit)
min: 5121 avg: 5968 median: 5967.5 (4%) max: 6814 Points
Cinebench R11.5 Cinebench R11.5 OpenGL 64 Bit + NVIDIA GeForce GTX 1650 Max-Q Cinebench R11.5 - Cinebench R11.5 OpenGL 64 Bit
76.1 fps (26%)
Cinebench R11.5 OpenGL 64 Bit + NVIDIA GeForce GTX 1070 SLI (Laptop)
80.5 fps (28%)
Cinebench R15 + NVIDIA GeForce GTX 1050 Ti (Desktop) Cinebench R15 - Cinebench R15 OpenGL 64 Bit
min: 134.7 avg: 150.4 median: 150.4 (9%) max: 166 fps
Cinebench R15 OpenGL 64 Bit + NVIDIA GeForce GTX 1650 Max-Q
min: 85.3 avg: 110 median: 108.1 (6%) max: 143.6 fps
GPU TDP ? TDP 40 W 79% 100%
Cinebench R15 OpenGL 64 Bit + NVIDIA GeForce GTX 1070 SLI (Laptop)
min: 139.6 avg: 142.2 median: 142.2 (8%) max: 144.8 fps
GPU TDP ? TDP 40 W 82% 100%
Cinebench R15 OpenGL Ref. Match 64 Bit + NVIDIA GeForce GTX 1050 Ti (Desktop) Cinebench R15 - Cinebench R15 OpenGL Ref. Match 64 Bit
min: 99.6 avg: 99.8 median: 99.8 (100%) max: 100 %
Cinebench R15 OpenGL Ref. Match 64 Bit + NVIDIA GeForce GTX 1650 Max-Q
99.6 % (100%)
GPU TDP ? TDP 40 W 100% 100%
Cinebench R15 OpenGL Ref. Match 64 Bit + NVIDIA GeForce GTX 1070 SLI (Laptop)
99.6 % (100%)
GPU TDP ? TDP 40 W 100% 100%
GFXBench - GFXBench Car Chase Offscreen
154.2 fps (17%)
GFXBench 3.0 - GFXBench 3.0 Manhattan Offscreen
545 fps (32%)
LuxMark v2.0 64Bit - LuxMark v2.0 Room GPU
1175 Samples/s (5%)
1589 Samples/s (7%)
5280 Samples/s (24%)
LuxMark v2.0 64Bit - LuxMark v2.0 Sala GPU
2156 Samples/s (4%)
3068 Samples/s (5%)
10434 Samples/s (18%)
ComputeMark v2.1 - ComputeMark v2.1 Result
5493 Points (6%)
5833 Points (6%)
13059 Points (14%)
Power Consumption - Furmark Stress Test Power Consumption - external Monitor *
164 Watt (23%)
Power Consumption - The Witcher 3 Power Consumption - external Monitor *
155 Watt (22%)
Power Consumption - Witcher 3 Power Consumption *
99.5 Watt (22%)
min: 60 avg: 71.7 median: 73 (16%) max: 90.1 Watt
295 Watt (65%)
Power Consumption - Witcher 3 ultra Power Efficiency
0.2 fps per Watt (24%)
min: 0.3818 avg: 0.4 median: 0.4 (43%) max: 0.485 fps per Watt
0.3 fps per Watt (34%)
Power Consumption - Witcher 3 ultra Power Efficiency - external Monitor
0.2 fps per Watt (15%)
Emissions Witcher 3 Fan Noise + NVIDIA GeForce GTX 1050 Ti (Desktop) Emissions - Witcher 3 Fan Noise
42 dB(A) (67%)
Witcher 3 Fan Noise + NVIDIA GeForce GTX 1650 Max-Q
min: 25.2 avg: 38.8 median: 39.8 (64%) max: 44.7 dB(A)
GPU TDP ? TDP 40 W 90% 100%
Witcher 3 Fan Noise + NVIDIA GeForce GTX 1070 SLI (Laptop)
56 dB(A) (90%)
GPU TDP ? TDP 40 W 94% 100%
Clock Speed - GPU Clock Witcher 3 ultra
min: 1350 avg: 1378 median: 1389 (54%) max: 1395 MHz
1650 MHz (65%)
Average Benchmarks NVIDIA GeForce GTX 1050 Ti (Desktop) → 100% n=13 Average Benchmarks NVIDIA GeForce GTX 1650 Max-Q → 109% n=13 Average Benchmarks NVIDIA GeForce GTX 1070 SLI (Laptop) → 311% n=13
- Range of benchmark values for this graphics card
- Average benchmark values for this graphics card
* Smaller numbers mean a higher performance
1 This benchmark is not used for the average calculation
Game Benchmarks The following benchmarks stem from our benchmarks of review laptops. The performance depends on the used graphics memory, clock rate, processor, system settings, drivers, and operating systems. So the results don't have to be representative for all laptops with this GPU. For detailed information on the benchmark results, click on the fps number.
100%
GeForce GTX 1050 Ti (Desktop):
31 [X] Asus Maximum XIII Hero Desktop MSI GTX 1050 Ti Intel Core i9-11900K 3.5GHz
GeForce GTX 1050 Ti (Desktop)
min:
19 fps
fps
100%
GeForce GTX 1050 Ti (Desktop):
18 [X] Asus Maximum XIII Hero Desktop MSI GTX 1050 Ti Intel Core i9-11900K 3.5GHz
GeForce GTX 1050 Ti (Desktop)
min:
8 fps
fps
100%
GeForce GTX 1050 Ti (Desktop):
11 [X] Asus Maximum XIII Hero Desktop MSI GTX 1050 Ti Intel Core i9-11900K 3.5GHz
GeForce GTX 1050 Ti (Desktop)
min:
5 fps
fps
100%
GeForce GTX 1050 Ti (Desktop):
7 [X] Asus Maximum XIII Hero Desktop MSI GTX 1050 Ti Intel Core i9-11900K 3.5GHz
GeForce GTX 1050 Ti (Desktop)
min:
2 fps
fps
100%
GeForce GTX 1050 Ti (Desktop):
86.5 [X] Asus Maximum XIII Hero Desktop MSI GTX 1050 Ti 918016
Intel Core i9-11900K 3.5GHz
GeForce GTX 1050 Ti (Desktop)
min:
74 fps, P1:
72 fps, max:
101 fps
fps
100%
GeForce GTX 1050 Ti (Desktop):
75.3 [X] Asus Maximum XIII Hero Desktop MSI GTX 1050 Ti 918016
Intel Core i9-11900K 3.5GHz
GeForce GTX 1050 Ti (Desktop)
min:
64 fps, P1:
63 fps, max:
86 fps
fps
100%
GeForce GTX 1050 Ti (Desktop):
52.5 [X] Asus Maximum XIII Hero Desktop MSI GTX 1050 Ti 918016
Intel Core i9-11900K 3.5GHz
GeForce GTX 1050 Ti (Desktop)
min:
46 fps, P1:
45 fps, max:
60 fps
fps
100%
GeForce GTX 1050 Ti (Desktop):
65 [X] Asus Maximum XIII Hero Desktop MSI GTX 1050 Ti Intel Core i9-11900K 3.5GHz
GeForce GTX 1050 Ti (Desktop)
min:
40.3 fps, P0.1:
49.9 fps, P1:
53.2 fps, max:
202 fps
fps
100%
GeForce GTX 1050 Ti (Desktop):
23.3 [X] Asus Maximum XIII Hero Desktop MSI GTX 1050 Ti Intel Core i9-11900K 3.5GHz
GeForce GTX 1050 Ti (Desktop)
min:
17.1 fps, P0.1:
17.5 fps, P1:
18.8 fps, max:
33 fps
fps
100%
GeForce GTX 1050 Ti (Desktop):
15.8 [X] Asus Maximum XIII Hero Desktop MSI GTX 1050 Ti Intel Core i9-11900K 3.5GHz
GeForce GTX 1050 Ti (Desktop)
min:
12 fps, P0.1:
12.1 fps, P1:
13 fps, max:
20.3 fps
fps
100%
GeForce GTX 1050 Ti (Desktop):
7.7 [X] Asus Maximum XIII Hero Desktop MSI GTX 1050 Ti Intel Core i9-11900K 3.5GHz
GeForce GTX 1050 Ti (Desktop)
min:
6.08 fps, P0.1:
6.1 fps, P1:
6.17 fps, max:
9.98 fps
fps
100%
GeForce GTX 1050 Ti (Desktop):
55 [X] Asus Maximum XIII Hero Desktop MSI GTX 1050 Ti Intel Core i9-11900K 3.5GHz
GeForce GTX 1050 Ti (Desktop)
min:
14 fps, max:
73 fps
fps
100%
GeForce GTX 1050 Ti (Desktop):
37 [X] Asus Maximum XIII Hero Desktop MSI GTX 1050 Ti Intel Core i9-11900K 3.5GHz
GeForce GTX 1050 Ti (Desktop)
min:
25 fps, max:
46 fps
fps
100%
GeForce GTX 1050 Ti (Desktop):
36 [X] Asus Maximum XIII Hero Desktop MSI GTX 1050 Ti Intel Core i9-11900K 3.5GHz
GeForce GTX 1050 Ti (Desktop)
min:
25 fps, max:
46 fps
fps
100%
GeForce GTX 1050 Ti (Desktop):
35 [X] Asus Maximum XIII Hero Desktop MSI GTX 1050 Ti Intel Core i9-11900K 3.5GHz
GeForce GTX 1050 Ti (Desktop)
min:
24 fps, max:
45 fps
fps
100%
GeForce GTX 1050 Ti (Desktop):
24 [X] Asus Maximum XIII Hero Desktop MSI GTX 1050 Ti Intel Core i9-11900K 3.5GHz
GeForce GTX 1050 Ti (Desktop)
min:
14 fps, max:
29 fps
fps
100%
GeForce GTX 1050 Ti (Desktop):
11 [X] Asus Maximum XIII Hero Desktop MSI GTX 1050 Ti Intel Core i9-11900K 3.5GHz
GeForce GTX 1050 Ti (Desktop)
min:
8 fps, max:
13 fps
fps
100%
GeForce GTX 1050 Ti (Desktop):
185 [X] Aorus Z370 Ultra Gaming Desktop MSI GTX 1050 Ti 797778
Intel Core i7-8086K 3.7GHz
GeForce GTX 1050 Ti (Desktop)
min:
152 fps, P1:
142 fps, max:
230 fps
fps
100%
GeForce GTX 1050 Ti (Desktop):
88.8 [X] Aorus Z370 Ultra Gaming Desktop MSI GTX 1050 Ti 797778
Intel Core i7-8086K 3.7GHz
GeForce GTX 1050 Ti (Desktop)
min:
74 fps, P1:
71 fps, max:
104 fps
fps
100%
GeForce GTX 1050 Ti (Desktop):
71.7 [X] Aorus Z370 Ultra Gaming Desktop MSI GTX 1050 Ti 797778
Intel Core i7-8086K 3.7GHz
GeForce GTX 1050 Ti (Desktop)
min:
59 fps, P1:
56 fps, max:
83 fps
fps
100%
GeForce GTX 1050 Ti (Desktop):
41.3 [X] Aorus Z370 Ultra Gaming Desktop MSI GTX 1050 Ti Intel Core i7-8086K 3.7GHz
GeForce GTX 1050 Ti (Desktop)
min:
17.7 fps, P0.1:
28.4 fps, P1:
32.5 fps, max:
81.3 fps
fps
100%
GeForce GTX 1050 Ti (Desktop):
21.3 [X] Aorus Z370 Ultra Gaming Desktop MSI GTX 1050 Ti Intel Core i7-8086K 3.7GHz
GeForce GTX 1050 Ti (Desktop)
min:
14.9 fps, P0.1:
15.3 fps, P1:
18.1 fps, max:
35.3 fps
fps
100%
GeForce GTX 1050 Ti (Desktop):
17 [X] Aorus Z370 Ultra Gaming Desktop MSI GTX 1050 Ti Intel Core i7-8086K 3.7GHz
GeForce GTX 1050 Ti (Desktop)
min:
12.5 fps, P0.1:
12.6 fps, P1:
13.3 fps, max:
19.3 fps
fps
100%
GeForce GTX 1050 Ti (Desktop):
56.1 [X] Aorus Z370 Ultra Gaming Desktop MSI GTX 1050 Ti Intel Core i7-8086K 3.7GHz
GeForce GTX 1050 Ti (Desktop)
min:
7 fps, P1:
41.5 fps, max:
81 fps
fps
100%
GeForce GTX 1050 Ti (Desktop):
25.6 [X] Aorus Z370 Ultra Gaming Desktop MSI GTX 1050 Ti Intel Core i7-8086K 3.7GHz
GeForce GTX 1050 Ti (Desktop)
min:
8 fps, P1:
21.2 fps, max:
55 fps
fps
100%
GeForce GTX 1050 Ti (Desktop):
18.1 [X] Aorus Z370 Ultra Gaming Desktop MSI GTX 1050 Ti Intel Core i7-8086K 3.7GHz
GeForce GTX 1050 Ti (Desktop)
min:
10 fps, P1:
12.3 fps, max:
47 fps
fps
100%
GeForce GTX 1050 Ti (Desktop):
12.1 [X] Aorus Z370 Ultra Gaming Desktop MSI GTX 1050 Ti Intel Core i7-8086K 3.7GHz
GeForce GTX 1050 Ti (Desktop)
min:
7 fps, P1:
8.3 fps, max:
26 fps
fps
100%
GeForce GTX 1050 Ti (Desktop):
8.6 [X] Aorus Z370 Ultra Gaming Desktop MSI GTX 1050 Ti Intel Core i7-8086K 3.7GHz
GeForce GTX 1050 Ti (Desktop)
min:
6 fps, P1:
6.4 fps, max:
12 fps
fps
100%
GeForce GTX 1050 Ti (Desktop):
44.7 [X] Aorus Z370 Ultra Gaming Desktop MSI GTX 1050 Ti 670054
Intel Core i7-8086K 3.7GHz
GeForce GTX 1050 Ti (Desktop)
min:
34 fps, max:
54 fps
fps
100%
GeForce GTX 1050 Ti (Desktop):
32.3 [X] Aorus Z370 Ultra Gaming Desktop MSI GTX 1050 Ti 670054
Intel Core i7-8086K 3.7GHz
GeForce GTX 1050 Ti (Desktop)
min:
25 fps, max:
38 fps
fps
100%
GeForce GTX 1050 Ti (Desktop):
17.6 [X] Aorus Z370 Ultra Gaming Desktop MSI GTX 1050 Ti 670054
Intel Core i7-8086K 3.7GHz
GeForce GTX 1050 Ti (Desktop)
min:
14 fps, max:
20 fps
fps
100%
GeForce GTX 1050 Ti (Desktop):
200 [X] Aorus Z370 Ultra Gaming Desktop MSI GTX 1050 Ti Intel Core i7-8086K 3.7GHz
GeForce GTX 1050 Ti (Desktop)
fps
100%
GeForce GTX 1050 Ti (Desktop):
71.7 [X] Aorus Z370 Ultra Gaming Desktop MSI GTX 1050 Ti Intel Core i7-8086K 3.7GHz
GeForce GTX 1050 Ti (Desktop)
fps
100%
GeForce GTX 1050 Ti (Desktop):
44.3 □ [X] Aorus Z370 Ultra Gaming Desktop MSI GTX 1050 Ti Intel Core i7-8086K 3.7GHz
GeForce GTX 1050 Ti (Desktop)
fps
100%
GeForce GTX 1050 Ti (Desktop):
32.6 [X] Aorus Z370 Ultra Gaming Desktop MSI GTX 1050 Ti Intel Core i7-8086K 3.7GHz
GeForce GTX 1050 Ti (Desktop)
fps
100%
GeForce GTX 1050 Ti (Desktop):
20.6 [X] Aorus Z370 Ultra Gaming Desktop MSI GTX 1050 Ti Intel Core i7-8086K 3.7GHz
GeForce GTX 1050 Ti (Desktop)
fps
100%
GeForce GTX 1050 Ti (Desktop):
101 [X] Aorus Z370 Ultra Gaming Desktop MSI GTX 1050 Ti Intel Core i7-8086K 3.7GHz
GeForce GTX 1050 Ti (Desktop)
P1:
69 fps
fps
100%
GeForce GTX 1050 Ti (Desktop):
62.9 [X] Aorus Z370 Ultra Gaming Desktop MSI GTX 1050 Ti Intel Core i7-8086K 3.7GHz
GeForce GTX 1050 Ti (Desktop)
P1:
55.2 fps
fps
100%
GeForce GTX 1050 Ti (Desktop):
55.5 [X] Aorus Z370 Ultra Gaming Desktop MSI GTX 1050 Ti Intel Core i7-8086K 3.7GHz
GeForce GTX 1050 Ti (Desktop)
P1:
36.4 fps
fps
100%
GeForce GTX 1050 Ti (Desktop):
52.9 [X] Aorus Z370 Ultra Gaming Desktop MSI GTX 1050 Ti Intel Core i7-8086K 3.7GHz
GeForce GTX 1050 Ti (Desktop)
P1:
33.1 fps
fps
100%
GeForce GTX 1050 Ti (Desktop):
39.3 [X] Aorus Z370 Ultra Gaming Desktop MSI GTX 1050 Ti Intel Core i7-8086K 3.7GHz
GeForce GTX 1050 Ti (Desktop)
P1:
25.4 fps
fps
100%
GeForce GTX 1050 Ti (Desktop):
109 [X] Aorus Z370 Ultra Gaming Desktop MSI GTX 1050 Ti Intel Core i7-8086K 3.7GHz
GeForce GTX 1050 Ti (Desktop)
min:
97 fps, max:
124 fps
fps
105%
GeForce GTX 1650 Max-Q:
114.8 fps
100%
GeForce GTX 1050 Ti (Desktop):
41.6 [X] Aorus Z370 Ultra Gaming Desktop MSI GTX 1050 Ti Intel Core i7-8086K 3.7GHz
GeForce GTX 1050 Ti (Desktop)
min:
39 fps, max:
45 fps
fps
110%
GeForce GTX 1650 Max-Q:
45.6 fps
100%
GeForce GTX 1050 Ti (Desktop):
33.5 [X] Aorus Z370 Ultra Gaming Desktop MSI GTX 1050 Ti Intel Core i7-8086K 3.7GHz
GeForce GTX 1050 Ti (Desktop)
min:
30 fps, max:
36 fps
fps
105%
GeForce GTX 1650 Max-Q:
35.3 fps
100%
GeForce GTX 1050 Ti (Desktop):
50.9 [X] Aorus Z370 Ultra Gaming Desktop MSI GTX 1050 Ti Intel Core i7-8086K 3.7GHz
GeForce GTX 1050 Ti (Desktop)
min:
41 fps, max:
56 fps
fps
100%
GeForce GTX 1050 Ti (Desktop):
40.2 [X] Aorus Z370 Ultra Gaming Desktop MSI GTX 1050 Ti Intel Core i7-8086K 3.7GHz
GeForce GTX 1050 Ti (Desktop)
min:
28 fps, max:
55 fps
fps
100%
GeForce GTX 1050 Ti (Desktop):
32.4 [X] Aorus Z370 Ultra Gaming Desktop MSI GTX 1050 Ti Intel Core i7-8086K 3.7GHz
GeForce GTX 1050 Ti (Desktop)
min:
24 fps, max:
39 fps
fps
100%
GeForce GTX 1050 Ti (Desktop):
75 [X] MSI GeForce GTX 1050 Ti Intel Core i7-7740X 4.3GHz
GeForce GTX 1050 Ti (Desktop)
min:
13 fps, P1:
66.7 fps, max:
140 fps
fps
73%
GeForce GTX 1650 Max-Q:
54.4 56.3 ~ 55 fps
100%
GeForce GTX 1050 Ti (Desktop):
34.8 [X] MSI GeForce GTX 1050 Ti Intel Core i7-7740X 4.3GHz
GeForce GTX 1050 Ti (Desktop)
min:
24 fps, P1:
30.3 fps, max:
135 fps
fps
121%
GeForce GTX 1650 Max-Q:
40.1 43.5 ~ 42 fps
100%
GeForce GTX 1050 Ti (Desktop):
22.3 [X] MSI GeForce GTX 1050 Ti Intel Core i7-7740X 4.3GHz
GeForce GTX 1050 Ti (Desktop)
min:
16.7 fps, P1:
17.5 fps, max:
128 fps
fps
126%
GeForce GTX 1650 Max-Q:
26.5 29.3 ~ 28 fps
100%
GeForce GTX 1050 Ti (Desktop):
14.3 [X] MSI GeForce GTX 1050 Ti Intel Core i7-7740X 4.3GHz
GeForce GTX 1050 Ti (Desktop)
min:
5.82 fps, P1:
10 fps, max:
128 fps
fps
119%
GeForce GTX 1650 Max-Q:
16.2 18.6 ~ 17 fps
GeForce GTX 1650 Max-Q:
50.4 57.2 ~ 54 fps
GeForce GTX 1650 Max-Q:
40.3 49.7 ~ 45 fps
GeForce GTX 1650 Max-Q:
39.6 44.4 ~ 42 fps
GeForce GTX 1650 Max-Q:
12.7 fps
GeForce GTX 1650 Max-Q:
67.6 68.9 ~ 68 fps
GeForce GTX 1650 Max-Q:
50.6 52.2 ~ 51 fps
GeForce GTX 1650 Max-Q:
44 46.8 ~ 45 fps
GeForce GTX 1650 Max-Q:
37.2 40.6 ~ 39 fps
GeForce GTX 1650 Max-Q:
85 94.1 ~ 90 fps
GeForce GTX 1650 Max-Q:
54.8 59 ~ 57 fps
100%
GeForce GTX 1050 Ti (Desktop):
43.2 [X] MSI GeForce GTX 1050 Ti Intel Core i7-7740X 4.3GHz
GeForce GTX 1050 Ti (Desktop)
P1:
31.4 fps
fps
109%
GeForce GTX 1650 Max-Q:
44.1 49.8 ~ 47 fps
100%
GeForce GTX 1050 Ti (Desktop):
33.9 [X] MSI GeForce GTX 1050 Ti Intel Core i7-7740X 4.3GHz
GeForce GTX 1050 Ti (Desktop)
P1:
24.8 fps
fps
118%
GeForce GTX 1650 Max-Q:
38.4 40.6 ~ 40 fps
100%
GeForce GTX 1050 Ti (Desktop):
24 [X] MSI GeForce GTX 1050 Ti Intel Core i7-7740X 4.3GHz
GeForce GTX 1050 Ti (Desktop)
P1:
16.6 fps
fps
GeForce GTX 1650 Max-Q:
60 65.9 ~ 63 fps
GeForce GTX 1650 Max-Q:
47.6 53.4 ~ 51 fps
GeForce GTX 1650 Max-Q:
35.2 36.7 ~ 36 fps
GeForce GTX 1650 Max-Q:
63 75 ~ 69 fps
GeForce GTX 1650 Max-Q:
41 43 ~ 42 fps
GeForce GTX 1650 Max-Q:
39 41 ~ 40 fps
GeForce GTX 1650 Max-Q:
24 26 ~ 25 fps
GeForce GTX 1650 Max-Q:
150 198.6 ~ 174 fps
GeForce GTX 1650 Max-Q:
118 127.9 ~ 123 fps
GeForce GTX 1650 Max-Q:
115 121.5 ~ 118 fps
100%
GeForce GTX 1050 Ti (Desktop):
141 [X] MSI GeForce GTX 1050 Ti Intel Core i7-7740X 4.3GHz
GeForce GTX 1050 Ti (Desktop)
P1:
103.1 fps
fps
82%
GeForce GTX 1650 Max-Q:
114 117.7 ~ 116 fps
100%
GeForce GTX 1050 Ti (Desktop):
107 [X] MSI GeForce GTX 1050 Ti Intel Core i7-7740X 4.3GHz
GeForce GTX 1050 Ti (Desktop)
P1:
84.7 fps
fps
100%
GeForce GTX 1050 Ti (Desktop):
62 [X] MSI GeForce GTX 1050 Ti Intel Core i7-7740X 4.3GHz
GeForce GTX 1050 Ti (Desktop)
P1:
51.5 fps
fps
100%
GeForce GTX 1050 Ti (Desktop):
115 [X] MSI GeForce GTX 1050 Ti Intel Core i7-7740X 4.3GHz
GeForce GTX 1050 Ti (Desktop)
fps
83%
GeForce GTX 1650 Max-Q:
86 103.1 ~ 95 fps
100%
GeForce GTX 1050 Ti (Desktop):
47.5 [X] MSI GeForce GTX 1050 Ti Intel Core i7-7740X 4.3GHz
GeForce GTX 1050 Ti (Desktop)
fps
109%
GeForce GTX 1650 Max-Q:
50.5 53.6 ~ 52 fps
100%
GeForce GTX 1050 Ti (Desktop):
29.6 [X] MSI GeForce GTX 1050 Ti Intel Core i7-7740X 4.3GHz
GeForce GTX 1050 Ti (Desktop)
fps
115%
GeForce GTX 1650 Max-Q:
33.2 34.9 ~ 34 fps
100%
GeForce GTX 1050 Ti (Desktop):
21.8 [X] MSI GeForce GTX 1050 Ti Intel Core i7-7740X 4.3GHz
GeForce GTX 1050 Ti (Desktop)
fps
119%
GeForce GTX 1650 Max-Q:
25.1 26 ~ 26 fps
100%
GeForce GTX 1050 Ti (Desktop):
15 [X] MSI GeForce GTX 1050 Ti Intel Core i7-7740X 4.3GHz
GeForce GTX 1050 Ti (Desktop)
fps
100%
GeForce GTX 1050 Ti (Desktop):
94 [X] MSI GeForce GTX 1050 Ti Intel Core i7-7740X 4.3GHz
GeForce GTX 1050 Ti (Desktop)
min:
81 fps, max:
107 fps
fps
118%
GeForce GTX 1650 Max-Q:
102.8 120 ~ 111 fps
100%
GeForce GTX 1050 Ti (Desktop):
29.9 [X] MSI GeForce GTX 1050 Ti Intel Core i7-7740X 4.3GHz
GeForce GTX 1050 Ti (Desktop)
min:
26 fps, max:
34 fps
fps
127%
GeForce GTX 1650 Max-Q:
36.1 39.9 ~ 38 fps
100%
GeForce GTX 1050 Ti (Desktop):
21.3 [X] MSI GeForce GTX 1050 Ti Intel Core i7-7740X 4.3GHz
GeForce GTX 1050 Ti (Desktop)
min:
18 fps, max:
24 fps
fps
131%
GeForce GTX 1650 Max-Q:
26.3 29.1 ~ 28 fps
100%
GeForce GTX 1050 Ti (Desktop):
164 [X] MSI GeForce GTX 1050 Ti Intel Core i7-7740X 4.3GHz
GeForce GTX 1050 Ti (Desktop)
min:
143 fps, max:
181 fps
fps
77%
GeForce GTX 1650 Max-Q:
127 fps
100%
GeForce GTX 1050 Ti (Desktop):
73 [X] MSI GeForce GTX 1050 Ti Intel Core i7-7740X 4.3GHz
GeForce GTX 1050 Ti (Desktop)
min:
65 fps, max:
77 fps
fps
115%
GeForce GTX 1650 Max-Q:
83 84 ~ 84 fps
100%
GeForce GTX 1050 Ti (Desktop):
52.8 [X] MSI GeForce GTX 1050 Ti Intel Core i7-7740X 4.3GHz
GeForce GTX 1050 Ti (Desktop)
min:
49 fps, max:
55 fps
fps
127%
GeForce GTX 1650 Max-Q:
65 69 ~ 67 fps
100%
GeForce GTX 1050 Ti (Desktop):
37.4 [X] MSI GeForce GTX 1050 Ti Intel Core i7-7740X 4.3GHz
GeForce GTX 1050 Ti (Desktop)
min:
34 fps, max:
39 fps
fps
118%
GeForce GTX 1650 Max-Q:
41 46 ~ 44 fps
100%
GeForce GTX 1050 Ti (Desktop):
29.3 [X] MSI GeForce GTX 1050 Ti Intel Core i7-7740X 4.3GHz
GeForce GTX 1050 Ti (Desktop)
min:
27 fps, max:
30 fps
fps
119%
GeForce GTX 1650 Max-Q:
35 fps
100%
GeForce GTX 1050 Ti (Desktop):
18 [X] MSI GeForce GTX 1050 Ti Intel Core i7-7740X 4.3GHz
GeForce GTX 1050 Ti (Desktop)
min:
15 fps, max:
18 fps
fps
111%
GeForce GTX 1650 Max-Q:
20 fps
100%
GeForce GTX 1050 Ti (Desktop):
153 [X] MSI GeForce GTX 1050 Ti Intel Core i7-7740X 4.3GHz
GeForce GTX 1050 Ti (Desktop)
min:
128 fps, max:
183 fps
fps
98%
GeForce GTX 1650 Max-Q:
150.1 fps
100%
GeForce GTX 1050 Ti (Desktop):
51.4 [X] MSI GeForce GTX 1050 Ti Intel Core i7-7740X 4.3GHz
GeForce GTX 1050 Ti (Desktop)
min:
43 fps, max:
59 fps
fps
102%
GeForce GTX 1650 Max-Q:
52.4 fps
100%
GeForce GTX 1050 Ti (Desktop):
31.5 [X] MSI GeForce GTX 1050 Ti Intel Core i7-7740X 4.3GHz
GeForce GTX 1050 Ti (Desktop)
min:
27 fps, max:
36 fps
fps
101%
GeForce GTX 1650 Max-Q:
31.9 fps
100%
GeForce GTX 1050 Ti (Desktop):
21.4 [X] MSI GeForce GTX 1050 Ti Intel Core i7-7740X 4.3GHz
GeForce GTX 1050 Ti (Desktop)
min:
18 fps, max:
26 fps
fps
107%
GeForce GTX 1650 Max-Q:
23 fps
100%
GeForce GTX 1050 Ti (Desktop):
12.8 [X] MSI GeForce GTX 1050 Ti Intel Core i7-7740X 4.3GHz
GeForce GTX 1050 Ti (Desktop)
min:
11 fps, max:
15 fps
fps
GeForce GTX 1650 Max-Q:
103 fps
GeForce GTX 1650 Max-Q:
43 46.5 ~ 45 fps
GeForce GTX 1650 Max-Q:
36.6 39.7 ~ 38 fps
GeForce GTX 1650 Max-Q:
35.8 38.9 ~ 37 fps
GeForce GTX 1650 Max-Q:
22.4 fps
GeForce GTX 1650 Max-Q:
7.4 fps
GeForce GTX 1650 Max-Q:
60.4 fps
GeForce GTX 1650 Max-Q:
52.2 56.8 ~ 55 fps
GeForce GTX 1650 Max-Q:
34.7 36.2 ~ 35 fps
GeForce GTX 1650 Max-Q:
18 19.2 ~ 19 fps
GeForce GTX 1650 Max-Q:
13.8 fps
GeForce GTX 1650 Max-Q:
8.4 fps
100%
GeForce GTX 1050 Ti (Desktop):
156 [X] MSI GeForce GTX 1050 Ti Intel Core i7-7740X 4.3GHz
GeForce GTX 1050 Ti (Desktop)
min:
64.9351 fps, P1:
104.167 fps, max:
322.581 fps
fps
53%
GeForce GTX 1650 Max-Q:
82 fps
100%
GeForce GTX 1050 Ti (Desktop):
53.6 [X] MSI GeForce GTX 1050 Ti Intel Core i7-7740X 4.3GHz
GeForce GTX 1050 Ti (Desktop)
min:
20.3666 fps, P1:
36.6596 fps, max:
86.9565 fps
fps
101%
GeForce GTX 1650 Max-Q:
51 56 ~ 54 fps
100%
GeForce GTX 1050 Ti (Desktop):
41.4 [X] MSI GeForce GTX 1050 Ti Intel Core i7-7740X 4.3GHz
GeForce GTX 1050 Ti (Desktop)
min:
16.8634 fps, P1:
25.3165 fps, max:
83.3333 fps
fps
104%
GeForce GTX 1650 Max-Q:
41 45 ~ 43 fps
100%
GeForce GTX 1050 Ti (Desktop):
31.5 [X] MSI GeForce GTX 1050 Ti Intel Core i7-7740X 4.3GHz
GeForce GTX 1050 Ti (Desktop)
min:
15.9744 fps, P1:
20.6612 fps, max:
59.8802 fps
fps
98%
GeForce GTX 1650 Max-Q:
30 32 ~ 31 fps
100%
GeForce GTX 1050 Ti (Desktop):
21.5 [X] MSI GeForce GTX 1050 Ti Intel Core i7-7740X 4.3GHz
GeForce GTX 1050 Ti (Desktop)
min:
12.3609 fps, P1:
16.3319 fps, max:
45.6621 fps
fps
93%
GeForce GTX 1650 Max-Q:
20 fps
100%
GeForce GTX 1050 Ti (Desktop):
10.2 [X] MSI GeForce GTX 1050 Ti Intel Core i7-7740X 4.3GHz
GeForce GTX 1050 Ti (Desktop)
min:
3.60881 fps, P1:
7.28385 fps, max:
16.7785 fps
fps
88%
GeForce GTX 1650 Max-Q:
9 fps
100%
GeForce GTX 1050 Ti (Desktop):
149 [X] MSI GeForce GTX 1050 Ti Intel Core i7-7740X 4.3GHz
GeForce GTX 1050 Ti (Desktop)
min:
135 fps, max:
177 fps
fps
103%
GeForce GTX 1650 Max-Q:
154 fps
100%
GeForce GTX 1050 Ti (Desktop):
67 [X] MSI GeForce GTX 1050 Ti Intel Core i7-7740X 4.3GHz
GeForce GTX 1050 Ti (Desktop)
min:
59 fps, max:
81 fps
fps
109%
GeForce GTX 1650 Max-Q:
64 81.6 ~ 73 fps
100%
GeForce GTX 1050 Ti (Desktop):
52.3 [X] MSI GeForce GTX 1050 Ti Intel Core i7-7740X 4.3GHz
GeForce GTX 1050 Ti (Desktop)
min:
46 fps, max:
63 fps
fps
115%
GeForce GTX 1650 Max-Q:
51.1 68.8 ~ 60 fps
100%
GeForce GTX 1050 Ti (Desktop):
32.3 [X] MSI GeForce GTX 1050 Ti Intel Core i7-7740X 4.3GHz
GeForce GTX 1050 Ti (Desktop)
min:
29 fps, max:
39 fps
fps
108%
GeForce GTX 1650 Max-Q:
31.7 38.7 ~ 35 fps
100%
GeForce GTX 1050 Ti (Desktop):
23.5 [X] MSI GeForce GTX 1050 Ti Intel Core i7-7740X 4.3GHz
GeForce GTX 1050 Ti (Desktop)
min:
21 fps, max:
27 fps
fps
98%
GeForce GTX 1650 Max-Q:
23.1 fps
100%
GeForce GTX 1050 Ti (Desktop):
13.4 [X] MSI GeForce GTX 1050 Ti Intel Core i7-7740X 4.3GHz
GeForce GTX 1050 Ti (Desktop)
min:
12 fps, max:
15 fps
fps
GeForce GTX 1650 Max-Q:
51.3 fps
GeForce GTX 1650 Max-Q:
44.6 49.4 ~ 47 fps
GeForce GTX 1650 Max-Q:
40.9 42.6 ~ 42 fps
GeForce GTX 1650 Max-Q:
30.3 34.9 ~ 33 fps
GeForce GTX 1650 Max-Q:
22.6 fps
GeForce GTX 1650 Max-Q:
13.1 fps
100%
GeForce GTX 1050 Ti (Desktop):
87 [X] MSI GeForce GTX 1050 Ti Intel Core i7-7740X 4.3GHz
GeForce GTX 1050 Ti (Desktop)
min:
65 fps, max:
111 fps
fps
64%
GeForce GTX 1650 Max-Q:
39 72 ~ 56 fps
100%
GeForce GTX 1050 Ti (Desktop):
48 [X] MSI GeForce GTX 1050 Ti Intel Core i7-7740X 4.3GHz
GeForce GTX 1050 Ti (Desktop)
min:
38 fps, max:
58 fps
fps
88%
GeForce GTX 1650 Max-Q:
21 52 53 ~ 42 fps
100%
GeForce GTX 1050 Ti (Desktop):
45 [X] MSI GeForce GTX 1050 Ti Intel Core i7-7740X 4.3GHz
GeForce GTX 1050 Ti (Desktop)
min:
36 fps, max:
54 fps
fps
89%
GeForce GTX 1650 Max-Q:
20 49 50 ~ 40 fps
100%
GeForce GTX 1050 Ti (Desktop):
41 [X] MSI GeForce GTX 1050 Ti Intel Core i7-7740X 4.3GHz
GeForce GTX 1050 Ti (Desktop)
min:
31 fps, max:
51 fps
fps
90%
GeForce GTX 1650 Max-Q:
19 46 46 ~ 37 fps
100%
GeForce GTX 1050 Ti (Desktop):
29 [X] MSI GeForce GTX 1050 Ti Intel Core i7-7740X 4.3GHz
GeForce GTX 1050 Ti (Desktop)
min:
23 fps, max:
36 fps
fps
110%
GeForce GTX 1650 Max-Q:
32 fps
100%
GeForce GTX 1050 Ti (Desktop):
14 [X] MSI GeForce GTX 1050 Ti Intel Core i7-7740X 4.3GHz
GeForce GTX 1050 Ti (Desktop)
min:
11 fps, max:
18 fps
fps
114%
GeForce GTX 1650 Max-Q:
16 fps
100%
GeForce GTX 1050 Ti (Desktop):
64.7 [X] MSI GeForce GTX 1050 Ti Intel Core i7-7740X 4.3GHz
GeForce GTX 1050 Ti (Desktop)
min:
34 fps, max:
116 fps
fps
113%
GeForce GTX 1650 Max-Q:
73.3 fps
100%
GeForce GTX 1050 Ti (Desktop):
32.8 [X] MSI GeForce GTX 1050 Ti Intel Core i7-7740X 4.3GHz
GeForce GTX 1050 Ti (Desktop)
min:
17 fps, max:
53 fps
fps
110%
GeForce GTX 1650 Max-Q:
35.4 36.9 ~ 36 fps
100%
GeForce GTX 1050 Ti (Desktop):
24 [X] MSI GeForce GTX 1050 Ti Intel Core i7-7740X 4.3GHz
GeForce GTX 1050 Ti (Desktop)
min:
13 fps, max:
40 fps
fps
113%
GeForce GTX 1650 Max-Q:
26.4 27.5 ~ 27 fps
100%
GeForce GTX 1050 Ti (Desktop):
19.8 [X] MSI GeForce GTX 1050 Ti Intel Core i7-7740X 4.3GHz
GeForce GTX 1050 Ti (Desktop)
min:
11 fps, max:
32 fps
fps
111%
GeForce GTX 1650 Max-Q:
21.6 22.6 ~ 22 fps
GeForce GTX 1650 Max-Q:
16.4 fps
100%
GeForce GTX 1050 Ti (Desktop):
9.2 [X] MSI GeForce GTX 1050 Ti Intel Core i7-7740X 4.3GHz
GeForce GTX 1050 Ti (Desktop)
min:
6 fps, max:
14 fps
fps
108%
GeForce GTX 1650 Max-Q:
9.9 fps
100%
GeForce GTX 1050 Ti (Desktop):
128 [X] MSI GeForce GTX 1050 Ti Intel Core i7-7740X 4.3GHz
GeForce GTX 1050 Ti (Desktop)
min:
115 fps, max:
144 fps
fps
113%
GeForce GTX 1650 Max-Q:
143.9 144 ~ 144 fps
100%
GeForce GTX 1050 Ti (Desktop):
55.6 [X] MSI GeForce GTX 1050 Ti Intel Core i7-7740X 4.3GHz
GeForce GTX 1050 Ti (Desktop)
min:
46 fps, max:
69 fps
fps
100%
GeForce GTX 1050 Ti (Desktop):
46.7 [X] MSI GeForce GTX 1050 Ti Intel Core i7-7740X 4.3GHz
GeForce GTX 1050 Ti (Desktop)
min:
41 fps, max:
57 fps
fps
100%
GeForce GTX 1050 Ti (Desktop):
45 [X] MSI GeForce GTX 1050 Ti Intel Core i7-7740X 4.3GHz
GeForce GTX 1050 Ti (Desktop)
min:
33 fps, max:
57 fps
fps
100%
GeForce GTX 1050 Ti (Desktop):
28.8 [X] MSI GeForce GTX 1050 Ti Intel Core i7-7740X 4.3GHz
GeForce GTX 1050 Ti (Desktop)
min:
25 fps, max:
37 fps
fps
138%
GeForce GTX 1650 Max-Q:
39.7 fps
100%
GeForce GTX 1050 Ti (Desktop):
14.1 [X] MSI GeForce GTX 1050 Ti Intel Core i7-7740X 4.3GHz
GeForce GTX 1050 Ti (Desktop)
min:
11 fps, max:
18 fps
fps
155%
GeForce GTX 1650 Max-Q:
21.9 fps
GeForce GTX 1650 Max-Q:
59 fps
100%
GeForce GTX 1050 Ti (Desktop):
41.9 [X] MSI GeForce GTX 1050 Ti Intel Core i7-7740X 4.3GHz
GeForce GTX 1050 Ti (Desktop)
min:
38 fps, max:
45 fps
fps
102%
GeForce GTX 1650 Max-Q:
42.6 fps
100%
GeForce GTX 1050 Ti (Desktop):
40.1 [X] MSI GeForce GTX 1050 Ti Intel Core i7-7740X 4.3GHz
GeForce GTX 1050 Ti (Desktop)
min:
37 fps, max:
44 fps
fps
99%
GeForce GTX 1650 Max-Q:
39.7 fps
GeForce GTX 1650 Max-Q:
26.2 fps
GeForce GTX 1650 Max-Q:
13.2 fps
GeForce GTX 1650 Max-Q:
67.4 fps
100%
GeForce GTX 1050 Ti (Desktop):
50.9 [X] MSI GeForce GTX 1050 Ti Intel Core i7-7740X 4.3GHz
GeForce GTX 1050 Ti (Desktop)
min:
45 fps, max:
58 fps
fps
105%
GeForce GTX 1650 Max-Q:
53.4 fps
100%
GeForce GTX 1050 Ti (Desktop):
43.3 [X] MSI GeForce GTX 1050 Ti Intel Core i7-7740X 4.3GHz
GeForce GTX 1050 Ti (Desktop)
min:
39 fps, max:
49 fps
fps
109%
GeForce GTX 1650 Max-Q:
47.1 fps
GeForce GTX 1650 Max-Q:
29.3 fps
GeForce GTX 1650 Max-Q:
9.7 fps
100%
GeForce GTX 1050 Ti (Desktop):
140 [X] MSI GeForce GTX 1050 Ti Intel Core i7-7740X 4.3GHz
GeForce GTX 1050 Ti (Desktop)
min:
107 fps, max:
186 fps
fps
100%
GeForce GTX 1050 Ti (Desktop):
63 [X] MSI GeForce GTX 1050 Ti Intel Core i7-7740X 4.3GHz
GeForce GTX 1050 Ti (Desktop)
min:
52 fps, max:
92 fps
fps
101%
GeForce GTX 1650 Max-Q:
63.6 fps
100%
GeForce GTX 1050 Ti (Desktop):
51.9 [X] MSI GeForce GTX 1050 Ti Intel Core i7-7740X 4.3GHz
GeForce GTX 1050 Ti (Desktop)
min:
42 fps, max:
79 fps
fps
104%
GeForce GTX 1650 Max-Q:
54.1 fps
100%
GeForce GTX 1050 Ti (Desktop):
50.9 [X] MSI GeForce GTX 1050 Ti Intel Core i7-7740X 4.3GHz
GeForce GTX 1050 Ti (Desktop)
min:
41 fps, max:
78 fps
fps
97%
GeForce GTX 1650 Max-Q:
49.3 fps
100%
GeForce GTX 1050 Ti (Desktop):
35.6 [X] MSI GeForce GTX 1050 Ti Intel Core i7-7740X 4.3GHz
GeForce GTX 1050 Ti (Desktop)
min:
29 fps, max:
55 fps
fps
101%
GeForce GTX 1650 Max-Q:
36.1 fps
100%
GeForce GTX 1050 Ti (Desktop):
17.5 [X] MSI GeForce GTX 1050 Ti Intel Core i7-7740X 4.3GHz
GeForce GTX 1050 Ti (Desktop)
min:
13 fps, max:
29 fps
fps
111%
GeForce GTX 1650 Max-Q:
19.4 fps
GeForce GTX 1650 Max-Q:
136 fps
GeForce GTX 1650 Max-Q:
84 fps
100%
GeForce GTX 1050 Ti (Desktop):
60 [X] MSI GeForce GTX 1050 Ti Intel Core i7-7740X 4.3GHz
GeForce GTX 1050 Ti (Desktop)
min:
48 fps, max:
93 fps
fps
101%
GeForce GTX 1650 Max-Q:
60.6 fps
GeForce GTX 1650 Max-Q:
40.7 fps
100%
GeForce GTX 1050 Ti (Desktop):
20.3 [X] MSI GeForce GTX 1050 Ti Intel Core i7-7740X 4.3GHz
GeForce GTX 1050 Ti (Desktop)
min:
16 fps, max:
36 fps
fps
100%
GeForce GTX 1050 Ti (Desktop):
46.4 [X] MSI GeForce GTX 1050 Ti Intel Core i7-7740X 4.3GHz
GeForce GTX 1050 Ti (Desktop)
min:
37 fps, max:
57 fps
fps
100%
GeForce GTX 1050 Ti (Desktop):
30.7 [X] MSI GeForce GTX 1050 Ti Intel Core i7-7740X 4.3GHz
GeForce GTX 1050 Ti (Desktop)
min:
23 fps, max:
36 fps
fps
GeForce GTX 1650 Max-Q:
53.1 fps
GeForce GTX 1650 Max-Q:
47.6 fps
100%
GeForce GTX 1050 Ti (Desktop):
39.1 [X] MSI GeForce GTX 1050 Ti Intel Core i7-7740X 4.3GHz
GeForce GTX 1050 Ti (Desktop)
min:
32 fps, max:
47 fps
fps
114%
GeForce GTX 1650 Max-Q:
44.4 fps
GeForce GTX 1650 Max-Q:
28.6 fps
GeForce GTX 1650 Max-Q:
14.1 fps
100%
GeForce GTX 1050 Ti (Desktop):
53 [X] MSI GeForce GTX 1050 Ti Intel Core i7-7740X 4.3GHz
GeForce GTX 1050 Ti (Desktop)
min:
34 fps, max:
73 fps
fps
118%
GeForce GTX 1650 Max-Q:
62.7 fps
100%
GeForce GTX 1050 Ti (Desktop):
47.3 [X] MSI GeForce GTX 1050 Ti Intel Core i7-7740X 4.3GHz
GeForce GTX 1050 Ti (Desktop)
min:
34 fps, max:
63 fps
fps
124%
GeForce GTX 1650 Max-Q:
58.5 fps
100%
GeForce GTX 1050 Ti (Desktop):
41.6 [X] MSI GeForce GTX 1050 Ti Intel Core i7-7740X 4.3GHz
GeForce GTX 1050 Ti (Desktop)
min:
30 fps, max:
57 fps
fps
122%
GeForce GTX 1650 Max-Q:
50.9 fps
GeForce GTX 1650 Max-Q:
32.7 fps
GeForce GTX 1650 Max-Q:
10.9 fps
100%
GeForce GTX 1050 Ti (Desktop):
48 [X] MSI GeForce GTX 1050 Ti Intel Core i7-7740X 4.3GHz
GeForce GTX 1050 Ti (Desktop)
min:
18 fps, max:
101 fps
fps
102%
GeForce GTX 1650 Max-Q:
49 fps
100%
GeForce GTX 1050 Ti (Desktop):
40 [X] MSI GeForce GTX 1050 Ti Intel Core i7-7740X 4.3GHz
GeForce GTX 1050 Ti (Desktop)
min:
17 fps, max:
86 fps
fps
103%
GeForce GTX 1650 Max-Q:
41 fps
100%
GeForce GTX 1050 Ti (Desktop):
24 [X] MSI GeForce GTX 1050 Ti Intel Core i7-7740X 4.3GHz
GeForce GTX 1050 Ti (Desktop)
min:
12 fps, max:
54 fps
fps
83%
GeForce GTX 1650 Max-Q:
20 fps
GeForce GTX 1650 Max-Q:
17 fps
GeForce GTX 1650 Max-Q:
8 fps
100%
GeForce GTX 1050 Ti (Desktop):
133 [X] MSI GeForce GTX 1050 Ti Intel Core i7-7740X 4.3GHz
GeForce GTX 1050 Ti (Desktop)
min:
115 fps, max:
174 fps
fps
84%
GeForce GTX 1650 Max-Q:
112 fps
100%
GeForce GTX 1050 Ti (Desktop):
69 [X] MSI GeForce GTX 1050 Ti Intel Core i7-7740X 4.3GHz
GeForce GTX 1050 Ti (Desktop)
min:
60 fps, max:
87 fps
fps
107%
GeForce GTX 1650 Max-Q:
74 fps
100%
GeForce GTX 1050 Ti (Desktop):
64 [X] MSI GeForce GTX 1050 Ti Intel Core i7-7740X 4.3GHz
GeForce GTX 1050 Ti (Desktop)
min:
56 fps, max:
80 fps
fps
108%
GeForce GTX 1650 Max-Q:
69 fps
100%
GeForce GTX 1050 Ti (Desktop):
45 [X] MSI GeForce GTX 1050 Ti Intel Core i7-7740X 4.3GHz
GeForce GTX 1050 Ti (Desktop)
min:
37 fps, max:
58 fps
fps
122%
GeForce GTX 1650 Max-Q:
55 fps
100%
GeForce GTX 1050 Ti (Desktop):
20 [X] MSI GeForce GTX 1050 Ti Intel Core i7-7740X 4.3GHz
GeForce GTX 1050 Ti (Desktop)
min:
13.5 fps, max:
25.2 fps
fps
GeForce GTX 1650 Max-Q:
195 fps
GeForce GTX 1650 Max-Q:
179 fps
100%
GeForce GTX 1050 Ti (Desktop):
105 [X] MSI GeForce GTX 1050 Ti Intel Core i7-7740X 4.3GHz
GeForce GTX 1050 Ti (Desktop)
min:
86 fps, max:
113 fps
fps
165%
GeForce GTX 1650 Max-Q:
173 fps
100%
GeForce GTX 1050 Ti (Desktop):
75 [X] MSI GeForce GTX 1050 Ti Intel Core i7-7740X 4.3GHz
GeForce GTX 1050 Ti (Desktop)
min:
60 fps, max:
80 fps
fps
165%
GeForce GTX 1650 Max-Q:
124 fps
100%
GeForce GTX 1050 Ti (Desktop):
40.1 [X] MSI GeForce GTX 1050 Ti Intel Core i7-7740X 4.3GHz
GeForce GTX 1050 Ti (Desktop)
min:
33 fps, max:
43 fps
fps
162%
GeForce GTX 1650 Max-Q:
64.8 fps
100%
GeForce GTX 1050 Ti (Desktop):
31 [X] MSI GeForce GTX 1050 Ti Intel Core i7-7740X 4.3GHz
GeForce GTX 1050 Ti (Desktop)
min:
23 fps, max:
61 fps
fps
100%
GeForce GTX 1050 Ti (Desktop):
29 [X] MSI GeForce GTX 1050 Ti Intel Core i7-7740X 4.3GHz
GeForce GTX 1050 Ti (Desktop)
min:
23 fps, max:
55 fps
fps
100%
GeForce GTX 1050 Ti (Desktop):
25 [X] MSI GeForce GTX 1050 Ti Intel Core i7-7740X 4.3GHz
GeForce GTX 1050 Ti (Desktop)
min:
17 fps, max:
47 fps
fps
GeForce GTX 1650 Max-Q:
24 fps
GeForce GTX 1650 Max-Q:
12 fps
100%
GeForce GTX 1050 Ti (Desktop):
169 [X] Aorus Z370 Ultra Gaming Desktop MSI GTX 1050 Ti 1.47.22.14 D3D12
Intel Core i7-8086K 3.7GHz
GeForce GTX 1050 Ti (Desktop)
min:
133 fps, P1:
138 fps, max:
237 fps
fps
100%
GeForce GTX 1050 Ti (Desktop):
66.6 [X] Aorus Z370 Ultra Gaming Desktop MSI GTX 1050 Ti 1.47.22.14 D3D12
Intel Core i7-8086K 3.7GHz
GeForce GTX 1050 Ti (Desktop)
min:
56.2 fps, P1:
57.3 fps, max:
82.7 fps
fps
100%
GeForce GTX 1050 Ti (Desktop):
49.8 [X] Aorus Z370 Ultra Gaming Desktop MSI GTX 1050 Ti 1.47.22.14 D3D12
Intel Core i7-8086K 3.7GHz
GeForce GTX 1050 Ti (Desktop)
min:
39.1 fps, P1:
39.7 fps, max:
71.6 fps
fps
100%
GeForce GTX 1050 Ti (Desktop):
42.5 [X] Aorus Z370 Ultra Gaming Desktop MSI GTX 1050 Ti 1.47.22.14 D3D12
Intel Core i7-8086K 3.7GHz
GeForce GTX 1050 Ti (Desktop)
min:
33.5 fps, P1:
34.4 fps, max:
60 fps
fps
100%
GeForce GTX 1050 Ti (Desktop):
30.2 [X] Aorus Z370 Ultra Gaming Desktop MSI GTX 1050 Ti 1.47.22.14 D3D12
Intel Core i7-8086K 3.7GHz
GeForce GTX 1050 Ti (Desktop)
min:
25.3 fps, P1:
25.6 fps, max:
40.6 fps
fps
100%
GeForce GTX 1050 Ti (Desktop):
17 [X] Aorus Z370 Ultra Gaming Desktop MSI GTX 1050 Ti 1.47.22.14 D3D12
Intel Core i7-8086K 3.7GHz
GeForce GTX 1050 Ti (Desktop)
min:
14.3 fps, P1:
14.7 fps, max:
22.8 fps
fps
100%
GeForce GTX 1050 Ti (Desktop):
136 [X] MSI GeForce GTX 1050 Ti Intel Core i7-7740X 4.3GHz
GeForce GTX 1050 Ti (Desktop)
min:
105 fps, max:
159 fps
fps
100%
GeForce GTX 1050 Ti (Desktop):
80 [X] MSI GeForce GTX 1050 Ti Intel Core i7-7740X 4.3GHz
GeForce GTX 1050 Ti (Desktop)
min:
67 fps, max:
90 fps
fps
100%
GeForce GTX 1050 Ti (Desktop):
63 [X] MSI GeForce GTX 1050 Ti Intel Core i7-7740X 4.3GHz
GeForce GTX 1050 Ti (Desktop)
min:
55 fps, max:
67 fps
fps
100%
GeForce GTX 1050 Ti (Desktop):
42.4 [X] MSI GeForce GTX 1050 Ti Intel Core i7-7740X 4.3GHz
GeForce GTX 1050 Ti (Desktop)
min:
36 fps, max:
46 fps
fps
100%
GeForce GTX 1050 Ti (Desktop):
29.5 [X] MSI GeForce GTX 1050 Ti Intel Core i7-7740X 4.3GHz
GeForce GTX 1050 Ti (Desktop)
min:
26 fps, max:
31 fps
fps
100%
GeForce GTX 1050 Ti (Desktop):
18.3 [X] MSI GeForce GTX 1050 Ti Intel Core i7-7740X 4.3GHz
GeForce GTX 1050 Ti (Desktop)
min:
16 fps, max:
19 fps
fps
GeForce GTX 1650 Max-Q:
46.3 fps
GeForce GTX 1650 Max-Q:
40.1 fps
GeForce GTX 1650 Max-Q:
31.4 fps
GeForce GTX 1650 Max-Q:
19.2 fps
GeForce GTX 1650 Max-Q:
8.9 fps
GeForce GTX 1650 Max-Q:
59.3 fps
GeForce GTX 1650 Max-Q:
49.1 fps
GeForce GTX 1650 Max-Q:
42 fps
GeForce GTX 1650 Max-Q:
26.4 fps
GeForce GTX 1650 Max-Q:
13 fps
GeForce GTX 1650 Max-Q:
47 91 ~ 69 fps
GeForce GTX 1650 Max-Q:
24 52 ~ 38 fps
GeForce GTX 1650 Max-Q:
22 48 ~ 35 fps
100%
GeForce GTX 1050 Ti (Desktop):
36 [X] MSI GeForce GTX 1050 Ti Intel Core i7-7740X 4.3GHz
GeForce GTX 1050 Ti (Desktop)
min:
32 fps, max:
42 fps
fps
92%
GeForce GTX 1650 Max-Q:
21 45 ~ 33 fps
GeForce GTX 1650 Max-Q:
414.6 fps
GeForce GTX 1650 Max-Q:
160.1 fps
GeForce GTX 1650 Max-Q:
59.4 fps
100%
GeForce GTX 1050 Ti (Desktop):
94 [X] Asus Prime X299 Deluxe XMP OC Intel Core i9-9980XE @4.4GHz
GeForce GTX 1050 Ti (Desktop)
102 [X] MSI GeForce GTX 1050 Ti Intel Core i7-7740X 4.3GHz
GeForce GTX 1050 Ti (Desktop)
~ 98 fps
100%
GeForce GTX 1050 Ti (Desktop):
86 [X] Asus Prime X299 Deluxe XMP OC Intel Core i9-9980XE @4.4GHz
GeForce GTX 1050 Ti (Desktop)
92 [X] MSI GeForce GTX 1050 Ti Intel Core i7-7740X 4.3GHz
GeForce GTX 1050 Ti (Desktop)
~ 89 fps
100%
GeForce GTX 1050 Ti (Desktop):
74 [X] Asus Prime X299 Deluxe XMP OC Intel Core i9-9980XE @4.4GHz
GeForce GTX 1050 Ti (Desktop)
79 [X] MSI GeForce GTX 1050 Ti Intel Core i7-7740X 4.3GHz
GeForce GTX 1050 Ti (Desktop)
~ 77 fps
100%
GeForce GTX 1050 Ti (Desktop):
41.7 [X] MSI GeForce GTX 1050 Ti Intel Core i7-7740X 4.3GHz
GeForce GTX 1050 Ti (Desktop)
fps
GeForce GTX 1650 Max-Q:
48.1 fps
100%
GeForce GTX 1050 Ti (Desktop):
35.2 [X] Intel Core i7-4790K 4GHz
GeForce GTX 1050 Ti (Desktop)
min:
28 fps, max:
41 fps
fps
108%
GeForce GTX 1650 Max-Q:
38 fps
100%
GeForce GTX 1050 Ti (Desktop):
26.6 [X] Intel Core i7-4790K 4GHz
GeForce GTX 1050 Ti (Desktop)
min:
20 fps, max:
32 fps
fps
99%
GeForce GTX 1650 Max-Q:
26.4 fps
GeForce GTX 1650 Max-Q:
18.5 fps
GeForce GTX 1650 Max-Q:
9.4 fps
100%
GeForce GTX 1050 Ti (Desktop):
62 [X] Intel Core i7-4790K 4GHz
GeForce GTX 1050 Ti (Desktop)
min:
41 fps, max:
78 fps
fps
115%
GeForce GTX 1650 Max-Q:
51.7 91.2 ~ 71 fps
100%
GeForce GTX 1050 Ti (Desktop):
33.3 [X] Intel Core i7-4790K 4GHz
GeForce GTX 1050 Ti (Desktop)
min:
26 fps, max:
45 fps
fps
100%
GeForce GTX 1050 Ti (Desktop):
22.7 [X] Intel Core i7-4790K 4GHz
GeForce GTX 1050 Ti (Desktop)
max:
36 fps
fps
GeForce GTX 1650 Max-Q:
23.4 fps
GeForce GTX 1650 Max-Q:
8.7 9.6 ~ 9 fps
GeForce GTX 1650 Max-Q:
138 fps
100%
GeForce GTX 1050 Ti (Desktop):
65 [X] Intel Core i7-4790K 4GHz
GeForce GTX 1050 Ti (Desktop)
min:
53 fps, max:
78 fps
fps
123%
GeForce GTX 1650 Max-Q:
79.9 fps
100%
GeForce GTX 1050 Ti (Desktop):
44.8 [X] Intel Core i7-4790K 4GHz
GeForce GTX 1050 Ti (Desktop)
min:
36 fps, max:
55 fps
fps
132%
GeForce GTX 1650 Max-Q:
59.1 fps
GeForce GTX 1650 Max-Q:
36.2 fps
100%
GeForce GTX 1050 Ti (Desktop):
12.5 [X] Intel Core i7-4790K 4GHz
GeForce GTX 1050 Ti (Desktop)
min:
9 fps, max:
15 fps
fps
87%
GeForce GTX 1650 Max-Q:
10.9 fps
GeForce GTX 1650 Max-Q:
72.2 fps
GeForce GTX 1650 Max-Q:
62.3 fps
GeForce GTX 1650 Max-Q:
46.5 fps
GeForce GTX 1650 Max-Q:
29.4 fps
GeForce GTX 1650 Max-Q:
5.6 fps
GeForce GTX 1650 Max-Q:
72.3 fps
GeForce GTX 1650 Max-Q:
61.8 fps
GeForce GTX 1650 Max-Q:
58.9 fps
GeForce GTX 1650 Max-Q:
38.6 fps
GeForce GTX 1650 Max-Q:
19.1 fps
GeForce GTX 1650 Max-Q:
61.1 fps
GeForce GTX 1650 Max-Q:
48.6 fps
GeForce GTX 1650 Max-Q:
37.3 fps
GeForce GTX 1650 Max-Q:
24.5 fps
GeForce GTX 1650 Max-Q:
12.2 fps
GeForce GTX 1650 Max-Q:
64 fps
GeForce GTX 1650 Max-Q:
47 fps
GeForce GTX 1650 Max-Q:
35 fps
GeForce GTX 1650 Max-Q:
14 fps
GeForce GTX 1070 SLI (Laptop):
330 [X] Aorus X9 Intel Core i7-7820HK @4.1GHz
GeForce GTX 1070 SLI (Laptop)
fps
GeForce GTX 1070 SLI (Laptop):
310 [X] Aorus X9 Intel Core i7-7820HK @4.1GHz
GeForce GTX 1070 SLI (Laptop)
fps
GeForce GTX 1070 SLI (Laptop):
187 [X] Aorus X9 Intel Core i7-7820HK @4.1GHz
GeForce GTX 1070 SLI (Laptop)
fps
GeForce GTX 1070 SLI (Laptop):
88.6 [X] Aorus X9 Intel Core i7-7820HK @4.1GHz
GeForce GTX 1070 SLI (Laptop)
fps
GeForce GTX 1070 SLI (Laptop):
53 [X] Aorus X9 Intel Core i7-7820HK @4.1GHz
GeForce GTX 1070 SLI (Laptop)
fps
GeForce GTX 1070 SLI (Laptop):
25.8 [X] Aorus X9 Intel Core i7-7820HK @4.1GHz
GeForce GTX 1070 SLI (Laptop)
fps
GeForce GTX 1070 SLI (Laptop):
132 [X] Aorus X9 Intel Core i7-7820HK @4.1GHz
GeForce GTX 1070 SLI (Laptop)
fps
GeForce GTX 1070 SLI (Laptop):
89 [X] Aorus X9 Intel Core i7-7820HK @4.1GHz
GeForce GTX 1070 SLI (Laptop)
fps
GeForce GTX 1070 SLI (Laptop):
42 [X] Aorus X9 Intel Core i7-7820HK @4.1GHz
GeForce GTX 1070 SLI (Laptop)
fps
100%
GeForce GTX 1050 Ti (Desktop):
127 [X] Intel Core i7-4790K 4GHz
GeForce GTX 1050 Ti (Desktop)
min:
85 fps, max:
144 fps
fps
100%
GeForce GTX 1050 Ti (Desktop):
55.1 [X] Intel Core i7-4790K 4GHz
GeForce GTX 1050 Ti (Desktop)
min:
43 fps, max:
64 fps
fps
154%
GeForce GTX 1650 Max-Q:
84.6 fps
100%
GeForce GTX 1050 Ti (Desktop):
49.5 [X] Intel Core i7-4790K 4GHz
GeForce GTX 1050 Ti (Desktop)
min:
38 fps, max:
57 fps
fps
143%
GeForce GTX 1650 Max-Q:
70.8 fps
206%
GeForce GTX 1070 SLI (Laptop):
102 [X] Aorus X9 Intel Core i7-7820HK @4.1GHz
GeForce GTX 1070 SLI (Laptop)
fps
100%
GeForce GTX 1050 Ti (Desktop):
35.5 [X] Intel Core i7-4790K 4GHz
GeForce GTX 1050 Ti (Desktop)
min:
25 fps, max:
40 fps
fps
148%
GeForce GTX 1650 Max-Q:
52.6 fps
263%
GeForce GTX 1070 SLI (Laptop):
93.3 [X] Aorus X9 Intel Core i7-7820HK @4.1GHz
GeForce GTX 1070 SLI (Laptop)
fps
100%
GeForce GTX 1050 Ti (Desktop):
11.4 [X] Intel Core i7-4790K 4GHz
GeForce GTX 1050 Ti (Desktop)
min:
8 fps, max:
13 fps
fps
146%
GeForce GTX 1650 Max-Q:
16.6 fps
325%
GeForce GTX 1070 SLI (Laptop):
37.1 [X] Aorus X9 Intel Core i7-7820HK @4.1GHz
GeForce GTX 1070 SLI (Laptop)
fps
GeForce GTX 1070 SLI (Laptop):
115 [X] Aorus X9 Intel Core i7-7820HK @4.1GHz
GeForce GTX 1070 SLI (Laptop)
fps
GeForce GTX 1070 SLI (Laptop):
70.4 [X] Aorus X9 Intel Core i7-7820HK @4.1GHz
GeForce GTX 1070 SLI (Laptop)
fps
100%
GeForce GTX 1050 Ti (Desktop):
52.2 [X] MSI GeForce GTX 1050 Ti Intel Core i7-7740X 4.3GHz
GeForce GTX 1050 Ti (Desktop)
min:
38 fps, max:
74 fps
fps
420%
GeForce GTX 1070 SLI (Laptop):
219 [X] Aorus X9 Intel Core i7-7820HK @4.1GHz
GeForce GTX 1070 SLI (Laptop)
fps
100%
GeForce GTX 1050 Ti (Desktop):
30.7 [X] MSI GeForce GTX 1050 Ti Intel Core i7-7740X 4.3GHz
GeForce GTX 1050 Ti (Desktop)
min:
24 fps, max:
43 fps
fps
139%
GeForce GTX 1650 Max-Q:
42.7 fps
459%
GeForce GTX 1070 SLI (Laptop):
141 [X] Aorus X9 Intel Core i7-7820HK @4.1GHz
GeForce GTX 1070 SLI (Laptop)
fps
100%
GeForce GTX 1050 Ti (Desktop):
143 [X] Intel Core i7-4790K 4GHz
GeForce GTX 1050 Ti (Desktop)
fps
GeForce GTX 1650 Max-Q:
97.5 fps
100%
GeForce GTX 1050 Ti (Desktop):
82 [X] Intel Core i7-4790K 4GHz
GeForce GTX 1050 Ti (Desktop)
min:
66 fps, max:
105 fps
fps
94%
GeForce GTX 1650 Max-Q:
77.3 fps
171%
GeForce GTX 1070 SLI (Laptop):
140 [X] Aorus X9 Intel Core i7-7820HK @4.1GHz
GeForce GTX 1070 SLI (Laptop)
fps
100%
GeForce GTX 1050 Ti (Desktop):
66.6 [X] Intel Core i7-4790K 4GHz
GeForce GTX 1050 Ti (Desktop)
min:
56 fps, max:
84 fps
fps
101%
GeForce GTX 1650 Max-Q:
67.1 fps
206%
GeForce GTX 1070 SLI (Laptop):
137 [X] Aorus X9 Intel Core i7-7820HK @4.1GHz
GeForce GTX 1070 SLI (Laptop)
fps
100%
GeForce GTX 1050 Ti (Desktop):
23 [X] Intel Core i7-4790K 4GHz
GeForce GTX 1050 Ti (Desktop)
min:
19 fps, max:
29 fps
fps
103%
GeForce GTX 1650 Max-Q:
23.6 fps
344%
GeForce GTX 1070 SLI (Laptop):
79.1 [X] Aorus X9 Intel Core i7-7820HK @4.1GHz
GeForce GTX 1070 SLI (Laptop)
fps
100%
GeForce GTX 1050 Ti (Desktop):
30 [X] Intel Core i7-4790K 4GHz
GeForce GTX 1050 Ti (Desktop)
min:
23 fps, max:
43 fps
fps
100%
GeForce GTX 1050 Ti (Desktop):
25.9 [X] Intel Core i7-4790K 4GHz
GeForce GTX 1050 Ti (Desktop)
min:
20 fps, max:
37 fps
fps
100%
GeForce GTX 1050 Ti (Desktop):
52.7 [X] Intel Core i7-4790K 4GHz
GeForce GTX 1050 Ti (Desktop)
min:
40 fps, max:
71 fps
fps
100%
GeForce GTX 1050 Ti (Desktop):
34.8 [X] Intel Core i7-4790K 4GHz
GeForce GTX 1050 Ti (Desktop)
min:
30 fps, max:
46 fps
fps
100%
GeForce GTX 1050 Ti (Desktop):
31.4 [X] Intel Core i7-4790K 4GHz
GeForce GTX 1050 Ti (Desktop)
min:
28 fps, max:
40 fps
fps
100%
GeForce GTX 1050 Ti (Desktop):
13.2 [X] Intel Core i7-4790K 4GHz
GeForce GTX 1050 Ti (Desktop)
min:
12 fps, max:
16 fps
fps
GeForce GTX 1650 Max-Q:
48.5 fps
GeForce GTX 1650 Max-Q:
44.4 fps
GeForce GTX 1070 SLI (Laptop):
112 [X] Aorus X9 Intel Core i7-7820HK @4.1GHz
GeForce GTX 1070 SLI (Laptop)
fps
GeForce GTX 1650 Max-Q:
21.7 fps
GeForce GTX 1070 SLI (Laptop):
68.8 [X] Aorus X9 Intel Core i7-7820HK @4.1GHz
GeForce GTX 1070 SLI (Laptop)
fps
GeForce GTX 1650 Max-Q:
14.6 fps
GeForce GTX 1070 SLI (Laptop):
53.1 [X] Aorus X9 Intel Core i7-7820HK @4.1GHz
GeForce GTX 1070 SLI (Laptop)
fps
100%
GeForce GTX 1050 Ti (Desktop):
198 [X] Intel Core i7-4790K 4GHz
GeForce GTX 1050 Ti (Desktop)
min:
152 fps, max:
257 fps
fps
100%
GeForce GTX 1050 Ti (Desktop):
71.4 [X] Intel Core i7-4790K 4GHz
GeForce GTX 1050 Ti (Desktop)
min:
58 fps, max:
83 fps
fps
94%
GeForce GTX 1650 Max-Q:
66.8 fps
100%
GeForce GTX 1050 Ti (Desktop):
68 [X] Intel Core i7-4790K 4GHz
GeForce GTX 1050 Ti (Desktop)
min:
54 fps, max:
81 fps
fps
94%
GeForce GTX 1650 Max-Q:
63.8 fps
260%
GeForce GTX 1070 SLI (Laptop):
177 [X] Aorus X9 Intel Core i7-7820HK @4.1GHz
GeForce GTX 1070 SLI (Laptop)
fps
100%
GeForce GTX 1050 Ti (Desktop):
48.9 [X] Intel Core i7-4790K 4GHz
GeForce GTX 1050 Ti (Desktop)
min:
35 fps, max:
67 fps
fps
101%
GeForce GTX 1650 Max-Q:
49.4 fps
333%
GeForce GTX 1070 SLI (Laptop):
163 [X] Aorus X9 Intel Core i7-7820HK @4.1GHz
GeForce GTX 1070 SLI (Laptop)
fps
100%
GeForce GTX 1050 Ti (Desktop):
19.7 [X] Intel Core i7-4790K 4GHz
GeForce GTX 1050 Ti (Desktop)
min:
15 fps, max:
43 fps
fps
97%
GeForce GTX 1650 Max-Q:
19.1 fps
426%
GeForce GTX 1070 SLI (Laptop):
83.9 [X] Aorus X9 Intel Core i7-7820HK @4.1GHz
GeForce GTX 1070 SLI (Laptop)
fps
GeForce GTX 1650 Max-Q:
146 fps
100%
GeForce GTX 1050 Ti (Desktop):
70 [X] Intel Core i7-4790K 4GHz
GeForce GTX 1050 Ti (Desktop)
min:
56 fps, max:
81 fps
fps
113%
GeForce GTX 1650 Max-Q:
78.8 fps
209%
GeForce GTX 1070 SLI (Laptop):
146 [X] Aorus X9 Intel Core i7-7820HK @4.1GHz
GeForce GTX 1070 SLI (Laptop)
fps
100%
GeForce GTX 1050 Ti (Desktop):
58.4 [X] Intel Core i7-4790K 4GHz
GeForce GTX 1050 Ti (Desktop)
min:
48 fps, max:
68 fps
fps
112%
GeForce GTX 1650 Max-Q:
65.2 fps
211%
GeForce GTX 1070 SLI (Laptop):
123 [X] Aorus X9 Intel Core i7-7820HK @4.1GHz
GeForce GTX 1070 SLI (Laptop)
fps
100%
GeForce GTX 1050 Ti (Desktop):
18.6 [X] Intel Core i7-4790K 4GHz
GeForce GTX 1050 Ti (Desktop)
min:
15 fps, max:
23 fps
fps
116%
GeForce GTX 1650 Max-Q:
21.5 fps
226%
GeForce GTX 1070 SLI (Laptop):
42 [X] Aorus X9 Intel Core i7-7820HK @4.1GHz
GeForce GTX 1070 SLI (Laptop)
fps
100%
GeForce GTX 1050 Ti (Desktop):
45.4 [X] Intel Core i7-4790K 4GHz
GeForce GTX 1050 Ti (Desktop)
min:
40 fps, max:
51 fps
fps
244%
GeForce GTX 1070 SLI (Laptop):
111 [X] Aorus X9 Intel Core i7-7820HK @4.1GHz
GeForce GTX 1070 SLI (Laptop)
fps
100%
GeForce GTX 1050 Ti (Desktop):
28.5 [X] Intel Core i7-4790K 4GHz
GeForce GTX 1050 Ti (Desktop)
min:
22 fps, max:
34 fps
fps
319%
GeForce GTX 1070 SLI (Laptop):
90.9 [X] Aorus X9 Intel Core i7-7820HK @4.1GHz
GeForce GTX 1070 SLI (Laptop)
fps
100%
GeForce GTX 1050 Ti (Desktop):
15.2 [X] Intel Core i7-4790K 4GHz
GeForce GTX 1050 Ti (Desktop)
min:
13 fps, max:
19 fps
fps
388%
GeForce GTX 1070 SLI (Laptop):
59 [X] Aorus X9 Intel Core i7-7820HK @4.1GHz
GeForce GTX 1070 SLI (Laptop)
fps
100%
GeForce GTX 1050 Ti (Desktop):
82 [X] Intel Core i7-4790K 4GHz
GeForce GTX 1050 Ti (Desktop)
min:
70 fps, max:
99 fps
fps
100%
GeForce GTX 1050 Ti (Desktop):
73 [X] Intel Core i7-4790K 4GHz
GeForce GTX 1050 Ti (Desktop)
min:
64 fps, max:
88 fps
fps
100%
GeForce GTX 1050 Ti (Desktop):
41.1 [X] Intel Core i7-4790K 4GHz
GeForce GTX 1050 Ti (Desktop)
min:
32 fps, max:
50 fps
fps
131%
GeForce GTX 1650 Max-Q:
53.9 fps
225%
GeForce GTX 1070 SLI (Laptop):
92.4 [X] Aorus X9 Intel Core i7-7820HK @4.1GHz
GeForce GTX 1070 SLI (Laptop)
fps
100%
GeForce GTX 1050 Ti (Desktop):
38.7 [X] Intel Core i7-4790K 4GHz
GeForce GTX 1050 Ti (Desktop)
min:
32 fps, max:
48 fps
fps
116%
GeForce GTX 1650 Max-Q:
44.8 fps
203%
GeForce GTX 1070 SLI (Laptop):
78.6 [X] Aorus X9 Intel Core i7-7820HK @4.1GHz
GeForce GTX 1070 SLI (Laptop)
fps
100%
GeForce GTX 1050 Ti (Desktop):
21.9 [X] Intel Core i7-4790K 4GHz
GeForce GTX 1050 Ti (Desktop)
min:
17 fps, max:
27 fps
fps
97%
GeForce GTX 1650 Max-Q:
21.2 fps
274%
GeForce GTX 1070 SLI (Laptop):
60 [X] Aorus X9 Intel Core i7-7820HK @4.1GHz
GeForce GTX 1070 SLI (Laptop)
fps
GeForce GTX 1070 SLI (Laptop):
122 [X] Aorus X9 Intel Core i7-7820HK @4.1GHz
GeForce GTX 1070 SLI (Laptop)
fps
100%
GeForce GTX 1050 Ti (Desktop):
60.5 [X] Intel Core i7-4790K 4GHz
GeForce GTX 1050 Ti (Desktop)
min:
43 fps, max:
98 fps
fps
183%
GeForce GTX 1070 SLI (Laptop):
111 [X] Aorus X9 Intel Core i7-7820HK @4.1GHz
GeForce GTX 1070 SLI (Laptop)
fps
100%
GeForce GTX 1050 Ti (Desktop):
26.1 [X] Intel Core i7-4790K 4GHz
GeForce GTX 1050 Ti (Desktop)
min:
19 fps, max:
40 fps
fps
225%
GeForce GTX 1070 SLI (Laptop):
58.6 [X] Aorus X9 Intel Core i7-7820HK @4.1GHz
GeForce GTX 1070 SLI (Laptop)
fps
100%
GeForce GTX 1050 Ti (Desktop):
62 [X] Intel Core i7-4790K 4GHz
GeForce GTX 1050 Ti (Desktop)
min:
51 fps, max:
80 fps
fps
231%
GeForce GTX 1070 SLI (Laptop):
143 [X] Aorus X9 Intel Core i7-7820HK @4.1GHz
GeForce GTX 1070 SLI (Laptop)
fps
100%
GeForce GTX 1050 Ti (Desktop):
56.6 [X] Intel Core i7-4790K 4GHz
GeForce GTX 1050 Ti (Desktop)
min:
46 fps, max:
72 fps
fps
249%
GeForce GTX 1070 SLI (Laptop):
141 [X] Aorus X9 Intel Core i7-7820HK @4.1GHz
GeForce GTX 1070 SLI (Laptop)
fps
100%
GeForce GTX 1050 Ti (Desktop):
18.5 [X] Intel Core i7-4790K 4GHz
GeForce GTX 1050 Ti (Desktop)
min:
15 fps, max:
23 fps
fps
370%
GeForce GTX 1070 SLI (Laptop):
68.4 [X] Aorus X9 Intel Core i7-7820HK @4.1GHz
GeForce GTX 1070 SLI (Laptop)
fps
100%
GeForce GTX 1050 Ti (Desktop):
113 [X] Intel Core i7-4790K 4GHz
GeForce GTX 1050 Ti (Desktop)
min:
105 fps, max:
141 fps
fps
100%
GeForce GTX 1050 Ti (Desktop):
51.1 [X] Intel Core i7-4790K 4GHz
GeForce GTX 1050 Ti (Desktop)
min:
47 fps, max:
63 fps
fps
100%
GeForce GTX 1050 Ti (Desktop):
199 [X] Intel Core i7-4790K 4GHz
GeForce GTX 1050 Ti (Desktop)
min:
195 fps, max:
201 fps
fps
100%
GeForce GTX 1050 Ti (Desktop):
144 [X] Intel Core i7-4790K 4GHz
GeForce GTX 1050 Ti (Desktop)
min:
137 fps, max:
159 fps
fps
100%
GeForce GTX 1050 Ti (Desktop):
69 [X] Intel Core i7-4790K 4GHz
GeForce GTX 1050 Ti (Desktop)
min:
62 fps, max:
73 fps
fps
207%
GeForce GTX 1070 SLI (Laptop):
143 [X] Aorus X9 Intel Core i7-7820HK @4.1GHz
GeForce GTX 1070 SLI (Laptop)
fps
100%
GeForce GTX 1050 Ti (Desktop):
62.4 [X] Intel Core i7-4790K 4GHz
GeForce GTX 1050 Ti (Desktop)
min:
53 fps, max:
68 fps
fps
207%
GeForce GTX 1070 SLI (Laptop):
129 [X] Aorus X9 Intel Core i7-7820HK @4.1GHz
GeForce GTX 1070 SLI (Laptop)
fps
100%
GeForce GTX 1050 Ti (Desktop):
25.2 [X] Intel Core i7-4790K 4GHz
GeForce GTX 1050 Ti (Desktop)
min:
21 fps, max:
27 fps
fps
294%
GeForce GTX 1070 SLI (Laptop):
74.1 [X] Aorus X9 Intel Core i7-7820HK @4.1GHz
GeForce GTX 1070 SLI (Laptop)
fps
100%
GeForce GTX 1050 Ti (Desktop):
57.5 [X] Intel Core i7-4790K 4GHz
GeForce GTX 1050 Ti (Desktop)
min:
42 fps, max:
86 fps
fps
100%
GeForce GTX 1050 Ti (Desktop):
47.3 [X] Intel Core i7-4790K 4GHz
GeForce GTX 1050 Ti (Desktop)
min:
36 fps, max:
71 fps
fps
100%
GeForce GTX 1050 Ti (Desktop):
36.3 [X] Intel Core i7-4790K 4GHz
GeForce GTX 1050 Ti (Desktop)
min:
29 fps, max:
53 fps
fps
100%
GeForce GTX 1050 Ti (Desktop):
68.2 [X] Intel Core i7-4790K 4GHz
GeForce GTX 1050 Ti (Desktop)
min:
61 fps, max:
79 fps
fps
100%
GeForce GTX 1050 Ti (Desktop):
41.8 [X] Intel Core i7-4790K 4GHz
GeForce GTX 1050 Ti (Desktop)
min:
37 fps, max:
49 fps
fps
100%
GeForce GTX 1050 Ti (Desktop):
22.1 [X] Intel Core i7-4790K 4GHz
GeForce GTX 1050 Ti (Desktop)
min:
19 fps, max:
25 fps
fps
244%
GeForce GTX 1070 SLI (Laptop):
54 fps
GeForce GTX 1070 SLI (Laptop):
21.3 fps
GeForce GTX 1070 SLI (Laptop):
293 fps
100%
GeForce GTX 1050 Ti (Desktop):
187 [X] Intel Core i7-4790K 4GHz
GeForce GTX 1050 Ti (Desktop)
min:
135 fps, max:
215 fps
fps
153%
GeForce GTX 1070 SLI (Laptop):
286 fps
100%
GeForce GTX 1050 Ti (Desktop):
72 [X] Intel Core i7-4790K 4GHz
GeForce GTX 1050 Ti (Desktop)
min:
55 fps, max:
78 fps
fps
242%
GeForce GTX 1070 SLI (Laptop):
174 fps
100%
GeForce GTX 1050 Ti (Desktop):
61.4 [X] Intel Core i7-4790K 4GHz
GeForce GTX 1050 Ti (Desktop)
min:
49 fps, max:
78 fps
fps
100%
GeForce GTX 1050 Ti (Desktop):
32.7 [X] Intel Core i7-4790K 4GHz
GeForce GTX 1050 Ti (Desktop)
min:
27 fps, max:
39 fps
fps
131%
GeForce GTX 1650 Max-Q:
43 fps
226%
GeForce GTX 1070 SLI (Laptop):
73.9 fps
100%
GeForce GTX 1050 Ti (Desktop):
22.8 [X] Intel Core i7-4790K 4GHz
GeForce GTX 1050 Ti (Desktop)
min:
18 fps, max:
28 fps
fps
100%
GeForce GTX 1650 Max-Q:
22.9 fps
246%
GeForce GTX 1070 SLI (Laptop):
56.1 fps
GeForce GTX 1650 Max-Q:
14.1 fps
100%
GeForce GTX 1050 Ti (Desktop):
79 [X] Intel Core i7-4790K 4GHz
GeForce GTX 1050 Ti (Desktop)
min:
51 fps, max:
104 fps
fps
100%
GeForce GTX 1050 Ti (Desktop):
44.6 [X] Intel Core i7-4790K 4GHz
GeForce GTX 1050 Ti (Desktop)
min:
36 fps, max:
53 fps
fps
327%
GeForce GTX 1070 SLI (Laptop):
146 fps
100%
GeForce GTX 1050 Ti (Desktop):
20.7 [X] Intel Core i7-4790K 4GHz
GeForce GTX 1050 Ti (Desktop)
min:
15 fps, max:
25 fps
fps
374%
GeForce GTX 1070 SLI (Laptop):
77.4 fps
GeForce GTX 1070 SLI (Laptop):
74.7 fps
GeForce GTX 1650 Max-Q:
54.7 fps
GeForce GTX 1070 SLI (Laptop):
102 fps
100%
GeForce GTX 1050 Ti (Desktop):
46.5 [X] Intel Core i7-4790K 4GHz
GeForce GTX 1050 Ti (Desktop)
min:
43 fps, max:
50 fps
fps
107%
GeForce GTX 1650 Max-Q:
49.9 fps
209%
GeForce GTX 1070 SLI (Laptop):
97.4 fps
GeForce GTX 1650 Max-Q:
17.5 fps
GeForce GTX 1070 SLI (Laptop):
53.9 fps
100%
GeForce GTX 1050 Ti (Desktop):
114 [X] Intel Core i7-4790K 4GHz
GeForce GTX 1050 Ti (Desktop)
min:
94 fps, max:
132 fps
fps
104%
GeForce GTX 1650 Max-Q:
119 fps
258%
GeForce GTX 1070 SLI (Laptop):
294 fps
100%
GeForce GTX 1050 Ti (Desktop):
68 [X] Intel Core i7-4790K 4GHz
GeForce GTX 1050 Ti (Desktop)
min:
58 fps, max:
82 fps
fps
102%
GeForce GTX 1650 Max-Q:
69.5 fps
431%
GeForce GTX 1070 SLI (Laptop):
293 fps
100%
GeForce GTX 1050 Ti (Desktop):
35.6 [X] Intel Core i7-4790K 4GHz
GeForce GTX 1050 Ti (Desktop)
min:
31 fps, max:
42 fps
fps
110%
GeForce GTX 1650 Max-Q:
39.1 fps
497%
GeForce GTX 1070 SLI (Laptop):
177 fps
GeForce GTX 1650 Max-Q:
79.6 fps
GeForce GTX 1070 SLI (Laptop):
158 fps
100%
GeForce GTX 1050 Ti (Desktop):
69 [X] Intel Core i7-4790K 4GHz
GeForce GTX 1050 Ti (Desktop)
min:
58 fps, max:
94 fps
fps
112%
GeForce GTX 1650 Max-Q:
77.4 fps
220%
GeForce GTX 1070 SLI (Laptop):
152 fps
100%
GeForce GTX 1050 Ti (Desktop):
23.3 [X] OGL
Intel Core i7-4790K 4GHz
GeForce GTX 1050 Ti (Desktop)
min:
19 fps, max:
31 fps
fps
103%
GeForce GTX 1650 Max-Q:
23.9 fps
318%
GeForce GTX 1070 SLI (Laptop):
74.1 fps
GeForce GTX 1650 Max-Q:
60.3 fps
100%
GeForce GTX 1050 Ti (Desktop):
40.4 [X] DX12
Intel Core i7-4790K 4GHz
GeForce GTX 1050 Ti (Desktop)
42.9 [X] DX11
Intel Core i7-4790K 4GHz
GeForce GTX 1050 Ti (Desktop)
43.9 ~ 42 fps
101%
GeForce GTX 1650 Max-Q:
42.5 fps
100%
GeForce GTX 1050 Ti (Desktop):
37.9 [X] DX11
Intel Core i7-4790K 4GHz
GeForce GTX 1050 Ti (Desktop)
39.1 ~ 39 fps
95%
GeForce GTX 1650 Max-Q:
36.9 fps
100%
GeForce GTX 1050 Ti (Desktop):
12.8 [X] DX12
Intel Core i7-4790K 4GHz
GeForce GTX 1050 Ti (Desktop)
fps
GeForce GTX 1070 SLI (Laptop):
99.3 fps
GeForce GTX 1070 SLI (Laptop):
85.7 fps
GeForce GTX 1070 SLI (Laptop):
84 fps
100%
GeForce GTX 1050 Ti (Desktop):
88 [X] Intel Core i7-4790K 4GHz
GeForce GTX 1050 Ti (Desktop)
min:
61 fps, max:
107 fps
fps
100%
GeForce GTX 1050 Ti (Desktop):
34.5 [X] DX11
Intel Core i7-4790K 4GHz
GeForce GTX 1050 Ti (Desktop)
min:
25 fps, max:
44 fps
fps
100%
GeForce GTX 1050 Ti (Desktop):
32.7 [X] DX11
Intel Core i7-4790K 4GHz
GeForce GTX 1050 Ti (Desktop)
min:
23 fps, max:
42 fps
fps
GeForce GTX 1070 SLI (Laptop):
128 fps
GeForce GTX 1070 SLI (Laptop):
113 fps
GeForce GTX 1070 SLI (Laptop):
67.4 fps
100%
GeForce GTX 1050 Ti (Desktop):
135 [X] Intel Core i7-4790K 4GHz
GeForce GTX 1050 Ti (Desktop)
min:
118 fps, max:
151 fps
fps
100%
GeForce GTX 1050 Ti (Desktop):
61 [X] Intel Core i7-4790K 4GHz
GeForce GTX 1050 Ti (Desktop)
min:
56 fps, max:
68 fps
fps
100%
GeForce GTX 1050 Ti (Desktop):
54 [X] Intel Core i7-4790K 4GHz
GeForce GTX 1050 Ti (Desktop)
min:
49 fps, max:
60 fps
fps
144%
GeForce GTX 1070 SLI (Laptop):
78 fps
100%
GeForce GTX 1050 Ti (Desktop):
41 [X] Intel Core i7-4790K 4GHz
GeForce GTX 1050 Ti (Desktop)
min:
32 fps, max:
49 fps
fps
176%
GeForce GTX 1070 SLI (Laptop):
72 fps
GeForce GTX 1070 SLI (Laptop):
69 fps
GeForce GTX 1070 SLI (Laptop):
103 fps
GeForce GTX 1070 SLI (Laptop):
82.3 fps
GeForce GTX 1070 SLI (Laptop):
53.1 fps
GeForce GTX 1650 Max-Q:
134.6 fps
GeForce GTX 1650 Max-Q:
93 fps
100%
GeForce GTX 1050 Ti (Desktop):
48.9 [X] Intel Core i7-4790K 4GHz
GeForce GTX 1050 Ti (Desktop)
min:
45 fps, max:
53 fps
fps
104%
GeForce GTX 1650 Max-Q:
50.9 fps
165%
GeForce GTX 1070 SLI (Laptop):
80.9 fps
100%
GeForce GTX 1050 Ti (Desktop):
40.7 [X] Intel Core i7-4790K 4GHz
GeForce GTX 1050 Ti (Desktop)
min:
37 fps, max:
45 fps
fps
102%
GeForce GTX 1650 Max-Q:
41.7 fps
196%
GeForce GTX 1070 SLI (Laptop):
79.8 fps
GeForce GTX 1650 Max-Q:
18.3 fps
GeForce GTX 1070 SLI (Laptop):
67.7 fps
100%
GeForce GTX 1050 Ti (Desktop):
272 [X] Intel Core i7-4790K 4GHz
GeForce GTX 1050 Ti (Desktop)
fps
100%
GeForce GTX 1050 Ti (Desktop):
181 [X] Intel Core i7-4790K 4GHz
GeForce GTX 1050 Ti (Desktop)
min:
103 fps, max:
275 fps
fps
100%
GeForce GTX 1050 Ti (Desktop):
95 [X] Intel Core i7-4790K 4GHz
GeForce GTX 1050 Ti (Desktop)
min:
63 fps, max:
148 fps
fps
121%
GeForce GTX 1650 Max-Q:
115 fps
185%
GeForce GTX 1070 SLI (Laptop):
176 fps
100%
GeForce GTX 1050 Ti (Desktop):
79 [X] Intel Core i7-4790K 4GHz
GeForce GTX 1050 Ti (Desktop)
min:
56 fps, max:
104 fps
fps
128%
GeForce GTX 1650 Max-Q:
101 fps
203%
GeForce GTX 1070 SLI (Laptop):
160 fps
GeForce GTX 1650 Max-Q:
40 fps
GeForce GTX 1070 SLI (Laptop):
60.7 fps
GeForce GTX 1070 SLI (Laptop):
129 fps
GeForce GTX 1070 SLI (Laptop):
115 fps
GeForce GTX 1070 SLI (Laptop):
198 fps
100%
GeForce GTX 1050 Ti (Desktop):
61 [X] Intel Core i7-4790K 4GHz
GeForce GTX 1050 Ti (Desktop)
min:
52 fps, max:
74 fps
fps
321%
GeForce GTX 1070 SLI (Laptop):
196 fps
100%
GeForce GTX 1050 Ti (Desktop):
21.6 [X] Intel Core i7-4790K 4GHz
GeForce GTX 1050 Ti (Desktop)
min:
18 fps, max:
26 fps
fps
491%
GeForce GTX 1070 SLI (Laptop):
106 fps
100%
GeForce GTX 1050 Ti (Desktop):
52.6 [X] Intel Core i7-4790K 4GHz
GeForce GTX 1050 Ti (Desktop)
min:
48 fps, max:
58 fps
fps
167%
GeForce GTX 1070 SLI (Laptop):
87.7 fps
100%
GeForce GTX 1050 Ti (Desktop):
22.9 [X] Intel Core i7-4790K 4GHz
GeForce GTX 1050 Ti (Desktop)
min:
18 fps, max:
27 fps
fps
329%
GeForce GTX 1070 SLI (Laptop):
75.3 fps
GeForce GTX 1070 SLI (Laptop):
74.1 fps
GeForce GTX 1070 SLI (Laptop):
141 fps
100%
GeForce GTX 1050 Ti (Desktop):
46.4 [X] Intel Core i7-4790K 4GHz
GeForce GTX 1050 Ti (Desktop)
min:
38 fps, max:
58 fps
fps
295%
GeForce GTX 1070 SLI (Laptop):
137 fps
GeForce GTX 1070 SLI (Laptop):
82.3 fps
GeForce GTX 1070 SLI (Laptop):
140 fps
GeForce GTX 1070 SLI (Laptop):
121 fps
GeForce GTX 1070 SLI (Laptop):
87.9 fps
100%
GeForce GTX 1050 Ti (Desktop):
61.8 [X] Intel Core i7-4790K 4GHz
GeForce GTX 1050 Ti (Desktop)
min:
56 fps, max:
66 fps
fps
180%
GeForce GTX 1070 SLI (Laptop):
111 fps
100%
GeForce GTX 1050 Ti (Desktop):
20.7 [X] Intel Core i7-4790K 4GHz
GeForce GTX 1050 Ti (Desktop)
min:
17 fps, max:
23 fps
fps
241%
GeForce GTX 1070 SLI (Laptop):
49.8 fps
GeForce GTX 1070 SLI (Laptop):
54.8 fps
GeForce GTX 1650 Max-Q:
179 fps
GeForce GTX 1650 Max-Q:
144.1 fps
GeForce GTX 1650 Max-Q:
117.7 fps
100%
GeForce GTX 1050 Ti (Desktop):
113 [X] Intel Core i7-4790K 4GHz
GeForce GTX 1050 Ti (Desktop)
min:
86 fps, max:
152 fps
fps
92%
GeForce GTX 1650 Max-Q:
104.2 fps
100%
GeForce GTX 1050 Ti (Desktop):
35.7 [X] Intel Core i7-4790K 4GHz
GeForce GTX 1050 Ti (Desktop)
min:
22 fps, max:
54 fps
fps
GeForce GTX 1070 SLI (Laptop):
265 fps
100%
GeForce GTX 1050 Ti (Desktop):
79 [X] Intel Core i7-4790K 4GHz
GeForce GTX 1050 Ti (Desktop)
min:
72 fps, max:
87 fps
fps
332%
GeForce GTX 1070 SLI (Laptop):
262 fps
100%
GeForce GTX 1050 Ti (Desktop):
26.9 [X] Intel Core i7-4790K 4GHz
GeForce GTX 1050 Ti (Desktop)
min:
24 fps, max:
30 fps
fps
100%
GeForce GTX 1050 Ti (Desktop):
178 [X] Asus Prime X299 Deluxe XMP OC Intel Core i9-9980XE @4.4GHz
GeForce GTX 1050 Ti (Desktop)
min:
153.9 fps
fps
100%
GeForce GTX 1050 Ti (Desktop):
161 [X] Asus Prime X299 Deluxe XMP OC Intel Core i9-9980XE @4.4GHz
GeForce GTX 1050 Ti (Desktop)
min:
141.3 fps
fps
100%
GeForce GTX 1050 Ti (Desktop):
141 [X] Asus Prime X299 Deluxe XMP OC Intel Core i9-9980XE @4.4GHz
GeForce GTX 1050 Ti (Desktop)
min:
123.3 fps
fps
100%
GeForce GTX 1050 Ti (Desktop):
125 [X] Asus Prime X299 Deluxe XMP OC Intel Core i9-9980XE @4.4GHz
GeForce GTX 1050 Ti (Desktop)
min:
107.3 fps
fps
100%
GeForce GTX 1050 Ti (Desktop):
63 [X] Intel Core i7-4790K 4GHz
GeForce GTX 1050 Ti (Desktop)
min:
58 fps
fps
GeForce GTX 1650 Max-Q:
121 fps
GeForce GTX 1650 Max-Q:
75 fps
GeForce GTX 1650 Max-Q:
64 fps
GeForce GTX 1070 SLI (Laptop):
134 fps
GeForce GTX 1650 Max-Q:
38 fps
GeForce GTX 1070 SLI (Laptop):
68 [X] Saelic Vici G781D Intel Core i7-6700K 4GHz
GeForce GTX 1070 SLI (Laptop)
89 ~ 79 fps
GeForce GTX 1070 SLI (Laptop):
48 fps
100%
GeForce GTX 1050 Ti (Desktop):
49.4 [X] Intel Core i7-4790K 4GHz
GeForce GTX 1050 Ti (Desktop)
min:
41 fps, max:
54 fps
fps
340%
GeForce GTX 1070 SLI (Laptop):
167 [X] Aorus X9 Intel Core i7-7820HK @4.1GHz
GeForce GTX 1070 SLI (Laptop)
169 ~ 168 fps
100%
GeForce GTX 1050 Ti (Desktop):
24 27.5 [X] Intel Core i7-4790K 4GHz
GeForce GTX 1050 Ti (Desktop)
min:
22 fps, max:
32 fps
~ 26 fps
365%
GeForce GTX 1070 SLI (Laptop):
81.4 [X] Saelic Vici G781D Intel Core i7-6700K 4GHz
GeForce GTX 1070 SLI (Laptop)
99.9 [X] Aorus X9 Intel Core i7-7820HK @4.1GHz
GeForce GTX 1070 SLI (Laptop)
103 ~ 95 fps
GeForce GTX 1650 Max-Q:
17.5 17.6 ~ 18 fps
GeForce GTX 1070 SLI (Laptop):
69.3 [X] Aorus X9 Intel Core i7-7820HK @4.1GHz
GeForce GTX 1070 SLI (Laptop)
74.6 ~ 72 fps
GeForce GTX 1070 SLI (Laptop):
170 fps
100%
GeForce GTX 1050 Ti (Desktop):
62.1 [X] Intel Core i7-4790K 4GHz
GeForce GTX 1050 Ti (Desktop)
min:
51 fps, max:
75 fps
fps
271%
GeForce GTX 1070 SLI (Laptop):
168 fps
100%
GeForce GTX 1050 Ti (Desktop):
52.7 [X] Intel Core i7-4790K 4GHz
GeForce GTX 1050 Ti (Desktop)
min:
46 fps, max:
67 fps
fps
309%
GeForce GTX 1070 SLI (Laptop):
163 fps
100%
GeForce GTX 1050 Ti (Desktop):
176 [X] Aorus Z370 Ultra Gaming Desktop MSI GTX 1050 Ti Intel Core i7-8086K 3.7GHz
GeForce GTX 1050 Ti (Desktop)
min:
3.93 fps, P1:
125 fps, max:
337 fps
fps
92%
GeForce GTX 1650 Max-Q:
162.7 fps
100%
GeForce GTX 1050 Ti (Desktop):
169 [X] Aorus Z370 Ultra Gaming Desktop MSI GTX 1050 Ti Intel Core i7-8086K 3.7GHz
GeForce GTX 1050 Ti (Desktop)
min:
20.6 fps, P1:
125 fps, max:
258 fps
fps
84%
GeForce GTX 1650 Max-Q:
142.8 fps
100%
GeForce GTX 1050 Ti (Desktop):
88.8 [X] Aorus Z370 Ultra Gaming Desktop MSI GTX 1050 Ti Intel Core i7-8086K 3.7GHz
GeForce GTX 1050 Ti (Desktop)
min:
10.1 fps, P1:
62.5 fps, max:
163 fps
fps
86%
GeForce GTX 1650 Max-Q:
76.5 fps
100%
GeForce GTX 1050 Ti (Desktop):
36.4 [X] Intel Core i7-4790K 4GHz
GeForce GTX 1050 Ti (Desktop)
min:
22.1 fps, max:
102 fps
41.2 [X] Aorus Z370 Ultra Gaming Desktop MSI GTX 1050 Ti Intel Core i7-8086K 3.7GHz
GeForce GTX 1050 Ti (Desktop)
min:
6.32 fps, P1:
27.8 fps, max:
110 fps
~ 39 fps
92%
GeForce GTX 1650 Max-Q:
36 fps
100%
GeForce GTX 1050 Ti (Desktop):
29.4 [X] Aorus Z370 Ultra Gaming Desktop MSI GTX 1050 Ti Intel Core i7-8086K 3.7GHz
GeForce GTX 1050 Ti (Desktop)
min:
5.25 fps, P1:
20.8 fps, max:
79.5 fps
fps
100%
GeForce GTX 1050 Ti (Desktop):
27.8 [X] Aorus Z370 Ultra Gaming Desktop MSI GTX 1050 Ti Intel Core i7-8086K 3.7GHz
GeForce GTX 1050 Ti (Desktop)
min:
6.34 fps, P1:
20.8 fps, max:
126 fps
fps
GeForce GTX 1070 SLI (Laptop):
159 fps
100%
GeForce GTX 1050 Ti (Desktop):
39.9 [X] Intel Core i7-4790K 4GHz
GeForce GTX 1050 Ti (Desktop)
min:
29 fps
fps
346%
GeForce GTX 1070 SLI (Laptop):
138 fps
GeForce GTX 1070 SLI (Laptop):
199 fps
100%
GeForce GTX 1050 Ti (Desktop):
84 [X] Intel Core i7-4790K 4GHz
GeForce GTX 1050 Ti (Desktop)
fps
226%
GeForce GTX 1070 SLI (Laptop):
190 fps
100%
GeForce GTX 1050 Ti (Desktop):
58.2 [X] Intel Core i7-4790K 4GHz
GeForce GTX 1050 Ti (Desktop)
min:
25 fps, max:
165 fps
fps
GeForce GTX 1070 SLI (Laptop):
114.6 [X] Saelic Vici G781D Intel Core i7-6700K 4GHz
GeForce GTX 1070 SLI (Laptop)
fps
100%
GeForce GTX 1050 Ti (Desktop):
66 [X] Intel Core i7-4790K 4GHz
GeForce GTX 1050 Ti (Desktop)
min:
58 fps, max:
81 fps
fps
100%
GeForce GTX 1050 Ti (Desktop):
30.2 [X] Intel Core i7-4790K 4GHz
GeForce GTX 1050 Ti (Desktop)
min:
27 fps, max:
36 fps
fps
GeForce GTX 1070 SLI (Laptop):
105.3 [X] Saelic Vici G781D Intel Core i7-6700K 4GHz
GeForce GTX 1070 SLI (Laptop)
fps
100%
GeForce GTX 1050 Ti (Desktop):
303.5 fps
100%
GeForce GTX 1050 Ti (Desktop):
208 [X] Intel Core i7-4790K 4GHz
GeForce GTX 1050 Ti (Desktop)
min:
58 fps, max:
311 fps
fps
100%
GeForce GTX 1050 Ti (Desktop):
77.2 79 [X] Intel Core i7-4790K 4GHz
GeForce GTX 1050 Ti (Desktop)
min:
45 fps, max:
130 fps
~ 78 fps
254%
GeForce GTX 1070 SLI (Laptop):
198.4 [X] Saelic Vici G781D Intel Core i7-6700K 4GHz
GeForce GTX 1070 SLI (Laptop)
fps
GeForce GTX 1650 Max-Q:
367.2 fps
GeForce GTX 1650 Max-Q:
253.9 fps
GeForce GTX 1650 Max-Q:
191.5 fps
GeForce GTX 1650 Max-Q:
92.7 fps
100%
GeForce GTX 1050 Ti (Desktop):
35.8 [X] Intel Core i7-4790K 4GHz
GeForce GTX 1050 Ti (Desktop)
min:
29 fps, max:
54 fps
fps
GeForce GTX 1650 Max-Q:
309.6 fps
GeForce GTX 1650 Max-Q:
294.4 fps
GeForce GTX 1650 Max-Q:
258.6 fps
GeForce GTX 1650 Max-Q:
166.6 fps
GeForce GTX 1070 SLI (Laptop):
217.9 [X] Saelic Vici G781D Intel Core i7-6700K 4GHz
GeForce GTX 1070 SLI (Laptop)
fps
100%
GeForce GTX 1050 Ti (Desktop):
55.1 [X] Intel Core i7-4790K 4GHz
GeForce GTX 1050 Ti (Desktop)
min:
22 fps, max:
93 fps
fps
Average Gaming NVIDIA GeForce GTX 1050 Ti (Desktop) → 100% Average Gaming 30-70 fps → 100%
Average Gaming NVIDIA GeForce GTX 1650 Max-Q → 109% Average Gaming 30-70 fps → 111%
Average Gaming NVIDIA GeForce GTX 1070 SLI (Laptop) → 274% Average Gaming 30-70 fps → 282%
 Deutsch
 English
 Español
 Français
 Italiano
 Nederlands
 Polski
 Português
 Русский
 Türkçe
 Svenska
 Chinese
 Magyar