Kaby Lake X: Intel Core i7-7740X Review
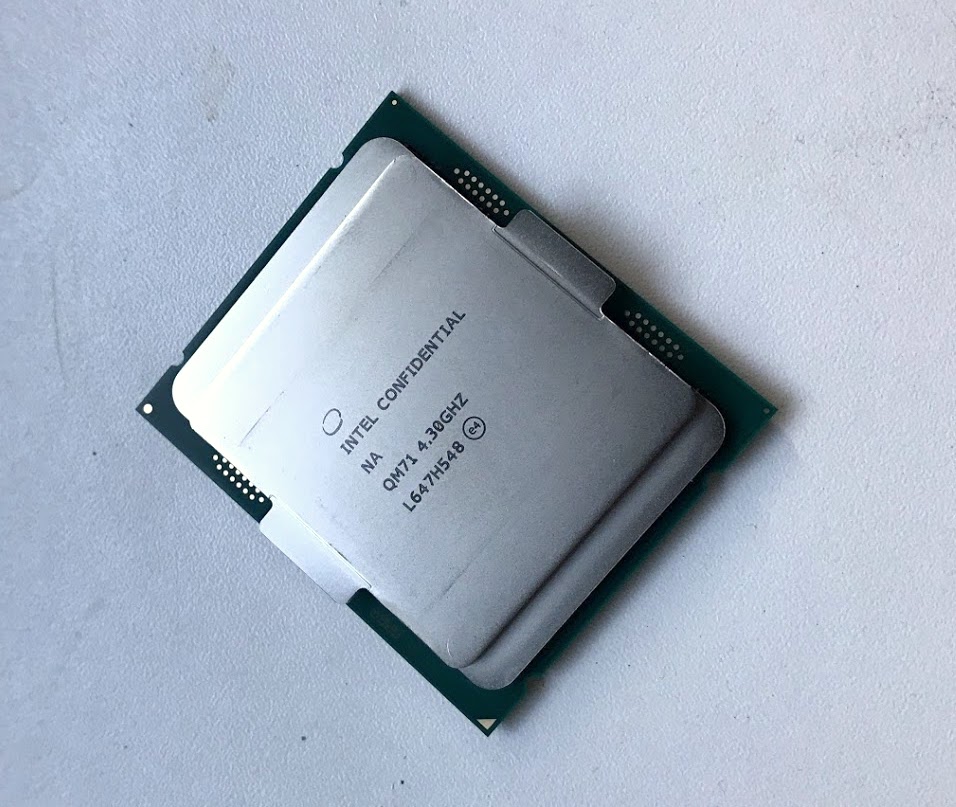
The Core i7-7740X
For the original German review, see here.
With the new Core i7-7740X, we are testing one of the Kaby Lake X processors that will probably come into question for private users. The quad-core, currently priced at around 350 Euros (up to $403) requires a compatible LGA 2066 motherboard that adds another ~200 Euros (~$230).
The i7-7740X can certainly be seen as the successor of the Core i7-7700K. Both processors are equipped with four cores and an 8 MB L3 cache and both support Hyperthreading. However, the Kaby Lake X model operates with a 100 MHz higher base clock at 4.3 GHz. Then, the Turbo speed of both models is 4.5 GHz.
The following components were used as a test system: Core i7-7740X by Intel, an Asus PRIME X299 DELUXE motherboard, a DDR4-2666 by Geil, Samsung's 840 Pro SSD, and Nvidia's GeForce GTX 1080 Ti Founders Edition.
| Model | Cores - Threads | Base Clock | Turbo Clock | L3 cache | TDP | approx. street price |
| Core i7-7740X | 4-8 | 4.3 GHz | 4.5 GHz | 8 MB | 112 watts | 350 Euros ($350) |
| Core i7-7700K | 4-8 | 4.2 GHz | 4.5 GHz | 8 MB | 95 watts | 330 Euros ($340) |
| Ryzen R7 1700X | 8-16 | 3.4 GHz | 3.8/3.5 GHz | 16 MB | 95 watts | 360 Euros ($390) |
| Ryzen R5 1600 | 6-12 | 3.2 GHz | 3.6 GHz | 16 MB | 65 watts | 210 Euros ($215) |
Synthetic Benchmarks
Cinebench R15
As usual, we first look at the benchmark results based on programs designed for performance. Cinebench greatly benefits in terms of a high clock rate and a large cache when testing only one core. Not only the pure core count, but also a high number of threads being processed simultaneously via Hyperthreading play a role in when testing all cores.
When looking at just one core, Intel's Core i7-7740X proves to be currently the fastest CPU that we have tested thanks to its Turbo clock rate of 4.5 GHz. Although the score of the Core i7-7700K is one point lower, it can be considered to be on par as it can be seen as a (minor) measuring uncertainty.
Thus, the Core i7-7740X is at least 19% faster than AMD's Ryzen processors. Compared with the identically priced Ryzen 7 1700X, the Kaby Lake X model is roughly 25% faster.
However, when looking at the multi-core performance, we confirmed that its performance is equivalent to that of the Core i7-7700K but the Ryzen CPUs are significantly superiority to both. The Ryzen 5 1600 is 16% faster thanks to two additional cores, and it is already almost 40% compared with the Ryzen 7 1700X.
| Cinebench R15 | |
| CPU Single 64Bit | |
| Intel Core i7-7740X | |
| Intel Core i7-7700K | |
| Intel Core i9-7900X | |
| Intel Core i5-7600K | |
| Intel Core i7-6950X | |
| Intel Core i7-6950X | |
| AMD Ryzen 7 1800X | |
| AMD Ryzen 7 1700X | |
| AMD Ryzen 5 1500X | |
| Intel Core i7-7700HQ | |
| AMD Ryzen 5 1600 | |
| AMD Ryzen 7 1700 | |
| AMD Ryzen 5 1600 | |
| Intel Core i7-5960X | |
| AMD Ryzen 5 1400 | |
| Intel Xeon E5-2697 v2 | |
| Intel Xeon E5-2680 v4 | |
| AMD FX-8350 | |
| CPU Multi 64Bit | |
| Intel Core i9-7900X | |
| Intel Core i7-6950X | |
| Intel Xeon E5-2680 v4 | |
| AMD Ryzen 7 1800X | |
| AMD Ryzen 7 1700X | |
| Intel Xeon E5-2697 v2 | |
| AMD Ryzen 7 1700 | |
| Intel Core i7-5960X | |
| AMD Ryzen 5 1600 | |
| AMD Ryzen 5 1600 | |
| Intel Core i7-7740X | |
| Intel Core i7-7700K | |
| AMD Ryzen 5 1500X | |
| Intel Core i7-7700HQ | |
| AMD Ryzen 5 1400 | |
| Intel Core i5-7600K | |
| AMD FX-8350 | |
Truecrypt
Although the Truecrypt benchmark is rather insignificant for most users, it illustrates the performance of individual processors when handling diverse encryption algorithms using different algorithms.
The Core i7-7740X manages to outperform the two Ryzen 5 1500X and 1400 models only in the subsumed performance rating, although the first costs only half as much. The Ryzen 5 1600 already operates considerably faster than the Kaby Lake model.
| Performance rating - Percent | |
| Intel Core i9-7900X | |
| Intel Core i7-6950X | |
| AMD Ryzen 7 1800X | |
| Intel Xeon E5-2697 v2 | |
| AMD Ryzen 7 1700X | |
| Intel Xeon E5-2680 v4 | |
| Intel Core i7-5960X | |
| AMD Ryzen 5 1600 | |
| AMD Ryzen 5 1600 | |
| Intel Core i7-7740X | |
| Intel Core i7-7700K | |
| AMD Ryzen 5 1500X | |
| AMD Ryzen 5 1400 | |
| Intel Core i5-7600K | |
| TrueCrypt | |
| Serpent Mean 100MB | |
| Intel Core i7-6950X | |
| Intel Core i9-7900X | |
| AMD Ryzen 7 1800X | |
| Intel Xeon E5-2697 v2 | |
| AMD Ryzen 7 1700X | |
| Intel Xeon E5-2680 v4 | |
| Intel Core i7-5960X | |
| AMD Ryzen 5 1600 | |
| AMD Ryzen 5 1600 | |
| Intel Core i7-7700K | |
| Intel Core i7-7740X | |
| AMD Ryzen 5 1500X | |
| AMD Ryzen 5 1400 | |
| Intel Core i5-7600K | |
| Twofish Mean 100MB | |
| Intel Core i9-7900X | |
| Intel Core i7-6950X | |
| Intel Xeon E5-2697 v2 | |
| AMD Ryzen 7 1800X | |
| Intel Xeon E5-2680 v4 | |
| AMD Ryzen 7 1700X | |
| Intel Core i7-5960X | |
| AMD Ryzen 5 1600 | |
| AMD Ryzen 5 1600 | |
| Intel Core i7-7740X | |
| Intel Core i7-7700K | |
| AMD Ryzen 5 1500X | |
| AMD Ryzen 5 1400 | |
| Intel Core i5-7600K | |
| AES Mean 100MB | |
| Intel Core i9-7900X | |
| Intel Core i7-6950X | |
| AMD Ryzen 7 1800X | |
| Intel Xeon E5-2680 v4 | |
| AMD Ryzen 7 1700X | |
| Intel Xeon E5-2697 v2 | |
| Intel Core i7-5960X | |
| AMD Ryzen 5 1600 | |
| Intel Core i7-7740X | |
| Intel Core i7-7700K | |
| AMD Ryzen 5 1600 | |
| AMD Ryzen 5 1500X | |
| AMD Ryzen 5 1400 | |
| Intel Core i5-7600K | |
wPrime
wPrime calculates square roots in the Newton-Raphson method for quantifying the computational performance and it particularly benefits from a high core count and Hyperthreading. Unsurprisingly, the octa-core Ryzen APUs are the fastest models here. The Core i7-6940X cannot be considered due to its high price. Beyond that, the Ryzen 5 1600 is again significantly faster than the Core i7-7740X in this benchmark.
| wPrime 2.10 | |
| 1024m | |
| Intel Xeon E5-2697 v2 | |
| Intel Core i5-7600K | |
| AMD Ryzen 5 1400 | |
| AMD Ryzen 5 1500X | |
| Intel Core i7-7700K | |
| Intel Core i7-7740X | |
| AMD Ryzen 5 1600 | |
| Intel Core i7-5960X | |
| AMD Ryzen 7 1700X | |
| AMD Ryzen 7 1800X | |
| Intel Core i7-6950X | |
| Intel Core i9-7900X | |
| 32m | |
| Intel Xeon E5-2697 v2 | |
| Intel Core i5-7600K | |
| AMD Ryzen 5 1400 | |
| AMD Ryzen 5 1500X | |
| Intel Core i7-7700K | |
| Intel Core i7-7740X | |
| AMD Ryzen 5 1600 | |
| Intel Core i7-5960X | |
| AMD Ryzen 7 1700X | |
| AMD Ryzen 7 1800X | |
| Intel Core i7-6950X | |
| Intel Core i9-7900X | |
* ... smaller is better
Further Synthetic Benchmarks
As always, we would like to present the results of other synthetic benchmarks here. Although the data of the previous test are usually confirmed, we would like to point especially to the WinRAR benchmark for reasons of transparency - it delivered reproducible yet not very comprehensible results in our Ryzen test.
| Geekbench 4.0 | |
| 64 Bit Single-Core Score | |
| Intel Core i7-7740X | |
| Intel Core i7-7700K | |
| Intel Core i5-7600K | |
| Intel Core i9-7900X | |
| AMD Ryzen 7 1800X | |
| AMD Ryzen 7 1700X | |
| Intel Core i7-7700HQ | |
| AMD Ryzen 7 1700 | |
| AMD Ryzen 5 1500X | |
| AMD Ryzen 5 1600 | |
| Intel Core i7-6950X | |
| Intel Core i7-5960X | |
| AMD Ryzen 5 1400 | |
| Intel Xeon E5-2680 v4 | |
| 64 Bit Multi-Core Score | |
| Intel Core i9-7900X | |
| Intel Core i7-6950X | |
| Intel Core i7-5960X | |
| AMD Ryzen 7 1800X | |
| Intel Xeon E5-2680 v4 | |
| AMD Ryzen 7 1700X | |
| AMD Ryzen 7 1700 | |
| Intel Core i7-7740X | |
| AMD Ryzen 5 1600 | |
| Intel Core i7-7700K | |
| Intel Core i5-7600K | |
| AMD Ryzen 5 1500X | |
| Intel Core i7-7700HQ | |
| AMD Ryzen 5 1400 | |
| WinRAR - Result | |
| Intel Core i7-6950X | |
| Intel Xeon E5-2697 v2 | |
| Intel Core i7-5960X | |
| Intel Core i7-7740X | |
| Intel Xeon E5-2680 v4 | |
| Intel Core i9-7900X | |
| Intel Core i7-7700K | |
| AMD Ryzen 7 1800X | |
| AMD Ryzen 7 1700X | |
| AMD Ryzen 5 1500X | |
| AMD Ryzen 5 1600 | |
| Intel Core i5-7600K | |
| AMD Ryzen 5 1400 | |
| X264 HD Benchmark 4.0 | |
| Pass 1 | |
| Intel Core i7-7740X | |
| Intel Core i7-7700K | |
| Intel Core i5-7600K | |
| Intel Core i9-7900X | |
| Intel Core i7-6950X | |
| AMD Ryzen 7 1800X | |
| Intel Core i7-5960X | |
| AMD Ryzen 7 1700X | |
| AMD Ryzen 5 1600 | |
| AMD Ryzen 5 1500X | |
| Intel Xeon E5-2697 v2 | |
| AMD Ryzen 5 1400 | |
| Intel Xeon E5-2680 v4 | |
| Pass 2 | |
| Intel Core i9-7900X | |
| Intel Core i7-6950X | |
| AMD Ryzen 7 1800X | |
| AMD Ryzen 7 1700X | |
| Intel Xeon E5-2697 v2 | |
| Intel Core i7-5960X | |
| Intel Xeon E5-2680 v4 | |
| AMD Ryzen 5 1600 | |
| Intel Core i7-7740X | |
| Intel Core i7-7700K | |
| AMD Ryzen 5 1500X | |
| Intel Core i5-7600K | |
| AMD Ryzen 5 1400 | |
| PCMark 8 | |
| Home Score Accelerated v2 | |
| Intel Core i7-7740X | |
| Intel Core i9-7900X | |
| Intel Core i7-7700K | |
| Intel Core i5-7600K | |
| AMD Ryzen 7 1800X | |
| AMD Ryzen 5 1500X | |
| Intel Core i7-4790K | |
| AMD Ryzen 7 1700X | |
| AMD Ryzen 7 1700 | |
| AMD Ryzen 5 1600 | |
| AMD Ryzen 5 1400 | |
| Intel Core i7-6950X | |
| Intel Core i7-5960X | |
| Intel Core i7-7700HQ | |
| Intel Xeon E5-2697 v2 | |
| Work Score Accelerated v2 | |
| Intel Core i9-7900X | |
| Intel Core i7-7700HQ | |
| Intel Core i7-7700K | |
| Intel Core i7-7740X | |
| AMD Ryzen 5 1500X | |
| Intel Xeon E5-2697 v2 | |
| AMD Ryzen 7 1800X | |
| AMD Ryzen 7 1700X | |
| Intel Core i7-6950X | |
| AMD Ryzen 5 1600 | |
| Intel Core i7-5960X | |
| AMD Ryzen 7 1700 | |
| AMD Ryzen 5 1400 | |
| 3DMark | |
| 1920x1080 Fire Strike Physics | |
| Intel Core i9-7900X | |
| Intel Core i7-6950X | |
| AMD Ryzen 7 1800X | |
| AMD Ryzen 7 1700X | |
| Intel Core i7-5960X | |
| AMD Ryzen 7 1700 | |
| Intel Xeon E5-2697 v2 | |
| Intel Xeon E5-2680 v4 | |
| AMD Ryzen 5 1600 | |
| Intel Core i7-7740X | |
| Intel Core i7-7700K | |
| Intel Core i7-4790K | |
| AMD Ryzen 5 1400 | |
| Intel Core i7-7700HQ | |
| Intel Core i5-7600K | |
| 2560x1440 Time Spy CPU | |
| Intel Core i9-7900X | |
| Intel Core i7-6950X | |
| Intel Xeon E5-2680 v4 | |
| AMD Ryzen 7 1800X | |
| Intel Core i7-5960X | |
| AMD Ryzen 7 1700X | |
| AMD Ryzen 7 1700X | |
| AMD Ryzen 7 1700 | |
| Intel Core i7-7740X | |
| AMD Ryzen 5 1600 | |
| Intel Core i7-7700K | |
| Intel Core i7-4790K | |
| Intel Core i7-7700HQ | |
| Intel Core i5-7600K | |
| AMD Ryzen 5 1500X | |
| AMD Ryzen 5 1400 | |
| 3DMark 11 - 1280x720 Performance Physics | |
| Intel Core i7-6950X | |
| Intel Core i9-7900X | |
| Intel Core i7-5960X | |
| AMD Ryzen 7 1800X | |
| Intel Xeon E5-2697 v2 | |
| AMD Ryzen 7 1700 | |
| Intel Xeon E5-2680 v4 | |
| Intel Core i7-7740X | |
| Intel Core i7-7700K | |
| AMD Ryzen 5 1600 | |
| Intel Core i7-4790K | |
| AMD Ryzen 5 1500X | |
| Intel Core i7-7700HQ | |
| AMD Ryzen 5 1400 | |
| 3DMark 06 - CPU - CPU Score | |
| Intel Core i9-7900X | |
| Intel Core i7-6950X | |
| Intel Core i7-7740X | |
| Intel Core i7-7700K | |
| Intel Core i7-5960X | |
| AMD Ryzen 7 1700 | |
| Intel Xeon E5-2697 v2 | |
| Intel Core i5-7600K | |
| AMD Ryzen 5 1600 | |
| Intel Xeon E5-2680 v4 | |
| Intel Core i7-7700HQ | |
| AMD Ryzen 5 1500X | |
| AMD Ryzen 5 1400 | |
Intermediate Verdict
The i7-7740X Kaby Lake processor presents a similar performance as Intel's Core i7-7700K, at least in the synthetic benchmarks, which is not surprising since in fact they are identical in terms of architecture. The 100 MHz higher base clock is also virtually irrelevant for these benchmarks since both processors support Turbo Boost 2.0 and jump to the same Turbo clock speed.
In summary, the i7-7740X always has an advantage over the Ryzen competition in single-core performance scenarios. Even equally priced AMD models clearly outrun the 7740X in multi-core applications, which is not baffling in view of four cores.
Gaming Benchmarks
Test System
To exclude limitations by the GPU and to create acceptable comparison conditions, we used one of the currently fastest available GPUs with the GeForce GTX 1080 Ti in the Founders Edition. The Skylake X model was tested on an Asus Prime X299-A with 16 GB of DDR4-2666 RAM in dual-channel mode. The test system for the Ryzen and other Intel models is described extensively in the reviews of the Ryzen 7 1700, 1700X and 1800X. A GTX 1080 Ti was also used here.
Frame Rates
Intel's Core i7-7740X appropriately takes the first place in “The Witcher 3” benchmark using low details and a resolution of 1024x768 pixels - at least in terms of the average frame rate.
Compared with the in-house competition, the performance advantage is relatively low. Intel's Core i7-4790K is only 2% slower, and the Kaby Lake model's equivalent, the i7-7700K, only by 4% in the synthetic benchmarks.
The advantage over AMD's Ryzen CPUs is at least 10%. The Ryzen 7 1700, which is currently approximately 50 Euros (~$57) cheaper, is roughly 16% slower - and seen in relation just as much lower in price.
“Farming Simulator 17” allows us to quantify the CPU performance even in high detail settings and 4K resolution since the application is extremely CPU-driven. The Core i7-7740X almost manages the first place also in this benchmark. The Ryzen models first follow at a distance of at least 8%. In the For Honor test, the result of Intel's Core i7-7700K is definitely an outlier that we have nevertheless listed for reasons of transparency.
| Farming Simulator 17 - 3840x2160 High Preset AA:2xMS AF:2x | |
| Intel Core i7-7740X | |
| Intel Core i7-6950X | |
| Intel Core i5-7600K | |
| Intel Core i7-4790K | |
| Intel Core i7-7700K | |
| Intel Core i9-7900X | |
| AMD Ryzen 5 1500X | |
| Intel Core i7-5960X | |
| AMD Ryzen 7 1800X | |
| AMD Ryzen 5 1600 | |
| AMD Ryzen 7 1700 | |
| Intel Xeon E5-2680 v4 | |
| AMD Ryzen 5 1400 | |
| The Witcher 3 | |
| 1920x1080 Ultra Graphics & Postprocessing (HBAO+) | |
| Intel Core i7-7740X | |
| Intel Core i7-7700K | |
| Intel Core i7-6950X | |
| Intel Core i7-4790K | |
| AMD Ryzen 7 1700 | |
| AMD Ryzen 7 1800X | |
| Intel Core i9-7900X | |
| AMD Ryzen 5 1500X | |
| AMD Ryzen 5 1400 | |
| AMD Ryzen 5 1600 | |
| Intel Xeon E5-2680 v4 | |
| 1024x768 Low Graphics & Postprocessing | |
| Intel Core i9-7900X | |
| Intel Core i7-7740X | |
| Intel Core i7-4790K | |
| Intel Core i7-6950X | |
| Intel Core i7-7700K | |
| AMD Ryzen 7 1800X | |
| AMD Ryzen 7 1700 | |
| Intel Xeon E5-2680 v4 | |
| AMD Ryzen 5 1600 | |
| AMD Ryzen 5 1500X | |
| AMD Ryzen 5 1400 | |
| For Honor | |
| 3840x2160 High Preset AA:T AF:8x | |
| Intel Xeon E5-2680 v4 | |
| Intel Core i7-7700K | |
| Intel Core i7-7740X | |
| Intel Core i7-6950X | |
| AMD Ryzen 7 1700 | |
| Intel Core i9-7900X | |
| Intel Core i5-7600K | |
| AMD Ryzen 5 1500X | |
| AMD Ryzen 5 1400 | |
| AMD Ryzen 5 1600 | |
| Intel Core i7-4790K | |
| AMD Ryzen 7 1800X | |
| Intel Core i7-5960X | |
| 1280x720 Low Preset | |
| Intel Core i7-7740X | |
| Intel Core i7-7700K | |
| Intel Core i7-4790K | |
| AMD Ryzen 5 1500X | |
| Intel Core i5-7600K | |
| AMD Ryzen 5 1600 | |
| Intel Xeon E5-2680 v4 | |
| AMD Ryzen 5 1400 | |
| AMD Ryzen 7 1800X | |
| Intel Core i7-5960X | |
| AMD Ryzen 7 1700 | |
| Intel Core i7-6950X | |
| Intel Core i9-7900X | |
Frame Time Course
The Core i7-7740X also proves to be a very fast processor in the frame time analysis and primarily confirms the determined frame rates. The Kaby Lake X processor displays only a few slips and leads the frame rates course over large parts of the benchmark. In the comparison with the Ryzen 7 1700 and Ryzen 5 1600, a general difference in the frame rates is seen. The Core i7-7700K operates with a slightly lower fluctuation margin on average than the Core i7-7700K.
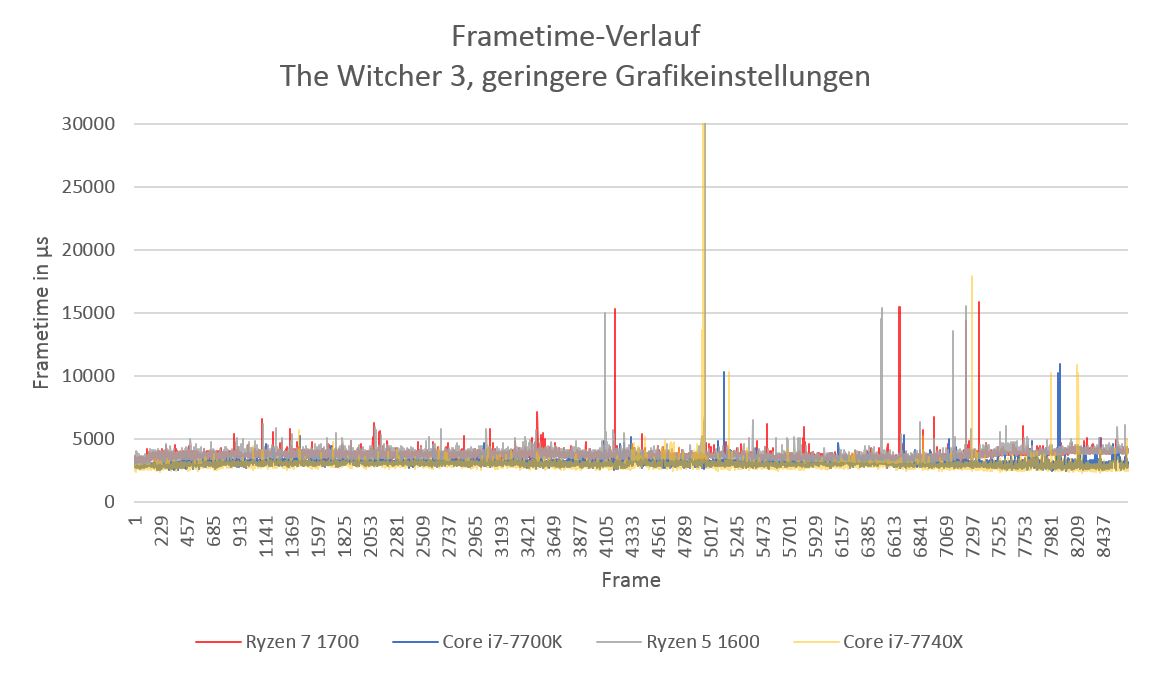
| Model | Core i7-7740X | Core i7-4790K | Ryzen R7 1700 | Ryzen R5 1600 | Ryzen R5 1400 |
| Frame time (Median, in µs) | 3032 | 3084 | 3823 | 3840 | 6527 |
| approx. min. deviation 20% | 1.891% | 2.711% | 1.129% | 1.104% | 3.771% |
| approx. min. deviation 50% | 0.266% | 0.276% | 0.213% | 0.176% | 0.862% |
| approx. min. deviation 100% | 0.091% | 0.049% | 0.066% | 0.047% | 0.284% |
| approx. min. deviation 300% | 0.032% | 0.005% | 0.053% | 0.020% | 0.046% |
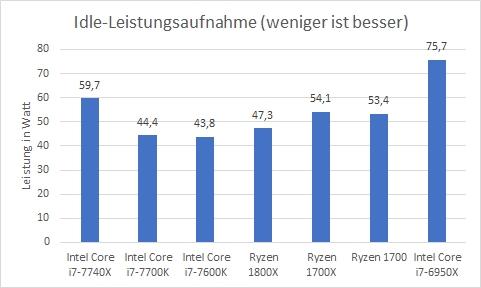
Energy Efficiency
Before everything else: Since the power consumption on different motherboards is determined as a sum parameter, there may be significant deviations in the idle power consumption in particular, depending on the motherboard used. Thus, according to the findings and also in line with the results from other publications, Intel's Core i7-7740X has an approximately 16% higher idle power consumption than the comparable Core i7-. The difference shrinks to approximately 6 watts (11%) in the comparison with the mid-range Ryzen APUs.
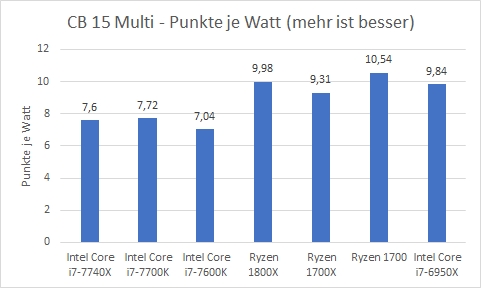
The actual energy efficiency between the Core i7-7740X and Core i7-7700K during load differs only slightly. The Kaby Lake X model cannot compete with the extremely energy efficient Ryzen models here.
Verdict
With the Core i7-7740X, Intel basically proves that performance capable CPUs are also possible for the LGA 2066 socket that is not affected by high power consumption or temperature issues.
However, it is ultimately a refresh of the Core i7-7700K that is in fact absolutely equal in the benchmarks and that does not have a (for players usually irrelevant) graphics card. Since the Core i7-7700K is just as expensive, but runs on a cheaper 1150 motherboard, there is no reason for 1150 motherboard owners to swap it for a Core i7-7700X plus a new motherboard.
Compared with the latest Ryzen APUs, a sometimes significant performance advantage due to higher clock rates can be seen in the gaming benchmarks. However, their practical relevance is rather low, as illustrated above. Applications that are optimized for multiple cores clearly benefit from the twice as high core count of similarly priced Ryzen APUs - this will also probably be true for games in the future.
Review Samples
The review samples for this test report were mainly provided by Intel (CPU), AMD (Ryzen APUs), Asus boards and memory kit, Noctua cooler. Intel loaned us the Core i7-6950X and i7-5960X. The X99-E motherboard and X299 motherboard came from Asus. Noctua provided us with an NH-U12S cooler for AMD AM4 and X99/X299 board.
Appendix
Intel Core i7-7740X
| Codename | Kaby Lake-X |
| Series | Intel Kaby Lake |
| Clock Rate | 4300 - 4500 MHz |
| Level 1 Cache | 256 KB |
| Level 2 Cache | 1 MB |
| Level 3 Cache | 8 MB |
| Number of Cores / Threads | 4 / 8 |
| Power Consumption (TDP = Thermal Design Power) | 112 Watt |
| Manufacturing Technology | 14 nm |
| Socket | FCLGA-2066 |
| Features | DDR4-2666 Memory Controller, HyperThreading, AVX, AVX2, AES-NI, TSX-NI, Quick Sync, Virtualization, vPro |
| 64 Bit | 64 Bit support |
| Architecture | x86 |
| Announcement Date | 05/30/2017 |
Benchmarks
* Smaller numbers mean a higher performance
- $42.47Intel Core i7-7740X X-Series Processor 4 Cores up to 4.50GHz Turbo Unlocked FCLGA2066 X299 Series 112W (Renewed)
- $209.95Intel Core i7-7740x Processor Tray (CM8067702868631)
- $72.83Intel Core i7-7700 Desktop Processor 4 Cores up to 4.2 GHz LGA 1151 100/200 Series 65W (Renewed)
- $376.94Intel® Core™ i7-14700K New Gaming Desktop Processor 20 cores (8 P-cores + 12 E-cores) with Integrated Graphics - Unlocked
- $53.99Intel Chip 3.2 4 BX80646I74770S