| Model | CPU | GPU | RAM | Value |
|---|
| Sapphire Pulse Radeon RX 6600 | R9 7950X 230 W / 170 W | Radeon RX 6600 2491 / 1750 MHz 8 GB | 32 GB | 78811 |
| Sapphire Nitro+ Radeon RX 6650 XT | R9 7950X 230 W / 170 W | Radeon RX 6650 XT 2694 / 2188 MHz 8 GB | 32 GB | 81549 |
| Sapphire Pulse Radeon RX 6500 XT | R9 7950X 230 W / 170 W | Radeon RX 6500 XT 2825 / 2250 MHz 4 GB | 32 GB | 81603 |
| AMD Radeon RX 6700 XT | R9 7950X 230 W / 170 W | Radeon RX 6700 XT 2639 / 2000 MHz 12 GB | 32 GB | 82285 |
| AMD Radeon RX 6800 | R9 7950X 230 W / 170 W | Radeon RX 6800 2105 / 2000 MHz 16 GB | 32 GB | 83256 |
| GPD G1 Radeon RX 7600M XT (OCuLink @PCIe x4 3.0) | R9 7950X 230 W / 170 W | Radeon RX 7600M XT 120 W 2500 / 2250 MHz 8 GB | 32 GB | 83733 |
| Minisforum MS-A1 | R9 7950X 65 W / 65 W | Radeon Graphics (Ryzen 7000) | 32 GB | 84049 |
| AMD Radeon RX 5700 | R9 7950X 230 W / 170 W | Radeon RX 5700 (Desktop) 1725 / 1750 MHz 8 GB | 32 GB | 89167 |
| Sapphire Nitro+ Radeon RX 5500 XT 8G SE | R9 7950X 230 W / 170 W | Radeon RX 5500 XT (Desktop) 1845 / 1750 MHz 8 GB | 32 GB | 89469 |
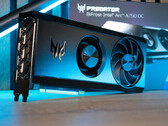
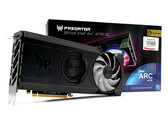
| Acer Predator BiFrost Arc A770 OC, 16GB GDDR6 | R9 7950X 230 W / 170 W | Arc A770 210 W 2400 / 2000 MHz 16 GB | 32 GB | 89727 |
| Sapphire Pulse Radeon RX 5600 XT | R9 7950X 230 W / 170 W | Radeon RX 5600 XT (Desktop) 1560 / 1500 MHz 6 GB | 32 GB | 89735 |
| AMD Radeon RX 7900 XTX | R9 7950X 230 W / 170 W | Radeon RX 7900 XTX 355 W 2499 / 2500 MHz 24 GB | 32 GB | 89737 |
| Sapphire Pulse Radeon RX 7700 XT | R9 7950X 230 W / 170 W | Radeon RX 7700 XT 245 W 2544 / 2250 MHz 12 GB | 32 GB | 89787 |
| Acer Predator BiFrost Arc A750 OC | R9 7950X 230 W / 170 W | Arc A750 210 W 2400 / 2000 MHz 8 GB | 32 GB | 90107 |
| AMD Radeon RX 7900 GRE | R9 7950X 230 W / 170 W | Radeon RX 7900 GRE 260 W 2245 / 2250 MHz 16 GB | 32 GB | 90122 |
| AMD Radeon RX 5700 XT | R9 7950X 230 W / 170 W | Radeon RX 5700 XT (Desktop) 1905 / 1750 MHz 8 GB | 32 GB | 90125 |
| AMD Radeon RX 7900 XT | R9 7950X 230 W / 170 W | Radeon RX 7900 XT 300 W 2394 / 2500 MHz 20 GB | 32 GB | 90192 |
| KFA2 GeForce RTX 4080 SG | R9 7950X 230 W / 170 W | GeForce RTX 4080 2580 / 1400 MHz 16 GB | 32 GB | 90299 |
| KFA2 GeForce RTX 4060 Ti EX, 16GB GDDR6 | R9 7950X 230 W / 170 W | GeForce RTX 4060 Ti 16G 165 W 2640 / 2250 MHz 16 GB | 32 GB | 90327 |
| Zotac GeForce GT 1030 | R9 7950X 230 W / 170 W | GeForce GT 1030 (Desktop) 1468 / 1500 MHz 2 GB | 32 GB | 90347 |
| KFA2 GeForce RTX 4070 Ti SG | R9 7950X 230 W / 170 W | GeForce RTX 4070 Ti 2670 / 1313 MHz 12 GB | 32 GB | 90350 |
| AMD Radeon RX 7800 XT | R9 7950X 230 W / 170 W | Radeon RX 7800 XT 263 W 2425 / 2250 MHz 16 GB | 32 GB | 90352 |
| MSI Radeon RX 6950 XT Gaming X Trio | R9 7950X 230 W / 170 W | Radeon RX 6950 XT 2454 / 2250 MHz 16 GB | 32 GB | 90499 |
ASUS ROG Strix GeForce GTX 1060  | R9 7950X 230 W / 170 W | GeForce GTX 1060 (Desktop) 1708 / 2000 MHz 6 GB | 32 GB | 90768 |
| MSI GeForce RTX 3070 Ti Suprim X | R9 7950X 230 W / 170 W | GeForce RTX 3070 Ti 310 W 1860 / 1188 MHz 8 GB | 32 GB | 90772 |
| XFX Speedster QICK 308 Radeon RX 7600 Black Edition | R9 7950X 230 W / 170 W | Radeon RX 7600 165 W 2754 / 2250 MHz 8 GB | 32 GB | 90817 |
| KFA2 GeForce RTX 4070 EX Gamer | R9 7950X 230 W / 170 W | GeForce RTX 4070 2535 / 1313 MHz 12 GB | 32 GB | 90977 |
| Nvidia GeForce RTX 3090 FE | R9 7950X 230 W / 170 W | GeForce RTX 3090 350 W 1695 / 1219 MHz 24 GB | 32 GB | 91234 |
| KFA2 GeForce RTX 4060 Ti EX | R9 7950X 230 W / 170 W | GeForce RTX 4060 Ti 8G 8 GB | 32 GB | 91319 |
| PNY GeForce RTX 3050 XLR8 | R9 7950X 230 W / 170 W | GeForce RTX 3050 1777 / 1750 MHz 8 GB | 32 GB | 91400 |
| Sapphire Pulse Radeon RX 6750 XT | R9 7950X 230 W / 170 W | Radeon RX 6750 XT 1618 / 2248 MHz 12 GB | 32 GB | 91454 |
| KFA2 GeForce RTX 4060 1-Click-OC 2X | R9 7950X 230 W / 170 W | GeForce RTX 4060 2475 / 2125 MHz 8 GB | 32 GB | 91461 |
| Nvidia Titan RTX | R9 7950X 230 W / 170 W | Titan RTX 1770 / 1750 MHz 24 GB | 32 GB | 91502 |
| MSI GeForce RTX 4060 Ti Gaming X Trio 8G | R9 7950X 230 W / 170 W | GeForce RTX 4060 Ti 8G 8 GB | 32 GB | 91647 |
| ASUS Dual GeForce RTX 4060 Ti OC | R9 7950X 230 W / 170 W | GeForce RTX 4060 Ti 8G 2565 / 2250 MHz 8 GB | 32 GB | 91745 |
| KFA2 GeForce RTX 4070 Ti EX Gamer | R9 7950X 230 W / 170 W | GeForce RTX 4070 Ti 2670 / 1313 MHz 12 GB | 32 GB | 92453 |
| KFA2 GeForce RTX 3070 Ti SG | R9 7950X 230 W / 170 W | GeForce RTX 3070 Ti 1800 / 1188 MHz 8 GB | 32 GB | 93647 |
| ASUS TUF Gaming GeForce RTX 3080 Ti OC | R9 7950X 230 W / 170 W | GeForce RTX 3080 Ti 1785 / 1188 MHz 12 GB | 32 GB | 93660 |
| KFA2 GeForce RTX 4090 SG | R9 7950X 230 W / 170 W | GeForce RTX 4090 450 W 2580 / 1313 MHz 24 GB | 32 GB | 93827 |
| KFA2 GeForce GTX 1650 Super EX One Click OC | R9 7950X 230 W / 170 W | GeForce GTX 1650 Super (Desktop) 1740 / 1500 MHz 4 GB | 32 GB | 93852 |
| Palit GeForce RTX 4090 GameRock OC | R9 7950X 230 W / 170 W | GeForce RTX 4090 450 W 2610 / 1313 MHz 24 GB | 32 GB | 94087 |
| Nvidia GeForce RTX 3060 Ti FE | R9 7950X 230 W / 170 W | GeForce RTX 3060 Ti 1665 / 1750 MHz 8 GB | 32 GB | 94114 |
| Nvidia GeForce RTX 2060 Super | R9 7950X 230 W / 170 W | GeForce RTX 2060 Super (Desktop) 1650 / 1750 MHz 8 GB | 32 GB | 94247 |
| KFA2 GeForce GTX 1660 Super | R9 7950X 230 W / 170 W | GeForce GTX 1660 Super (Desktop) 1800 / 1750 MHz 6 GB | 32 GB | 94394 |
| PNY GeForce GTX 1660 | R9 7950X 230 W / 170 W | GeForce GTX 1660 (Desktop) 1830 / 2000 MHz 6 GB | 32 GB | 94485 |
| Nvidia GeForce RTX 2070 Super | R9 7950X 230 W / 170 W | GeForce RTX 2070 Super (Desktop) 1770 / 1750 MHz 8 GB | 32 GB | 94536 |
| Nvidia Titan X (Pascal) | R9 7950X 230 W / 170 W | Titan X Pascal 1531 / 1251 MHz 12 GB | 32 GB | 94779 |
| NVIDIA GeForce RTX 3090 Founders Edition | R9 7950X | GeForce RTX 3090 1695 / 1219 MHz 24 GB | | 100969 |