Notebookcheck Logo

Intel Arc 8-Core iGPU vs NVIDIA RTX 500 Ada Generation Laptop

Intel Arc 8-Core iGPU

► remove from comparison Intel Arc 8-Core

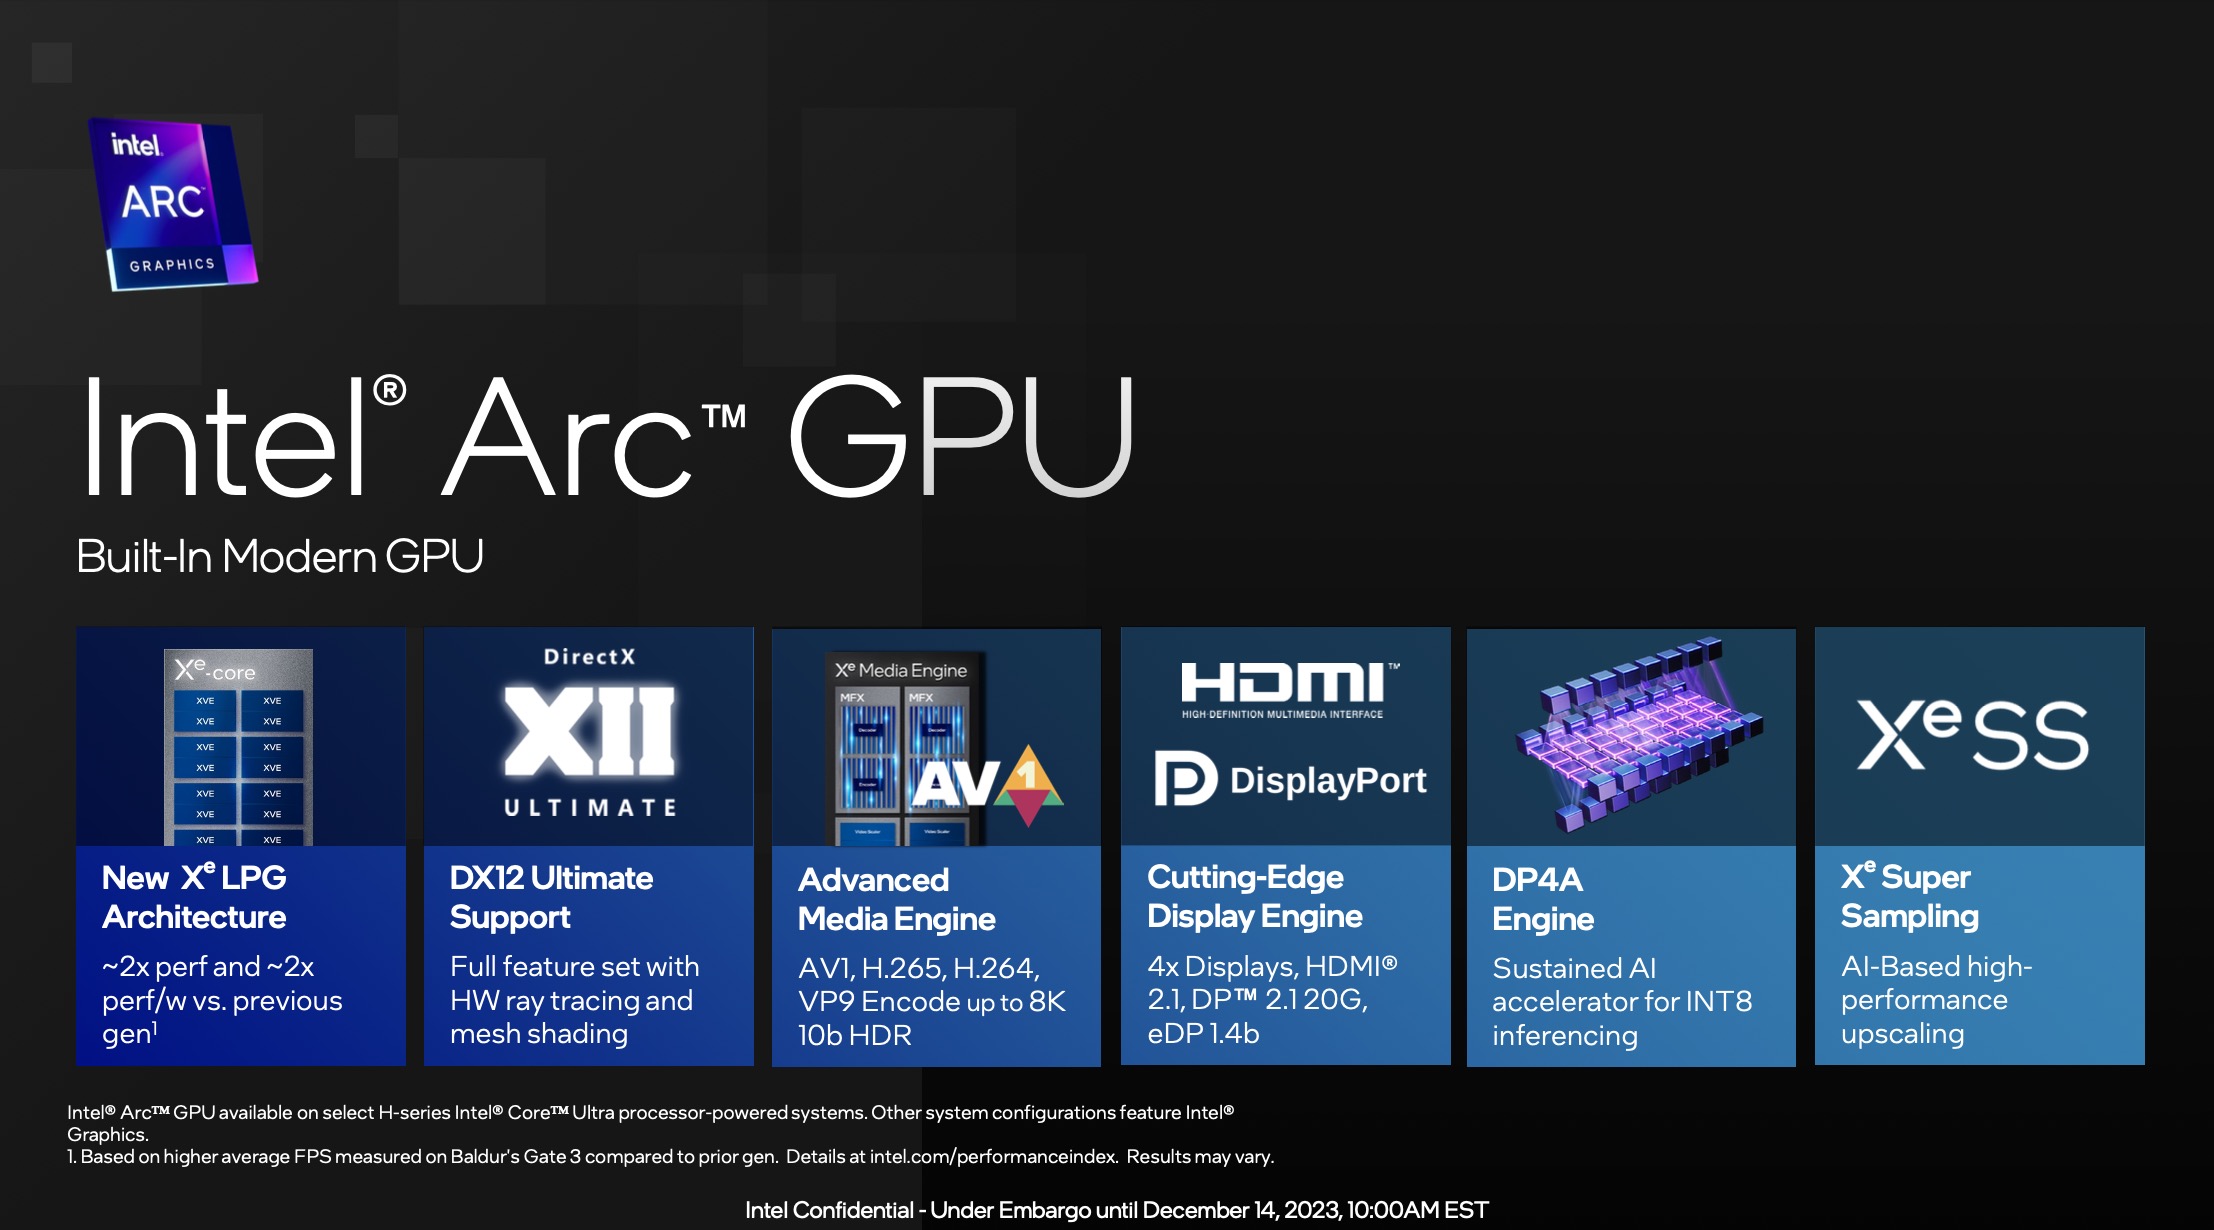
The Intel Arc iGPU with 8 cores (ID 7D55) is an integrated graphics adapter in Meteor Lake SoCs based on the Xe LPG architecture (similar to the dedicated Arc GPUs, but with a focus on efficiency). It offers all 8 Xe cores (128 Xe vector engines), 8 ray tracing units, 8 samplers and 4 pixel backends.

The Arc name may only be used if at least 16 GB RAM is used in dual channel mode. Otherwise, the only iGPU is called "Intel Graphics" and is also significantly slower.

According to Intel, performance has been doubled compared to the previous generation (probably still in Alder Lake).

The iGPU supports DirectX 12 Ultimate (probably DX 12_2 like the desktop Arc GPUs). The graphics unit also supports XeSS AI Super Sampling.

The media engine of Meteor Lake is in the SOC tile and supports up to 8k60 10-bit HDR encode and decode of MPEG2, AVC, VP9, HEVC and AV1. The display engine is also in the SoC tile and supports HDMI 2.1 and DisplayPort 2.1 20G with up to 8K60 HDR.

The GPU Tile of the Meteor Lake chip is manufactured at TSMC on 5nm (5N process).

NVIDIA RTX 500 Ada Generation Laptop

► remove from comparison NVIDIA RTX 500 Ada Generation Laptop

The Nvidia RTX 500 Ada Generation, not to be confused with the A500, P500 and the T500, is a lower-end professional graphics card for use in laptops that sports 2,048 CUDA cores and a paltry 4 GB of GDDR6 VRAM. We believe this graphics card to be a heavily cut-down GeForce RTX 4050 Laptop; therefore, both should employ the Ada Lovelace AD107 chip built with TSMC's 5 nm process. The RTX 500 was launched in February 2024. The Nvidia-recommended TGP range for this graphics card is moderately wide at 35 W to 60 W [the second figure includes the Dynamic Boost, it seems] leading to noticeable performance differences between different systems powered by what is supposed to be the same graphics card.

Quadro series graphics cards ship with much different BIOS and drivers than GeForce cards and are targeted at professional users rather than gamers. Commercial product design, large-scale calculations, simulation, data mining, 24 x 7 operation, certified drivers - if any of this sounds familiar, then a Quadro card will make you happy.

Architecture and Features

Ada Lovelace brings a range of improvements over older graphics cards utilizing the outgoing Ampere architecture. It's not just a better manufacturing process and a higher number of CUDA cores that we have here; under-the-hood refinements are plentiful, including an immensely larger L2 cache, an optimized ray tracing routine (a different way to determine what is transparent and what isn't is used), and other changes. Naturally, these graphics cards can both encode and decode some of the most widely used video codecs, AVC, HEVC and AV1 included; they also support a host of proprietary Nvidia technologies, including Optimus and DLSS 3, and they can certainly be used for various AI applications.

The RTX 500 Ada features 16 RT cores of the 3rd generation, 64 Tensor cores of the 4th generation and 2,048 CUDA cores. Increase those numbers by 25%, and you get the RTX 1000 Ada - as long as we pay no attention to clock speed differences, of course. Unlike costlier Ada Generation professional laptop graphics cards, the RTX 500 comes with just 4 GB of non-ECC VRAM; the lack of error correction makes this card less suitable for super-important tasks and round-the-clock operation. The VRAM is just 64-bit wide, delivering an anemic bandwidth of ~128 GB/s.

The RTX 500 Ada Generation makes use of the PCI-Express 4 protocol, just like Ampere-based cards did. 8K SUHD monitors are supported, however, DP 1.4a video outputs may prove to be a bottleneck down the line.

Performance

At 50 W (35 W + 15 W Dynamic Boost), the graphics card can handle most 2023 and 2024 games like Baldur's Gate 3 at 1080p on high graphics settings. With a Geekbench 6.2 OpenCL GPU score of 61,500 points and a Blender v3.3 Classroom CUDA score of 71 seconds, it's clear the Ada is so much faster than any integrated GPUs on the market including the 890M.

Power consumption

With the latest Nvidia graphics cards, laptop makers are free to set the TGP according to their needs within a fairly wide range. With the RTX 500 Ada, we have the lowest value recommended sitting at just at 35 W while the highest value is 60 W [this most likely includes Dynamic Boost]. Real-world performance of the slowest RTX 500 Ada will probably be around 40% lower than that of the fastest one.

Last but not the least, the improved 5 nm process (TSMC 4N) the AD107 chip is built with makes for decent energy efficiency, as of early 2024.

Intel Arc 8-Core iGPUNVIDIA RTX 500 Ada Generation Laptop
RTX Ada Generation Laptop Series
Arc 8-Core 8 @ 2.3 GHz
Arc 7-Core compare 7 @ 2.2 GHz
Graphics 4-Core iGPU (Arrow Lake) compare 64 @ 0.3 - 1.95 GHz
RTX 5000 Ada Generation Laptop compare 9728 @ 0.93 - 1.68 GHz256 Bit @ 20000 MHz
RTX 4000 Ada Generation Laptop compare 7424 192 Bit @ 16000 MHz
RTX 3500 Ada Generation Laptop compare 5120 192 Bit @ 16000 MHz
RTX 3000 Ada Generation Laptop compare 4608 128 Bit @ 16000 MHz
RTX 2000 Ada Generation Laptop compare 3072 128 Bit @ 16000 MHz
RTX 1000 Ada Generation Laptop compare 2560 96 Bit @ 16000 MHz
RTX 500 Ada Generation Laptop 2048 @ 1.49 - 2.03 GHz64 Bit @ 12000 MHz
CodenameMeteor Lake iGPU
ArchitectureXe LPGAda Lovelace
Pipelines8 - unified2048 - unified
Raytracing Cores816
Core Speed2300 (Boost) MHz1485 - 2025 (Boost) MHz
CacheL1: 1.5 MBL1: 2 MB, L2: 12 MB
Shared Memoryyesno
APIDirectX 12_2, OpenGL 4.6, Vulkan 1.3DirectX 12 Ultimate, Shader 6.7, OpenGL 4.6, OpenCL 3.0, Vulkan 1.3
technology5 nm5 nm
DisplaysHDMI 2.1b, DisplayPort 2.0 20G4 Displays (max.), HDMI 2.1, DisplayPort 1.4a
Date of Announcement14.12.2023 27.02.2024
TMUs64
ROPs32
Tensor / AI Cores64
AI GPU154 TOPS INT8
Memory Speed12000 effective = 1500 MHz
Memory Bus Width64 Bit
Memory TypeGDDR6
Max. Amount of Memory4 GB
Memory Bandwidth128 GB/s
Power Consumption60 Watt (35 - 60 Watt TGP)
PCIe4.0 x16
Notebook Sizemedium sized
Link to Manufacturer Pageimages.nvidia.com
CPU in Arc 8-CoreGPU Base SpeedGPU Boost / Turbo
Intel Core Ultra 9 185H16 x 3800 MHz, 45 W? MHz2350 MHz
Intel Core Ultra 7 165H16 x 3800 MHz, 28 W? MHz2300 MHz
Intel Core Ultra 7 155H16 x 3800 MHz, 28 W? MHz2250 MHz
Intel Core Ultra 5 135H14 x 3600 MHz, 28 W? MHz2200 MHz
min. - max.? MHz2200 - 2350 MHz

Benchmarks

Performance Rating - 3DMark 11 + Fire Strike + Time Spy - Arc 8-Core
3.2 pt (10%)
Restrict / Search: Model: Max. age: years
3DMark - 3DMark Speed Way Score
min: 391     avg: 422.4     median: 413 (3%)     max: 457 Points
3DMark - 3DMark Steel Nomad
min: 572     avg: 690     median: 693.5 (5%)     max: 784 Points
981 Points (7%)
3DMark - 3DMark Steel Nomad Light
min: 2356     avg: 2935     median: 2971 (7%)     max: 3248 Points
5441 Points (12%)
3DMark - 3DMark Wild Life Extreme Unlimited
min: 4294     avg: 6018     median: 6363 (7%)     max: 6686 Points
10353 Points (12%)
3DMark - 3DMark Solar Bay
min: 9394     avg: 11618     median: 12574 (6%)     max: 12980 Points
3DMark - 3DMark Fire Strike Standard Score
min: 5203     avg: 7535     median: 7815.5 (12%)     max: 9084 Points
min: 12761     avg: 13178     median: 13177.5 (20%)     max: 13594 Points
3DMark - 3DMark Fire Strike Standard Graphics
min: 5568     avg: 8203     median: 8513 (8%)     max: 9692 Points
min: 14136     avg: 14610     median: 14610 (13%)     max: 15084 Points
3DMark - 3DMark Ice Storm Graphics
min: 88046     avg: 185752     median: 196127 (22%)     max: 264739 Points
3DMark - 3DMark Time Spy Score
min: 2178     avg: 3531     median: 3580 (9%)     max: 4176 Points
min: 5745     avg: 5902     median: 5902 (15%)     max: 6059 Points
3DMark - 3DMark Time Spy Graphics
min: 2018     avg: 3212     median: 3269 (7%)     max: 3770 Points
min: 5278     avg: 5449     median: 5448.5 (11%)     max: 5619 Points
3DMark - 3DMark Ice Storm Unlimited Graphics
min: 397122     avg: 410287     median: 408060 (41%)     max: 427906 Points
3DMark - 3DMark Ice Storm Extreme Graphics
min: 78589     avg: 142909     median: 159691 (19%)     max: 163878 Points
3DMark - 3DMark Cloud Gate Score
min: 18794     avg: 30631     median: 31438 (30%)     max: 37020 Points
47157 Points (45%)
3DMark - 3DMark Cloud Gate Graphics
min: 31876     avg: 42601     median: 44014 (11%)     max: 52200 Points
92300 Points (23%)
3DMark - 3DMark Night Raid
min: 13461     avg: 25851     median: 27400 (26%)     max: 29487 Points
3DMark - 3DMark Night Raid Graphics Score
min: 25821     avg: 33139     median: 34198.5 (13%)     max: 36983 Points
3DMark 11 - 3DM11 Performance Score
min: 7756     avg: 11786     median: 12326 (15%)     max: 13943 Points
min: 20365     avg: 20396     median: 20395.5 (25%)     max: 20426 Points
3DMark 11 - 3DM11 Performance GPU
min: 8064     avg: 11751     median: 12275.5 (9%)     max: 13716 Points
min: 20239     avg: 20464     median: 20463.5 (16%)     max: 20688 Points
3DMark Vantage
3DM Vant. Perf. total + Intel Arc 8-Core iGPU
3DMark Vantage - 3DM Vant. Perf. total
min: 38739     avg: 41084     median: 41223 (12%)     max: 43259 Points
3DM Vant. Perf. total + NVIDIA RTX 500 Ada Generation Laptop
66297 Points (19%)
3DM Vant. Perf. GPU no PhysX + Intel Arc 8-Core iGPU
3DMark Vantage - 3DM Vant. Perf. GPU no PhysX
min: 33028     avg: 36137     median: 36546 (20%)     max: 39184 Points
3DM Vant. Perf. GPU no PhysX + NVIDIA RTX 500 Ada Generation Laptop
64680 Points (35%)
3DMark 05 - 3DMark 05 - Standard
min: 42967     avg: 47870     median: 47115 (52%)     max: 53214 Points
3DMark 06 3DMark 06 - Standard 1280x1024 + Intel Arc 8-Core iGPU
3DMark 06
min: 34184     avg: 36632     median: 36442 (48%)     max: 38214 Points
3DMark 06 - Standard 1280x1024 + NVIDIA RTX 500 Ada Generation Laptop
50935 Points (67%)
Unigine Valley 1.0 - Unigine Valley 1.0 DX
min: 17.1     avg: 19     median: 19.5 (6%)     max: 20.1 fps
59.2 fps (18%)
Unigine Heaven 3.0 - Unigine Heaven 3.0 DX 11
88.2 fps (29%)
Blender - Blender 3.3 Classroom CUDA *
min: 71     avg: 71.5     median: 71.5 (11%)     max: 72 Seconds
Blender - Blender 3.3 Classroom OPTIX *
min: 39     avg: 41     median: 41 (15%)     max: 43 Seconds
SPECviewperf 12
specvp12 sw-03 + Intel Arc 8-Core iGPU
SPECviewperf 12 - specvp12 sw-03
min: 42.7     avg: 42.9     median: 42.9 (11%)     max: 43 fps
specvp12 sw-03 + NVIDIA RTX 500 Ada Generation Laptop
92 fps (23%)
specvp12 snx-02 + Intel Arc 8-Core iGPU
SPECviewperf 12 - specvp12 snx-02
min: 3.29     avg: 3.4     median: 3.4 (1%)     max: 3.56 fps
specvp12 snx-02 + NVIDIA RTX 500 Ada Generation Laptop
144 fps (21%)
specvp12 showcase-01 + Intel Arc 8-Core iGPU
SPECviewperf 12 - specvp12 showcase-01
min: 18.2     avg: 19.1     median: 19.1 (3%)     max: 19.9 fps
specvp12 showcase-01 + NVIDIA RTX 500 Ada Generation Laptop
57.6 fps (10%)
specvp12 mediacal-01 + Intel Arc 8-Core iGPU
SPECviewperf 12 - specvp12 mediacal-01
min: 15.9     avg: 16.4     median: 16.4 (4%)     max: 16.9 fps
specvp12 mediacal-01 + NVIDIA RTX 500 Ada Generation Laptop
51.8 fps (13%)
specvp12 maya-04 + Intel Arc 8-Core iGPU
SPECviewperf 12 - specvp12 maya-04
min: 54.9     avg: 56.5     median: 56.5 (15%)     max: 58 fps
specvp12 maya-04 + NVIDIA RTX 500 Ada Generation Laptop
131.7 fps (36%)
specvp12 energy-01 + Intel Arc 8-Core iGPU
SPECviewperf 12 - specvp12 energy-01
min: 0.67     avg: 0.8     median: 0.8 (1%)     max: 0.91 fps
specvp12 energy-01 + NVIDIA RTX 500 Ada Generation Laptop
1.8 fps (2%)
specvp12 creo-01 + Intel Arc 8-Core iGPU
SPECviewperf 12 - specvp12 creo-01
min: 22.7     avg: 22.9     median: 22.9 (9%)     max: 23.1 fps
specvp12 creo-01 + NVIDIA RTX 500 Ada Generation Laptop
121.6 fps (49%)
specvp12 catia-04 + Intel Arc 8-Core iGPU
SPECviewperf 12 - specvp12 catia-04
min: 48.2     avg: 49.8     median: 49.8 (8%)     max: 51.3 fps
specvp12 catia-04 + NVIDIA RTX 500 Ada Generation Laptop
147 fps (24%)
specvp12 3dsmax-05 + Intel Arc 8-Core iGPU
SPECviewperf 12 - specvp12 3dsmax-05
min: 49.7     avg: 49.8     median: 49.8 (8%)     max: 49.8 fps
specvp12 3dsmax-05 + NVIDIA RTX 500 Ada Generation Laptop
157.6 fps (24%)
SPECviewperf 13 specvp13 sw-04 + Intel Arc 8-Core iGPU
SPECviewperf 13 - specvp13 sw-04
min: 44.8     avg: 45.2     median: 45.2 (12%)     max: 45.6 fps
specvp13 sw-04 + NVIDIA RTX 500 Ada Generation Laptop
161.8 fps (43%)
specvp13 snx-03 + Intel Arc 8-Core iGPU
SPECviewperf 13 - specvp13 snx-03
min: 5.9     avg: 6.2     median: 6.2 (1%)     max: 6.43 fps
specvp13 snx-03 + NVIDIA RTX 500 Ada Generation Laptop
267.4 fps (30%)
specvp13 showcase-02 + Intel Arc 8-Core iGPU
SPECviewperf 13 - specvp13 showcase-02
min: 18.2     avg: 19.1     median: 19.1 (3%)     max: 19.9 fps
specvp13 showcase-02 + NVIDIA RTX 500 Ada Generation Laptop
55.9 fps (10%)
specvp13 medical-02 + Intel Arc 8-Core iGPU
SPECviewperf 13 - specvp13 medical-02
min: 25     avg: 27.4     median: 27.4 (5%)     max: 29.7 fps
specvp13 medical-02 + NVIDIA RTX 500 Ada Generation Laptop
141.9 fps (24%)
specvp13 maya-05 + Intel Arc 8-Core iGPU
SPECviewperf 13 - specvp13 maya-05
min: 59.5     avg: 61     median: 61 (7%)     max: 62.5 fps
specvp13 maya-05 + NVIDIA RTX 500 Ada Generation Laptop
203.2 fps (23%)
specvp13 energy-02 + Intel Arc 8-Core iGPU
SPECviewperf 13 - specvp13 energy-02
min: 5.27     avg: 5.5     median: 5.5 (2%)     max: 5.69 fps
specvp13 energy-02 + NVIDIA RTX 500 Ada Generation Laptop
2.8 fps (1%)
specvp13 creo-02 + Intel Arc 8-Core iGPU
SPECviewperf 13 - specvp13 creo-02
min: 29.3     avg: 29.5     median: 29.5 (4%)     max: 29.6 fps
specvp13 creo-02 + NVIDIA RTX 500 Ada Generation Laptop
193.2 fps (28%)
specvp13 catia-05 + Intel Arc 8-Core iGPU
SPECviewperf 13 - specvp13 catia-05
min: 71.6     avg: 74.2     median: 74.2 (8%)     max: 76.8 fps
specvp13 catia-05 + NVIDIA RTX 500 Ada Generation Laptop
244.4 fps (27%)
specvp13 3dsmax-06 + Intel Arc 8-Core iGPU
SPECviewperf 13 - specvp13 3dsmax-06
min: 46.4     avg: 47.5     median: 47.5 (7%)     max: 48.5 fps
specvp13 3dsmax-06 + NVIDIA RTX 500 Ada Generation Laptop
148.5 fps (23%)
SPECviewperf 2020 specvp2020 snx-04 1080p + Intel Arc 8-Core iGPU
SPECviewperf 2020 - specvp2020 snx-04 1080p
min: 5.56     avg: 5.8     median: 5.8 (1%)     max: 5.94 fps
specvp2020 snx-04 1080p + NVIDIA RTX 500 Ada Generation Laptop
min: 258.44     avg: 260.2     median: 260.2 (29%)     max: 261.92 fps
specvp2020 medical-03 1080p + Intel Arc 8-Core iGPU
SPECviewperf 2020 - specvp2020 medical-03 1080p
min: 14.7     avg: 16.7     median: 17.6 (5%)     max: 17.8 fps
specvp2020 medical-03 1080p + NVIDIA RTX 500 Ada Generation Laptop
min: 59.75     avg: 62.5     median: 62.5 (17%)     max: 65.25 fps
specvp2020 maya-06 1080p + Intel Arc 8-Core iGPU
SPECviewperf 2020 - specvp2020 maya-06 1080p
min: 86.9     avg: 88.1     median: 87.6 (9%)     max: 89.9 fps
specvp2020 maya-06 1080p + NVIDIA RTX 500 Ada Generation Laptop
241.1 fps (26%)
specvp2020 energy-03 1080p + Intel Arc 8-Core iGPU
SPECviewperf 2020 - specvp2020 energy-03 1080p
min: 5.5     avg: 6.1     median: 6.3 (1%)     max: 6.4 fps
specvp2020 energy-03 1080p + NVIDIA RTX 500 Ada Generation Laptop
min: 2.78     avg: 19.5     median: 19.5 (3%)     max: 36.12 fps
specvp2020 creo-03 1080p + Intel Arc 8-Core iGPU
SPECviewperf 2020 - specvp2020 creo-03 1080p
min: 24.5     avg: 26     median: 26 (9%)     max: 27.6 fps
specvp2020 creo-03 1080p + NVIDIA RTX 500 Ada Generation Laptop
min: 107.4     avg: 110.5     median: 110.5 (38%)     max: 113.62 fps
specvp2020 catia-06 1080p + Intel Arc 8-Core iGPU
SPECviewperf 2020 - specvp2020 catia-06 1080p
min: 17.7     avg: 18.4     median: 18.1 (9%)     max: 19.5 fps
specvp2020 catia-06 1080p + NVIDIA RTX 500 Ada Generation Laptop
min: 56.25     avg: 57.5     median: 57.5 (28%)     max: 58.71 fps
specvp2020 3dsmax-07 1080p + Intel Arc 8-Core iGPU
SPECviewperf 2020 - specvp2020 3dsmax-07 1080p
min: 21.6     avg: 23.4     median: 22.6 (6%)     max: 26.1 fps
specvp2020 3dsmax-07 1080p + NVIDIA RTX 500 Ada Generation Laptop
min: 59.56     avg: 59.7     median: 59.7 (16%)     max: 59.92 fps
specvp2020 solidworks-05 4k + Intel Arc 8-Core iGPU
SPECviewperf 2020 - specvp2020 solidworks-05 4k
min: 11     avg: 11.6     median: 11.6 (3%)     max: 12.1 fps
specvp2020 snx-04 4k + Intel Arc 8-Core iGPU
SPECviewperf 2020 - specvp2020 snx-04 4k
min: 5.37     avg: 5.7     median: 5.7 (1%)     max: 6.24 fps
specvp2020 medical-03 4k + Intel Arc 8-Core iGPU
SPECviewperf 2020 - specvp2020 medical-03 4k
min: 4.23     avg: 5.8     median: 5.7 (4%)     max: 7.07 fps
specvp2020 maya-06 4k + Intel Arc 8-Core iGPU
SPECviewperf 2020 - specvp2020 maya-06 4k
min: 35.4     avg: 38     median: 37.7 (5%)     max: 41 fps
specvp2020 energy-03 4k + Intel Arc 8-Core iGPU
SPECviewperf 2020 - specvp2020 energy-03 4k
min: 4.25     avg: 5     median: 4.9 (1%)     max: 6.03 fps
specvp2020 creo-03 4k + Intel Arc 8-Core iGPU
SPECviewperf 2020 - specvp2020 creo-03 4k
min: 17.9     avg: 18.6     median: 18.5 (8%)     max: 19.8 fps
specvp2020 catia-06 4k + Intel Arc 8-Core iGPU
SPECviewperf 2020 - specvp2020 catia-06 4k
min: 10     avg: 11.1     median: 11.2 (7%)     max: 11.7 fps
specvp2020 3dsmax-07 4k + Intel Arc 8-Core iGPU
SPECviewperf 2020 - specvp2020 3dsmax-07 4k
min: 12.9     avg: 14.4     median: 14.8 (5%)     max: 15.5 fps
specvp2020 solidworks-07 1080p + NVIDIA RTX 500 Ada Generation Laptop
SPECviewperf 2020 - specvp2020 solidworks-07 1080p
min: 138.26     avg: 138.7     median: 138.7 (24%)     max: 139.14 fps
specvp2020 solidworks-05 1080p + NVIDIA RTX 500 Ada Generation Laptop
SPECviewperf 2020 - specvp2020 solidworks-05 1080p
136 fps (25%)
Cinebench R10 Cinebench R10 Shading (32bit) + Intel Arc 8-Core iGPU
Cinebench R10 - Cinebench R10 Shading (32bit)
min: 15259     avg: 17638     median: 18259 (13%)     max: 19892 Points
Cinebench R11.5 Cinebench R11.5 OpenGL 64 Bit + Intel Arc 8-Core iGPU
Cinebench R11.5 - Cinebench R11.5 OpenGL 64 Bit
min: 97.07     avg: 107     median: 108 (36%)     max: 115.68 fps
Cinebench R15
Cinebench R15 OpenGL 64 Bit + Intel Arc 8-Core iGPU
Cinebench R15 - Cinebench R15 OpenGL 64 Bit
min: 126.9     avg: 151.3     median: 151.9 (9%)     max: 176.3 fps
Cinebench R15 OpenGL 64 Bit + NVIDIA RTX 500 Ada Generation Laptop
min: 252     avg: 273.5     median: 273.5 (16%)     max: 295 fps
Cinebench R15 OpenGL Ref. Match 64 Bit + Intel Arc 8-Core iGPU
Cinebench R15 - Cinebench R15 OpenGL Ref. Match 64 Bit
97.8 % (98%)
Cinebench R15 OpenGL Ref. Match 64 Bit + NVIDIA RTX 500 Ada Generation Laptop
99.6 % (100%)
GFXBench - GFXBench 5.0 4K Aztec Ruins High Tier Offscreen
min: 30.6     avg: 37.3     median: 38.6 (14%)     max: 41.6 fps
52.7 fps (20%)
GFXBench - GFXBench 5.0 Aztec Ruins High Tier Offscreen
min: 74     avg: 83     median: 83.4 (15%)     max: 91.5 fps
126.4 fps (23%)
GFXBench - GFXBench 5.0 Aztec Ruins Normal Tier Offscreen
min: 180     avg: 203.5     median: 206.4 (15%)     max: 233.2 fps
353.2 fps (26%)
GFXBench - GFXBench Car Chase Offscreen
min: 143     avg: 155     median: 155 (15%)     max: 167.07 fps
GFXBench 3.1 - GFXBench Manhattan ES 3.1 Offscreen
215 fps (5%)
GFXBench 3.0 - GFXBench 3.0 Manhattan Offscreen
331 fps (14%)
GFXBench (DX / GLBenchmark) 2.7
GFXBench T-Rex HD Offscreen C24Z16 + Intel Arc 8-Core iGPU
GFXBench (DX / GLBenchmark) 2.7 - GFXBench T-Rex HD Offscreen C24Z16
min: 727     avg: 772     median: 772.2 (6%)     max: 817.4 fps
Basemark GPU 1.2 - Basemark GPU 1.2 Vulkan Official Medium Offscreen 1080
min: 104.6     avg: 277.2     median: 287 (7%)     max: 1992 fps
min: 104.6     avg: 209.8     median: 209.8 (5%)     max: 315 fps
Basemark GPU 1.2 - Basemark GPU 1.2 Vulkan Official High Offscreen 2160
min: 3.64     avg: 16.7     median: 3.6 (1%)     max: 176.8 fps
Geekbench 6.5 - Geekbench 6.5 GPU OpenCL
min: 17911     avg: 31967     median: 34397.5 (9%)     max: 39941 Points
min: 61467     avg: 62502     median: 62502 (16%)     max: 63537 Points
Geekbench 6.5 - Geekbench 6.5 GPU Vulkan
min: 16515     avg: 31367     median: 32858 (8%)     max: 37129 Points
min: 34889     avg: 49556     median: 49555.5 (12%)     max: 64222 Points
LuxMark v2.0 64Bit - LuxMark v2.0 Room GPU
min: 549     avg: 670     median: 683.5 (2%)     max: 747 Samples/s
1760 Samples/s (6%)
LuxMark v2.0 64Bit - LuxMark v2.0 Sala GPU
min: 2319     avg: 2665     median: 2671.5 (5%)     max: 2927 Samples/s
5177 Samples/s (9%)
ComputeMark v2.1 - ComputeMark v2.1 Result
min: 6270     avg: 7207     median: 7537 (6%)     max: 7963 Points
13116 Points (11%)
Power Consumption - Furmark Stress Test Power Consumption - external Monitor *
min: 35     avg: 50.6     median: 50.3 (7%)     max: 69.6 Watt
min: 73     avg: 75.9     median: 75.9 (10%)     max: 78.7 Watt
Power Consumption - The Witcher 3 Power Consumption - external Monitor *
min: 27     avg: 44.2     median: 44.1 (6%)     max: 61 Watt
81.5 Watt (11%)
Power Consumption - Witcher 3 Power Consumption *
min: 29.7     avg: 47.7     median: 46.7 (10%)     max: 64.6 Watt
Power Consumption - Power Efficiency - Witcher 3 ultra
min: 0.3826     avg: 0.5     median: 0.5 (45%)     max: 1.108 fps per Watt
Power Consumption - Power Efficiency - Witcher 3 ultra external Monitor
min: 0.4246     avg: 0.6     median: 0.5 (44%)     max: 1.207 fps per Watt
0.6 fps per Watt (52%)
Power Consumption - Cyberpunk 2077 Power Consumption 150cd *
min: 38.8     avg: 57.6     median: 55.5 (15%)     max: 76.7 Watt
min: 84     avg: 85.4     median: 85.4 (24%)     max: 86.7 Watt
Power Consumption - Cyberpunk 2077 Power Consumption - external Monitor *
min: 40.7     avg: 56.8     median: 54.6 (7%)     max: 74.1 Watt
min: 80.6     avg: 82.6     median: 82.6 (10%)     max: 84.6 Watt
Power Consumption - Power Efficiency - Cyberpunk 2077 ultra
min: 0.1867     avg: 0.3     median: 0.2 (1%)     max: 0.4816 fps per Watt
0.4 fps per Watt (2%)
Emissions Witcher 3 Fan Noise + Intel Arc 8-Core iGPU
Emissions - Witcher 3 Fan Noise
min: 27     avg: 38.1     median: 38 (54%)     max: 46.3 dB(A)

Average Benchmarks Intel Arc 8-Core iGPU → 100% n=51

Average Benchmarks NVIDIA RTX 500 Ada Generation Laptop → 484% n=51

- Range of benchmark values for this graphics card
red legend - Average benchmark values for this graphics card
* Smaller numbers mean a higher performance
1 This benchmark is not used for the average calculation

Game Benchmarks

The following benchmarks stem from our benchmarks of review laptops. The performance depends on the used graphics memory, clock rate, processor, system settings, drivers, and operating systems. So the results don't have to be representative for all laptops with this GPU. For detailed information on the benchmark results, click on the fps number.

F1 25

F1 25

2025
low 1920x1080
RTX 500 Ada Generation Laptop:
130  fps
med. 1920x1080
RTX 500 Ada Generation Laptop:
96.9  fps
high 1920x1080
RTX 500 Ada Generation Laptop:
73.6 74.6 ~ 74 fps
ultra 1920x1080
RTX 500 Ada Generation Laptop:
7.4  fps
low 1920x1080
100%
Arc 8-Core:
12  fps
med. 1920x1080
100%
Arc 8-Core:
11  fps
high 1920x1080
100%
Arc 8-Core:
10  fps
low 1920x1080
100%
Arc 8-Core:
48.3  fps
med. 1920x1080
100%
Arc 8-Core:
45.4  fps
high 1920x1080
100%
Arc 8-Core:
20.3  fps
low 1920x1080
100%
Arc 8-Core:
12.2 13.6 ~ 13 fps
med. 1920x1080
100%
Arc 8-Core:
11.3  fps
low 1920x1080
100%
Arc 8-Core:
24.9  fps
low 1920x1080
100%
Arc 8-Core:
12.9  fps
Stalker 2

Stalker 2

2024
low 1920x1080
100%
Arc 8-Core:
22.3  fps
low 1920x1080
100%
Arc 8-Core:
24  fps
med. 1920x1080
100%
Arc 8-Core:
22  fps
low 1920x1080
100%
Arc 8-Core:
40.2  fps
med. 1920x1080
100%
Arc 8-Core:
27.2  fps
high 1920x1080
100%
Arc 8-Core:
18.9  fps
ultra 1920x1080
100%
Arc 8-Core:
14  fps
low 1920x1080
100%
Arc 8-Core:
75.8  fps
med. 1920x1080
100%
Arc 8-Core:
55.4  fps
high 1920x1080
100%
Arc 8-Core:
45  fps
ultra 1920x1080
100%
Arc 8-Core:
43.1  fps
low 1920x1080
100%
Arc 8-Core:
10.6  fps
med. 1920x1080
100%
Arc 8-Core:
10.4  fps
high 1920x1080
100%
Arc 8-Core:
10.1  fps
ultra 1920x1080
100%
Arc 8-Core:
10  fps
low 1920x1080
100%
Arc 8-Core:
0 (!) 20.3 ~ 10 fps
med. 1920x1080
100%
Arc 8-Core:
19.1  fps
high 1920x1080
100%
Arc 8-Core:
16.1  fps
ultra 1920x1080
100%
Arc 8-Core:
15.4  fps
low 1920x1080
100%
Arc 8-Core:
19.3  fps
med. 1920x1080
100%
Arc 8-Core:
16.5  fps
high 1920x1080
100%
Arc 8-Core:
16  fps
ultra 1920x1080
100%
Arc 8-Core:
14.7  fps
low 1920x1080 cinem.
100%
Arc 8-Core:
16.5  fps
med. 1920x1080 cinem.
100%
Arc 8-Core:
15.9  fps
high 1920x1080 cinem.
100%
Arc 8-Core:
13  fps
ultra 1920x1080 cinem.
100%
Arc 8-Core:
10.8  fps
low 1920x1080
100%
Arc 8-Core:
20  fps
med. 1920x1080
100%
Arc 8-Core:
16  fps
high 1920x1080
100%
Arc 8-Core:
12  fps
ultra 1920x1080
100%
Arc 8-Core:
7  fps
low 1920x1080
100%
Arc 8-Core:
35.6 44.4 ~ 40 fps
med. 1920x1080
100%
Arc 8-Core:
24.2 29.9 ~ 27 fps
high 1920x1080
100%
Arc 8-Core:
22.6 28.2 ~ 25 fps
ultra 1920x1080
100%
Arc 8-Core:
20.5 24.2 ~ 22 fps
low 1920x1080
100%
Arc 8-Core:
40.7 49.4 ~ 45 fps
med. 1920x1080
100%
Arc 8-Core:
26.6 33.8 ~ 30 fps
high 1920x1080
100%
Arc 8-Core:
20.3 27.2 ~ 24 fps
ultra 1920x1080
100%
Arc 8-Core:
19 23.9 ~ 21 fps
F1 24

F1 24

2024
low 1920x1080
100%
Arc 8-Core:
55 65.6 66.5 69.1 71.8 75.2 77.5 82 84.3 ~ 72 fps
157%
RTX 500 Ada Generation Laptop:
112.9  fps
med. 1920x1080
100%
Arc 8-Core:
49.2 56 56.3 57.1 63 64.7 66.2 69.3 73.8 74 ~ 63 fps
128%
RTX 500 Ada Generation Laptop:
80.8  fps
high 1920x1080
100%
Arc 8-Core:
38.9 42.7 43 48.4 48.4 48.7 51.8 53 54.8 ~ 48 fps
55%
RTX 500 Ada Generation Laptop:
26.5  fps
ultra 1920x1080
100%
Arc 8-Core:
0 (!) 12 12.2 14 ~ 10 fps
160%
RTX 500 Ada Generation Laptop:
16  fps
QHD 2560x1440
RTX 500 Ada Generation Laptop:
22  fps
low 1920x1080
100%
Arc 8-Core:
17.8  fps
med. 1920x1080
100%
Arc 8-Core:
14.9  fps
high 1920x1080
100%
Arc 8-Core:
12.1  fps
low 1920x1080
100%
Arc 8-Core:
33.6  fps
168%
RTX 500 Ada Generation Laptop:
56.4  fps
med. 1920x1080
100%
Arc 8-Core:
28  fps
168%
RTX 500 Ada Generation Laptop:
47.1  fps
high 1920x1080
100%
Arc 8-Core:
25.2  fps
160%
RTX 500 Ada Generation Laptop:
40.2  fps
ultra 1920x1080
100%
Arc 8-Core:
19  fps
163%
RTX 500 Ada Generation Laptop:
30.9  fps
QHD 2560x1440
RTX 500 Ada Generation Laptop:
22  fps
low 1920x1080
100%
Arc 8-Core:
0 (!) 30.6 52 ~ 28 fps
med. 1920x1080
100%
Arc 8-Core:
27.1 34 ~ 31 fps
high 1920x1080
100%
Arc 8-Core:
18.5 29 ~ 24 fps
ultra 1920x1080
100%
Arc 8-Core:
16.2 25 ~ 21 fps
low 1920x1080
100%
Arc 8-Core:
69  fps
med. 1920x1080
100%
Arc 8-Core:
56  fps
high 1920x1080
100%
Arc 8-Core:
49  fps
ultra 1920x1080
100%
Arc 8-Core:
29  fps
low 1920x1080
100%
Arc 8-Core:
18  fps
high 1920x1080
100%
Arc 8-Core:
14.5  fps
low 1920x1080
100%
Arc 8-Core:
45.8 73.9 ~ 60 fps
med. 1920x1080
100%
Arc 8-Core:
39.1 52.4 ~ 46 fps
high 1920x1080
100%
Arc 8-Core:
33.9 46.4 ~ 40 fps
ultra 1920x1080
100%
Arc 8-Core:
27.6 40.3 ~ 34 fps
low 1920x1080
100%
Arc 8-Core:
36  fps
med. 1920x1080
100%
Arc 8-Core:
32  fps
high 1920x1080
100%
Arc 8-Core:
27  fps
ultra 1920x1080
100%
Arc 8-Core:
21  fps
low 1920x1080
100%
Arc 8-Core:
39.2  fps
med. 1920x1080
100%
Arc 8-Core:
30  fps
high 1920x1080
100%
Arc 8-Core:
27.5  fps
ultra 1920x1080
100%
Arc 8-Core:
27.2  fps
low 1920x1080
100%
Arc 8-Core:
27  fps
med. 1920x1080
100%
Arc 8-Core:
22  fps
high 1920x1080
100%
Arc 8-Core:
16.8  fps
ultra 1920x1080
Arc 8-Core:
0 (!)  fps
Palworld

Palworld

2024
low 1920x1080
100%
Arc 8-Core:
40.6  fps
med. 1920x1080
100%
Arc 8-Core:
37.1  fps
high 1920x1080
100%
Arc 8-Core:
29.5  fps
ultra 1920x1080
100%
Arc 8-Core:
27.3  fps
med. 1920x1080
100%
Arc 8-Core:
152.6 183.9 208 ~ 182 fps
high 1920x1080
100%
Arc 8-Core:
111.5 128.6 142.8 ~ 128 fps
ultra 1920x1080
100%
Arc 8-Core:
108.6 120.9 134.2 ~ 121 fps
low 1920x1080
100%
Arc 8-Core:
60.4  fps
med. 1920x1080
100%
Arc 8-Core:
46.9  fps
high 1920x1080
100%
Arc 8-Core:
45.8  fps
ultra 1920x1080
100%
Arc 8-Core:
32.5  fps
low 1920x1080
100%
Arc 8-Core:
99.5  fps
med. 1920x1080
100%
Arc 8-Core:
68.9  fps
high 1920x1080
100%
Arc 8-Core:
60.5  fps
ultra 1920x1080
100%
Arc 8-Core:
46.4  fps
low 1920x1080
100%
Arc 8-Core:
18  fps
233%
RTX 500 Ada Generation Laptop:
42  fps
med. 1920x1080
100%
Arc 8-Core:
16  fps
238%
RTX 500 Ada Generation Laptop:
38  fps
high 1920x1080
100%
Arc 8-Core:
14  fps
229%
RTX 500 Ada Generation Laptop:
32  fps
ultra 1920x1080
100%
Arc 8-Core:
11  fps
182%
RTX 500 Ada Generation Laptop:
20  fps
low 1920x1080
RTX 500 Ada Generation Laptop:
88  fps
med. 1920x1080
RTX 500 Ada Generation Laptop:
78  fps
high 1920x1080
RTX 500 Ada Generation Laptop:
58  fps
ultra 1920x1080
RTX 500 Ada Generation Laptop:
49  fps
QHD 2560x1440
RTX 500 Ada Generation Laptop:
33  fps
low 1920x1080
100%
Arc 8-Core:
35.8  fps
med. 1920x1080
100%
Arc 8-Core:
26.6  fps
high 1920x1080
100%
Arc 8-Core:
24.7  fps
ultra 1920x1080
100%
Arc 8-Core:
22.4  fps
low 1920x1080
100%
Arc 8-Core:
20.2  fps
med. 1920x1080
100%
Arc 8-Core:
18  fps
high 1920x1080
100%
Arc 8-Core:
16.3  fps
ultra 1920x1080
100%
Arc 8-Core:
14.2  fps
low 1920x1080
100%
Arc 8-Core:
82.7 93.1 101.4 116 ~ 98 fps
203%
RTX 500 Ada Generation Laptop:
199  fps
med. 1920x1080
100%
Arc 8-Core:
62.5 70.6 74.8 77.6 ~ 71 fps
182%
RTX 500 Ada Generation Laptop:
129  fps
high 1920x1080
100%
Arc 8-Core:
45.6 53.6 53.6 58.9 ~ 53 fps
138%
RTX 500 Ada Generation Laptop:
73  fps
ultra 1920x1080
100%
Arc 8-Core:
35.5 40.6 47 52 ~ 44 fps
127%
RTX 500 Ada Generation Laptop:
56  fps
QHD 2560x1440
RTX 500 Ada Generation Laptop:
39  fps
low 1920x1080
100%
Arc 8-Core:
34  fps
229%
RTX 500 Ada Generation Laptop:
78  fps
med. 1920x1080
100%
Arc 8-Core:
33  fps
209%
RTX 500 Ada Generation Laptop:
69  fps
high 1920x1080
100%
Arc 8-Core:
30  fps
183%
RTX 500 Ada Generation Laptop:
55  fps
ultra 1920x1080
100%
Arc 8-Core:
25  fps
160%
RTX 500 Ada Generation Laptop:
40  fps
QHD 2560x1440
RTX 500 Ada Generation Laptop:
32  fps
low 1920x1080
100%
Arc 8-Core:
111.1  fps
med. 1920x1080
100%
Arc 8-Core:
84.5  fps
high 1920x1080
100%
Arc 8-Core:
52.1  fps
ultra 1920x1080
100%
Arc 8-Core:
31.8  fps
low 1920x1080
100%
Arc 8-Core:
11.3 16.7 18.5 21.7 23.3 23.3 23.6 25.8 27.6 27.8 28.1 28.3 29.4 29.4 29.5 29.8 30.9 31 31.5 31.5 31.7 32 32.4 32.9 33.9 34.1 34.3 34.3 34.7 34.7 35.7 36.4 36.4 36.5 37.9 38 ~ 30 fps
210%
RTX 500 Ada Generation Laptop:
52.9 72.8 ~ 63 fps
med. 1920x1080
100%
Arc 8-Core:
9.4 15.2 16.3 19 21.5 22.8 23.1 23.4 23.8 24.2 24.8 25.1 25.1 25.3 25.4 25.7 26.3 26.3 26.3 26.5 26.7 26.8 27.8 27.9 28 28.4 28.9 29.5 29.5 29.6 30.2 31 31.4 31.4 ~ 25 fps
188%
RTX 500 Ada Generation Laptop:
37.7 55.5 ~ 47 fps
high 1920x1080
100%
Arc 8-Core:
7.3 14.3 14.8 15.1 16.3 16.9 17.8 19 20.4 20.8 21.5 21.9 21.9 22.1 22.5 22.8 22.8 22.8 22.9 22.9 23.4 23.4 23.9 24 24 24 24.1 24.6 25 25.2 26 26.2 26.7 27.6 ~ 22 fps
164%
RTX 500 Ada Generation Laptop:
25.4 45.6 ~ 36 fps
ultra 1920x1080
100%
Arc 8-Core:
13 13.5 14.2 17 18.4 18.9 19.3 19.5 19.7 19.8 20.5 20.6 20.7 20.7 21.1 21.2 21.4 21.6 21.9 22 22 22.1 23.3 23.7 23.8 24.7 ~ 20 fps
160%
RTX 500 Ada Generation Laptop:
25 39.6 ~ 32 fps
QHD 2560x1440
100%
Arc 8-Core:
9.2 13.1 ~ 11 fps
180%
RTX 500 Ada Generation Laptop:
19.8  fps
low 1920x1080
100%
Arc 8-Core:
21 22.1 22.8 23 24.5 27.4 27.8 29.1 29.3 30.8 30.9 31.7 31.9 32.4 32.9 33.7 33.8 33.8 34.6 36.9 36.9 37.9 39.3 39.6 40.3 ~ 31 fps
242%
RTX 500 Ada Generation Laptop:
69.4 79.6 ~ 75 fps
med. 1920x1080
100%
Arc 8-Core:
16.3 17.6 19.5 20.6 21 22.8 22.8 22.9 23.5 24.2 24.3 24.8 25 25.6 25.9 26.4 27.4 28.2 28.8 29.6 29.7 29.7 30.2 30.3 30.7 31.1 ~ 25 fps
232%
RTX 500 Ada Generation Laptop:
53.6 61.9 ~ 58 fps
high 1920x1080
100%
Arc 8-Core:
15.4 15.8 16.5 16.8 20 20.6 20.7 21.1 21.2 21.2 21.4 21.6 21.7 22.6 22.9 23.7 24.1 25 25.2 25.3 25.4 26.7 26.8 27.5 27.7 ~ 22 fps
214%
RTX 500 Ada Generation Laptop:
39 54.9 ~ 47 fps
ultra 1920x1080
100%
Arc 8-Core:
14.2 14.7 16.3 19 19.1 19.3 19.9 20.3 20.4 20.7 21 21.1 22 22.1 22.2 23.4 23.6 24.1 24.4 24.4 24.4 25.2 25.7 26.2 ~ 21 fps
219%
RTX 500 Ada Generation Laptop:
38.9 53.1 ~ 46 fps
QHD 2560x1440
100%
Arc 8-Core:
10.4 14 17.7 ~ 14 fps
191%
RTX 500 Ada Generation Laptop:
26.8  fps
4K 3840x2160
100%
Arc 8-Core:
5.4  fps
Lies of P

Lies of P

2023
low 1920x1080
100%
Arc 8-Core:
56.9  fps
med. 1920x1080
100%
Arc 8-Core:
48.1  fps
high 1920x1080
100%
Arc 8-Core:
41.7  fps
ultra 1920x1080
100%
Arc 8-Core:
33.2  fps
low 1920x1080
100%
Arc 8-Core:
32  fps
med. 1920x1080
100%
Arc 8-Core:
30  fps
high 1920x1080
100%
Arc 8-Core:
25  fps
ultra 1920x1080
100%
Arc 8-Core:
21  fps
Starfield

Starfield

2023
med. 1920x1080
100%
Arc 8-Core:
11.5  fps
low 1920x1080
100%
Arc 8-Core:
50  fps
med. 1920x1080
100%
Arc 8-Core:
40.1  fps
high 1920x1080
100%
Arc 8-Core:
36.2  fps
ultra 1920x1080
100%
Arc 8-Core:
32.2  fps
low 1920x1080
100%
Arc 8-Core:
45.9  fps
med. 1920x1080
100%
Arc 8-Core:
45.7  fps
high 1920x1080
100%
Arc 8-Core:
39.5  fps
ultra 1920x1080
100%
Arc 8-Core:
29.2  fps
med. 1920x1080
100%
Arc 8-Core:
28.4  fps
high 1920x1080
100%
Arc 8-Core:
29  fps
ultra 1920x1080
100%
Arc 8-Core:
25.9  fps
QHD 2560x1440
100%
Arc 8-Core:
21.1  fps
F1 23

F1 23

2023
low 1920x1080
100%
Arc 8-Core:
15.2 17.3 37.4 44.1 48.6 48.6 57.3 57.3 64.4 64.6 67.9 68.2 68.2 69.8 70.9 71.5 71.5 71.9 72.3 73.1 73.4 77 80.1 82.1 83.2 89.3 ~ 63 fps
217%
RTX 500 Ada Generation Laptop:
136.5  fps
med. 1920x1080
100%
Arc 8-Core:
15 25.1 35.4 36.3 52.5 52.5 59 59.4 59.5 60.5 61.2 62.1 62.9 63.1 65.1 65.6 65.8 66.8 66.9 70.2 74.2 75.3 76.3 79.8 ~ 59 fps
203%
RTX 500 Ada Generation Laptop:
119.8  fps
high 1920x1080
100%
Arc 8-Core:
10.6 25.6 26.6 27.1 35.5 35.5 35.9 37.6 38.7 39.5 40.7 41.1 41.2 43.1 44.8 44.9 46.1 47.1 47.5 50.4 50.7 50.9 54.5 ~ 40 fps
210%
RTX 500 Ada Generation Laptop:
84.1  fps
ultra 1920x1080
100%
Arc 8-Core:
7.5 10 10.7 11.4 11.5 11.8 12.1 12.2 12.6 12.7 13.5 14 14.3 14.7 15 ~ 12 fps
208%
RTX 500 Ada Generation Laptop:
25  fps
QHD 2560x1440
RTX 500 Ada Generation Laptop:
16  fps
low 1920x1080
100%
Arc 8-Core:
39.6  fps
med. 1920x1080
100%
Arc 8-Core:
30.5  fps
high 1920x1080
100%
Arc 8-Core:
26.7  fps
ultra 1920x1080
100%
Arc 8-Core:
18.4  fps
low 1920x1080
100%
Arc 8-Core:
62.2  fps
med. 1920x1080
100%
Arc 8-Core:
50.1  fps
high 1920x1080
100%
Arc 8-Core:
39  fps
ultra 1920x1080
100%
Arc 8-Core:
38.6  fps
low 1920x1080
100%
Arc 8-Core:
29.8  fps
med. 1920x1080
100%
Arc 8-Core:
21  fps
high 1920x1080
100%
Arc 8-Core:
19.4  fps
ultra 1920x1080
100%
Arc 8-Core:
18.7  fps
low 1920x1080
100%
Arc 8-Core:
45.7 61 ~ 53 fps
med. 1920x1080
100%
Arc 8-Core:
35.4 44.1 ~ 40 fps
high 1920x1080
100%
Arc 8-Core:
24.6 30.9 ~ 28 fps
ultra 1920x1080
100%
Arc 8-Core:
18.7 22.2 ~ 20 fps
Returnal

Returnal

2023
low 1920x1080
100%
Arc 8-Core:
37  fps
med. 1920x1080
100%
Arc 8-Core:
36  fps
high 1920x1080
100%
Arc 8-Core:
32  fps
ultra 1920x1080
100%
Arc 8-Core:
28  fps
med. 1920x1080
100%
Arc 8-Core:
25.7  fps
high 1920x1080
100%
Arc 8-Core:
19.3  fps
ultra 1920x1080
100%
Arc 8-Core:
15.6  fps
F1 22

F1 22

2022
low 1920x1080
100%
Arc 8-Core:
56.2 57.8 59.1 64.5 68.8 71 72.1 72.4 72.7 73.1 73.9 76.3 77.2 77.7 78.2 78.3 80.6 84.9 96.1 ~ 73 fps
206%
RTX 500 Ada Generation Laptop:
150.4  fps
med. 1920x1080
100%
Arc 8-Core:
49.6 53.5 53.9 57.5 58.2 62.2 65.1 65.6 66.6 67 68.6 70.8 70.9 71.4 71.6 71.7 73.8 77 87 ~ 66 fps
204%
RTX 500 Ada Generation Laptop:
134.4  fps
high 1920x1080
100%
Arc 8-Core:
36.8 40.9 43.5 44 46.7 51.1 52.9 53.3 53.7 55 55.1 55.7 55.9 56.2 65.2 ~ 51 fps
195%
RTX 500 Ada Generation Laptop:
99.6  fps
ultra 1920x1080
100%
Arc 8-Core:
5.1 9.3 11.9 12.1 14 14.1 14.4 14.7 14.9 15 15.3 16.1 16.9 ~ 13 fps
253%
RTX 500 Ada Generation Laptop:
32.9  fps
low 1920x1080
100%
Arc 8-Core:
41.5 44.9 47.3 47.4 49 49.2 50.4 50.7 50.8 51.2 53.3 53.8 54.6 ~ 50 fps
med. 1920x1080
100%
Arc 8-Core:
31.7 35.3 36.3 37.3 39.5 40 40.6 41.2 42.6 42.7 43.4 44.5 45 ~ 40 fps
high 1920x1080
100%
Arc 8-Core:
22 24.7 25.7 26.4 27 27.6 29.1 29.9 30 30.1 30.7 31.5 31.6 ~ 28 fps
ultra 1920x1080
100%
Arc 8-Core:
17.7 20.2 20.2 21.2 21.9 22.3 24.1 24.2 24.3 24.4 25 25.1 25.9 ~ 23 fps
QHD 2560x1440
100%
Arc 8-Core:
16.6  fps
low 1920x1080
100%
Arc 8-Core:
67.7 73 ~ 70 fps
med. 1920x1080
100%
Arc 8-Core:
51.8 56.8 ~ 54 fps
high 1920x1080
100%
Arc 8-Core:
41.7 44.8 ~ 43 fps
ultra 1920x1080
100%
Arc 8-Core:
36.6 39.2 ~ 38 fps
med. 1920x1080
100%
Arc 8-Core:
31.1  fps
high 1920x1080
100%
Arc 8-Core:
29.9  fps
low 1920x1080
100%
Arc 8-Core:
27 33.7 ~ 30 fps
med. 1920x1080
100%
Arc 8-Core:
24 31.2 ~ 28 fps
high 1920x1080
100%
Arc 8-Core:
18.3 24 ~ 21 fps
ultra 1920x1080
100%
Arc 8-Core:
12.9 17.3 ~ 15 fps
Far Cry 6

Far Cry 6

2021
low 1280x720
100%
Arc 8-Core:
61.9  fps
204%
RTX 500 Ada Generation Laptop:
126  fps
med. 1920x1080
100%
Arc 8-Core:
37.7  fps
212%
RTX 500 Ada Generation Laptop:
80  fps
high 1920x1080
100%
Arc 8-Core:
32.1  fps
212%
RTX 500 Ada Generation Laptop:
68  fps
ultra 1920x1080
100%
Arc 8-Core:
27.2  fps
F1 2021

F1 2021

2021
low 1280x720
100%
Arc 8-Core:
94.8 143.5 143.6 145.9 147.5 161.1 ~ 139 fps
med. 1920x1080
100%
Arc 8-Core:
50.8 73.9 75.9 80.4 80.6 83.5 ~ 74 fps
high 1920x1080
100%
Arc 8-Core:
41.3 56.4 60 63.2 63.8 65.3 ~ 58 fps
ultra 1920x1080
100%
Arc 8-Core:
20.3 26.2 26.9 28.8 29.6 31 ~ 27 fps
low 1280x720
100%
Arc 8-Core:
0 (!) 58 ~ 29 fps
med. 1920x1080
100%
Arc 8-Core:
33 35 ~ 34 fps
high 1920x1080
100%
Arc 8-Core:
28 (!) 30 ~ 29 fps
ultra 1920x1080
100%
Arc 8-Core:
26 27 ~ 27 fps
F1 2020

F1 2020

2020
low 1280x720
100%
Arc 8-Core:
139.1  fps
med. 1920x1080
100%
Arc 8-Core:
76.9  fps
high 1920x1080
100%
Arc 8-Core:
60.5  fps
ultra 1920x1080
100%
Arc 8-Core:
41.2  fps
low 1280x720
100%
Arc 8-Core:
68.5 93 ~ 81 fps
med. 1920x1080
100%
Arc 8-Core:
38.5 41.9 ~ 40 fps
high 1920x1080
100%
Arc 8-Core:
27.7 28.7 ~ 28 fps
ultra 1920x1080
100%
Arc 8-Core:
21.9 22.6 ~ 22 fps
low 1280x720
100%
Arc 8-Core:
130  fps
med. 1920x1080
100%
Arc 8-Core:
59  fps
high 1920x1080
100%
Arc 8-Core:
46  fps
ultra 1920x1080
100%
Arc 8-Core:
33  fps
low 1280x720
100%
Arc 8-Core:
65 69 ~ 67 fps
med. 1920x1080
100%
Arc 8-Core:
39 41 ~ 40 fps
high 1920x1080
100%
Arc 8-Core:
37 39 ~ 38 fps
ultra 1920x1080
100%
Arc 8-Core:
35 36 ~ 36 fps
low 1280x720
100%
Arc 8-Core:
52.2 63.1 ~ 58 fps
med. 1920x1080
100%
Arc 8-Core:
33.9 37.6 ~ 36 fps
high 1920x1080
100%
Arc 8-Core:
25 27.1 ~ 26 fps
ultra 1920x1080
100%
Arc 8-Core:
19.7 21.7 ~ 21 fps
low 1280x720
100%
Arc 8-Core:
69 79.3 131.4 ~ 93 fps
med. 1920x1080
100%
Arc 8-Core:
33 38.3 62.5 ~ 45 fps
high 1920x1080
100%
Arc 8-Core:
31 35.8 49.5 ~ 39 fps
ultra 1920x1080
100%
Arc 8-Core:
27 30.5 48.2 ~ 35 fps
Strange Brigade

Strange Brigade

2018
low 1280x720
100%
Arc 8-Core:
120 121 121 124.9 129.8 131.2 131.8 141 141.6 141.9 143.6 144 145.6 146.1 147.3 151.6 154.8 156 159.4 162.1 163 165.4 165.9 166 168 171 173.8 176 177.4 178 179.5 188 188.9 189 190.2 204 205 207 208 ~ 161 fps
202%
RTX 500 Ada Generation Laptop:
316 333 ~ 325 fps
med. 1920x1080
100%
Arc 8-Core:
51.1 52.7 53 54 56 57 59 59.5 60.6 61.3 61.9 63.2 66 67.6 67.7 67.8 68 70 70.5 70.6 71 71 71.1 71.8 72 72.5 73 73.4 75.4 76 77.4 78 80.3 82 84 85.2 86 87.7 88 ~ 70 fps
183%
RTX 500 Ada Generation Laptop:
126 129.6 ~ 128 fps
high 1920x1080
100%
Arc 8-Core:
39 40 41 41.4 43.8 45.7 48 49.9 50.4 52 52.4 52.5 53.3 54 54.9 55.4 56.4 57.2 57.8 57.8 58.9 59 59 59 59 59.1 59.6 59.7 61.4 61.7 62 64 64 66.7 69 69.3 71 72.3 74 ~ 57 fps
184%
RTX 500 Ada Generation Laptop:
104 106.7 ~ 105 fps
ultra 1920x1080
100%
Arc 8-Core:
27.1 31 32 33.4 33.9 35 35.6 37.4 38.8 38.9 40.7 41 41 41 43.2 43.7 43.8 44 44.3 45.4 46 46.1 46.7 46.8 47 47 47.3 48.5 48.9 49 50 50.3 52 52.5 53 53.2 55 56 58 58.9 ~ 45 fps
204%
RTX 500 Ada Generation Laptop:
91 93.2 ~ 92 fps
QHD 2560x1440
100%
Arc 8-Core:
25 25.7 34.9 42 ~ 32 fps
197%
RTX 500 Ada Generation Laptop:
63  fps
4K 3840x2160
100%
Arc 8-Core:
14.2 15 ~ 15 fps
Far Cry 5

Far Cry 5

2018
low 1280x720
100%
Arc 8-Core:
47 51 54 54 56 57 59 61 62 63 63 63 63 64 65 67 67 68 68 69 69 69 72 76 77 79 84 91 91 ~ 67 fps
201%
RTX 500 Ada Generation Laptop:
135  fps
med. 1920x1080
100%
Arc 8-Core:
30 31 33 33 35 36 36 36 37 37 37 38 38 39 39 39 39 40 40 40 42 43 44 45 45 46 47 48 52 54 54 ~ 40 fps
215%
RTX 500 Ada Generation Laptop:
86  fps
high 1920x1080
100%
Arc 8-Core:
22 28 29 30 31 32 33 33 34 34 34 35 35 35 35 35 36 36 37 37 37 37 38 40 41 41 42 43 43 45 48 49 50 ~ 37 fps
211%
RTX 500 Ada Generation Laptop:
78  fps
ultra 1920x1080
100%
Arc 8-Core:
25 26 27 28 28 31 31 32 32 32 32 32 32 33 33 34 34 34 34 35 35 35 36 38 38 38 39 40 40 41 45 46 46 ~ 35 fps
211%
RTX 500 Ada Generation Laptop:
74  fps
QHD 2560x1440
100%
Arc 8-Core:
28 32 33 ~ 31 fps
161%
RTX 500 Ada Generation Laptop:
50  fps
low 1280x720
100%
Arc 8-Core:
46.1 46.2 47.1 47.4 47.5 47.6 49 49.3 49.9 50.3 50.5 50.8 50.9 51.3 51.4 51.6 51.9 52 52.2 52.4 52.5 52.6 52.7 52.7 53 53.4 53.9 54 54.4 54.5 54.9 55 55.4 55.4 56 56.1 56.9 58 58.7 61.5 63.1 64.9 65.5 66.4 66.6 ~ 54 fps
209%
RTX 500 Ada Generation Laptop:
98 128.3 ~ 113 fps
med. 1920x1080
100%
Arc 8-Core:
31.1 31.2 35.8 36 36 37.5 37.7 38.3 38.7 38.8 38.9 39.2 39.4 39.7 39.8 39.9 39.9 40.1 40.4 40.4 40.6 40.7 40.8 40.8 41 41.1 41.1 41.3 41.6 41.8 42 42.5 44 45.1 45.1 46 46.4 46.6 46.7 46.9 47.4 47.6 49.7 49.8 51.9 52.1 ~ 42 fps
217%
RTX 500 Ada Generation Laptop:
79.4 103.5 ~ 91 fps
high 1920x1080
100%
Arc 8-Core:
27.9 29.9 30.2 30.2 30.8 30.8 31.2 31.3 31.4 31.6 31.7 32 32.1 32.1 32.4 32.7 33.4 33.5 33.5 33.7 33.8 34.1 34.4 34.5 34.6 35 35.2 35.7 35.8 36.1 36.8 36.9 37.6 37.8 37.8 38.2 38.2 38.9 39.5 40.1 40.5 40.5 42.2 42.3 43.9 ~ 35 fps
211%
RTX 500 Ada Generation Laptop:
67 81.5 ~ 74 fps
4K 3840x2160
100%
Arc 8-Core:
19.3 34.4 ~ 27 fps
low 1280x720
100%
Arc 8-Core:
35.6 42.8 43.8 45.2 45.5 47.6 49.2 51.5 51.9 52.8 53.8 56.6 56.9 57.2 58.1 58.5 59.1 60.8 61 61.3 63 63.3 64 64.8 65 65.3 66.1 66.8 68.4 69.1 69.3 70 73.6 75.3 77 79.2 80.1 82.9 83.3 84.1 85.9 ~ 63 fps
222%
RTX 500 Ada Generation Laptop:
130.5 148.5 ~ 140 fps
med. 1920x1080
100%
Arc 8-Core:
28 28.2 28.7 29.4 29.7 29.7 30.3 31.6 32.1 32.1 33 33.4 33.5 34.6 34.8 35.8 35.9 36 36.1 36.2 36.3 36.5 36.5 36.8 37 37.3 37.4 37.6 37.9 38 38 38 38.8 40.2 40.3 40.3 41 41.3 43.4 45 45.2 45.3 45.9 ~ 36 fps
206%
RTX 500 Ada Generation Laptop:
71 77.8 ~ 74 fps
high 1920x1080
100%
Arc 8-Core:
14.7 17 18.2 18.4 19.2 19.2 19.4 20.7 20.9 21 21.2 21.8 23 23.2 23.9 24.1 24.1 24.1 24.4 24.4 24.4 24.6 24.9 25.4 26.1 26.1 26.4 26.4 26.5 26.5 26.6 26.8 27 27.2 27.5 28.6 28.9 29.2 30.5 30.6 30.6 30.8 31.6 31.7 ~ 25 fps
216%
RTX 500 Ada Generation Laptop:
50 57.1 ~ 54 fps
QHD 2560x1440
100%
Arc 8-Core:
12.6 13.4 14 15.9 19.8 20.5 23 ~ 17 fps
212%
RTX 500 Ada Generation Laptop:
36.1  fps
4K 3840x2160
100%
Arc 8-Core:
7.7 9 ~ 8 fps
low 1280x720
100%
Arc 8-Core:
78.3 89.9 91.5 92.1 92.8 93.2 95.1 98.4 98.4 98.6 98.9 98.9 98.9 99.3 99.4 100.3 100.9 100.9 101.1 101.2 101.2 101.5 101.5 101.7 101.8 102.1 102.4 102.5 102.7 103.2 103.2 103.5 103.8 104.1 104.6 104.7 105 105.7 106.2 106.5 106.5 106.8 107.4 110.5 ~ 101 fps
175%
RTX 500 Ada Generation Laptop:
176.2 178 ~ 177 fps
med. 1366x768
100%
Arc 8-Core:
36.2 54.2 55.8 58.2 62.8 65.4 69.4 71.4 75.6 75.9 76.9 78 79.2 80.6 81.9 82.3 83 83.2 83.4 83.5 84.1 84.3 89.4 89.7 89.8 90.4 90.8 90.9 92.6 92.8 92.9 93.1 93.3 93.5 94 94.1 94.1 94.9 95.3 95.5 96.5 96.9 97.4 99.9 ~ 83 fps
193%
RTX 500 Ada Generation Laptop:
156.1 163.3 ~ 160 fps
high 1920x1080
100%
Arc 8-Core:
35.9 39.8 42.3 47 54.8 57.7 61.5 61.9 62.6 63.2 64.1 64.1 65.2 66.8 67.2 67.2 67.4 69.3 69.3 70.3 72 72.3 74 74.5 74.9 74.9 75.7 76 76.5 76.7 76.8 77.3 77.8 77.9 78.4 79 79.1 80.6 83 83.3 84.6 85.2 85.2 87.8 ~ 70 fps
210%
RTX 500 Ada Generation Laptop:
145.6 148.1 ~ 147 fps
ultra 1920x1080
100%
Arc 8-Core:
35.2 41.8 43.7 45.5 53.3 56.8 59.6 60.3 60.4 60.6 60.8 62.1 63 63.6 63.6 63.9 65.2 66.5 66.6 66.6 67.1 68.3 68.7 71.1 71.1 72.3 73.2 73.4 73.6 73.6 74 74 74.4 74.4 74.6 75.4 75.6 76 78 79.8 80.2 80.5 80.6 80.9 ~ 67 fps
204%
RTX 500 Ada Generation Laptop:
136 137.4 ~ 137 fps
4K 3840x2160
100%
Arc 8-Core:
30.9 31.8 ~ 31 fps
low 1024x768
100%
Arc 8-Core:
92 120 126 126 128 131 131.2 131.3 132 132.9 133 135 135.1 135.6 140.2 141 141.5 142.7 152 152 156 157 157 158 160 ~ 138 fps
201%
RTX 500 Ada Generation Laptop:
278  fps
med. 1366x768
100%
Arc 8-Core:
59 68 73 76.8 78 78 79.1 80 80 81.2 85.1 88.1 88.2 88.4 89 89 91.5 92 93 97 97 99 100 ~ 85 fps
206%
RTX 500 Ada Generation Laptop:
175  fps
high 1920x1080
100%
Arc 8-Core:
36 40 40 40.4 42 42.4 44 44.5 44.8 46.8 47 48 48 49 50 51 51 51.7 54.1 54.3 54.3 56 57 57 58 ~ 48 fps
190%
RTX 500 Ada Generation Laptop:
91  fps
ultra 1920x1080
100%
Arc 8-Core:
14.5 18.4 19.2 20.1 20.4 20.5 20.8 20.8 20.9 21.8 22.6 23 23.1 23.3 23.8 23.9 24 24 24.5 24.5 24.6 25.1 25.2 25.5 25.5 25.6 25.9 26 26.1 28 43.1 ~ 24 fps
213%
RTX 500 Ada Generation Laptop:
51  fps
QHD 2560x1440
RTX 500 Ada Generation Laptop:
36  fps
GTA V

GTA V

2015
low 1024x768
100%
Arc 8-Core:
50.6 99.1 101.3 102.4 110.5 112.2 124.1 126.5 133.8 134.9 136.9 139.1 141 144 144.9 145.4 147.3 152.9 153.3 157.8 158.1 158.7 158.8 160.3 160.3 161 162.9 162.9 163.3 163.6 165.2 166.5 166.9 169.3 171.5 174.1 175 ~ 145 fps
126%
RTX 500 Ada Generation Laptop:
182.7 183.8 ~ 183 fps
med. 1366x768
100%
Arc 8-Core:
51.1 59.9 85.7 90.4 93.8 106.9 107.7 111 114 120.8 121.7 124.1 129.8 131.5 131.8 133.9 134.8 135.8 139.5 139.5 140.1 145.9 147.9 148 148.1 148.2 151.8 151.9 152.8 154.1 154.9 156.7 158.8 160.2 160.9 164.4 168.4 169.3 ~ 133 fps
134%
RTX 500 Ada Generation Laptop:
177.4 178.9 ~ 178 fps
high 1920x1080
100%
Arc 8-Core:
19.1 22.6 23.9 24.2 24.3 26.2 31.3 32.2 32.3 32.8 33.1 33.4 33.5 33.6 33.9 34.5 34.8 35.2 35.4 35.9 36.2 36.3 36.9 37.5 37.6 39.6 39.9 40.3 40.6 41.2 41.2 41.3 43.2 43.5 43.5 44.7 48.6 48.9 51.2 ~ 36 fps
386%
RTX 500 Ada Generation Laptop:
138.2 139.1 ~ 139 fps
ultra 1920x1080
100%
Arc 8-Core:
9.6 10 10.3 11 11.4 12 12.1 12.3 12.7 13.1 13.3 13.7 13.8 13.9 14 14.1 14.2 14.3 14.3 14.6 14.6 14.7 14.7 15.8 15.9 15.9 16 16.2 16.5 16.6 17.1 17.5 17.8 18.3 19.2 20.2 20.6 ~ 15 fps
447%
RTX 500 Ada Generation Laptop:
64.6 69.7 ~ 67 fps
QHD 2560x1440
100%
Arc 8-Core:
9.2 12.2 ~ 11 fps
410%
RTX 500 Ada Generation Laptop:
45.1  fps
4K 3840x2160
100%
Arc 8-Core:
9.1  fps

Average Gaming Intel Arc 8-Core iGPU → 100%

Average Gaming 30-70 fps → 100%

Average Gaming NVIDIA RTX 500 Ada Generation Laptop → 202%

Average Gaming 30-70 fps → 213%

Intel Arc 8-Core iGPUNVIDIA RTX 500 Ada Generation Laptop
lowmed.highultraQHD4Klowmed.highultraQHD4K
F1 2513096.9747.44
F1 2472634810112.980.826.51622
Ghost of Tsushima33.62825.21956.447.140.230.922
Avatar Frontiers of Pandora1816141142383220
Call of Duty Modern Warfare 3 20238878584933
Total War Pharaoh98715344199129735639
Assassin's Creed Mirage343330257869554032
Cyberpunk 207730252220116347363219.8
Baldur's Gate 331252221145.427558474626.8
F1 2363594012136.5119.884.12516
F1 2273665113150.4134.499.632.9
Far Cry 661.937.732.127.21268068
Strange Brigade16170574532153251281059263
Far Cry 5674037353113586787450
X-Plane 11.11544235271139174
Final Fantasy XV Benchmark633625178140745436.1
Dota 2 Reborn10183706731177160147137
The Witcher 3138854824278175915136
GTA V1451333615119.141831781396745.1
Intel Arc 8-Core iGPUNVIDIA RTX 500 Ada Generation Laptop
lowmed.highultraQHD4Klowmed.highultraQHD4K
< 30 fps
< 60 fps
< 120 fps
≥ 120 fps
1
5
8
3
4
6
6
1
5
11
1
11
3
1
4
2

5
1

< 30 fps
< 60 fps
< 120 fps
≥ 120 fps

2
6
11

4
9
6
1
7
9
2
4
8
3
1
5
7
1


For more games that might be playable and a list of all games and graphics cards visit our Gaming List

Add one or more devices and compare

In the following list you can select (and also search for) devices that should be added to the comparison. You can select more than one device.

restrict list:
v1.35
log 19. 16:21:39

#0 ran 0s before starting gpusingle class +0s ... 0s

#1 checking url part for id 12086 +0s ... 0s

#2 checking url part for id 12426 +0s ... 0s

#3 redirected to Ajax server, took 1766157699s time from redirect:0 +0s ... 0s

#4 did not recreate cache, as it is less than 5 days old! Created at Fri, 19 Dec 2025 14:52:56 +0100 +0s ... 0s

#5 composed specs +0.024s ... 0.024s

#6 did output specs +0s ... 0.024s

#7 start showIntegratedCPUs +0s ... 0.024s

#8 getting avg benchmarks for device 12086 +0.023s ... 0.047s

#9 got single benchmarks 12086 +0.051s ... 0.098s

#10 getting avg benchmarks for device 12426 +0s ... 0.099s

#11 got single benchmarks 12426 +0.006s ... 0.105s

#12 got avg benchmarks for devices +0s ... 0.105s

#13 min, max, avg, median took s +0.072s ... 0.177s

#14 before gaming benchmark output +0s ... 0.177s

#15 Got 1945 rows for game benchmarks. +0.111s ... 0.288s

#16 composed SQL query for gamebenchmarks +0s ... 0.288s

#17 got data and put it in $dataArray +0.01s ... 0.298s

#18 benchmarks composed for output. +0.032s ... 0.33s

#19 calculated avg scores. +0s ... 0.33s

#20 return log +0.003s ... 0.332s

Please share our article, every link counts!
Mail Logo
Google Logo Add as a preferred
source on Google
> Expert Reviews and News on Laptops, Smartphones and Tech Innovations > Benchmarks / Tech > Graphics Card Comparison - Head 2 Head
Redaktion, 2017-09- 8 (Update: 2023-07- 1)