Notebookcheck Logo

NVIDIA GeForce RTX 3050 6GB Laptop GPU vs Intel Graphics 4-Core iGPU (Arc) vs Intel Arc 7-Core iGPU

NVIDIA GeForce RTX 3050 6GB Laptop GPU

► remove from comparison NVIDIA GeForce RTX 3050 6GB Laptop GPU

The Nvidia GeForce RTX 3050 6GB Laptop GPU (mobile, GN20-P0-R, 2023 Refresh) is the refresh of the RTX 3050 4GB Laptop GPU (slowest RTX 3000 mobile card) and also based on the GA107 Ampere chip. The 6GB variant offers more CUDA cores (2,560, +25%) but a cut down memory bus to 96 Bit. The clock speed depends on the TGP variant and can range from 713 - 1530 (base) and 1058 - 1740 (boost) for the TGP variants of 35 to 80 Watt (see table below).

The performance is between the old 4GB RTX 3050 and the RTX 3050 Ti and therefore best suited for full HD gaming (1920 x 1080) in medium to high graphic settings. The performance is not sufficient to enable Raytracing in most games, but the Tensor cores can be used for DLSS in some games (and get performance boost with slight quality reduction). Beware, that the low TGP variants will offer a significantly lower performance.

The GA107 chip offers 3,072 FP32 ALUs of which half can also execute INT32 instructions (i.e. 1,536 INT32 ALUs). The RTX 3050 however maybe won't use all ALUs on the chip. With Turing all shaders could still execute FP32 or INT32 instructions. The raytracing and tensor cores on the chip were also improved according to Nvidia. The Ampere chips also include an improved 5th generation video encoder (NVENC for H.264 and H.265) and a 7th generation decoder (for various formats now including AV1).

The GA107 chip is manufactured by Samsung in 8nm (8N), which is not quite able to keep up with the 7nm node at TSMC (e.g. used by AMD and also for the professional GA100 Ampere chip).

Intel Graphics 4-Core iGPU (Arc)

► remove from comparison Intel Graphics 4-Core

The Intel Graphics iGPU with 4 cores is an integrated graphics card based on the Xe LPG architecture (similar to the dedicated Arc GPUs, but with a focus on efficiency). It offers 4 Xe cores (64 Xe vector engines), 4 ray tracing units, 4 samplers and 2 pixel backends.

In contrast to the more powerful variant with 8 cores in the H Meteor Lake CPUs, the small variant is not allowed to use the Arc name.

The iGPU supports DirectX 12 Ultimate (probably DX 12_2 like the desktop Arc GPUs). The graphics unit also supports XeSS AI Super Sampling.

The media engine of Meteor Lake is in the SOC tile and supports up to 8k60 10-bit HDR encode and decode of MPEG2, AVC, VP9, HEVC and AV1. The display engine is also in the SoC tile and supports HDMI 2.1 and DisplayPort 2.1 20G with up to 8K60 HDR.

The GPU Tile of the Meteor Lake chip is manufactured at TSMC in 5nm (5N process).

Intel Arc 7-Core iGPU

► remove from comparison Intel Arc 7-Core

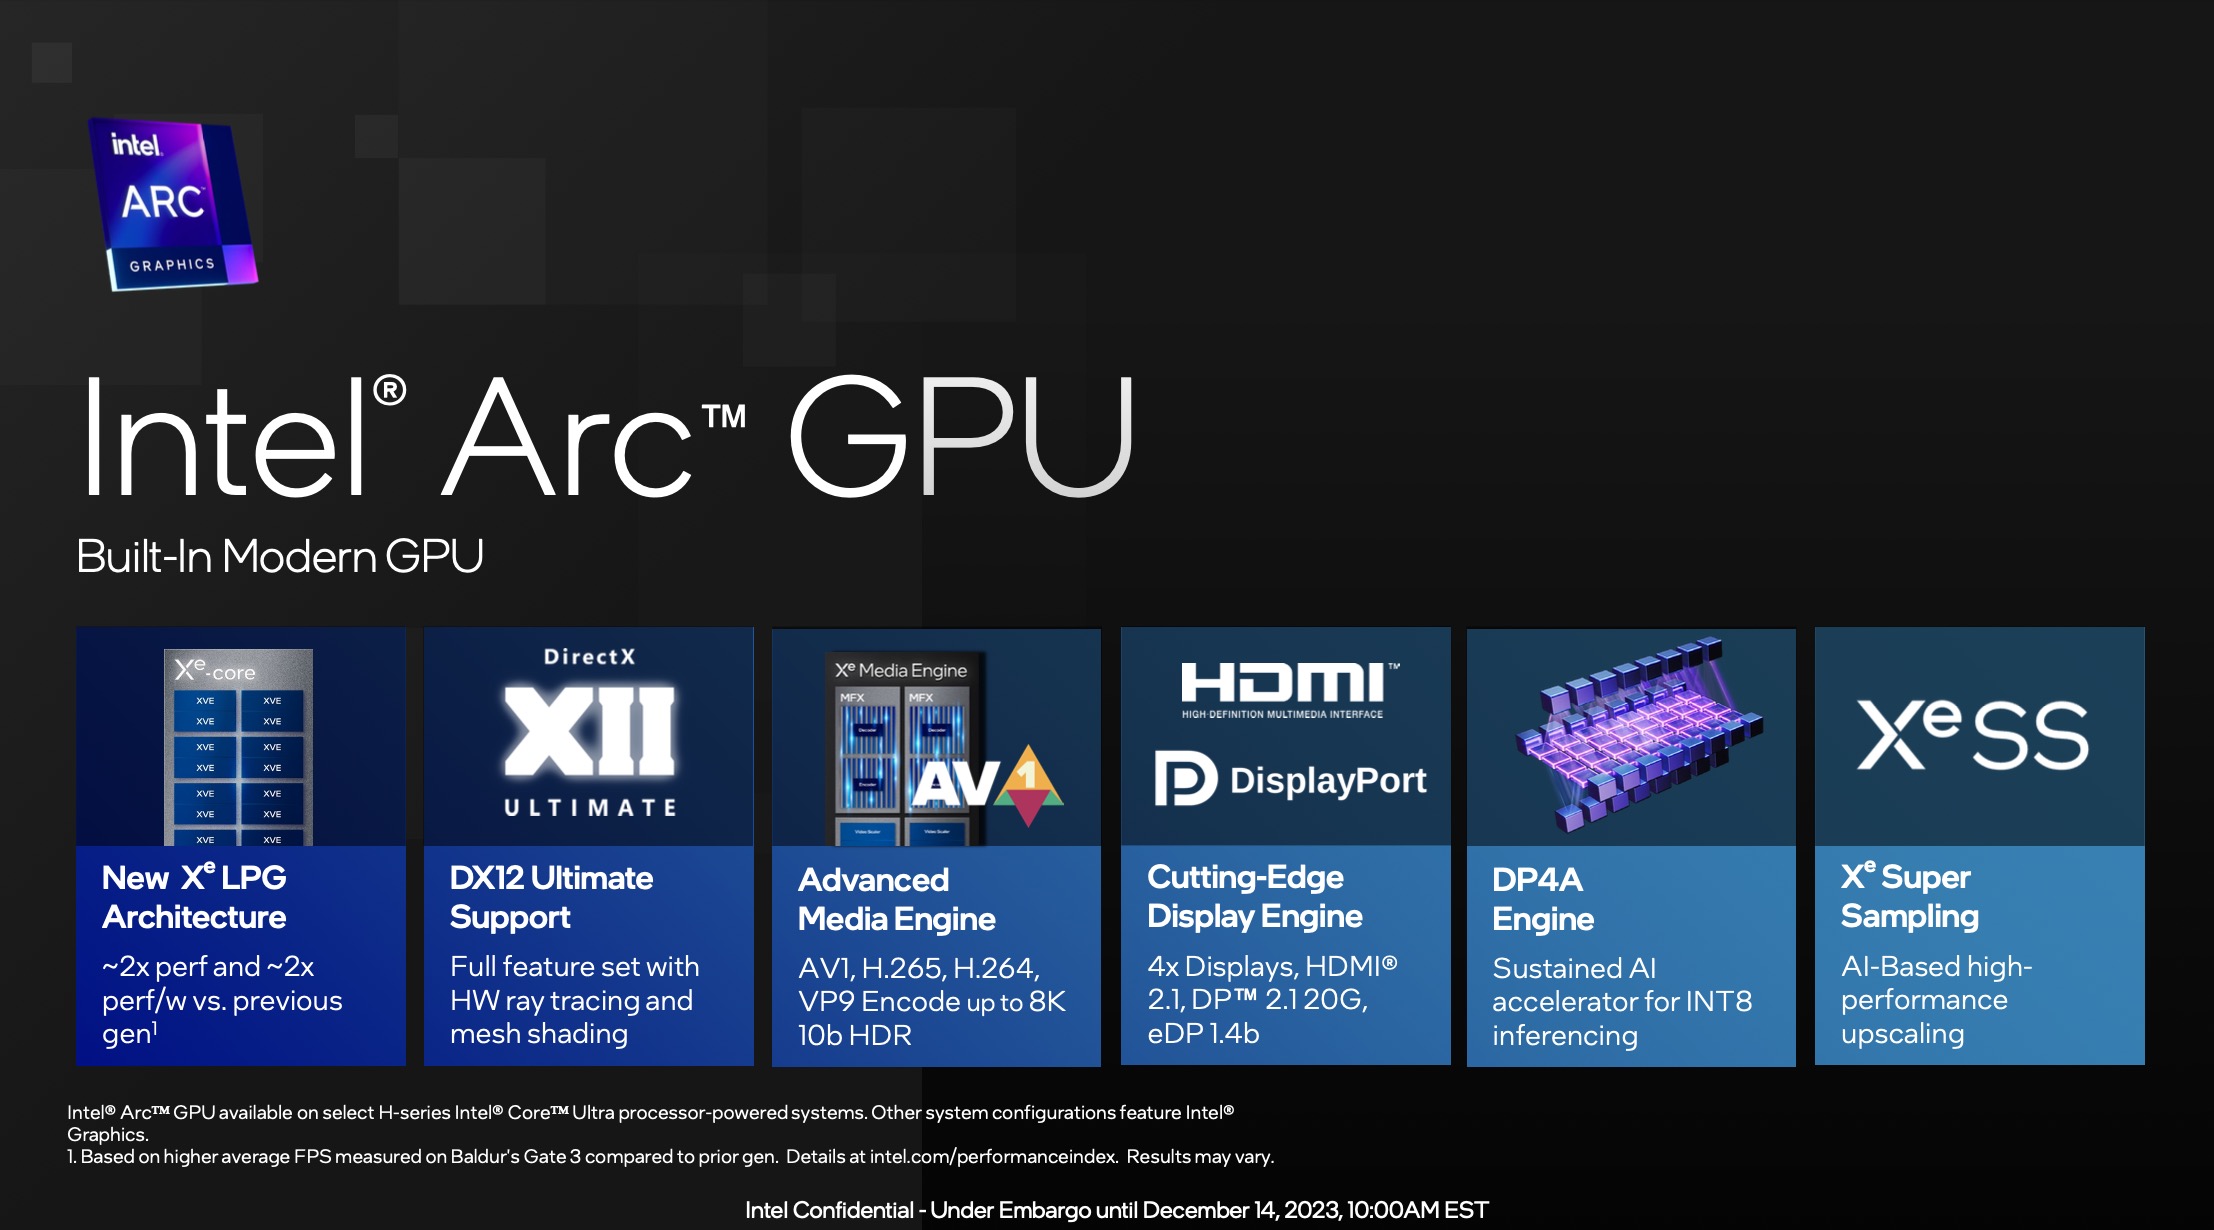
The Intel Arc iGPU with 7 cores is an integrated graphics adapter based on the Xe LPG architecture (similar to the dedicated Arc GPUs, but with a focus on efficiency). It offers 7 of the 8 Xe cores (112 Xe Vector Engines), 7 raytracing units, 7 samplers and probably also 4 pixel backends.

The Arc name may only be used if at least 16 GB RAM is used in dual channel mode. Otherwise, the iGPU is only called "Intel Graphics" and is also significantly slower.

According to Intel, performance has been doubled compared to the previous generation (probably still in Alder Lake).

The iGPU supports DirectX 12 Ultimate (probably DX 12_2 like the desktop Arc GPUs). The graphics unit also supports XeSS AI Super Sampling.

The media engine of Meteor Lake is in the SOC tile and supports up to 8k60 10-bit HDR encode and decode of MPEG2, AVC, VP9, HEVC and AV1. The display engine is also in the SoC tile and supports HDMI 2.1 and DisplayPort 2.1 20G with up to 8K60 HDR.

The GPU Tile of the Meteor Lake chip is manufactured at TSMC on 5nm (5N process).

NVIDIA GeForce RTX 3050 6GB Laptop GPUIntel Graphics 4-Core iGPU (Arc)Intel Arc 7-Core iGPU
Arc LPG Series
NVIDIA GeForce RTX 3090 Ti 10752 @ 1.56 - 1.86 GHz384 Bit @ 21000 MHz
NVIDIA GeForce RTX 3090 10496 @ 1.4 - 1.7 GHz384 Bit @ 19500 MHz
NVIDIA GeForce RTX 3080 Ti 10240 @ 1.37 - 1.67 GHz384 Bit @ 19000 MHz
NVIDIA GeForce RTX 3080 12 GB 8960/ cores @ 1.26 - 1.71 GHz384 Bit @ 19000 MHz
NVIDIA GeForce RTX 3080 8704 @ 1.45 - 1.71 GHz320 Bit @ 19000 MHz
GeForce RTX 3070 Ti 6144 @ 1.58 - 1.77 GHz256 Bit @ 19000 MHz
GeForce RTX 3080 Ti Laptop GPU 7424 @ 0.98 - 1.59 GHz256 Bit @ 14000 MHz
NVIDIA GeForce RTX 3070 5888 @ 1.5 - 1.73 GHz256 Bit @ 14000 MHz
GeForce RTX 3080 Laptop GPU 6144 @ 0.78 - 1.25 GHz256 Bit @ 14000 MHz
NVIDIA GeForce RTX 3060 Ti 4864 @ 1.41 - 1.67 GHz256 Bit @ 14000 MHz
GeForce RTX 3070 Ti Laptop GPU 5888 @ 0.92 - 1.48 GHz256 Bit @ 14000 MHz
GeForce RTX 3070 Laptop GPU 5120 @ 0.78 - 1.29 GHz256 Bit @ 14000 MHz
NVIDIA GeForce RTX 3060 3584 @ 1.32 - 1.78 GHz192 Bit @ 15000 MHz
GeForce RTX 3080 Max-Q 6144 @ 0.78 - 1.25 GHz256 Bit @ 6000 MHz
GeForce RTX 3070 Max-Q 5120 @ 1.29 GHz256 Bit
GeForce RTX 3060 Laptop GPU 3840 @ 0.82 - 1.7 GHz192 Bit @ 14000 MHz
GeForce RTX 3060 Max-Q 3840 @ 1.28 GHz192 Bit
NVIDIA GeForce RTX 3050 2560 @ 1.55 - 1.78 GHz128 Bit Bit @ 1750 MHz
GeForce RTX 3050 Ti Laptop GPU 2560 @ 1.22 - 1.49 GHz128 Bit @ 12000 MHz
GeForce RTX 3050 6GB Laptop GPU 2560 @ 1.24 - 1.49 GHz96 Bit @ 12000 MHz
GeForce RTX 3050 A Laptop GPU 1792 64 Bit
GeForce RTX 3050 4GB Laptop GPU 2048 @ 1.24 - 1.5 GHz128 Bit @ 12000 MHz
Arc 8-Core 8 @ 2.3 GHz
Arc 7-Core 7 @ 2.2 GHz
Graphics 4-Core 64 @ 0.3 - 1.95 GHz
Arc 8-Core 8 @ 2.3 GHz
Arc 7-Core 7 @ 2.2 GHz
Graphics 4-Core 64 @ 0.3 - 1.95 GHz
CodenameGN20-P0-R 6GBMeteor Lake iGPUMeteor Lake iGPU
ArchitectureAmpereXe LPGXe LPG
Pipelines2560 - unified64 - unified7 - unified
TMUs8032
ROPs3216
Raytracing Cores1647
Tensor / AI Cores64
Core Speed1237 - 1492 (Boost) MHz300 - 1950 (Boost) MHz2200 (Boost) MHz
Memory Speed12000 effective = 1500 MHz
Memory Bus Width96 Bit
Memory TypeGDDR6
Max. Amount of Memory6 GB
Shared Memorynonoyes
Memory Bandwidth144 GB/s
APIDirectX 12_2, Shader 6.7, OpenGL 4.6DirectX 12_2, Shader 6.8, OpenGL 4.6, OpenCL 3.0, Vulkan 1.3DirectX 12_2, OpenGL 4.6, Vulkan 1.3
Power Consumption60 Watt (35 - 80 Watt TGP)
technology8 nm5 nm5 nm
PCIe4.0
DisplaysHDMI 2.1, DisplayPort 1.4aHDMI 2.1, DisplayPort 2.1 20GHDMI 2.1, DisplayPort 2.1 20G
FeaturesNVIDIA DLSS, NVIDIA Reflex, Resizable BAR, NVIDIA Broadcast, NVIDIA Ansel, NVIDIA ShadowPlay, NVIDIA G-SYNC, Advanced Optimus, Nvidia Max-Q, Dynamic Boost
Notebook Sizelarge
Date of Announcement06.01.2023 06.01.2025 14.12.2023
PredecessorGeForce RTX 3050 4GB Laptop GPU
AI GPU8 TOPS INT8
CacheL1: 768 KBL1: 1.3 MB
CPU in Graphics 4-CoreGPU Base SpeedGPU Boost / Turbo
Intel Core Ultra 9 285K24 x 3200 MHz, 125 W? MHz? MHz
Intel Core Ultra 9 28524 x 1900 MHz, 65 W? MHz2000 MHz
Intel Core Ultra 9 285HX24 x 2100 MHz, 55 W300 MHz2000 MHz
min. - max.? - 300 MHz1750 - 2100 MHz
CPU in Arc 7-CoreGPU Base SpeedGPU Boost / Turbo
Intel Core Ultra 5 125H14 x 3600 MHz, 28 W? MHz2200 MHz

Benchmarks

Performance Rating - 3DMark 11 + Fire Strike + Time Spy - GeForce RTX 3050 6GB Laptop GPU
4.5 pt (13%)
Restrict / Search: Model: Max. age: years
Performance Rating - 3DMark 11 + Fire Strike + Time Spy - Graphics 4-Core
1.9 pt (6%)
Restrict / Search: Model: Max. age: years
Performance Rating - 3DMark 11 + Fire Strike + Time Spy - Arc 7-Core
3 pt (9%)
Restrict / Search: Model: Max. age: years
3DMark - 3DMark Speed Way Score
min: 1058     avg: 1059     median: 1058.5 (7%)     max: 1059 Points
min: 226     avg: 234.5     median: 234 (2%)     max: 244 Points
min: 345     avg: 411     median: 399 (3%)     max: 489 Points
3DMark - 3DMark Steel Nomad
min: 335     avg: 390.2     median: 387 (3%)     max: 427 Points
min: 581     avg: 626     median: 598 (4%)     max: 699 Points
3DMark - 3DMark Steel Nomad Light
min: 1434     avg: 1593     median: 1626 (4%)     max: 1749 Points
min: 2436     avg: 2617     median: 2617 (6%)     max: 2798 Points
3DMark - 3DMark Wild Life Unlimited
14464 Points (7%)
3DMark - 3DMark Wild Life Extreme Unlimited
8916 Points (10%)
min: 2332     avg: 3416     median: 3631 (4%)     max: 3997 Points
min: 5654     avg: 5699     median: 5699 (7%)     max: 5744 Points
3DMark - 3DMark Solar Bay
min: 6414     avg: 7005     median: 7002 (3%)     max: 7598 Points
min: 10005     avg: 11091     median: 11091 (5%)     max: 12177 Points
3DMark - 3DMark Fire Strike Standard Score
min: 10765     avg: 10944     median: 10840 (16%)     max: 11330 Points
min: 3591     avg: 4578     median: 4750.5 (7%)     max: 5295 Points
min: 4214     avg: 6801     median: 7302 (11%)     max: 7929 Points
3DMark - 3DMark Fire Strike Standard Graphics
min: 11887     avg: 12113     median: 11973 (11%)     max: 12618 Points
min: 3838     avg: 4905     median: 5130.5 (5%)     max: 5554 Points
min: 4575     avg: 7464     median: 7900 (7%)     max: 8531 Points
3DMark - 3DMark Ice Storm Graphics
80553 Points (9%)
min: 89439     avg: 140883     median: 155226 (17%)     max: 163640 Points
min: 158643     avg: 181910     median: 159017 (18%)     max: 228069 Points
3DMark - 3DMark Time Spy Score
min: 4933     avg: 5049     median: 5033 (13%)     max: 5182 Points
min: 1737     avg: 2063     median: 2081.5 (6%)     max: 2397 Points
min: 2351     avg: 3232     median: 3259 (9%)     max: 3658 Points
3DMark - 3DMark Time Spy Graphics
min: 4501     avg: 4631     median: 4571 (9%)     max: 4820 Points
min: 1530     avg: 1846     median: 1849 (4%)     max: 2144 Points
min: 2090     avg: 2934     median: 3000 (6%)     max: 3319 Points
3DMark - 3DMark Ice Storm Unlimited Graphics
500518 Points (51%)
min: 294961     avg: 299673     median: 295187 (30%)     max: 308872 Points
396714 Points (40%)
3DMark - 3DMark Ice Storm Extreme Graphics
80214 Points (9%)
min: 75102     avg: 102926     median: 113230 (13%)     max: 120447 Points
min: 145414     avg: 146731     median: 146731 (17%)     max: 148048 Points
3DMark - 3DMark Cloud Gate Score
43015 Points (41%)
min: 16625     avg: 21629     median: 21927 (21%)     max: 26389 Points
min: 23725     avg: 28484     median: 29186 (28%)     max: 30553 Points
3DMark - 3DMark Cloud Gate Graphics
72486 Points (18%)
min: 22976     avg: 28163     median: 29517 (7%)     max: 33120 Points
min: 28658     avg: 39212     median: 40086 (10%)     max: 45644 Points
3DMark - 3DMark Night Raid
min: 18070     avg: 18839     median: 18446 (17%)     max: 20000 Points
min: 25271     avg: 25991     median: 25990.5 (25%)     max: 26710 Points
3DMark - 3DMark Night Raid Graphics Score
min: 21081     avg: 22151     median: 21828 (8%)     max: 23544 Points
min: 30252     avg: 31507     median: 31507 (12%)     max: 32762 Points
3DMark 11 - 3DM11 Performance Score
min: 15844     avg: 16748     median: 16933.5 (20%)     max: 17282 Points
min: 4964     avg: 6680     median: 6833 (8%)     max: 7632 Points
min: 5911     avg: 10571     median: 11161 (14%)     max: 12140 Points
3DMark 11 - 3DM11 Performance GPU
min: 15860     avg: 16970     median: 16979.5 (13%)     max: 18059 Points
min: 4520     avg: 6215     median: 6291 (5%)     max: 7109 Points
min: 5549     avg: 10490     median: 11467 (9%)     max: 12061 Points
3DMark Vantage
3DM Vant. Perf. total + Intel Arc 7-Core iGPU
3DMark Vantage - 3DM Vant. Perf. total
min: 35885     avg: 38156     median: 37719 (11%)     max: 41299 Points
3DM Vant. Perf. GPU no PhysX + Intel Arc 7-Core iGPU
3DMark Vantage - 3DM Vant. Perf. GPU no PhysX
min: 30937     avg: 33936     median: 34042 (19%)     max: 36721 Points
3DMark 05 - 3DMark 05 - Standard
min: 41203     avg: 44877     median: 44876.5 (49%)     max: 48550 Points
3DMark 06 3DMark 06 - Standard 1280x1024 + Intel Graphics 4-Core iGPU (Arc)
3DMark 06
27772 Points (36%)
3DMark 06 - Standard 1280x1024 + Intel Arc 7-Core iGPU
min: 38905     avg: 40397     median: 40216 (53%)     max: 42252 Points
Unigine Valley 1.0 - Unigine Valley 1.0 DX
min: 16.9     avg: 18.8     median: 18.8 (6%)     max: 20.7 fps
Blender - Blender 3.3 Classroom CUDA *
min: 107     avg: 111     median: 111 (16%)     max: 115 Seconds
Blender - Blender 3.3 Classroom OPTIX *
min: 68     avg: 70     median: 70 (26%)     max: 72 Seconds
SPECviewperf 2020 specvp2020 snx-04 1080p + Intel Arc 7-Core iGPU
SPECviewperf 2020 - specvp2020 snx-04 1080p
min: 5.65     avg: 5.8     median: 5.8 (1%)     max: 5.97 fps
specvp2020 medical-03 1080p + Intel Arc 7-Core iGPU
SPECviewperf 2020 - specvp2020 medical-03 1080p
min: 12.3     avg: 13.5     median: 13.5 (4%)     max: 14.6 fps
specvp2020 maya-06 1080p + Intel Arc 7-Core iGPU
SPECviewperf 2020 - specvp2020 maya-06 1080p
min: 68.4     avg: 71.8     median: 71.8 (8%)     max: 75.1 fps
specvp2020 energy-03 1080p + Intel Arc 7-Core iGPU
SPECviewperf 2020 - specvp2020 energy-03 1080p
min: 4.61     avg: 4.8     median: 4.8 (1%)     max: 5.08 fps
specvp2020 creo-03 1080p + Intel Arc 7-Core iGPU
SPECviewperf 2020 - specvp2020 creo-03 1080p
min: 20.2     avg: 20.3     median: 20.3 (7%)     max: 20.3 fps
specvp2020 catia-06 1080p + Intel Arc 7-Core iGPU
SPECviewperf 2020 - specvp2020 catia-06 1080p
min: 15.5     avg: 16.1     median: 16.1 (8%)     max: 16.6 fps
specvp2020 3dsmax-07 1080p + Intel Arc 7-Core iGPU
SPECviewperf 2020 - specvp2020 3dsmax-07 1080p
min: 19.8     avg: 20.5     median: 20.5 (5%)     max: 21.1 fps
specvp2020 snx-04 4k + Intel Arc 7-Core iGPU
SPECviewperf 2020 - specvp2020 snx-04 4k
min: 5.54     avg: 5.7     median: 5.7 (1%)     max: 5.82 fps
specvp2020 medical-03 4k + Intel Arc 7-Core iGPU
SPECviewperf 2020 - specvp2020 medical-03 4k
min: 4.8     avg: 5.3     median: 5.3 (3%)     max: 5.87 fps
specvp2020 maya-06 4k + Intel Arc 7-Core iGPU
SPECviewperf 2020 - specvp2020 maya-06 4k
min: 32.8     avg: 33.8     median: 33.8 (5%)     max: 34.7 fps
specvp2020 energy-03 4k + Intel Arc 7-Core iGPU
SPECviewperf 2020 - specvp2020 energy-03 4k
min: 3.38     avg: 3.6     median: 3.6 (1%)     max: 3.81 fps
specvp2020 creo-03 4k + Intel Arc 7-Core iGPU
SPECviewperf 2020 - specvp2020 creo-03 4k
min: 15.3     avg: 15.4     median: 15.4 (7%)     max: 15.4 fps
specvp2020 catia-06 4k + Intel Arc 7-Core iGPU
SPECviewperf 2020 - specvp2020 catia-06 4k
min: 9.7     avg: 10.1     median: 10.1 (7%)     max: 10.4 fps
specvp2020 3dsmax-07 4k + Intel Arc 7-Core iGPU
SPECviewperf 2020 - specvp2020 3dsmax-07 4k
min: 13.2     avg: 13.9     median: 13.9 (5%)     max: 14.5 fps
Cinebench R10 Cinebench R10 Shading (32bit) + Intel Graphics 4-Core iGPU (Arc)
Cinebench R10 - Cinebench R10 Shading (32bit)
15457 Points (11%)
Cinebench R10 Shading (32bit) + Intel Arc 7-Core iGPU
min: 15394     avg: 15881     median: 15688.5 (11%)     max: 16752 Points
Cinebench R11.5 Cinebench R11.5 OpenGL 64 Bit + Intel Graphics 4-Core iGPU (Arc)
Cinebench R11.5 - Cinebench R11.5 OpenGL 64 Bit
88.4 fps (29%)
Cinebench R11.5 OpenGL 64 Bit + Intel Arc 7-Core iGPU
min: 92.81     avg: 95.4     median: 95.6 (31%)     max: 97.61 fps
Cinebench R15
Cinebench R15 OpenGL 64 Bit + NVIDIA GeForce RTX 3050 6GB Laptop GPU
Cinebench R15 - Cinebench R15 OpenGL 64 Bit
min: 117.6     avg: 195.4     median: 221 (13%)     max: 222 fps
Cinebench R15 OpenGL 64 Bit + Intel Graphics 4-Core iGPU (Arc)
min: 92.6     avg: 103.8     median: 103.8 (6%)     max: 119.3 fps
Cinebench R15 OpenGL 64 Bit + Intel Arc 7-Core iGPU
min: 116.8     avg: 136.1     median: 138 (8%)     max: 145.06 fps
Cinebench R15 OpenGL Ref. Match 64 Bit + NVIDIA GeForce RTX 3050 6GB Laptop GPU
Cinebench R15 - Cinebench R15 OpenGL Ref. Match 64 Bit
99.6 % (100%)
Cinebench R15 OpenGL Ref. Match 64 Bit + Intel Graphics 4-Core iGPU (Arc)
97.8 % (98%)
Cinebench R15 OpenGL Ref. Match 64 Bit + Intel Arc 7-Core iGPU
97.8 % (98%)
GFXBench - GFXBench 5.0 4K Aztec Ruins High Tier Offscreen
min: 16.8173     avg: 19.4     median: 20.7 (8%)     max: 20.8 fps
min: 25.5     avg: 29.7     median: 29.7 (11%)     max: 33.9 fps
GFXBench - GFXBench 5.0 Aztec Ruins High Tier Offscreen
min: 37.3169     avg: 45.1     median: 48.8 (9%)     max: 49.1 fps
min: 77.4     avg: 78.8     median: 78.8 (14%)     max: 80.1 fps
GFXBench - GFXBench 5.0 Aztec Ruins Normal Tier Offscreen
min: 91.8253     avg: 116.8     median: 129.2 (10%)     max: 129.5 fps
193.7 fps (14%)
GFXBench - GFXBench Car Chase Offscreen
min: 75.6254     avg: 85.5     median: 89.5 (8%)     max: 91.5 fps
155.8 fps (15%)
GFXBench 3.1 - GFXBench Manhattan ES 3.1 Offscreen
min: 117.479     avg: 146.5     median: 160.1 (3%)     max: 161.9 fps
GFXBench 3.0 - GFXBench 3.0 Manhattan Offscreen
min: 173.822     avg: 225.5     median: 246.1 (10%)     max: 256.6 fps
GFXBench (DX / GLBenchmark) 2.7
GFXBench T-Rex HD Offscreen C24Z16 + Intel Graphics 4-Core iGPU (Arc)
GFXBench (DX / GLBenchmark) 2.7 - GFXBench T-Rex HD Offscreen C24Z16
min: 370.774     avg: 434.8     median: 466.5 (4%)     max: 467 fps
Basemark GPU 1.2 - Basemark GPU 1.2 Vulkan Official Medium Offscreen 1080
min: 104.6     avg: 169.5     median: 142.2 (3%)     max: 289 fps
min: 104.6     avg: 152.5     median: 104.6 (3%)     max: 315 fps
min: 104.6     avg: 203.3     median: 196.8 (5%)     max: 315 fps
Basemark GPU 1.2 - Basemark GPU 1.2 Vulkan Official High Offscreen 2160
3.6 fps (1%)
3.6 fps (1%)
3.6 fps (1%)
Geekbench 6.5 - Geekbench 6.5 GPU OpenCL
min: 52427     avg: 53532     median: 53414 (14%)     max: 54754 Points
min: 12919     avg: 17325     median: 17343 (5%)     max: 20750 Points
min: 26624     avg: 29363     median: 29263 (8%)     max: 33039 Points
Geekbench 6.5 - Geekbench 6.5 GPU Vulkan
min: 18152     avg: 30115     median: 20847 (5%)     max: 51347 Points
min: 12337     avg: 17546     median: 18113.5 (5%)     max: 19957 Points
min: 26482     avg: 30465     median: 29526 (7%)     max: 34230 Points
LuxMark v2.0 64Bit - LuxMark v2.0 Room GPU
min: 708     avg: 757     median: 755.5 (3%)     max: 809 Samples/s
LuxMark v2.0 64Bit - LuxMark v2.0 Sala GPU
min: 1926     avg: 2453     median: 2538.5 (4%)     max: 2807 Samples/s
ComputeMark v2.1 - ComputeMark v2.1 Result
min: 5613     avg: 6364     median: 6471.5 (5%)     max: 6899 Points
Power Consumption - Furmark Stress Test Power Consumption - external Monitor *
min: 76.8     avg: 84.9     median: 83.4 (11%)     max: 96.1 Watt
min: 25.3     avg: 30.5     median: 31.1 (4%)     max: 38 Watt
min: 43.1     avg: 49.9     median: 48.3 (6%)     max: 57.4 Watt
Power Consumption - The Witcher 3 Power Consumption - external Monitor *
min: 83     avg: 87.2     median: 86.1 (12%)     max: 92.6 Watt
min: 24.4     avg: 27.7     median: 26.8 (4%)     max: 32.2 Watt
min: 39.7     avg: 42.6     median: 41.9 (6%)     max: 46.3 Watt
Power Consumption - Witcher 3 Power Consumption *
min: 86.8     avg: 90.8     median: 89.5 (20%)     max: 96.2 Watt
min: 27.4     avg: 32.3     median: 30.7 (7%)     max: 41.5 Watt
min: 44.4     avg: 46     median: 45.9 (10%)     max: 47.7 Watt
Power Consumption - Power Efficiency - Witcher 3 ultra
min: 0.503     avg: 0.5     median: 0.5 (47%)     max: 0.591 fps per Watt
min: 0.4313     avg: 0.5     median: 0.5 (43%)     max: 0.544 fps per Watt
min: 0.3987     avg: 0.5     median: 0.5 (48%)     max: 0.545 fps per Watt
Power Consumption - Power Efficiency - Witcher 3 ultra external Monitor
min: 0.527     avg: 0.6     median: 0.5 (45%)     max: 0.614 fps per Watt
min: 0.4877     avg: 0.5     median: 0.5 (45%)     max: 0.603 fps per Watt
min: 0.4368     avg: 0.5     median: 0.6 (47%)     max: 0.589 fps per Watt
Power Consumption - Cyberpunk 2077 Power Consumption 150cd *
92.1 Watt (26%)
min: 22.2     avg: 38.2     median: 39.4 (11%)     max: 50.1 Watt
Power Consumption - Cyberpunk 2077 Power Consumption - external Monitor *
88.7 Watt (11%)
min: 23.7     avg: 37.1     median: 36.7 (5%)     max: 48 Watt
min: 52.7     avg: 56.3     median: 57.1 (7%)     max: 59.1 Watt
Power Consumption - Power Efficiency - Cyberpunk 2077 ultra
min: 0.1977     avg: 2.3     median: 0.3 (1%)     max: 28.3 fps per Watt
Emissions Witcher 3 Fan Noise + NVIDIA GeForce RTX 3050 6GB Laptop GPU
Emissions - Witcher 3 Fan Noise
min: 42.1     avg: 44.9     median: 43.8 (63%)     max: 48.7 dB(A)
Witcher 3 Fan Noise + Intel Graphics 4-Core iGPU (Arc)
min: 27.3     avg: 37.3     median: 37 (53%)     max: 44.9 dB(A)
Witcher 3 Fan Noise + Intel Arc 7-Core iGPU
min: 36.8     avg: 38.4     median: 38.5 (55%)     max: 40 dB(A)

Average Benchmarks NVIDIA GeForce RTX 3050 6GB Laptop GPU → 100% n=19

Average Benchmarks Intel Graphics 4-Core iGPU (Arc) → 65% n=19

Average Benchmarks Intel Arc 7-Core iGPU → 88% n=19

- Range of benchmark values for this graphics card
red legend - Average benchmark values for this graphics card
* Smaller numbers mean a higher performance
1 This benchmark is not used for the average calculation

Game Benchmarks

The following benchmarks stem from our benchmarks of review laptops. The performance depends on the used graphics memory, clock rate, processor, system settings, drivers, and operating systems. So the results don't have to be representative for all laptops with this GPU. For detailed information on the benchmark results, click on the fps number.

low 1920x1080
Graphics 4-Core:
7.1  fps
Stalker 2

Stalker 2

2024
low 1920x1080
Graphics 4-Core:
6.8  fps
med. 1920x1080
Graphics 4-Core:
6  fps
high 1920x1080
Graphics 4-Core:
5.3  fps
low 1920x1080
Graphics 4-Core:
15  fps
med. 1920x1080
Graphics 4-Core:
14  fps
high 1920x1080
Graphics 4-Core:
10  fps
low 1920x1080
Graphics 4-Core:
17.3  fps
med. 1920x1080
Graphics 4-Core:
11.5  fps
high 1920x1080
Graphics 4-Core:
7.4  fps
low 1920x1080
Graphics 4-Core:
8  fps
med. 1920x1080
Graphics 4-Core:
8  fps
high 1920x1080
Graphics 4-Core:
6.7  fps
low 1920x1080
Graphics 4-Core:
10.2  fps
med. 1920x1080
Graphics 4-Core:
8.1  fps
high 1920x1080
Graphics 4-Core:
7.4  fps
low 1920x1080 cinem.
Graphics 4-Core:
0 (!)  fps
med. 1920x1080 cinem.
Graphics 4-Core:
0 (!)  fps
high 1920x1080 cinem.
Graphics 4-Core:
0 (!)  fps
F1 24

F1 24

2024
low 1920x1080
Graphics 4-Core:
33 34.2 35.1 36.3 39.2 39.9 40.6 41.7 ~ 38 fps
Arc 7-Core:
64.3 66.2 ~ 65 fps
med. 1920x1080
Graphics 4-Core:
30.1 30.3 31.2 32.7 33.8 35.7 36.8 39.6 ~ 34 fps
Arc 7-Core:
56.6 57.6 ~ 57 fps
high 1920x1080
Graphics 4-Core:
22.6 23.5 23.8 26.4 26.9 30 ~ 26 fps
Arc 7-Core:
41.7 43.4 ~ 43 fps
ultra 1920x1080
Graphics 4-Core:
7.2 7.3 8.5 ~ 8 fps
Arc 7-Core:
11.4  fps
low 1920x1080
Graphics 4-Core:
6.4  fps
med. 1920x1080
Graphics 4-Core:
5.4  fps
high 1920x1080
Graphics 4-Core:
4.1  fps
low 1920x1080
Graphics 4-Core:
11.5  fps
med. 1920x1080
Graphics 4-Core:
9.8  fps
high 1920x1080
Graphics 4-Core:
8.9  fps
low 1920x1080
Graphics 4-Core:
13.8  fps
med. 1920x1080
Graphics 4-Core:
12.3  fps
high 1920x1080
Graphics 4-Core:
8  fps
low 1920x1080
Graphics 4-Core:
9.1  fps
high 1920x1080
Graphics 4-Core:
6.8  fps
low 1920x1080
Arc 7-Core:
53.8  fps
med. 1920x1080
Arc 7-Core:
38.7  fps
high 1920x1080
Arc 7-Core:
33  fps
ultra 1920x1080
Arc 7-Core:
25.3  fps
low 1920x1080
Arc 7-Core:
33  fps
med. 1920x1080
Arc 7-Core:
31  fps
high 1920x1080
Arc 7-Core:
24  fps
ultra 1920x1080
Arc 7-Core:
18  fps
low 1920x1080
Graphics 4-Core:
16  fps
Arc 7-Core:
32.1  fps
med. 1920x1080
Graphics 4-Core:
12.2  fps
Arc 7-Core:
25  fps
high 1920x1080
Graphics 4-Core:
11  fps
Arc 7-Core:
22.7  fps
ultra 1920x1080
Arc 7-Core:
21.7  fps
low 1920x1080
Arc 7-Core:
21.5  fps
med. 1920x1080
Arc 7-Core:
18  fps
high 1920x1080
Arc 7-Core:
0 (!)  fps
ultra 1920x1080
Arc 7-Core:
0 (!)  fps
Palworld

Palworld

2024
low 1920x1080
Arc 7-Core:
34.8  fps
med. 1920x1080
Arc 7-Core:
32.6  fps
high 1920x1080
Arc 7-Core:
25.2  fps
ultra 1920x1080
Arc 7-Core:
23.4  fps
med. 1920x1080
Graphics 4-Core:
96.4  fps
Arc 7-Core:
215  fps
high 1920x1080
Graphics 4-Core:
48.4  fps
Arc 7-Core:
127  fps
ultra 1920x1080
Graphics 4-Core:
45.7  fps
Arc 7-Core:
120  fps
low 1920x1080
Arc 7-Core:
62.7  fps
med. 1920x1080
Arc 7-Core:
48.3  fps
high 1920x1080
Arc 7-Core:
44.5  fps
ultra 1920x1080
Arc 7-Core:
34.5  fps
low 1920x1080
Arc 7-Core:
70  fps
med. 1920x1080
Arc 7-Core:
47.7  fps
high 1920x1080
Arc 7-Core:
39.7  fps
ultra 1920x1080
Arc 7-Core:
34.6  fps
low 1920x1080
100%
GeForce RTX 3050 6GB Laptop GPU:
39.5  fps
38%
Arc 7-Core:
15  fps
med. 1920x1080
100%
GeForce RTX 3050 6GB Laptop GPU:
36.3  fps
39%
Arc 7-Core:
14  fps
high 1920x1080
100%
GeForce RTX 3050 6GB Laptop GPU:
31.5  fps
38%
Arc 7-Core:
12  fps
ultra 1920x1080
100%
GeForce RTX 3050 6GB Laptop GPU:
23.4  fps
38%
Arc 7-Core:
9  fps
QHD 2560x1440
100%
GeForce RTX 3050 6GB Laptop GPU:
15.1  fps
low 1920x1080
Arc 7-Core:
28.6  fps
med. 1920x1080
Arc 7-Core:
21  fps
high 1920x1080
Arc 7-Core:
19.2  fps
ultra 1920x1080
Arc 7-Core:
17.9  fps
low 1920x1080
Arc 7-Core:
15.8  fps
med. 1920x1080
Arc 7-Core:
0 (!)  fps
high 1920x1080
Arc 7-Core:
0 (!)  fps
low 1920x1080
Arc 7-Core:
17.1  fps
med. 1920x1080
Arc 7-Core:
11.7  fps
high 1920x1080
Arc 7-Core:
11.4  fps
ultra 1920x1080
Arc 7-Core:
10.8  fps
low 1920x1080
Arc 7-Core:
95.5  fps
med. 1920x1080
Arc 7-Core:
56.8  fps
high 1920x1080
Arc 7-Core:
35.6  fps
ultra 1920x1080
Arc 7-Core:
28.1  fps
low 1920x1080
100%
GeForce RTX 3050 6GB Laptop GPU:
70  fps
47%
Arc 7-Core:
33  fps
med. 1920x1080
100%
GeForce RTX 3050 6GB Laptop GPU:
63  fps
49%
Arc 7-Core:
31  fps
high 1920x1080
100%
GeForce RTX 3050 6GB Laptop GPU:
55  fps
49%
Arc 7-Core:
27  fps
ultra 1920x1080
100%
GeForce RTX 3050 6GB Laptop GPU:
41  fps
0%
Arc 7-Core:
0 (!)  fps
QHD 2560x1440
100%
GeForce RTX 3050 6GB Laptop GPU:
31  fps
low 1920x1080
Arc 7-Core:
90.2  fps
med. 1920x1080
Arc 7-Core:
57.9  fps
high 1920x1080
Arc 7-Core:
37.6  fps
ultra 1920x1080
Arc 7-Core:
24.7  fps
low 1920x1080
100%
GeForce RTX 3050 6GB Laptop GPU:
55.2 66.7 67.6 ~ 63 fps
30%
Graphics 4-Core:
16.7 17.2 17.2 17.4 17.5 17.6 17.8 18.5 18.7 18.8 18.9 18.9 19.3 19.4 19.5 19.5 20.2 20.3 20.5 20.6 20.9 21.1 21.6 22.1 22.5 ~ 19 fps
46%
Arc 7-Core:
23.2 29.2 29.5 30.1 30.9 ~ 29 fps
med. 1920x1080
100%
GeForce RTX 3050 6GB Laptop GPU:
43.7 51.4 52.1 ~ 49 fps
33%
Graphics 4-Core:
13.2 13.4 13.5 13.8 14 14.2 15 15.1 15.1 15.3 15.3 15.4 15.8 15.9 15.9 16.1 16.5 16.6 16.6 16.7 16.9 17.1 17.6 17.6 18.3 ~ 16 fps
47%
Arc 7-Core:
19.8 21.7 24.3 25.2 25.2 ~ 23 fps
high 1920x1080
100%
GeForce RTX 3050 6GB Laptop GPU:
36.6 42.7 43.2 ~ 41 fps
32%
Graphics 4-Core:
11.4 11.9 11.9 12.2 12.4 12.4 12.4 12.6 12.7 12.8 12.8 13 13 13.3 13.6 13.7 13.7 14.1 14.3 14.4 14.6 14.9 15.4 15.5 ~ 13 fps
49%
Arc 7-Core:
16.6 19.1 20.6 21.3 21.7 ~ 20 fps
ultra 1920x1080
100%
GeForce RTX 3050 6GB Laptop GPU:
31.4 36.1 36.9 ~ 35 fps
34%
Graphics 4-Core:
10 10.3 10.4 10.6 10.7 10.8 10.9 11.1 11.1 11.2 11.3 11.4 11.6 11.7 11.9 12 12 12.2 12.5 12.6 12.7 13 13.6 13.7 ~ 12 fps
51%
Arc 7-Core:
14.8 16.4 18.8 18.8 19.6 ~ 18 fps
QHD 2560x1440
100%
GeForce RTX 3050 6GB Laptop GPU:
21.3  fps
low 1920x1080
100%
GeForce RTX 3050 6GB Laptop GPU:
59.7  fps
30%
Graphics 4-Core:
14.7 15 15.1 15.4 15.5 16.1 16.2 16.4 17.3 17.3 17.6 17.7 17.8 17.9 18.1 18.2 18.6 18.8 19.4 21.1 21.5 21.7 21.7 ~ 18 fps
54%
Arc 7-Core:
29.9 30.2 33.5 33.7 ~ 32 fps
med. 1920x1080
100%
GeForce RTX 3050 6GB Laptop GPU:
50.3  fps
28%
Graphics 4-Core:
11.9 12.3 12.4 12.4 12.6 12.8 13 13.2 13.4 13.9 14.1 14.2 14.2 14.5 14.7 14.9 15.3 15.5 16.1 16.2 16.4 16.8 ~ 14 fps
52%
Arc 7-Core:
23.2 25.9 26.4 27.9 ~ 26 fps
high 1920x1080
100%
GeForce RTX 3050 6GB Laptop GPU:
45.4  fps
26%
Graphics 4-Core:
10.4 10.5 10.6 10.7 11 11 11.7 12 12.1 12.2 12.2 12.4 12.8 13.1 13.2 13.7 14 14.2 14.6 14.7 ~ 12 fps
48%
Arc 7-Core:
19.5 22.4 22.8 24.2 ~ 22 fps
ultra 1920x1080
100%
GeForce RTX 3050 6GB Laptop GPU:
44.3  fps
27%
Graphics 4-Core:
9.7 10.2 10.2 10.5 10.6 11 11.5 11.9 12 12 12.1 12.2 12.3 12.7 12.8 13.5 13.6 13.9 14.2 ~ 12 fps
47%
Arc 7-Core:
19.5 21.5 21.8 23.1 ~ 21 fps
Lies of P

Lies of P

2023
low 1920x1080
Arc 7-Core:
46  fps
med. 1920x1080
Arc 7-Core:
33.8  fps
high 1920x1080
Arc 7-Core:
32.6  fps
ultra 1920x1080
Arc 7-Core:
27.1  fps
low 1920x1080
Arc 7-Core:
26  fps
med. 1920x1080
Arc 7-Core:
24  fps
high 1920x1080
Arc 7-Core:
20  fps
ultra 1920x1080
Arc 7-Core:
17  fps
Starfield

Starfield

2023
low 1920x1080
Arc 7-Core:
19.1  fps
med. 1920x1080
Arc 7-Core:
16.5  fps
high 1920x1080
Arc 7-Core:
13.2  fps
ultra 1920x1080
Arc 7-Core:
10.7  fps
low 1920x1080
Arc 7-Core:
39.7  fps
med. 1920x1080
Arc 7-Core:
32.6  fps
high 1920x1080
Arc 7-Core:
28.5  fps
ultra 1920x1080
Arc 7-Core:
23.5  fps
low 1920x1080
Arc 7-Core:
40.5  fps
med. 1920x1080
Arc 7-Core:
40.3  fps
high 1920x1080
Arc 7-Core:
36.6  fps
ultra 1920x1080
Arc 7-Core:
26.4  fps
low 1920x1080
Arc 7-Core:
0 (!)  fps
med. 1920x1080
Arc 7-Core:
0 (!)  fps
high 1920x1080
Arc 7-Core:
0 (!)  fps
ultra 1920x1080
Arc 7-Core:
0 (!)  fps
F1 23

F1 23

2023
low 1920x1080
100%
GeForce RTX 3050 6GB Laptop GPU:
113.9 150.1 ~ 132 fps
32%
Graphics 4-Core:
40.1 43.8 ~ 42 fps
48%
Arc 7-Core:
58.7 68 ~ 63 fps
med. 1920x1080
100%
GeForce RTX 3050 6GB Laptop GPU:
109 141.2 ~ 125 fps
31%
Graphics 4-Core:
37.3 39.8 ~ 39 fps
46%
Arc 7-Core:
53.5 60 ~ 57 fps
high 1920x1080
100%
GeForce RTX 3050 6GB Laptop GPU:
86.9 97.5 ~ 92 fps
27%
Graphics 4-Core:
23.9 26 ~ 25 fps
42%
Arc 7-Core:
37.3 40 ~ 39 fps
ultra 1920x1080
100%
GeForce RTX 3050 6GB Laptop GPU:
20.5 26 ~ 23 fps
31%
Graphics 4-Core:
7.1  fps
0%
Arc 7-Core:
0 (!)  fps
QHD 2560x1440
100%
GeForce RTX 3050 6GB Laptop GPU:
10.6 14.3 ~ 12 fps
low 1920x1080
Arc 7-Core:
36.1  fps
med. 1920x1080
Arc 7-Core:
25.1  fps
high 1920x1080
Arc 7-Core:
23.6  fps
ultra 1920x1080
Arc 7-Core:
0 (!)  fps
low 1920x1080
Arc 7-Core:
51.5  fps
med. 1920x1080
Arc 7-Core:
45.4  fps
high 1920x1080
Arc 7-Core:
33.9  fps
ultra 1920x1080
Arc 7-Core:
33.3  fps
low 1920x1080
Arc 7-Core:
24.9  fps
med. 1920x1080
Arc 7-Core:
17.3  fps
high 1920x1080
Arc 7-Core:
15.5  fps
ultra 1920x1080
Arc 7-Core:
15.2  fps
low 1920x1080
Arc 7-Core:
40.7  fps
med. 1920x1080
Arc 7-Core:
31.9  fps
high 1920x1080
Arc 7-Core:
22.8  fps
ultra 1920x1080
Arc 7-Core:
16.4  fps
Returnal

Returnal

2023
low 1920x1080
100%
GeForce RTX 3050 6GB Laptop GPU:
40  fps
75%
Arc 7-Core:
30  fps
med. 1920x1080
100%
GeForce RTX 3050 6GB Laptop GPU:
38  fps
76%
Arc 7-Core:
29  fps
high 1920x1080
100%
GeForce RTX 3050 6GB Laptop GPU:
34  fps
79%
Arc 7-Core:
27  fps
ultra 1920x1080
100%
GeForce RTX 3050 6GB Laptop GPU:
29  fps
79%
Arc 7-Core:
23  fps
low 1920x1080
Arc 7-Core:
31  fps
med. 1920x1080
Arc 7-Core:
26.5  fps
high 1920x1080
Arc 7-Core:
17.3  fps
ultra 1920x1080
Arc 7-Core:
13.2  fps
F1 22

F1 22

2022
low 1920x1080
100%
GeForce RTX 3050 6GB Laptop GPU:
110.9 149.9 150.2 163.5 ~ 144 fps
30%
Graphics 4-Core:
39.2 39.9 41.7 43.3 43.8 43.9 44.4 44.9 46.3 46.6 ~ 43 fps
55%
Arc 7-Core:
79.4  fps
med. 1920x1080
100%
GeForce RTX 3050 6GB Laptop GPU:
106.1 138.9 145.3 151.5 ~ 135 fps
30%
Graphics 4-Core:
34.1 35.9 36.8 39.7 40.5 41 41.9 42 42 42.5 ~ 40 fps
53%
Arc 7-Core:
71.9  fps
high 1920x1080
100%
GeForce RTX 3050 6GB Laptop GPU:
85.5 102 109.5 109.7 ~ 102 fps
28%
Graphics 4-Core:
25 27.6 29.5 29.9 30.4 30.8 31 ~ 29 fps
52%
Arc 7-Core:
52.9  fps
ultra 1920x1080
100%
GeForce RTX 3050 6GB Laptop GPU:
30.7 31.6 33.6 34 ~ 32 fps
25%
Graphics 4-Core:
7 7.6 8 8 ~ 8 fps
QHD 2560x1440
100%
GeForce RTX 3050 6GB Laptop GPU:
18.1 20.1 ~ 19 fps
low 1920x1080
100%
GeForce RTX 3050 6GB Laptop GPU:
105.6 113.3 ~ 109 fps
27%
Graphics 4-Core:
24.1 26.4 27.2 27.6 29.6 29.9 30.2 30.8 32.1 ~ 29 fps
47%
Arc 7-Core:
50.7  fps
med. 1920x1080
100%
GeForce RTX 3050 6GB Laptop GPU:
84.7 89.7 ~ 87 fps
26%
Graphics 4-Core:
20.4 21.1 22.9 22.9 23.4 24 24.2 24.4 ~ 23 fps
45%
Arc 7-Core:
39.4  fps
high 1920x1080
100%
GeForce RTX 3050 6GB Laptop GPU:
55.9 59.2 ~ 58 fps
28%
Graphics 4-Core:
13.7 14.1 15.9 16.1 16.1 16.1 16.3 16.8 ~ 16 fps
46%
Arc 7-Core:
26.8  fps
ultra 1920x1080
100%
GeForce RTX 3050 6GB Laptop GPU:
44.3 46.4 ~ 45 fps
29%
Graphics 4-Core:
11.2 11.3 12.3 12.5 12.7 12.8 13.6 13.8 ~ 13 fps
50%
Arc 7-Core:
22.4  fps
low 1920x1080
100%
GeForce RTX 3050 6GB Laptop GPU:
80.8  fps
39%
Arc 7-Core:
31.6  fps
med. 1920x1080
100%
GeForce RTX 3050 6GB Laptop GPU:
64.2  fps
42%
Arc 7-Core:
27  fps
high 1920x1080
100%
GeForce RTX 3050 6GB Laptop GPU:
46.4  fps
49%
Arc 7-Core:
22.6  fps
ultra 1920x1080
100%
GeForce RTX 3050 6GB Laptop GPU:
38.5  fps
56%
Arc 7-Core:
21.6  fps
F1 2021

F1 2021

2021
low 1280x720
100%
GeForce RTX 3050 6GB Laptop GPU:
218  fps
med. 1920x1080
100%
GeForce RTX 3050 6GB Laptop GPU:
127.4  fps
high 1920x1080
100%
GeForce RTX 3050 6GB Laptop GPU:
104.8  fps
ultra 1920x1080
100%
GeForce RTX 3050 6GB Laptop GPU:
61.9  fps
QHD 2560x1440
100%
GeForce RTX 3050 6GB Laptop GPU:
40  fps
Strange Brigade

Strange Brigade

2018
low 1280x720
100%
GeForce RTX 3050 6GB Laptop GPU:
210 246 256 ~ 237 fps
42%
Graphics 4-Core:
68.6 72.8 73.2 73.7 77 78.5 78.5 80.4 85.6 93.9 107.2 109.1 111.2 111.6 113.2 115 115 117.1 118.1 118.4 120.4 121.1 123 126.5 ~ 100 fps
60%
Arc 7-Core:
133 141 148.6 149 ~ 143 fps
med. 1920x1080
100%
GeForce RTX 3050 6GB Laptop GPU:
96.5 106.9 112.8 ~ 105 fps
42%
Graphics 4-Core:
28.1 31.1 32.3 32.9 34.8 38 38 38.5 40.9 41 41.7 46 47 48.7 49.1 49.5 49.7 50 50 50.7 50.8 51.4 52.1 54.7 ~ 44 fps
63%
Arc 7-Core:
63 63.9 68 69.5 ~ 66 fps
high 1920x1080
100%
GeForce RTX 3050 6GB Laptop GPU:
80.9 88.4 91.9 ~ 87 fps
40%
Graphics 4-Core:
22.5 26.5 26.6 26.6 27.2 31.7 31.8 32.4 33.1 34.7 34.8 35.1 36.1 37 37.7 39 39.2 39.6 39.8 40 40.7 41.9 43.8 ~ 35 fps
62%
Arc 7-Core:
50 53.5 54 57.7 ~ 54 fps
ultra 1920x1080
100%
GeForce RTX 3050 6GB Laptop GPU:
70.7 77 80.5 ~ 76 fps
37%
Graphics 4-Core:
22.1 22.8 22.8 22.9 23 25.1 25.9 26.2 26.6 27.1 27.1 27.8 28.2 28.4 29.3 29.4 29.9 30.2 30.3 30.5 31.2 32 33.3 35.2 ~ 28 fps
58%
Arc 7-Core:
40 43.5 44 47.3 ~ 44 fps
QHD 2560x1440
100%
GeForce RTX 3050 6GB Laptop GPU:
57.1  fps
Far Cry 5

Far Cry 5

2018
low 1280x720
100%
GeForce RTX 3050 6GB Laptop GPU:
132 149 ~ 141 fps
30%
Graphics 4-Core:
33 38 38 40 41 41 42 43 45 46 47 48 48 50 51 ~ 43 fps
44%
Arc 7-Core:
37 64 71 74 ~ 62 fps
med. 1920x1080
100%
GeForce RTX 3050 6GB Laptop GPU:
76 85 89 ~ 83 fps
29%
Graphics 4-Core:
20 20 21 23 23 23 24 24 24 25 25 25 25 28 28 ~ 24 fps
46%
Arc 7-Core:
34 37 40 41 ~ 38 fps
high 1920x1080
100%
GeForce RTX 3050 6GB Laptop GPU:
70 78 82 ~ 77 fps
29%
Graphics 4-Core:
19 19 20 21 22 22 22 22 23 23 23 24 25 25 26 ~ 22 fps
45%
Arc 7-Core:
31 35 37 37 ~ 35 fps
ultra 1920x1080
100%
GeForce RTX 3050 6GB Laptop GPU:
65 74 76 ~ 72 fps
28%
Graphics 4-Core:
18 18 18 18 20 20 20 21 21 21 21 22 22 23 23 ~ 20 fps
47%
Arc 7-Core:
31 35 35 ~ 34 fps
QHD 2560x1440
100%
GeForce RTX 3050 6GB Laptop GPU:
52  fps
low 1280x720
100%
GeForce RTX 3050 6GB Laptop GPU:
86.7 96.3 140.6 144.7 ~ 117 fps
31%
Graphics 4-Core:
28.7 28.7 30.9 31.2 33.1 33.8 34.7 35 35.3 35.5 35.6 35.7 36.2 36.4 36.5 36.7 36.8 36.9 37.5 37.6 37.6 37.8 38.5 39.2 40 41.2 43.3 ~ 36 fps
42%
Arc 7-Core:
41 47.1 47.5 47.5 52 52.2 57 ~ 49 fps
med. 1920x1080
100%
GeForce RTX 3050 6GB Laptop GPU:
76 89.3 116.2 117 ~ 100 fps
28%
Graphics 4-Core:
21.6 21.6 24 25.2 25.9 26.1 27.3 28 28 28.1 28.2 28.2 28.3 28.3 28.4 28.9 29.2 29.3 29.7 30 30.1 30.3 30.4 30.8 31.4 31.9 33.4 ~ 28 fps
38%
Arc 7-Core:
31.4 35.9 38.3 38.5 40.1 40.3 44.8 ~ 38 fps
high 1920x1080
100%
GeForce RTX 3050 6GB Laptop GPU:
61.6 78.6 97.1 97.3 ~ 84 fps
29%
Graphics 4-Core:
19.1 19.1 20.8 21.6 21.8 22.8 23.2 23.3 23.4 23.4 23.6 23.6 23.7 23.8 24.1 24.1 24.5 24.5 24.8 25.1 25.3 25.4 25.8 26 26 27.1 28.2 ~ 24 fps
39%
Arc 7-Core:
27.8 31.3 31.5 32.9 33.4 34.2 37.3 ~ 33 fps
low 1280x720
100%
GeForce RTX 3050 6GB Laptop GPU:
111.6 126.5 128.2 128.5 ~ 124 fps
32%
Graphics 4-Core:
31.7 33.7 33.7 35 35.4 35.7 36.2 36.9 37.4 37.6 37.8 38.5 39.7 40.1 40.5 40.6 42.3 42.6 42.7 44.9 46 46.6 48.1 48.2 48.6 51.5 ~ 40 fps
46%
Arc 7-Core:
40.8 52.1 58.3 59.6 59.8 60.6 64.8 ~ 57 fps
med. 1920x1080
100%
GeForce RTX 3050 6GB Laptop GPU:
59.9 67.6 70.3 70.9 ~ 67 fps
34%
Graphics 4-Core:
17.1 19.3 19.4 19.5 19.5 19.7 19.8 20.4 20.8 22 22.2 23 23.4 23.4 23.4 23.6 24.1 24.2 24.2 24.3 24.9 25.2 25.9 26 26.4 27.4 ~ 23 fps
48%
Arc 7-Core:
21.8 32.4 32.9 33.3 33.4 35.4 35.8 ~ 32 fps
high 1920x1080
100%
GeForce RTX 3050 6GB Laptop GPU:
44.2 49.1 51.2 52 ~ 49 fps
35%
Graphics 4-Core:
12.2 14.1 14.4 14.4 14.6 14.7 14.9 15.7 16.3 16.3 16.7 16.8 16.9 17.3 17.3 17.4 17.5 17.9 18.2 18.2 18.2 18.3 18.4 18.5 18.8 19.1 ~ 17 fps
47%
Arc 7-Core:
16.1 22.2 22.3 23.4 25.3 25.3 25.3 ~ 23 fps
QHD 2560x1440
100%
GeForce RTX 3050 6GB Laptop GPU:
32 37.4 ~ 35 fps
low 1280x720
100%
GeForce RTX 3050 6GB Laptop GPU:
117.3 152.8 155.2 181.4 ~ 152 fps
58%
Graphics 4-Core:
66.1 66.1 72.6 74.1 75.2 75.4 82.6 85 89.9 90.1 90.4 90.8 91.2 91.4 91.8 92.5 92.8 92.9 93.8 94 94.4 95 95.3 96.2 99 99.4 101.9 ~ 88 fps
63%
Arc 7-Core:
90.4 93.5 93.8 94.3 95.5 97.1 97.7 ~ 95 fps
med. 1366x768
100%
GeForce RTX 3050 6GB Laptop GPU:
112.6 131 137.8 161.2 ~ 136 fps
43%
Graphics 4-Core:
38.2 38.2 43.7 44.2 48.6 52.2 52.4 52.6 53.9 54.3 54.3 54.9 55.5 57.7 58.9 59.5 59.7 60.2 60.4 60.7 66.7 66.9 67.3 69 72.2 72.7 80.9 ~ 58 fps
57%
Arc 7-Core:
64.5 70.5 77.8 79.2 83 83.1 89.2 ~ 78 fps
high 1920x1080
100%
GeForce RTX 3050 6GB Laptop GPU:
104.4 112.6 124.2 146.8 ~ 122 fps
45%
Graphics 4-Core:
37.8 44.4 44.4 44.6 47 48.4 49.7 50.2 50.7 51.4 52.8 52.9 54.5 56.1 57.2 58 59.9 60.4 61 61.1 61.2 61.6 61.6 61.6 62.2 63.3 65.6 ~ 55 fps
58%
Arc 7-Core:
59.2 66.3 68.4 73.6 75.6 75.8 75.9 ~ 71 fps
ultra 1920x1080
100%
GeForce RTX 3050 6GB Laptop GPU:
98 99.5 116.9 135.1 ~ 112 fps
46%
Graphics 4-Core:
39.9 39.9 43.9 45.5 47 47.9 48 48 49.9 50 50.7 51.3 51.8 52.4 52.7 54 54.2 54.4 56 56.6 56.9 57.3 57.3 57.6 58.3 60.4 62 ~ 52 fps
60%
Arc 7-Core:
54.5 58.7 64.9 70.5 72.9 73 73.3 ~ 67 fps
low 1024x768
100%
GeForce RTX 3050 6GB Laptop GPU:
187 236 244 ~ 222 fps
39%
Graphics 4-Core:
66.5 79.6 86.8 88.3 91 92.1 92.1 92.9 ~ 86 fps
60%
Arc 7-Core:
126 136 138 ~ 133 fps
med. 1366x768
100%
GeForce RTX 3050 6GB Laptop GPU:
118 159.1 ~ 139 fps
38%
Graphics 4-Core:
41.3 49.6 51.1 52.2 56.2 57 57 57 ~ 53 fps
60%
Arc 7-Core:
80 85 88 ~ 84 fps
high 1920x1080
100%
GeForce RTX 3050 6GB Laptop GPU:
71 91.4 96.5 ~ 86 fps
34%
Graphics 4-Core:
21.4 28 28.4 28.5 31 32.4 32.4 33.3 ~ 29 fps
57%
Arc 7-Core:
45 51 52 ~ 49 fps
ultra 1920x1080
100%
GeForce RTX 3050 6GB Laptop GPU:
43.7 50.1 52.9 ~ 49 fps
33%
Graphics 4-Core:
11.9 14.9 15 15.5 16.3 17.6 17.9 17.9 ~ 16 fps
47%
Arc 7-Core:
18.3 23.4 26 ~ 23 fps
QHD 2560x1440
100%
GeForce RTX 3050 6GB Laptop GPU:
37  fps
GTA V

GTA V

2015
low 1024x768
100%
GeForce RTX 3050 6GB Laptop GPU:
163.4 177.9 178.2 184.2 ~ 176 fps
64%
Graphics 4-Core:
69.1 75.5 94 95.3 97.9 102.8 103.9 104.8 109.9 112.1 114.3 116.5 118.1 127.4 128.9 132.5 135.5 137 139.1 142.9 ~ 113 fps
78%
Arc 7-Core:
116.9 127.2 132.4 143.6 153 156.3 ~ 138 fps
med. 1366x768
100%
GeForce RTX 3050 6GB Laptop GPU:
172 172.6 178.4 ~ 174 fps
57%
Graphics 4-Core:
68 81.9 83.6 84.8 88.8 91.1 91.7 91.9 95.7 98.1 102.7 105.5 109 109.3 110 110.4 111.7 115.9 116.9 123.9 ~ 100 fps
76%
Arc 7-Core:
106.4 119.9 125.5 143.3 148.8 151.6 ~ 133 fps
high 1920x1080
100%
GeForce RTX 3050 6GB Laptop GPU:
95.3 119.5 123.3 127.3 ~ 116 fps
19%
Graphics 4-Core:
17 17.6 19.2 19.5 19.7 19.9 20.3 20.7 21.4 21.6 21.9 22.1 22.2 23.6 24.2 24.3 24.4 25.5 25.8 26.2 ~ 22 fps
30%
Arc 7-Core:
31 32.4 33.6 34.1 38.9 39.9 ~ 35 fps
ultra 1920x1080
100%
GeForce RTX 3050 6GB Laptop GPU:
53 62.7 63.2 63.8 ~ 61 fps
15%
Graphics 4-Core:
6.9 7.1 7.6 7.7 7.9 7.9 8 8.1 8.6 8.8 8.8 8.9 8.9 9 9.5 9.5 9.6 10 10.3 10.5 ~ 9 fps
23%
Arc 7-Core:
12.7 13.7 13.7 14.8 15.3 16.6 ~ 14 fps
QHD 2560x1440
100%
GeForce RTX 3050 6GB Laptop GPU:
36.5 42.7 ~ 40 fps

Average Gaming NVIDIA GeForce RTX 3050 6GB Laptop GPU → 100%

Average Gaming 30-70 fps → 100%

Average Gaming Intel Graphics 4-Core iGPU (Arc) → 33%

Average Gaming 30-70 fps → 36%

Average Gaming Intel Arc 7-Core iGPU → 50%

Average Gaming 30-70 fps → 48%

NVIDIA GeForce RTX 3050 6GB Laptop GPUIntel Graphics 4-Core iGPU (Arc)Intel Arc 7-Core iGPU
lowmed.highultraQHD4Klowmed.highultraQHD4Klowmed.highultraQHD4K
Indiana Jones and the Great Circle7.09
Stalker 26.85.995.33
Call of Duty Black Ops 6151410
Until Dawn17.311.57.44
Final Fantasy XVI7.977.966.71
Space Marine 210.28.127.41
Star Wars Outlaws
F1 24383426865574311.4
Senua's Saga Hellblade 26.435.374.14
Ghost of Tsushima11.59.758.89
Horizon Forbidden West13.812.38
Dragon's Dogma 29.136.81
Helldivers 21612.21132.12522.721.7
Prince of Persia The Lost Crown96.448.445.7215127120
Cyberpunk 2077 2.2 Phantom Liberty6349413521.31916131229232018
Baldur's Gate 359.750.345.444.31814121232262221
F1 231321259223124239257.146357390
F1 221441351023219434029879.471.952.9
Tiny Tina's Wonderlands1098758452923161350.739.426.822.4
Strange Brigade237105877657.1100443528143665444
Far Cry 5141837772524324222062383534
X-Plane 11.1111710084362824493833
Final Fantasy XV Benchmark124674935402317573223
Dota 2 Reborn1521361221128858555295787167
The Witcher 322213986493786532916133844923
GTA V17617411661401131002291381333514
NVIDIA GeForce RTX 3050 6GB Laptop GPUIntel Graphics 4-Core iGPU (Arc)Intel Arc 7-Core iGPU
lowmed.highultraQHD4Klowmed.highultraQHD4Klowmed.highultraQHD4K
< 30 fps
< 60 fps
< 120 fps
≥ 120 fps

1
3
8

2
5
5

4
7
1
1
5
4
3
5


< 30 fps
< 60 fps
< 120 fps
≥ 120 fps
14
6
4
15
6
2
21
3

10
2


< 30 fps
< 60 fps
< 120 fps
≥ 120 fps
1
5
5
3
3
6
4
2
5
8
1
1
7
2
1
1


For more games that might be playable and a list of all games and graphics cards visit our Gaming List

v1.34
log 08. 20:06:41

#0 ran 0s before starting gpusingle class +0s ... 0s

#1 checking url part for id 11576 +0s ... 0s

#2 checking url part for id 12259 +0s ... 0s

#3 checking url part for id 12257 +0s ... 0s

#4 redirected to Ajax server, took 1759946800s time from redirect:0 +0s ... 0s

#5 did not recreate cache, as it is less than 5 days old! Created at Tue, 07 Oct 2025 05:18:57 +0200 +0s ... 0s

#6 composed specs +0.023s ... 0.024s

#7 did output specs +0s ... 0.024s

#8 start showIntegratedCPUs +0s ... 0.024s

#9 getting avg benchmarks for device 11576 +0.029s ... 0.053s

#10 got single benchmarks 11576 +0.011s ... 0.064s

#11 getting avg benchmarks for device 12259 +0.003s ... 0.067s

#12 got single benchmarks 12259 +0.03s ... 0.097s

#13 getting avg benchmarks for device 12257 +0.004s ... 0.101s

#14 got single benchmarks 12257 +0.011s ... 0.112s

#15 got avg benchmarks for devices +0s ... 0.112s

#16 min, max, avg, median took s +0.057s ... 0.169s

#17 before gaming benchmark output +0s ... 0.169s

#18 Got 1324 rows for game benchmarks. +0.085s ... 0.254s

#19 composed SQL query for gamebenchmarks +0s ... 0.254s

#20 got data and put it in $dataArray +0.006s ... 0.26s

#21 benchmarks composed for output. +0.024s ... 0.284s

#22 calculated avg scores. +0s ... 0.284s

#23 return log +0.001s ... 0.285s

Please share our article, every link counts!
Mail Logo
> Expert Reviews and News on Laptops, Smartphones and Tech Innovations > Benchmarks / Tech > Graphics Card Comparison - Head 2 Head
Redaktion, 2017-09- 8 (Update: 2023-07- 1)