Intel HD Graphics (Bay Trail) vs Intel HD Graphics (Haswell) vs Intel HD Graphics (Broadwell)
Intel HD Graphics (Bay Trail)
► remove 
The Intel HD Graphics (Bay Trail) is a low-end integrated Bay Trail graphics card found in certain Atom models (Z3770), nettops (J2850) and notebook SoCs (N3510). It supports DirectX 11 and is based on the Ivy Bridge GPU. Clock rates and shader cores, however, are considerably lower.
Compared to Ivy Bridge, which offers either 6 or 16 Execution Units, the HD Graphics (Bay Trail) comes with only 4 EUs. The core clock is significantly lower as well. Depending on the specific model, the maximum Turbo Boost is 896 MHz or less and the memory controller can support DDR3(L), DDR3L-RS or LPDDR3 in single- or dual-channel operation.
The fastest notebook models equipped with this GPU nearly match the performance of the HD Graphics (Sandy Bridge) and the AMD Radeon HD 6310. Therefore, older and less demanding Windows games like World of Warcraft or Half-Life 2 can be played fluently in very low settings. Performance is not sufficient for most modern titles.
Compared to competing ARM SoCs, Bay Trail outperforms the Adreno 320 (which can be found in different Qualcomm SoCs like the Snapdragon 600) and offers a performance similar to the Tegra 4 GPU. That is enough power to run even the most demanding Android games smoothly in very high resolutions as of 2013.
The integrated video decoder supports all popular codecs such as MPEG2, H.264, VC1, VP8 and MVC and is suitable for resolutions up to 4K up to 100 Mbit/s. The user can connect up to two displays via HDMI 1.4 (max. 1920 x 1080) or DisplayPort 1.2 (max. 2560 x 1600). Another new feature is the support for Wireless Display and Quick Sync, Intel's fast and power efficient H-264 hardware encoder. Some of these features are not available on all models.
Depending on the model, the power consumption of the entire SoC is somewhere between 2 and 10 W. The most efficient versions are therefore suitable for passively cooled tablets, whereas faster variants are used in larger subnotebooks with active cooling.
Intel HD Graphics (Haswell)
► remove 
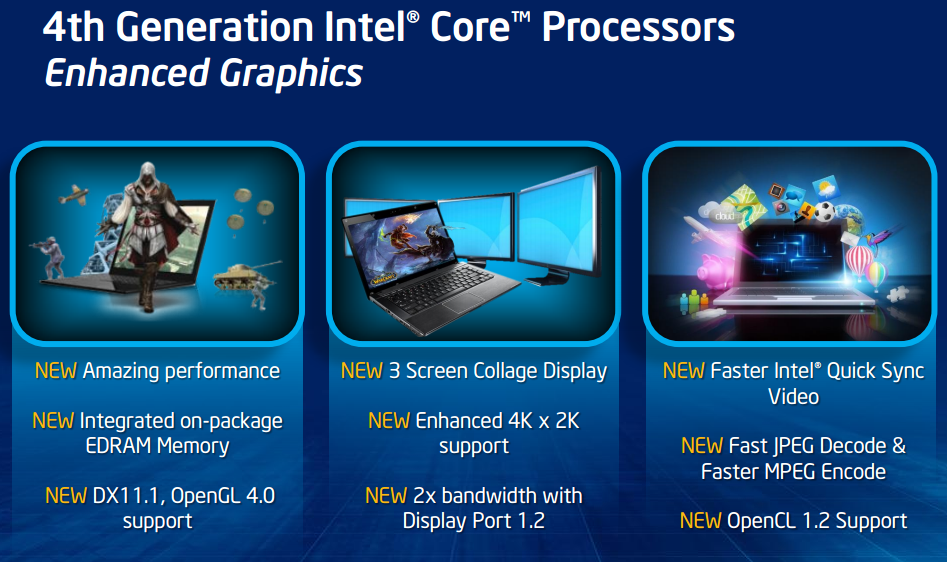
The Intel HD Graphics (Haswell) is an integrated graphics card in the Haswell codenamed processors (Celeron and Pentium). It is the successor the the Intel HD Graphics in the Ivy Bridge CPUs and performs slightly better. Depending on the processor model, the base and turbo clock rates may differ, resulting in varying graphics performance between CPU models.
In comparison to the HD 4000, the graphics core has been modified extensively. The GPU supports DirectX 11.1, OpenCL 1.2 and OpenGL 4.0. It also features an improved decoder for 4K videos and the fast Quick Sync encoder (deactivated in many entry level models).
The Performance of the HD Graphics (Haswell) is similar to the old HD Graphics 3000 or the AMD Radeon HD 8250. Only a few modern games like Dota 2 can be played fluently in very low details and resolutions.
Due to the 22nm 3D Tri-Gate production process, the power consumption should be relatively low (the development was focused on performance per Watt). The GPU can be found in ULV models and regular (37 W) dual core CPUs.
Intel HD Graphics (Broadwell)
► remove 
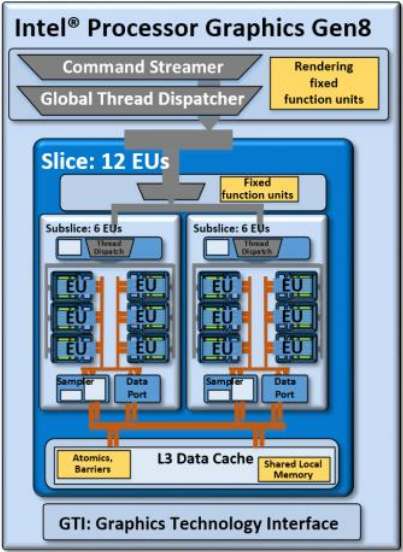
The Intel HD Graphics (Broadwell) (GT1) is an integrated Broadwell graphics card revealed in Q1 2015. It can be found in several low-end CPUs such as the Pentium 3805U or Celeron 3755U. The so-called GT1 GPU offers 12 EUs (Execution Units) and therefore somewhat more shader power than the previous HD Graphics (Haswell). The clock range may depend on the specific model it is built into.
Architecture and Features
Broadwell features a GPU based on the Intel Gen8 architecture, which has been optimized in various aspects compared to the previous Gen7.5 (Haswell). In case of the GT1 version, the shader arrays called "subslice" have been reorganized and now offer 6 Execution Units (EUs) each. Two subslices form a "slice" for a total of 12 EUs. Combined with other improvements such as larger L1 caches and an optimized frontend, the integrated GPU has become faster and more efficient than its predecessor.
The HD Graphics (Broadwell) represents the low-end version of the Broadwell GPU family and consists of one slice with 12 EUs. Beyond that, there is also a mid-range variant (GT2, 24 EUs) as well as higher-end models (GT3/GT3e + eDRAM, 48 EUs).
All Broadwell GPUs support OpenCL 2.0 and DirectX 12 (FL 11_1). The video engine can now decode H.265 using both fixed function hardware as well as available GPU shaders. Up to three displays can be connected via DP 1.2/eDP 1.3 (max. 3840 x 2160 @ 60 Hz) or HDMI 1.4a (max. 3840 x 2160 @ 24 Hz). HDMI 2.0, however, is not supported.
Performance
Even though the HD Graphics (Broadwell) is clocked a bit lower, the performance should be clearly above the HD Graphics (Haswell) and similar to the HD Graphics 4000. Nevertheless, only a few games as of 2014/2015 will run fluently at (very) low settings, e.g. Dota 2 or Sims 4.
Power Consumption
Utilizing a new 14 nm process, the HD Graphics (Broadwell) can be found in ULV models (15 W) as well as regular dual core CPUs (37 W, not yet presented). The TDP is flexible and can be further reduced, which has a significant impact on performance.
| Intel HD Graphics (Bay Trail) | Intel HD Graphics (Haswell) | Intel HD Graphics (Broadwell) |
Manufacturer | Intel | Intel | Intel |
HD Graphics Series | | | |
Codename | Bay Trail | Haswell GT1 | Broadwell GT1 |
Architecture | Ivy Bridge | Haswell | Broadwell |
| 4 - | 10 - | 12 - |
Core | 311 - 896 (Boost) MHz | 200 - 1000 (Boost) MHz | 100 - 850 (Boost) MHz |
Bus | 32/64/128 Bit | 64/128 Bit | 64/128 Bit |
| yes | yes | yes |
DirectX | DirectX 11, 5.0 | DirectX 11.1, 5.0 | DirectX 12 (FL 11_1) |
Technology | 22 nm | 22 nm | 14 nm |
Introduced | 11.09.2013 | 01.10.2012 | 05.01.2015 |
Features | QuickSync |
CPU | GPU Base Speed | GPU Boost / Turbo |
---|
Intel Pentium N3540 | 4 x 2160 MHz, 7.5 W | 313 MHz | 896 MHz |
Intel Pentium J2900 | 4 x 2410 MHz, 10 W | 688 MHz | 896 MHz |
Intel Pentium N3530 | 4 x 2160 MHz, 7.5 W | 313 MHz | 896 MHz |
» show 43 more |
Intel Pentium J2850 | 4 x 2400 MHz, 10 W | 688 MHz | 792 MHz |
Intel Pentium N3520 | 4 x 2167 MHz, 7.5 W | 313 MHz | 854 MHz |
Intel Celeron J1900 | 4 x 2000 MHz, 10 W | 688 MHz | 854 MHz |
Intel Atom Z3795 | 4 x 1590 MHz, <4 W | 311 MHz | 778 MHz |
Intel Atom Z3785 | 4 x 1490 MHz, <4 W | 313 MHz | 833 MHz |
Intel Atom Z3775 | 4 x 1460 MHz, <4 W | 311 MHz | 778 MHz |
Intel Atom Z3775D | 4 x 1490 MHz, <4 W | 311 MHz | 792 MHz |
Intel Atom Z3770 | 4 x 1460 MHz, <4 W | 311 MHz | 667 MHz |
Intel Atom Z3770D | 4 x 1500 MHz, <4 W | 313 MHz | 688 MHz |
Intel Celeron N2940 | 4 x 1830 MHz, 7.5 W | 313 MHz | 854 MHz |
Intel Celeron N2930 | 4 x 1830 MHz, 7.5 W | 313 MHz | 854 MHz |
Intel Celeron J1850 | 4 x 2000 MHz, 10 W | 688 MHz | 792 MHz |
Intel Pentium N3510 | 4 x 2000 MHz, 7.5 W | 313 MHz | 750 MHz |
Intel Celeron N2920 | 4 x 1860 MHz, 7.5 W | 313 MHz | 854 MHz |
Intel Atom E3845 | 4 x 1910 MHz, 10 W | 542 MHz | 792 MHz |
Intel Atom Z3736F | 4 x 1330 MHz, <4 W | 313 MHz | 646 MHz |
Intel Atom Z3736G | 4 x 1330 MHz, <4 W | 313 MHz | 646 MHz |
Intel Atom Z3745 | 4 x 1330 MHz, <4 W | 311 MHz | 778 MHz |
Intel Atom Z3745D | 4 x 1330 MHz, <4 W | 311 MHz | 792 MHz |
Intel Atom Z3740 | 4 x 1330 MHz, <4 W | 311 MHz | 667 MHz |
Intel Atom Z3740D | 4 x 1330 MHz, <4 W | 313 MHz | 688 MHz |
Intel Atom Z3735D | 4 x 1330 MHz, <4 W | 311 MHz | 646 MHz |
Intel Atom Z3735E | 4 x 1330 MHz, <4 W | 311 MHz | 646 MHz |
Intel Atom Z3735F | 4 x 1330 MHz, <4 W | 311 MHz | 646 MHz |
Intel Atom Z3735G | 4 x 1330 MHz, <4 W | 311 MHz | 646 MHz |
Intel Celeron J1800 | 2 x 2410 MHz, 10 W | 688 MHz | 792 MHz |
Intel Celeron N2840 | 2 x 2160 MHz, 7.5 W | 313 MHz | 792 MHz |
Intel Celeron J1750 | 2 x 2410 MHz, 10 W | 688 MHz | 750 MHz |
Intel Celeron N2910 | 4 x 1600 MHz, 7.5 W | 313 MHz | 756 MHz |
Intel Celeron N2830 | 2 x 2160 MHz, 7.5 W | 313 MHz | 750 MHz |
Intel Celeron N2820 | 2 x 2170 MHz, 7.5 W | 313 MHz | 756 MHz |
Intel Celeron N2815 | 2 x 1860 MHz, 7.5 W | 313 MHz | 756 MHz |
Intel Celeron N2810 | 2 x 2000 MHz, 7.5 W | 313 MHz | 756 MHz |
Intel Atom Z3680 | 2 x 1330 MHz, <4 W | 311 MHz | 667 MHz |
Intel Atom Z3680D | 2 x 1330 MHz, <4 W | 313 MHz | 688 MHz |
Intel Celeron N2808 | 2 x 1580 MHz, 4.3 W | 313 MHz | 792 MHz |
Intel Celeron N2807 | 2 x 1580 MHz, 4.3 W | 313 MHz | 750 MHz |
Intel Celeron N2806 | 2 x 1580 MHz, 4.5 W | 313 MHz | 756 MHz |
Intel Atom E3827 | 2 x 1750 MHz, 8 W | 542 MHz | 792 MHz |
Intel Atom E3826 | 2 x 1460 MHz, 7 W | 533 MHz | 667 MHz |
Intel Celeron N2805 | 2 x 1460 MHz, 4.3 W | 313 MHz | 667 MHz |
Intel Atom E3825 | 2 x 1330 MHz, 6 W | ? MHz | 533 MHz |
Intel Atom E3815 | 1 x 1460 MHz, 5 W | ? MHz | 400 MHz |
min. - max. | | 311 - ? MHz | 400 - 896 MHz |
3DMark - Ice Storm Unlimited Graphics Score 1280x720 offscreen

min: 11835 avg: 14513 median: 14748 (3%) max: 17613 Points
43493 Points (8%)
MSI CX61 2QC 2970M MS-16GD | 2970M | 8192 | 1100 / 800 MHz | shared | 43493 |
3DMark - Ice Storm Extreme Graphics 1920x1080
min: 4751 avg: 7342.4 median: 7498 (1%) max: 9234 Points
3DMark - Cloud Gate Standard Score 1280x720

min: 354 avg: 1181.7 median: 1188 (2%) max: 1703 Points

min: 2141 avg: 2403 median: 2335 (4%) max: 3011 Points
3398 Points (5%)
3DMark - Cloud Gate Standard Graphics 1280x720
min: 362 avg: 1230.2 median: 1228 (1%) max: 1670 Points
min: 3111 avg: 3415 median: 3278 (2%) max: 4199 Points
4015 Points (2%)
3DMark - Fire Strike Score 1920x1080
min: 83 avg: 185 median: 147 (1%) max: 495 Points
min: 300 avg: 323.8 median: 314 (1%) max: 383 Points
428 Points (2%)
3DMark - Fire Strike Graphics 1920x1080
min: 90 avg: 149.1 median: 149 (0%) max: 200 Points
min: 340 avg: 370.8 median: 362 (1%) max: 433 Points
463 Points (1%)
3DMark - Ice Storm Standard Graphics 1280x720

min: 5056 avg: 15391.1 median: 16047 (2%) max: 21351 Points
min: 29291 avg: 34138 median: 34675 (5%) max: 40515 Points
45539 Points (6%)
3DMark 11 - Performance 1280x720
min: 143 avg: 222.6 median: 216 (1%) max: 280 points

min: 435 avg: 543.3 median: 544 (2%) max: 688 points
729 points (2%)
3DMark 11 - Performance GPU 1280x720
min: 122 avg: 192.1 median: 185 (0%) max: 237 points
min: 384 avg: 479.6 median: 484 (1%) max: 602 points
641 points (1%)
3DMark Vantage
P Result 1280x1024 + Intel HD Graphics (Bay Trail) 3DMark Vantage - P Result 1280x1024
min: 507 avg: 666 median: 637 (1%) max: 846 Points
P Result 1280x1024 + Intel HD Graphics (Haswell) min: 2146 avg: 2163 median: 2163 (3%) max: 2180 Points
P Result 1280x1024 + Intel HD Graphics (Broadwell) 2651 Points (3%)
P GPU no PhysX 1280x1024 + Intel HD Graphics (Bay Trail) 3DMark Vantage - P GPU no PhysX 1280x1024
min: 395 avg: 512.2 median: 503 (1%) max: 667 Points
P GPU no PhysX 1280x1024 + Intel HD Graphics (Haswell) min: 1848 avg: 1859 median: 1859 (2%) max: 1870 Points
P GPU no PhysX 1280x1024 + Intel HD Graphics (Broadwell) 2196 Points (2%)
3DMark 2001SE - Standard 1024x768
7727 Points (8%)
3DMark 03 - Standard 1024x768

min: 4226 avg: 4997.3 median: 5220 (3%) max: 5323 Points
3DMark 05 - Standard 1024x768

min: 2666 avg: 3194.6 median: 3331 (6%) max: 3445 Points
3DMark 06 + Intel HD Graphics (Bay Trail) 3DMark 06

min: 814 avg: 1787.2 median: 1867 (4%) max: 2151 Points
Standard 1280x1024 + Intel HD Graphics (Haswell) min: 2917 avg: 3273.8 median: 3357 (7%) max: 3463 Points
Standard 1280x1024 + Intel HD Graphics (Broadwell) 5077 Points (10%)
Unigine Heaven 3.0 - DX 11, Normal Tessellation, High Shaders 1920x1080
3.6 fps (1%)
Unigine Heaven 2.1 - high, Tesselation (normal), DirectX11 1280x1024
min: 2 avg: 2.8 median: 2 (1%) max: 3 fps
10.9 fps (5%)
Windows 7 Experience Index - Gaming graphics

6.3 points (90%)
Windows 7 Experience Index - Graphics

4.7 points (67%)
Cinebench R10 Shading 32Bit + Intel HD Graphics (Bay Trail) Cinebench R10 - Shading 32Bit

min: 898 avg: 2014.2 median: 1991 (10%) max: 2889 Points
Shading 32Bit + Intel HD Graphics (Haswell) min: 3867 avg: 4235 median: 4215 (21%) max: 4642 Points
Shading 32Bit + Intel HD Graphics (Broadwell) 4886 Points (25%)
Cinebench R11.5 OpenGL 64Bit + Intel HD Graphics (Bay Trail) Cinebench R11.5 - OpenGL 64Bit
min: 0 avg: 6.2 median: 6 (4%) max: 7 Points
OpenGL 64Bit + Intel HD Graphics (Haswell) min: 9 avg: 11.4 median: 11 (6%) max: 12 Points
OpenGL 64Bit + Intel HD Graphics (Broadwell) 12.8 Points (8%)
Cinebench R15
OpenGL 64Bit + Intel HD Graphics (Bay Trail) Cinebench R15 - OpenGL 64Bit

min: 2 avg: 5.1 median: 5 (2%) max: 6 Points
OpenGL 64Bit + Intel HD Graphics (Haswell) min: 10 avg: 13.2 median: 13 (5%) max: 14 Points
OpenGL 64Bit + Intel HD Graphics (Broadwell) 17.8 Points (7%)
Ref. Match 64Bit + Intel HD Graphics (Bay Trail) Cinebench R15 - Ref. Match 64Bit

min: 63 avg: 96.1 median: 97 (97%) max: 97 Points
Ref. Match 64Bit + Intel HD Graphics (Haswell) 98 Points (98%)
Ref. Match 64Bit + Intel HD Graphics (Broadwell) 98 Points (98%)
GLBenchmark 2.5 - Egypt HD Offscreen Fixed Time 1920x1080
41 fps (7%)
 | Z3770 | | | | 41 |
GFXBench (DX / GLBenchmark) 2.7
T-Rex HD Offscreen C24Z16 1920x1080 + Intel HD Graphics (Bay Trail) GFXBench (DX / GLBenchmark) 2.7 - T-Rex HD Offscreen C24Z16 1920x1080
min: 6 avg: 15.7 median: 16 (0%) max: 20 fps
T-Rex HD Offscreen C24Z16 1920x1080 + Intel HD Graphics (Haswell)
MSI CX61 2QC 2970M MS-16GD | 2970M | 8192 | 1100 / 800 MHz | shared | 53.5 |
T-Rex HD Offscreen C24Z16 1920x1080 + Intel HD Graphics (Broadwell) T-Rex HD Onscreen C24Z16 + Intel HD Graphics (Bay Trail) GFXBench (DX / GLBenchmark) 2.7 - T-Rex HD Onscreen C24Z16
min: 11 avg: 19 median: 17 (1%) max: 27 fps
T-Rex HD Onscreen C24Z16 + Intel HD Graphics (Haswell) 59.8 fps (2%)
MSI CX61 2QC 2970M MS-16GD | 2970M | 8192 | 1100 / 800 MHz | shared | 59.8 |
T-Rex HD Onscreen C24Z16 + Intel HD Graphics (Broadwell) 50.6 fps (2%)
GFXBench 3.0 - Manhattan Offscreen OGL off screen

min: 6 avg: 9.7 median: 8 (1%) max: 16 fps
28.7 fps (5%)
MSI CX61 2QC 2970M MS-16GD | 2970M | 8192 | 1100 / 800 MHz | shared | 28.7 |
21.5 fps (4%)
GFXBench 3.0 - Manhattan Onscreen OGL on screen

min: 6 avg: 12.2 median: 8 (2%) max: 22 fps
45.8 fps (13%)
MSI CX61 2QC 2970M MS-16GD | 2970M | 8192 | 1100 / 800 MHz | shared | 45.8 |
26.6 fps (7%)
GFXBench - Car Chase Offscreen off screen
11.6 fps (3%)
MSI CX61 2QC 2970M MS-16GD | 2970M | 8192 | 1100 / 800 MHz | shared | 11.6 |
GFXBench - Car Chase Onscreen on screen

20.5 fps (8%)
MSI CX61 2QC 2970M MS-16GD | 2970M | 8192 | 1100 / 800 MHz | shared | 20.5 |
Basemark ES 2.0 - Taiji Free

min: 45 avg: 49.1 median: 49 (82%) max: 53 fps
Basemark X 1.0 - Off-Screen
10.1 fps (48%)
 | Z3770 | | | | 10.1 |
Baytrail Reference Tablet Android 4.2.2 | Z3770 | 2048 | | | 10.1 |
Basemark X 1.1 - High Quality

min: 3008 avg: 6662.7 median: 8456 (19%) max: 8524 fps
Basemark X 1.1 - Medium Quality

min: 4802 avg: 12880.2 median: 14509 (32%) max: 17701 fps

59.4 fps (89%)
LuxMark v2.0 64Bit - Room GPUs-only
min: 25 avg: 28.5 median: 27 (1%) max: 35 Samples/s
min: 77 avg: 93 median: 93 (2%) max: 109 Samples/s
Acer Aspire E1-532 | 2955U | 2048 | 200-1000 / MHz | 9.18.10.3234 | 77 |
MSI CX61 2QC 2970M MS-16GD | 2970M | 8192 | 1100 / 800 MHz | shared | 109 |
86 Samples/s (2%)
LuxMark v2.0 64Bit - Sala GPUs-only
min: 26 avg: 29 median: 29 (0%) max: 34 Samples/s
Lenovo Miix 2 8 | Z3740 | 2048 | 667 / MHz | shared memory igdumdim32 10.18.103327 / Win8 | 26 |
Baytrail Reference Tablet | Z3770 | 2048 | | 32 Bit | 27 |
Toshiba Satellite NB10t-A-101 | N2810 | 4096 | 400-756 / MHz | 10.18.10.3309 | 29 |
Intel NUC Kit DN2820FYKH | N2820 | 4096 | | | 29 |
HP Pavilion x2 10-n013dx | Z3736F | 2048 | 313 - 646 / MHz | 10.18.10.4252 | 29 |
Acer TravelMate B115-MP-C23C | N2940 | 4096 | 620-820 / MHz | 10.18.10.3408 | 34 |
min: 115 avg: 140 median: 140 (1%) max: 165 Samples/s
Acer Aspire E1-532 | 2955U | 2048 | 200-1000 / MHz | 9.18.10.3234 | 115 |
MSI CX61 2QC 2970M MS-16GD | 2970M | 8192 | 1100 / 800 MHz | shared | 165 |
182 Samples/s (2%)
ComputeMark v2.1 - Normal, Score 1024x600
min: 160 avg: 172.8 median: 174 (1%) max: 192 Points
min: 355 avg: 370 median: 370 (1%) max: 385 Points
Acer Aspire E1-532 | 2955U | 2048 | 200-1000 / MHz | 9.18.10.3234 | 355 |
MSI CX61 2QC 2970M MS-16GD | 2970M | 8192 | 1100 / 800 MHz | shared | 385 |
374 Points (1%)
PassMark PerformanceTest Mobile V1 - 2D Graphics Tests

min: 3822 avg: 4035.5 median: 3866 (18%) max: 4588 Points
PassMark PerformanceTest Mobile V1 - 3D Graphics Tests

min: 1058 avg: 1250.5 median: 1228 (19%) max: 1488 Points
Smartbench 2012 - Gaming Index

min: 2679 avg: 3413.6 median: 3385 (74%) max: 4274 points
Power Consumption - FurMark 1.19 GPU Stress Test - Power Consumption (external Monitor) 1280x720 *

43.7 Watt (10%)
MSI CX61 2QC 2970M MS-16GD | 2970M | 8192 | 1100 / 800 MHz | shared | 43.7 |
Power Consumption - The Witcher 3 Power Consumption (external Monitor) ultra 1920x1080 *

30.5 Watt (7%)
MSI CX61 2QC 2970M MS-16GD | 2970M | 8192 | 1100 / 800 MHz | shared | 30.5 |
Average Benchmarks Intel HD Graphics (Bay Trail) → 100%
Average Benchmarks Intel HD Graphics (Haswell) → 255%
Average Benchmarks Intel HD Graphics (Broadwell) → 320%
-

-
* Smaller numbers mean a higher performance
1 This benchmark is not used for the average calculation
HD Graphics (Haswell):
0 (!) [X] MSI CX61 2QC 2970M MS-16GDIntel Celeron 2970M 2.2GHz
HD Graphics (Haswell)
Problem during benchmarking occured: game wont start fps
HD Graphics (Haswell):
4.9 (!) [X] MSI CX61 2QC 2970M MS-16GDIntel Celeron 2970M 2.2GHz
HD Graphics (Haswell)
Problem during benchmarking occured: small graphical problems min:
1 fps, max:
7 fps
fps
HD Graphics (Haswell):
»
HD Graphics (Haswell):
14.3 [X] MSI CX61 2QC 2970M MS-16GDIntel Celeron 2970M 2.2GHz
HD Graphics (Haswell)
fps
HD Graphics (Haswell):
8 [X] MSI CX61 2QC 2970M MS-16GDIntel Celeron 2970M 2.2GHz
HD Graphics (Haswell)
fps
HD Graphics (Haswell):
»
HD Graphics (Haswell):
5.9 [X] MSI CX61 2QC 2970M MS-16GDIntel Celeron 2970M 2.2GHz
HD Graphics (Haswell)
min:
5 fps, max:
7 fps
fps
HD Graphics (Haswell):
»
HD Graphics (Haswell):
13 [X] MSI CX61 2QC 2970M MS-16GDIntel Celeron 2970M 2.2GHz
HD Graphics (Haswell)
min:
7 fps, max:
13 fps
fps
HD Graphics (Haswell):
»
100%
HD Graphics (Bay Trail):
26.7 [X] Intel NUC Kit DN2820FYKHIntel Celeron N2820 2.2GHz
HD Graphics (Bay Trail)
min:
23 fps
fps
232%
HD Graphics (Haswell):
62 [X] MSI CX61 2QC 2970M MS-16GDIntel Celeron 2970M 2.2GHz
HD Graphics (Haswell)
min:
54 fps
fps
100%
HD Graphics (Bay Trail):
23.4 [X] Intel NUC Kit DN2820FYKHIntel Celeron N2820 2.2GHz
HD Graphics (Bay Trail)
min:
21 fps
fps
122%
HD Graphics (Haswell):
28.6 [X] MSI CX61 2QC 2970M MS-16GDIntel Celeron 2970M 2.2GHz
HD Graphics (Haswell)
min:
19 fps
fps
HD Graphics (Bay Trail):
»
HD Graphics (Haswell):
»
100%
HD Graphics (Bay Trail):
6 [X] Intel NUC Kit DN2820FYKHIntel Celeron N2820 2.2GHz
HD Graphics (Bay Trail)
fps
273%
HD Graphics (Haswell):
16.4 [X] MSI CX61 2QC 2970M MS-16GDIntel Celeron 2970M 2.2GHz
HD Graphics (Haswell)
min:
14 fps, max:
19 fps
fps
HD Graphics (Bay Trail):
»
HD Graphics (Haswell):
»
100%
HD Graphics (Bay Trail):
12.6 [X] Intel NUC Kit DN2820FYKHIntel Celeron N2820 2.2GHz
HD Graphics (Bay Trail)
min:
7 fps, max:
15 fps
fps
358%
HD Graphics (Haswell):
45.1 [X] MSI CX61 2QC 2970M MS-16GDIntel Celeron 2970M 2.2GHz
HD Graphics (Haswell)
min:
37 fps, max:
54 fps
fps
HD Graphics (Haswell):
15.9 [X] MSI CX61 2QC 2970M MS-16GDIntel Celeron 2970M 2.2GHz
HD Graphics (Haswell)
min:
13 fps, max:
19 fps
fps
HD Graphics (Bay Trail):
»
HD Graphics (Haswell):
»
HD Graphics (Haswell):
0 (!) [X] MSI CX61 2QC 2970M MS-16GDIntel Celeron 2970M 2.2GHz
HD Graphics (Haswell)
Problem during benchmarking occured: game wont start fps
HD Graphics (Haswell):
17.8 [X] MSI CX61 2QC 2970M MS-16GDIntel Celeron 2970M 2.2GHz
HD Graphics (Haswell)
min:
15 fps, max:
21 fps
fps
HD Graphics (Haswell):
»
HD Graphics (Haswell):
38.6 [X] MSI CX61 2QC 2970M MS-16GDIntel Celeron 2970M 2.2GHz
HD Graphics (Haswell)
min:
35 fps, max:
52 fps
fps
HD Graphics (Haswell):
21.6 [X] MSI CX61 2QC 2970M MS-16GDIntel Celeron 2970M 2.2GHz
HD Graphics (Haswell)
min:
19 fps, max:
28 fps
fps
HD Graphics (Haswell):
6.3 [X] MSI CX61 2QC 2970M MS-16GDIntel Celeron 2970M 2.2GHz
HD Graphics (Haswell)
min:
5 fps, max:
8 fps
fps
HD Graphics (Haswell):
»
HD Graphics (Haswell):
14.1 [X] MSI CX61 2QC 2970M MS-16GDIntel Celeron 2970M 2.2GHz
HD Graphics (Haswell)
min:
12 fps, max:
15 fps
fps
HD Graphics (Haswell):
»
HD Graphics (Haswell):
12.4 [X] MSI CX61 2QC 2970M MS-16GDIntel Celeron 2970M 2.2GHz
HD Graphics (Haswell)
min:
11 fps, max:
14 fps
fps
HD Graphics (Haswell):
7.1 [X] MSI CX61 2QC 2970M MS-16GDIntel Celeron 2970M 2.2GHz
HD Graphics (Haswell)
min:
6 fps, max:
8 fps
fps
HD Graphics (Haswell):
»
HD Graphics (Haswell):
26.1 [X] MSI CX61 2QC 2970M MS-16GDIntel Celeron 2970M 2.2GHz
HD Graphics (Haswell)
min:
19 fps, max:
33 fps
fps
HD Graphics (Haswell):
16.3 [X] MSI CX61 2QC 2970M MS-16GDIntel Celeron 2970M 2.2GHz
HD Graphics (Haswell)
min:
12 fps, max:
21 fps
fps
HD Graphics (Haswell):
»
HD Graphics (Haswell):
0 (!) [X] MSI CX61 2QC 2970M MS-16GDIntel Celeron 2970M 2.2GHz
HD Graphics (Haswell)
Problem during benchmarking occured: game wont start fps
HD Graphics (Haswell):
6 [X] MSI CX61 2QC 2970M MS-16GDIntel Celeron 2970M 2.2GHz
HD Graphics (Haswell)
min:
3 fps, max:
9 fps
fps
HD Graphics (Haswell):
»
HD Graphics (Haswell):
8.5 [X] MSI CX61 2QC 2970M MS-16GDIntel Celeron 2970M 2.2GHz
HD Graphics (Haswell)
min:
6 fps, max:
11 fps
fps
HD Graphics (Haswell):
»
HD Graphics (Haswell):
9 [X] MSI CX61 2QC 2970M MS-16GDIntel Celeron 2970M 2.2GHz
HD Graphics (Haswell)
min:
8 fps, max:
11 fps
fps
HD Graphics (Haswell):
»
HD Graphics (Haswell):
9.4 [X] MSI CX61 2QC 2970M MS-16GDIntel Celeron 2970M 2.2GHz
HD Graphics (Haswell)
min:
8 fps, max:
11 fps
fps
HD Graphics (Haswell):
5.3 [X] MSI CX61 2QC 2970M MS-16GDIntel Celeron 2970M 2.2GHz
HD Graphics (Haswell)
fps
HD Graphics (Haswell):
2.5 [X] MSI CX61 2QC 2970M MS-16GDIntel Celeron 2970M 2.2GHz
HD Graphics (Haswell)
fps
HD Graphics (Haswell):
1.8 [X] MSI CX61 2QC 2970M MS-16GDIntel Celeron 2970M 2.2GHz
HD Graphics (Haswell)
fps
HD Graphics (Haswell):
»
HD Graphics (Haswell):
13.7 [X] MSI CX61 2QC 2970M MS-16GDIntel Celeron 2970M 2.2GHz
HD Graphics (Haswell)
min:
5 fps, max:
75 fps
fps
HD Graphics (Haswell):
8.9 [X] MSI CX61 2QC 2970M MS-16GDIntel Celeron 2970M 2.2GHz
HD Graphics (Haswell)
min:
4 fps, max:
65 fps
fps
HD Graphics (Haswell):
»
HD Graphics (Haswell):
11.7 [X] MSI CX61 2QC 2970M MS-16GDIntel Celeron 2970M 2.2GHz
HD Graphics (Haswell)
min:
10 fps, max:
14 fps
fps
HD Graphics (Haswell):
»
HD Graphics (Haswell):
0 (!) [X] MSI CX61 2QC 2970M MS-16GDIntel Celeron 2970M 2.2GHz
HD Graphics (Haswell)
Problem during benchmarking occured: game wont start Black screen: dual core fps
HD Graphics (Broadwell):
15.3 fps
HD Graphics (Broadwell):
8.5 fps
HD Graphics (Broadwell):
»
HD Graphics (Bay Trail):
0 (!) [X] Intel NUC Kit DN2820FYKHIntel Celeron N2820 2.2GHz
HD Graphics (Bay Trail)
Problem during benchmarking occured: game wont start fps
HD Graphics (Broadwell):
38.1 fps
HD Graphics (Broadwell):
20.6 fps
HD Graphics (Broadwell):
»
100%
HD Graphics (Bay Trail):
12.1 [X] Intel NUC Kit DN2820FYKHIntel Celeron N2820 2.2GHz
HD Graphics (Bay Trail)
min:
5 fps, max:
18 fps
fps
342%
HD Graphics (Haswell):
41.4 [X] MSI CX61 2QC 2970M MS-16GDIntel Celeron 2970M 2.2GHz
HD Graphics (Haswell)
min:
21 fps, max:
51 fps
fps
240%
HD Graphics (Broadwell):
29 fps
HD Graphics (Haswell):
24.1 [X] MSI CX61 2QC 2970M MS-16GDIntel Celeron 2970M 2.2GHz
HD Graphics (Haswell)
min:
11 fps, max:
35 fps
fps
HD Graphics (Broadwell):
20.8 fps
HD Graphics (Haswell):
11.4 [X] MSI CX61 2QC 2970M MS-16GDIntel Celeron 2970M 2.2GHz
HD Graphics (Haswell)
min:
5 fps, max:
18 fps
fps
HD Graphics (Bay Trail):
»
HD Graphics (Haswell):
»
HD Graphics (Broadwell):
»
100%
HD Graphics (Bay Trail):
10.8 [X] Intel NUC Kit DN2820FYKHIntel Celeron N2820 2.2GHz
HD Graphics (Bay Trail)
min:
10 fps, max:
12 fps
fps
HD Graphics (Bay Trail):
»
100%
HD Graphics (Bay Trail):
24.7 fps [X] Intel NUC Kit DN2820FYKHIntel Celeron N2820 2.2GHz
HD Graphics (Bay Trail)
min:
22.2 fps
fps
100%
HD Graphics (Bay Trail):
9.7 fps [X] Intel NUC Kit DN2820FYKHIntel Celeron N2820 2.2GHz
HD Graphics (Bay Trail)
min:
8.8 fps
fps
100%
HD Graphics (Bay Trail):
5.5 fps [X] Intel NUC Kit DN2820FYKHIntel Celeron N2820 2.2GHz
HD Graphics (Bay Trail)
min:
-1.4 fps
fps
100%
HD Graphics (Bay Trail):
5.4 fps [X] Intel NUC Kit DN2820FYKHIntel Celeron N2820 2.2GHz
HD Graphics (Bay Trail)
min:
-3 fps
fps
HD Graphics (Bay Trail):
»
HD Graphics (Haswell):
8.9 [X] MSI CX61 2QC 2970M MS-16GDIntel Celeron 2970M 2.2GHz
HD Graphics (Haswell)
min:
5 fps, max:
12 fps
fps
HD Graphics (Haswell):
5.2 [X] MSI CX61 2QC 2970M MS-16GDIntel Celeron 2970M 2.2GHz
HD Graphics (Haswell)
min:
3 fps, max:
8 fps
5.8 ~ 6 fps
HD Graphics (Haswell):
3.1 fps
HD Graphics (Haswell):
»
100%
HD Graphics (Bay Trail):
22 [X] Intel NUC Kit DN2820FYKHIntel Celeron N2820 2.2GHz
HD Graphics (Bay Trail)
min:
16 fps, max:
33 fps
24.2 ~ 23 fps
228%
HD Graphics (Haswell):
52.4 fps
217%
HD Graphics (Broadwell):
50 fps
100%
HD Graphics (Bay Trail):
0 (!) [X] Intel NUC Kit DN2820FYKHIntel Celeron N2820 2.2GHz
HD Graphics (Bay Trail)
Problem during benchmarking occured: game wont start benchmark quits 12.5 ~ 6 fps
213%
HD Graphics (Haswell):
12.8 fps
225%
HD Graphics (Broadwell):
13.5 fps
HD Graphics (Bay Trail):
»
HD Graphics (Haswell):
»
HD Graphics (Broadwell):
»
100%
HD Graphics (Bay Trail):
7.3 fps
218%
HD Graphics (Haswell):
15.9 fps
327%
HD Graphics (Broadwell):
23.9 fps
100%
HD Graphics (Bay Trail):
5.1 fps
220%
HD Graphics (Haswell):
11.2 fps
322%
HD Graphics (Broadwell):
16.4 fps
HD Graphics (Bay Trail):
»
HD Graphics (Haswell):
»
HD Graphics (Broadwell):
»
100%
HD Graphics (Bay Trail):
3.2 fps
241%
HD Graphics (Haswell):
7.7 fps
100%
HD Graphics (Bay Trail):
1.7 fps
335%
HD Graphics (Haswell):
5.7 fps
HD Graphics (Bay Trail):
»
HD Graphics (Haswell):
»
100%
HD Graphics (Bay Trail):
8.1 fps
120%
HD Graphics (Haswell):
9.7 fps
100%
HD Graphics (Bay Trail):
4.7 fps
179%
HD Graphics (Haswell):
8.4 fps
HD Graphics (Bay Trail):
»
HD Graphics (Haswell):
»
100%
HD Graphics (Bay Trail):
7 fps
156%
HD Graphics (Haswell):
10.9 fps
199%
HD Graphics (Broadwell):
13.9 fps
100%
HD Graphics (Bay Trail):
4.6 fps
152%
HD Graphics (Haswell):
7 fps
204%
HD Graphics (Broadwell):
9.4 fps
HD Graphics (Bay Trail):
»
HD Graphics (Haswell):
»
HD Graphics (Broadwell):
»
100%
HD Graphics (Bay Trail):
5.6 fps
100%
HD Graphics (Bay Trail):
3.8 fps
HD Graphics (Bay Trail):
»
100%
HD Graphics (Bay Trail):
4.3 fps
100%
HD Graphics (Bay Trail):
2.4 fps
HD Graphics (Bay Trail):
»
100%
HD Graphics (Bay Trail):
9.6 11.5 ~ 11 fps
100%
HD Graphics (Bay Trail):
4.3 fps
HD Graphics (Bay Trail):
»
100%
HD Graphics (Bay Trail):
12 14 ~ 13 fps
238%
HD Graphics (Haswell):
31 fps
262%
HD Graphics (Broadwell):
34 fps
100%
HD Graphics (Bay Trail):
12 fps
167%
HD Graphics (Haswell):
20 fps
200%
HD Graphics (Broadwell):
24 fps
HD Graphics (Bay Trail):
»
HD Graphics (Haswell):
»
HD Graphics (Broadwell):
»
100%
HD Graphics (Bay Trail):
5.2 fps
100%
HD Graphics (Bay Trail):
3.6 fps
HD Graphics (Bay Trail):
»
100%
HD Graphics (Bay Trail):
3.7 fps
243%
HD Graphics (Haswell):
9 fps
100%
HD Graphics (Bay Trail):
2.5 fps
232%
HD Graphics (Haswell):
5.8 fps
HD Graphics (Bay Trail):
»
HD Graphics (Haswell):
»
100%
HD Graphics (Bay Trail):
9.1 fps
237%
HD Graphics (Haswell):
21.6 fps
100%
HD Graphics (Bay Trail):
5.1 fps
253%
HD Graphics (Haswell):
12.9 fps
HD Graphics (Bay Trail):
»
HD Graphics (Haswell):
»
100%
HD Graphics (Bay Trail):
8.5 fps
159%
HD Graphics (Haswell):
13.5 fps
100%
HD Graphics (Bay Trail):
6.1 fps
136%
HD Graphics (Haswell):
8.3 fps
HD Graphics (Bay Trail):
»
HD Graphics (Haswell):
»
100%
HD Graphics (Bay Trail):
12.4 fps
132%
HD Graphics (Haswell):
16.4 fps
100%
HD Graphics (Bay Trail):
8.5 fps
133%
HD Graphics (Haswell):
11.3 fps
HD Graphics (Bay Trail):
»
HD Graphics (Haswell):
»
100%
HD Graphics (Bay Trail):
53.7 56 ~ 55 fps
225%
HD Graphics (Haswell):
123.6 fps
207%
HD Graphics (Broadwell):
113.6 fps
100%
HD Graphics (Bay Trail):
6.6 7 ~ 7 fps
374%
HD Graphics (Haswell):
26.2 fps
376%
HD Graphics (Broadwell):
26.3 fps
HD Graphics (Bay Trail):
»
HD Graphics (Haswell):
»
HD Graphics (Broadwell):
»
100%
HD Graphics (Bay Trail):
8.4 fps
158%
HD Graphics (Haswell):
13.3 fps
100%
HD Graphics (Bay Trail):
5.9 fps
164%
HD Graphics (Haswell):
9.7 fps
HD Graphics (Bay Trail):
»
HD Graphics (Haswell):
»
100%
HD Graphics (Bay Trail):
31.6 41.8 ~ 37 fps
157%
HD Graphics (Haswell):
58.2 fps
156%
HD Graphics (Broadwell):
57.6 fps
100%
HD Graphics (Bay Trail):
12.5 12.5 ~ 13 fps
151%
HD Graphics (Haswell):
19.6 fps
174%
HD Graphics (Broadwell):
22.6 fps
HD Graphics (Bay Trail):
»
HD Graphics (Haswell):
»
HD Graphics (Broadwell):
»
100%
HD Graphics (Bay Trail):
8.3 fps
27%
HD Graphics (Haswell):
2.2 fps
100%
HD Graphics (Bay Trail):
4.6 fps
HD Graphics (Bay Trail):
»
HD Graphics (Haswell):
»
100%
HD Graphics (Bay Trail):
11.1 fps
179%
HD Graphics (Haswell):
19.9 fps
100%
HD Graphics (Bay Trail):
9.6 fps
146%
HD Graphics (Haswell):
14 fps
HD Graphics (Bay Trail):
»
HD Graphics (Haswell):
»
100%
HD Graphics (Bay Trail):
25.2 fps
140%
HD Graphics (Haswell):
35.2 fps
100%
HD Graphics (Bay Trail):
9.2 fps
148%
HD Graphics (Haswell):
13.6 fps
HD Graphics (Haswell):
9 fps
HD Graphics (Bay Trail):
»
HD Graphics (Haswell):
»
HD Graphics (Haswell):
23.1 fps
HD Graphics (Haswell):
13.7 fps
HD Graphics (Haswell):
»
100%
HD Graphics (Bay Trail):
3.1 [X] Medion Akoya S6213T MD98716Intel Pentium N3530 2.2GHz
HD Graphics (Bay Trail)
5.1 ~ 4 fps
253%
HD Graphics (Haswell):
10.1 fps
100%
HD Graphics (Bay Trail):
3.3 fps
173%
HD Graphics (Haswell):
5.7 fps
HD Graphics (Bay Trail):
»
HD Graphics (Haswell):
»
100%
HD Graphics (Bay Trail):
8.7 fps
100%
HD Graphics (Bay Trail):
5.8 fps
HD Graphics (Bay Trail):
»
100%
HD Graphics (Bay Trail):
12.8 fps
173%
HD Graphics (Haswell):
22.1 fps
100%
HD Graphics (Bay Trail):
6 fps
217%
HD Graphics (Haswell):
13 fps
HD Graphics (Bay Trail):
»
HD Graphics (Haswell):
»
HD Graphics (Haswell):
11.1 fps
HD Graphics (Haswell):
»
100%
HD Graphics (Bay Trail):
7.3 fps
274%
HD Graphics (Haswell):
12.8 27.8 [X] MSI CX61 2QC 2970M MS-16GDIntel Celeron 2970M 2.2GHz
HD Graphics (Haswell)
~ 20 fps
HD Graphics (Haswell):
10 18.2 [X] MSI CX61 2QC 2970M MS-16GDIntel Celeron 2970M 2.2GHz
HD Graphics (Haswell)
~ 14 fps
HD Graphics (Haswell):
11.8 [X] MSI CX61 2QC 2970M MS-16GDIntel Celeron 2970M 2.2GHz
HD Graphics (Haswell)
fps
HD Graphics (Haswell):
3.9 [X] MSI CX61 2QC 2970M MS-16GDIntel Celeron 2970M 2.2GHz
HD Graphics (Haswell)
fps
HD Graphics (Bay Trail):
»
HD Graphics (Haswell):
»
100%
HD Graphics (Bay Trail):
14 fps
150%
HD Graphics (Haswell):
21 fps
100%
HD Graphics (Bay Trail):
8 fps
150%
HD Graphics (Haswell):
12 fps
HD Graphics (Bay Trail):
»
HD Graphics (Haswell):
»
100%
HD Graphics (Bay Trail):
12 fps
225%
HD Graphics (Haswell):
27 fps
HD Graphics (Haswell):
18 fps
HD Graphics (Haswell):
14 fps
HD Graphics (Bay Trail):
»
HD Graphics (Haswell):
»
100%
HD Graphics (Bay Trail):
12.6 18.7 19.9 29.8 33.6 60 [X] Medion Akoya P2211T MD98602Intel Celeron N2910 1.6GHz
HD Graphics (Bay Trail)
~ 29 fps
100%
HD Graphics (Bay Trail):
10.5 19.5 33 [X] Medion Akoya P2211T MD98602Intel Celeron N2910 1.6GHz
HD Graphics (Bay Trail)
~ 21 fps
275%
HD Graphics (Haswell):
57.7 fps
100%
HD Graphics (Bay Trail):
7.8 12.8 22 [X] Medion Akoya P2211T MD98602Intel Celeron N2910 1.6GHz
HD Graphics (Bay Trail)
~ 14 fps
264%
HD Graphics (Haswell):
37 fps
HD Graphics (Bay Trail):
»
HD Graphics (Haswell):
»
100%
HD Graphics (Bay Trail):
7.7 fps
291%
HD Graphics (Haswell):
22.4 fps
HD Graphics (Haswell):
16.9 fps
HD Graphics (Bay Trail):
»
HD Graphics (Haswell):
»
100%
HD Graphics (Bay Trail):
6.3 fps
222%
HD Graphics (Haswell):
14 fps
HD Graphics (Haswell):
7.8 fps
HD Graphics (Bay Trail):
»
HD Graphics (Haswell):
»
100%
HD Graphics (Bay Trail):
10.2 fps
156%
HD Graphics (Haswell):
15.9 fps
100%
HD Graphics (Bay Trail):
6.1 fps
146%
HD Graphics (Haswell):
8.9 fps
HD Graphics (Bay Trail):
»
HD Graphics (Haswell):
»
100%
HD Graphics (Bay Trail):
11 fps
129%
HD Graphics (Haswell):
14.2 fps
100%
HD Graphics (Bay Trail):
7.8 fps
147%
HD Graphics (Haswell):
11.5 fps
HD Graphics (Bay Trail):
»
HD Graphics (Haswell):
»
100%
HD Graphics (Bay Trail):
18.2 [X] Medion Akoya P2211T MD98602Intel Celeron N2910 1.6GHz
HD Graphics (Bay Trail)
20.8 28.4 31.9 [X] Asus Transformer Book T200TA PLIntel Atom Z3775 1.5GHz
HD Graphics (Bay Trail)
~ 25 fps
148%
HD Graphics (Haswell):
36.9 fps
100%
HD Graphics (Bay Trail):
9.5 [X] Medion Akoya P2211T MD98602Intel Celeron N2910 1.6GHz
HD Graphics (Bay Trail)
10.4 13.7 19.4 [X] Asus Transformer Book T200TA PLIntel Atom Z3775 1.5GHz
HD Graphics (Bay Trail)
~ 13 fps
186%
HD Graphics (Haswell):
24.2 fps
HD Graphics (Bay Trail):
»
HD Graphics (Haswell):
»
100%
HD Graphics (Bay Trail):
4.4 [X] Medion Akoya E6239TIntel Pentium N3510 2GHz
HD Graphics (Bay Trail)
fps
164%
HD Graphics (Haswell):
7.2 fps
HD Graphics (Bay Trail):
»
HD Graphics (Haswell):
»
100%
HD Graphics (Bay Trail):
14.1 16.2 17.9 20.4 [X] Medion Akoya E6239TIntel Pentium N3510 2GHz
HD Graphics (Bay Trail)
23.2 ~ 18 fps
211%
HD Graphics (Haswell):
38 38.5 ~ 38 fps
100%
HD Graphics (Bay Trail):
12.5 12.6 [X] Medion Akoya E6239TIntel Pentium N3510 2GHz
HD Graphics (Bay Trail)
~ 13 fps
146%
HD Graphics (Haswell):
18.6 19.6 ~ 19 fps
HD Graphics (Haswell):
13.2 fps
HD Graphics (Bay Trail):
»
HD Graphics (Haswell):
»
100%
HD Graphics (Bay Trail):
5 fps
224%
HD Graphics (Haswell):
11.2 fps
274%
HD Graphics (Broadwell):
13.7 fps
HD Graphics (Broadwell):
10.7 fps
HD Graphics (Broadwell):
7 fps
HD Graphics (Bay Trail):
»
HD Graphics (Haswell):
»
HD Graphics (Broadwell):
»
233%
HD Graphics (Haswell):
23 32.8 [X] MSI CX61 2QC 2970M MS-16GDIntel Celeron 2970M 2.2GHz
HD Graphics (Haswell)
~ 28 fps
211%
HD Graphics (Broadwell):
25.3 fps
200%
HD Graphics (Haswell):
10.3 14.2 [X] MSI CX61 2QC 2970M MS-16GDIntel Celeron 2970M 2.2GHz
HD Graphics (Haswell)
~ 12 fps
235%
HD Graphics (Broadwell):
14.1 fps
238%
HD Graphics (Haswell):
11.9 [X] MSI CX61 2QC 2970M MS-16GDIntel Celeron 2970M 2.2GHz
HD Graphics (Haswell)
fps
234%
HD Graphics (Broadwell):
11.7 fps
100%
HD Graphics (Bay Trail):
1.2 fps
308%
HD Graphics (Haswell):
3.7 [X] MSI CX61 2QC 2970M MS-16GDIntel Celeron 2970M 2.2GHz
HD Graphics (Haswell)
fps
HD Graphics (Bay Trail):
»
HD Graphics (Haswell):
»
HD Graphics (Broadwell):
»
100%
HD Graphics (Bay Trail):
39 56.2 69 [X] Baytrail Reference TabletIntel Atom Z3770 1.5GHz
HD Graphics (Bay Trail)
~ 55 fps
175%
HD Graphics (Haswell):
96.5 fps
100%
HD Graphics (Bay Trail):
12.3 12.8 14 [X] Baytrail Reference TabletIntel Atom Z3770 1.5GHz
HD Graphics (Bay Trail)
min:
8 fps
~ 13 fps
218%
HD Graphics (Haswell):
28.3 fps
HD Graphics (Haswell):
15 fps
HD Graphics (Bay Trail):
»
HD Graphics (Haswell):
»
HD Graphics (Haswell):
59.6 fps
HD Graphics (Haswell):
11.2 fps
HD Graphics (Haswell):
»
248%
HD Graphics (Broadwell):
34.7 fps
253%
HD Graphics (Broadwell):
17.7 fps
234%
HD Graphics (Broadwell):
11.7 fps
100%
HD Graphics (Bay Trail):
0.3 fps
HD Graphics (Bay Trail):
»
HD Graphics (Haswell):
»
HD Graphics (Broadwell):
»
HD Graphics (Haswell):
12.2 fps
HD Graphics (Haswell):
7.6 fps
HD Graphics (Haswell):
»
100%
HD Graphics (Bay Trail):
15.1 23.6 ~ 19 fps
204%
HD Graphics (Haswell):
38.7 fps
100%
HD Graphics (Bay Trail):
5.2 9.7 ~ 7 fps
253%
HD Graphics (Haswell):
17.7 fps
HD Graphics (Haswell):
13.1 fps
HD Graphics (Bay Trail):
»
HD Graphics (Haswell):
»
100%
HD Graphics (Bay Trail):
10.3 fps
182%
HD Graphics (Haswell):
18.7 fps
100%
HD Graphics (Bay Trail):
6.2 fps
184%
HD Graphics (Haswell):
11.4 fps
HD Graphics (Bay Trail):
»
HD Graphics (Haswell):
»
100%
HD Graphics (Bay Trail):
10.1 fps
122%
HD Graphics (Haswell):
12.3 fps
154%
HD Graphics (Broadwell):
15.6 fps
100%
HD Graphics (Bay Trail):
6 fps
165%
HD Graphics (Haswell):
9.9 fps
190%
HD Graphics (Broadwell):
11.4 fps
HD Graphics (Broadwell):
5.3 fps
HD Graphics (Bay Trail):
»
HD Graphics (Haswell):
»
HD Graphics (Broadwell):
»
100%
HD Graphics (Bay Trail):
12.4 fps
206%
HD Graphics (Haswell):
25.6 fps
100%
HD Graphics (Bay Trail):
7.3 fps
241%
HD Graphics (Haswell):
17.6 fps
HD Graphics (Bay Trail):
»
HD Graphics (Haswell):
»
100%
HD Graphics (Bay Trail):
12.5 14.3 ~ 13 fps
172%
HD Graphics (Haswell):
22.3 fps
100%
HD Graphics (Bay Trail):
9.8 11.2 ~ 11 fps
153%
HD Graphics (Haswell):
16.8 fps
HD Graphics (Bay Trail):
»
HD Graphics (Haswell):
»
100%
HD Graphics (Bay Trail):
42 fps
HD Graphics (Bay Trail):
»
100%
HD Graphics (Bay Trail):
26.1 [X] Intel NUC Kit DN2820FYKHIntel Celeron N2820 2.2GHz
HD Graphics (Bay Trail)
min:
16 fps, max:
38 fps
46.6 ~ 36 fps
128%
HD Graphics (Haswell):
46.2 fps
121%
HD Graphics (Broadwell):
43.7 fps
100%
HD Graphics (Bay Trail):
20 [X] Intel NUC Kit DN2820FYKHIntel Celeron N2820 2.2GHz
HD Graphics (Bay Trail)
min:
13 fps, max:
29 fps
23.9 ~ 22 fps
158%
HD Graphics (Haswell):
34.7 fps
143%
HD Graphics (Broadwell):
31.5 fps
HD Graphics (Haswell):
22.5 fps
HD Graphics (Broadwell):
23.9 fps
HD Graphics (Bay Trail):
»
HD Graphics (Haswell):
»
HD Graphics (Broadwell):
»
100%
HD Graphics (Bay Trail):
12.9 13.2 ~ 13 fps
100%
HD Graphics (Bay Trail):
7.5 8.1 ~ 8 fps
HD Graphics (Bay Trail):
»
100%
HD Graphics (Bay Trail):
28 fps
111%
HD Graphics (Haswell):
31 fps
HD Graphics (Haswell):
18.8 fps
HD Graphics (Haswell):
11.7 fps
HD Graphics (Bay Trail):
»
HD Graphics (Haswell):
»
100%
HD Graphics (Bay Trail):
9.2 10.7 14.8 15.6 16.5 [X] Medion Akoya P2214T MD 99430Intel Celeron N2940 1.8GHz
HD Graphics (Bay Trail)
18.4 19.3 [X] Intel NUC Kit DN2820FYKHIntel Celeron N2820 2.2GHz
HD Graphics (Bay Trail)
min:
14 fps, max:
23 fps
~ 15 fps
246%
HD Graphics (Haswell):
36.9 fps
256%
HD Graphics (Broadwell):
38.4 fps
100%
HD Graphics (Bay Trail):
6 9.5 [X] Medion Akoya P2214T MD 99430Intel Celeron N2940 1.8GHz
HD Graphics (Bay Trail)
10.3 11.4 12 ~ 10 fps
230%
HD Graphics (Haswell):
23 fps
249%
HD Graphics (Broadwell):
24.9 fps
100%
HD Graphics (Bay Trail):
7.9 [X] Medion Akoya P2214T MD 99430Intel Celeron N2940 1.8GHz
HD Graphics (Bay Trail)
9.6 ~ 9 fps
217%
HD Graphics (Haswell):
19.5 fps
219%
HD Graphics (Broadwell):
19.7 fps
100%
HD Graphics (Bay Trail):
5 [X] Medion Akoya P2214T MD 99430Intel Celeron N2940 1.8GHz
HD Graphics (Bay Trail)
5.9 ~ 5 fps
HD Graphics (Bay Trail):
»
HD Graphics (Haswell):
»
HD Graphics (Broadwell):
»
HD Graphics (Haswell):
12.5 fps
HD Graphics (Haswell):
»
100%
HD Graphics (Bay Trail):
8.5 12.4 ~ 10 fps
100%
HD Graphics (Bay Trail):
8.1 fps
HD Graphics (Bay Trail):
»
100%
HD Graphics (Bay Trail):
5.8 fps
100%
HD Graphics (Bay Trail):
2.3 fps
HD Graphics (Bay Trail):
»
212%
HD Graphics (Haswell):
36 fps
229%
HD Graphics (Haswell):
16 fps
245%
HD Graphics (Haswell):
9.8 fps
100%
HD Graphics (Bay Trail):
1.1 fps
HD Graphics (Bay Trail):
»
HD Graphics (Haswell):
»
100%
HD Graphics (Bay Trail):
11 11.8 ~ 11 fps
200%
HD Graphics (Haswell):
21.7 22.2 ~ 22 fps
100%
HD Graphics (Bay Trail):
10 fps
110%
HD Graphics (Haswell):
11.2 11.3 ~ 11 fps
HD Graphics (Haswell):
6.8 fps
HD Graphics (Bay Trail):
»
HD Graphics (Haswell):
»
100%
HD Graphics (Bay Trail):
8 fps
100%
HD Graphics (Bay Trail):
4.8 fps
HD Graphics (Bay Trail):
»
100%
HD Graphics (Bay Trail):
19.7 fps
187%
HD Graphics (Haswell):
36.8 fps
HD Graphics (Haswell):
16.7 fps
HD Graphics (Bay Trail):
»
HD Graphics (Haswell):
»
100%
HD Graphics (Bay Trail):
24.1 36.9 ~ 31 fps
167%
HD Graphics (Haswell):
51.9 fps
100%
HD Graphics (Bay Trail):
12.9 13.3 ~ 13 fps
211%
HD Graphics (Haswell):
27.4 fps
HD Graphics (Haswell):
14.8 fps
HD Graphics (Bay Trail):
»
HD Graphics (Haswell):
»
HD Graphics (Haswell):
49.2 fps
HD Graphics (Haswell):
»
100%
HD Graphics (Bay Trail):
9.3 fps
HD Graphics (Bay Trail):
»
100%
HD Graphics (Bay Trail):
5 10.5 [X] Asus Transformer Book T200TA PLIntel Atom Z3775 1.5GHz
HD Graphics (Bay Trail)
~ 8 fps
100%
HD Graphics (Bay Trail):
5.6 [X] Asus Transformer Book T200TA PLIntel Atom Z3775 1.5GHz
HD Graphics (Bay Trail)
fps
100%
HD Graphics (Bay Trail):
3.7 [X] Asus Transformer Book T200TA PLIntel Atom Z3775 1.5GHz
HD Graphics (Bay Trail)
fps
HD Graphics (Bay Trail):
»
100%
HD Graphics (Bay Trail):
32 48 49 53.3 ~ 46 fps
100%
HD Graphics (Bay Trail):
6 9 9 ~ 8 fps
100%
HD Graphics (Bay Trail):
3 fps
HD Graphics (Bay Trail):
»
100%
HD Graphics (Bay Trail):
12 [X] Asus Transformer Book T200TA PLIntel Atom Z3775 1.5GHz
HD Graphics (Bay Trail)
fps
100%
HD Graphics (Bay Trail):
9 [X] Asus Transformer Book T200TA PLIntel Atom Z3775 1.5GHz
HD Graphics (Bay Trail)
fps
HD Graphics (Bay Trail):
»
100%
HD Graphics (Bay Trail):
12.8 fps
219%
HD Graphics (Haswell):
28 fps
100%
HD Graphics (Bay Trail):
9 fps
236%
HD Graphics (Haswell):
21.2 fps
HD Graphics (Bay Trail):
»
HD Graphics (Haswell):
»
100%
HD Graphics (Bay Trail):
23.1 25