Notebookcheck Logo

AMD Radeon RX 9070 GRE

AMD Radeon RX 9070 GRE

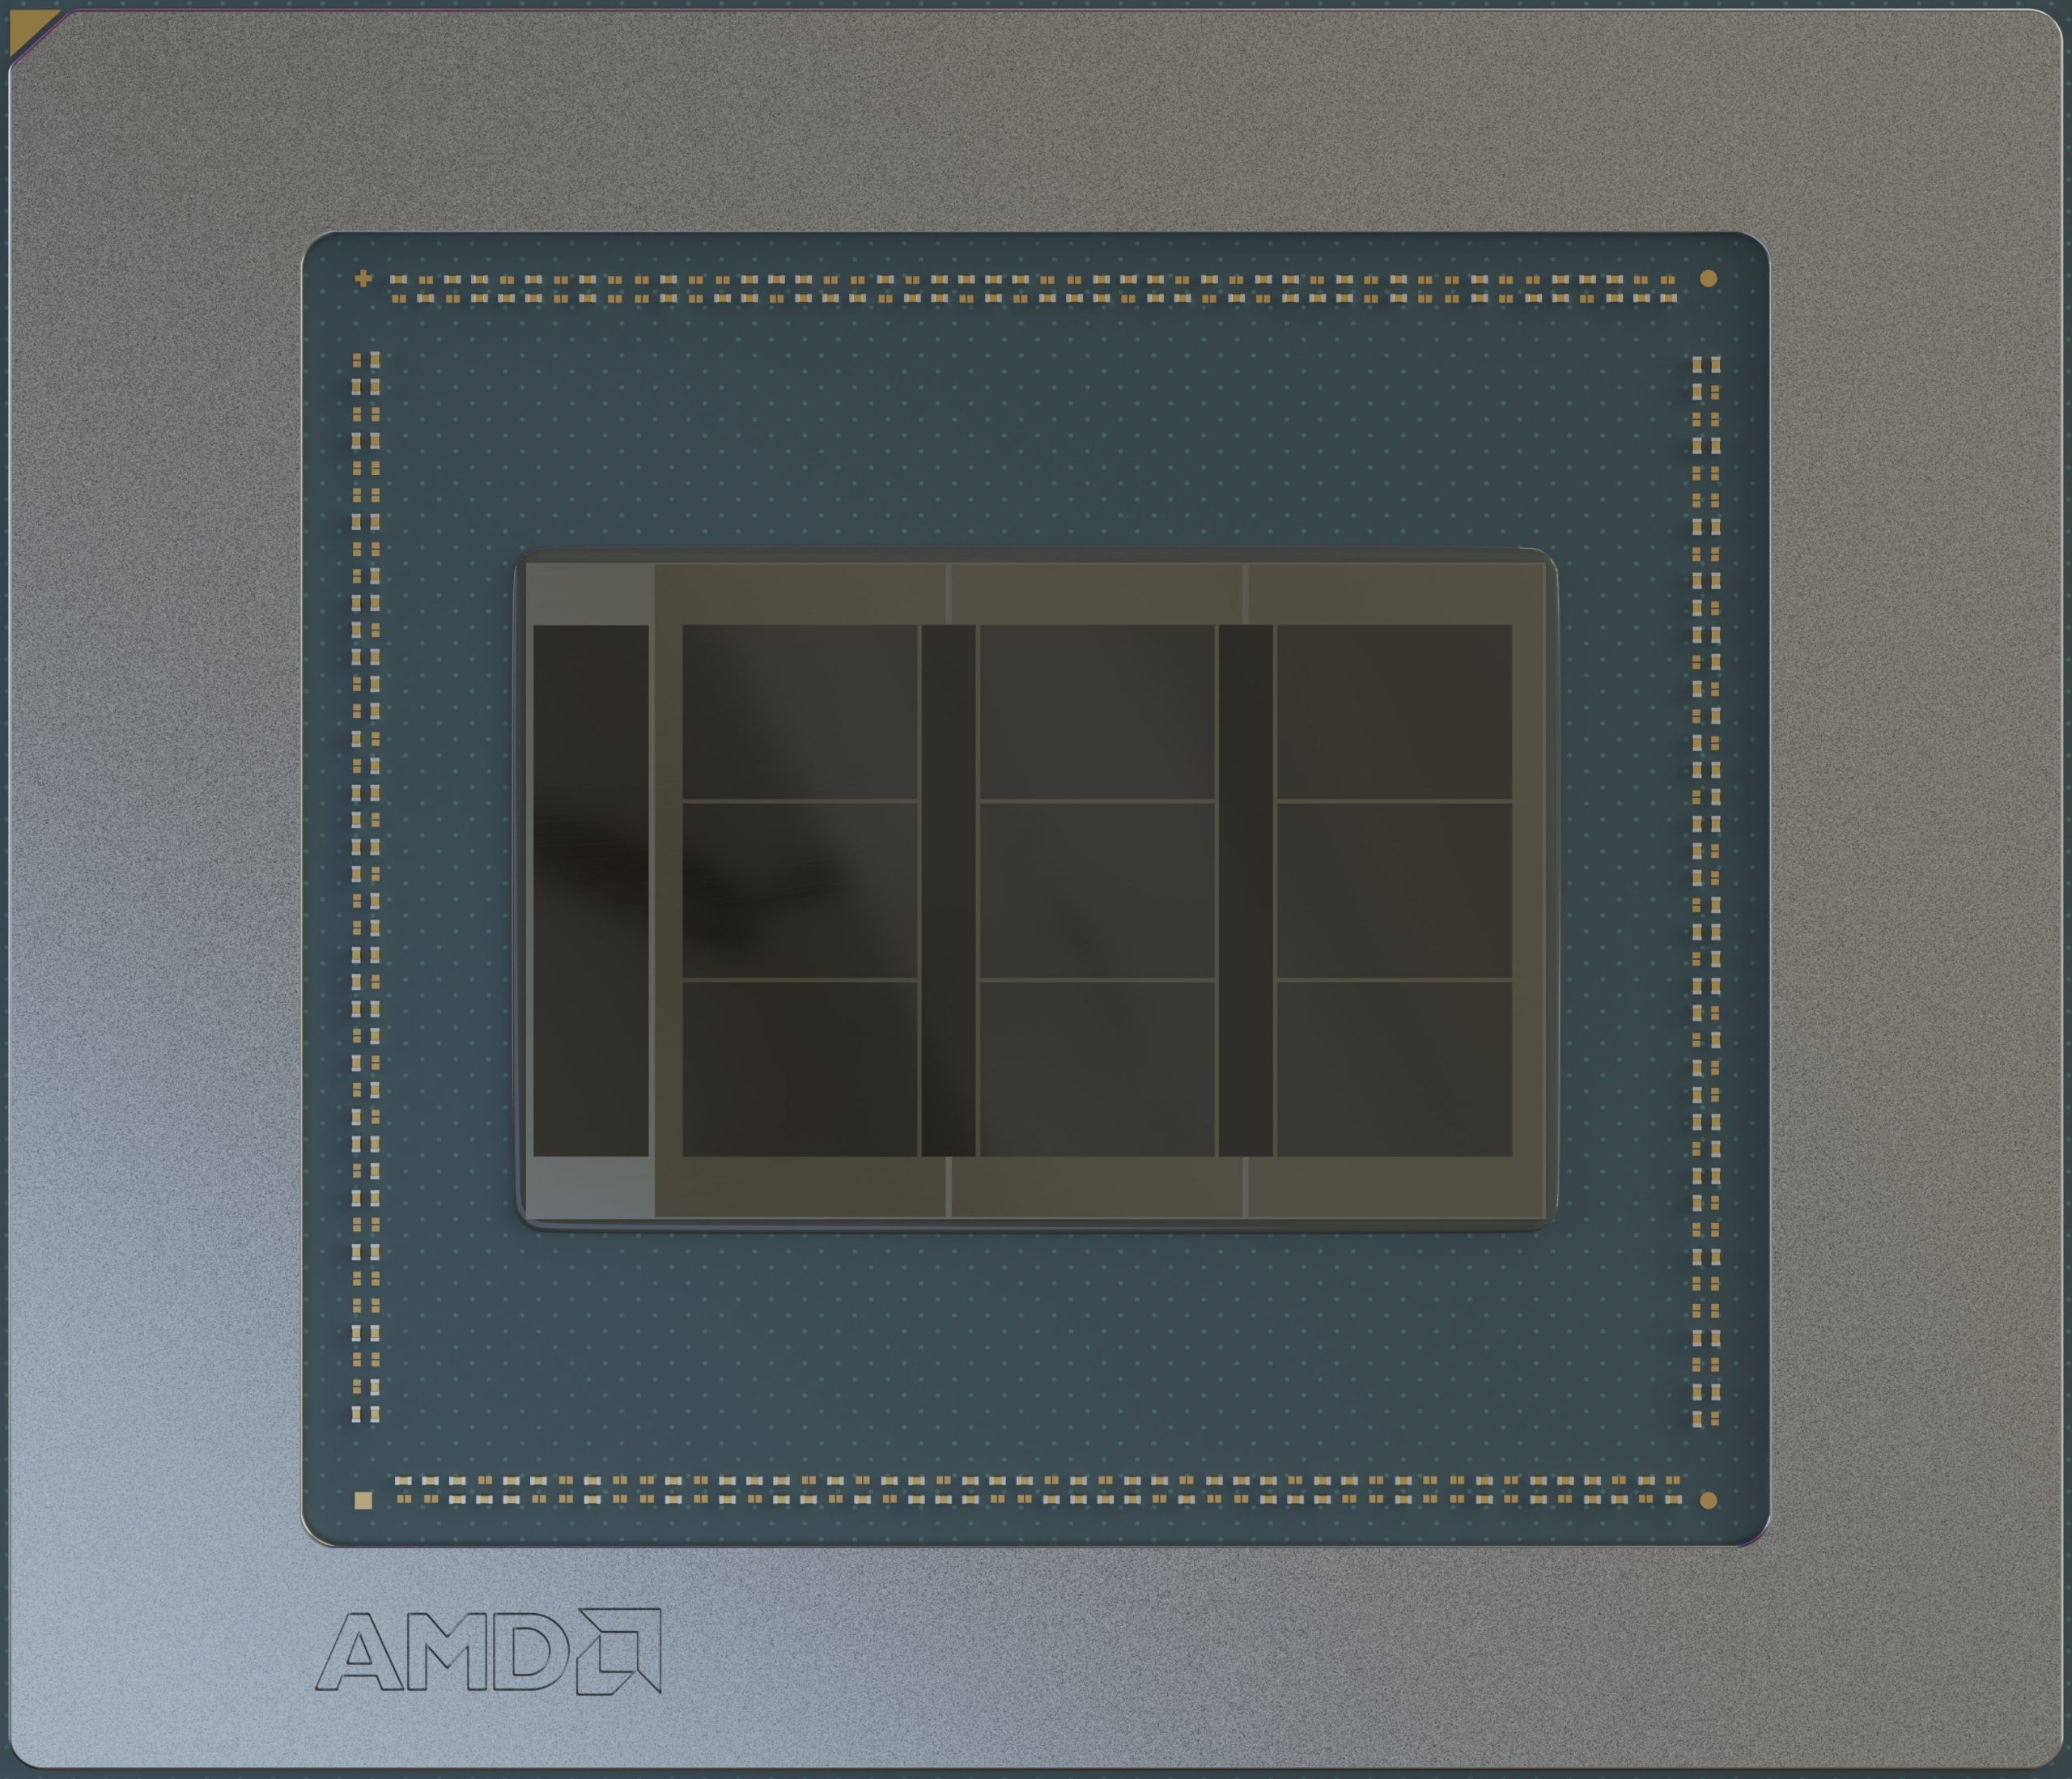
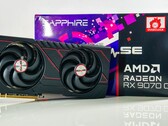
The AMD Radeon RX 9070 GRE is a desktop graphics card based on the RDNA 4 architecture, designed for 1440p gaming. It features 3,072 stream processors across 48 compute units and boost clocks of up to 2,790 MHz. Its 12 GB of GDDR6 memory uses a 192-bit interface, providing 432 GB/s of bandwidth, complemented by 48 MB of Infinity Cache. The GPU supports hardware-accelerated ray tracing, AI-powered FSR 4 upscaling and AV1 encoding and decoding. Typical board power is rated at 220 watts, with AMD recommending a 650-watt power supply.

The performance of the Radeon RX 9070 GRE sits between the Radeon RX 9070 and the clearly slower Radeon RX 9060 XT. Compared to Nvidia GPUs, the GRE sits between the  Nvidia GeForce RTX 5060 Ti and RTX 5070.

Radeon RX 9000 Desktop Series

Radeon RX 9070 XT compare 4096 @ 2.97 GHz256 Bit
Radeon RX 9070 compare 3584 @ 2.54 GHz256 Bit
Radeon RX 9070 GRE 3584 @ 2.54 GHz256 Bit
Radeon RX 9060 XT compare 2048 @ 2.53 GHz128 Bit
ArchitectureRDNA 4
Pipelines3584 - unified
TMUs224
ROPs128
Raytracing Cores56
Core Speed2540 (Boost) MHz
Memory Bus Width256 Bit
Memory TypeGDDR6
Max. Amount of Memory16 GB
Shared Memoryno
Memory Bandwidth640 GB/s
APIDirectX 12_2, OpenGL 4.6
Transistor Count53.9 Billion
Die Size 357 mm²
Man. Technology4 nm
PCIePCie 5.0
Displays4 Displays (max.), HDMI 2.1b, DisplayPort 2.1a
FeaturesRDNA4, FSR4
Date of Announcement02.01.2025

Benchmarks

3DMark - 3DMark Speed Way Score
4308 Points (29%)
3DMark - 3DMark Steel Nomad
5391 Points (37%)
3DMark - 3DMark Steel Nomad Light
19454 Points (44%)
3DMark - 3DMark Solar Bay
93684 Points (38%)
3DMark - 3DMark Solar Bay Extreme
15000 Points (29%)
3DMark - 3DMark Fire Strike Standard Score
40395 Points (61%)
3DMark - 3DMark Fire Strike Standard Graphics
50845 Points (47%)
3DMark - 3DMark Time Spy Score
22118 Points (57%)
3DMark - 3DMark Time Spy Graphics
22079 Points (45%)
Restrict / Search: Model: Max. age: years
Unigine Valley 1.0 - Unigine Valley 1.0 DX
148.9 fps (45%)
LuxMark v2.0 64Bit - LuxMark v2.0 Room GPU
6443 Samples/s (23%)
LuxMark v2.0 64Bit - LuxMark v2.0 Sala GPU
13535 Samples/s (24%)
ComputeMark v2.1 - ComputeMark v2.1 Result
40542 points (34%)
Power Consumption - Furmark Stress Test Power Consumption - external Monitor *
395 Watt (53%)
0102030405060708090100110120130140150160170180190200210220230240250260270280290300310320330340350360370380390400410420430440450Tooltip
Power Consumption - The Witcher 3 Power Consumption - external Monitor *
436 Watt (61%)
0102030405060708090100110120130140150160170180190200210220230240250260270280290300310320330340350360370380390400410420430440450460Tooltip
Power Consumption - Power Efficiency - Witcher 3 ultra external Monitor
0.5 fps per Watt (37%)
Power Consumption - Cyberpunk 2077 Power Consumption - external Monitor *
566 Watt (72%)
0153045607590105120135150165180195210225240255270285300315330345360375390405420435450465480495510525540555570Tooltip
Power Consumption - Power Efficiency - Cyberpunk 2077 ultra
0.3 fps per Watt (1%)
- Range of benchmark values
red legend - Average benchmark values
* Smaller numbers mean a higher performance

Game Benchmarks

The following benchmarks stem from our benchmarks of review laptops. The performance depends on the used graphics memory, clock rate, processor, system settings, drivers, and operating systems. So the results don't have to be representative for all laptops with this GPU. For detailed information on the benchmark results, click on the fps number.

F1 25

F1 25

2025
high 1920x1080
272  fps    + Compare
ultra 1920x1080
31.4  fps    + Compare
QHD 2560x1440
0.7  fps    + Compare
» With all tested laptops playable in detail settings high.
Additional Benchmarks
Ultra High Preset 16xAF TAA 1920x1080
98.5
high 1920x1080
91  fps    + Compare
ultra 1920x1080
67  fps    + Compare
QHD 2560x1440
57  fps    + Compare
4K 3840x2160
37  fps    + Compare
4K FSR 3840x2160
52  fps    + Compare
QHD FSR 2560x1440
66  fps    + Compare
» With all tested laptops playable in detail settings ultra.
ultra 1920x1080
50  fps    + Compare
QHD 2560x1440
38  fps    + Compare
4K 3840x2160
22  fps    + Compare
QHD FSR 2560x1440
54  fps    + Compare
» With all tested laptops playable in detail settings ultra.
F1 24

F1 24

2024
high 1920x1080
370  fps    + Compare
ultra 1920x1080
140.1  fps    + Compare
QHD 2560x1440
90.8  fps    + Compare
4K 3840x2160
44.7  fps    + Compare
4K FSR 3840x2160
77.9  fps    + Compare
QHD FSR 2560x1440
144  fps    + Compare
» With all tested laptops playable in detail settings ultra.
high 1920x1080
101  fps    + Compare + 📈 Graph
ultra 1920x1080
78.9  fps    + Compare + 📈 Graph
QHD 2560x1440
53.5  fps    + Compare + 📈 Graph
4K 3840x2160
27.8  fps    + Compare + 📈 Graph
» With all tested laptops playable in detail settings ultra.
high 1920x1080
123.8  fps    + Compare + 📈 Graph
QHD 2560x1440
83.2  fps    + Compare + 📈 Graph
4K 3840x2160
38  fps    + Compare + 📈 Graph
» With all tested laptops playable in detail settings high.
Additional Benchmarks
High Preset + High Ray Tracing 1920x1080
42.7
high 1920x1080
185  fps    + Compare
ultra 1920x1080
148  fps    + Compare
QHD 2560x1440
118  fps    + Compare
4K 3840x2160
74  fps    + Compare
» With all tested laptops playable in detail settings ultra.
high 1920x1080
166.1  fps    + Compare
ultra 1920x1080
150.8  fps    + Compare
QHD 2560x1440
100.6  fps    + Compare
4K 3840x2160
45.3  fps    + Compare
4K FSR 3840x2160
36.8  fps    + Compare
» With all tested laptops playable in detail settings ultra.
Additional Benchmarks
Ray Tracing Ultra Preset (DLSS off) 1920x1080
65.4
Ultra Preset (FSR2 on) 1920x1080
162.9
Ray Tracing Ultra Preset (DLSS off, no Path Tracing) 3840x2160
10.7
30min Start Ultra Preset (FSR off) 1920x1080
152.7
high 1920x1080
177.2  fps    + Compare + 📈 Graph
ultra 1920x1080
173.2  fps    + Compare + 📈 Graph
QHD 2560x1440
123.1  fps    + Compare + 📈 Graph
4K 3840x2160
65.8  fps    + Compare + 📈 Graph
4K FSR 3840x2160
103.7  fps    + Compare + 📈 Graph
» With all tested laptops playable in detail settings ultra.
Additional Benchmarks
Ultra Preset + Quality FSR 2.2 2560x1440
173.6
med. 1920x1080
177  fps    + Compare
high 1920x1080
131.3  fps    + Compare
4K 3840x2160
90.8  fps    + Compare
» With all tested laptops playable in detail settings high.
high 1920x1080
171.2  fps    + Compare
QHD 2560x1440
125.7  fps    + Compare
4K 3840x2160
72  fps    + Compare
» With all tested laptops playable in detail settings high.
high 1920x1080
364  fps    + Compare + 📈 Graph
ultra 1920x1080
196.8  fps    + Compare + 📈 Graph
QHD 2560x1440
141.5  fps    + Compare + 📈 Graph
4K 3840x2160
112.9  fps    + Compare + 📈 Graph
» With all tested laptops playable in detail settings ultra.
Additional Benchmarks
Ultra Graphics & Postprocessing (HBAO+) 3840x2160
77.8
lowmed.highultraQHD4K
F1 2527231.40.671
Assassin's Creed Shadows91675737
Black Myth: Wukong503822
F1 24370140.190.844.7
Avatar Frontiers of Pandora10178.953.527.8
Alan Wake 2123.883.238
Assassin's Creed Mirage18514811874
Cyberpunk 2077166.1150.8100.645.3
Baldur's Gate 3177.2173.2123.165.8
X-Plane 11.11177131.390.8
Final Fantasy XV Benchmark171.2125.772
The Witcher 3364196.8141.5112.9
lowmed.highultraQHD4K
< 30 fps
< 60 fps
< 120 fps
≥ 120 fps


1


2
9

2
2
5
1
3
4
3
2
4
5

For more games that might be playable and a list of all games and graphics cards visit our Gaming List

Amazon Logo
  • $599.99
    ASUS Prime Radeon™ RX 9070 GRE EVO OC Edition Graphics Card (PCIe 5.0, HDMI/DP 2.1, 2.5-Slot Design, axial-tech Fans, Dual Ball Fan Bearings, Dual BIOS, GPU Guard)
  • $699.99
    ASRock Radeon RX 9070 Challenger 16GB OC Graphics Card, RDNA 4, 2520MHz Boost, 16GB GDDR6 256-bit, PCIe 5.0, Triple Fans, 0dB Silent, LED Indicator
  • $679.99
    XFX Swift AMD Radeon RX 9070 GRE White Triple Fan Gaming Edition with 12GB GDDR6 HDMI 3xDP, AMD RDNA 4 RX-97GRE29W7
  • $649.99
    XFX Swift AMD Radeon RX 9060 XT OC Gaming Edition with 16GB GDDR6 HDMI 2xDP, RDNA 4 RX-96TSW16BQ, Graphics Card, Compatible with Desktop PCs
  • $659.99
    XFX Swift AMD Radeon RX 9070 GRE Triple Fan Gaming Edition with 12GB GDDR6 HDMI 3xDP, AMD RDNA 4 RX-97GRE29B7

Add one or more devices and compare

In the following list you can select (and also search for) devices that should be added to the comparison. You can select more than one device.

search for model:
v1.35
log 24. 12:59:09

#0 ran 0s before starting gpusingle class +0s ... 0s

#1 no ids found in url (should be separated by "_") +0s ... 0s

#2 not redirecting to Ajax server +0s ... 0s

#3 did not recreate cache, as it is less than 5 days old! Created at Thu, 22 Oct 2026 05:31:27 +0200 +0.002s ... 0.002s

#4 composed specs +0.017s ... 0.019s

#5 did output specs +0s ... 0.019s

#6 start showIntegratedCPUs +0s ... 0.019s

#7 getting avg benchmarks for device 13595 +0.015s ... 0.034s

#8 got single benchmarks 13595 +0.008s ... 0.042s

#9 got avg benchmarks for devices +0s ... 0.042s

#10 min, max, avg, median took s +0.785s ... 0.827s

#11 before gaming benchmark output +0s ... 0.828s

#12 Got 50 rows for game benchmarks. +0.005s ... 0.833s

#13 composed SQL query for gamebenchmarks +0s ... 0.833s

#14 got data and put it in $dataArray +0.008s ... 0.841s

#15 benchmarks composed for output. +0.134s ... 0.975s

#16 return log +0.494s ... 1.47s

Google LogoAdd as a preferred source on Google
Mail Logo

» Comparison of GPUs
Detailed list of all laptop GPUs sorted by class and performance.

» Benchmark List
Sort and restrict laptop GPUs based on performance in synthetic benchmarks.

» Notebook Gaming List
Playable games for each graphics card and their average FPS results.

Class 1

Class 2

Class 3

* Approximate position of the graphics adapter

Klaus Hinum (Update: 2026-10-24)