Notebookcheck Logo

NVIDIA NVS 4200M vs Intel HD Graphics 6000 vs Intel HD Graphics (Bay Trail)

NVIDIA NVS 4200M

► remove from comparison

The NVIDIA NVS 4200M (or NVIDIA Quadro NVS 4200M) is a business graphics card for laptops which is most likely based on the same core as the GeForce GT 520M. According to the Nvidia Homepage, the 4200M is allowed to be clocked up to 810MHz, compared to the 550MHz of the GT 520M. However, the clock rates of the NVS 4200M in the Dell Latitude 6420 is similar to the GT 520M.

The NVS series is optimized for business applications and stability and may therefore perform a bit worse in games due to the special drivers and BIOS optimizations.

The gaming performance may be a bit worse compared to similar clocked GeForce cards due to the stability optimizations of the NVS. In theory the raw performance of the chip is enough to run current games of 2010/2011 in low-medium details and resolutions.

As the GT 520M, the NVS4200M should support PureVideo HD (VP4) to accelerate HD videos and OpenCL / CUDA / DirectX Compute to use the render cores for other applications.

The graphics card supports HDMI 1.3 up to 1920x1080 and Multimode DisplayPort up to 2560x1600. Furthermore, 7.1 channel HD audio can be trasmitted over the HDMI port.

Intel HD Graphics 6000

► remove from comparison Intel HD Graphics 6000

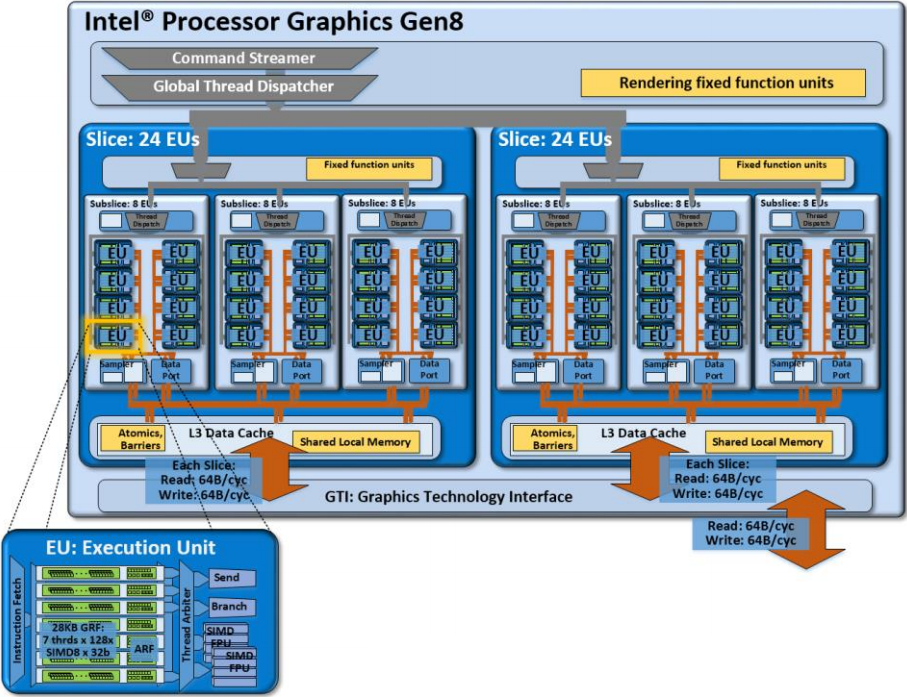
The Intel HD Graphics 6000 (GT3) is an integrated Broadwell graphics card revealed in Q1 2015. It can be found in several ULV SoCs (15 W TDP) such as the Core i5-5250U or i7-5650U. The so-called GT3 GPU offers 48 EUs (Execution Units) and therefore somewhat more shader power than the previous HD 5000 (40 EUs). Depending on the specific CPU, the maximum GPU frequency varies between 950 and 1000 MHz.

Architecture and Features

Broadwell features a GPU based on the Intel Gen8 architecture, which has been optimized in various aspects compared to the previous Gen7.5 (Haswell). Inter alia, the shader arrays called "subslice" have been reorganized and now offer 8 Execution Units (EUs) each. Three subslices form a "slice" for a total of 24 EUs. Combined with other improvements such as larger L1 caches and an optimized frontend, the integrated GPU has become faster and more efficient than its predecessor.

The HD Graphics 6000 represents the top-end version of the Broadwell GPU family and consists of two slices with 48 EUs. Beyond that, there is also a low-end (GT1, 12 EUs), a mid-range (GT2, 24 EUs) and a high-end variant (GT3e, 48 EUs + eDRAM).

All Broadwell GPUs support OpenCL 2.0 and DirectX 12 (FL 11_1). The video engine can now decode H.265 using both fixed function hardware as well as available GPU shaders. Up to three displays can be connected via DP 1.2/eDP 1.3 (max. 3840 x 2160 @ 60 Hz) or HDMI 1.4a (max. 3840 x 2160 @ 24 Hz). HDMI 2.0, however, is not supported.

Performance

Depending on the specific CPU, the maximum GPU frequency varies between 950 and 1000 MHz. Due to the low TDP, however, the average clock in 3D applications will be significantly lower. Overall, the HD Graphics 6000 outperforms the previous HD 5000 by 20 - 25 percent and offers a performance slightly below a dedicated GeForce 820M.

Games as of 2014/2015 will usually run fluently only at (very) low settings.

Power Consumption

Utilizing a new 14 nm process, the Broadwell ULV chips are specified at just 15 W TDP and therefore suited for thin ultrabooks. The TDP is flexible and can be further reduced (9.5 W), which has a significant impact on performance.

Intel HD Graphics (Bay Trail)

► remove from comparison Intel HD Graphics (Bay Trail)

The Intel HD Graphics (Bay Trail) is a low-end integrated Bay Trail graphics card found in certain Atom models (Z3770), nettops (J2850) and notebook SoCs (N3510). It supports DirectX 11 and is based on the Ivy Bridge GPU. Clock rates and shader cores, however, are considerably lower.

Compared to Ivy Bridge, which offers either 6 or 16 Execution Units, the HD Graphics (Bay Trail) comes with only 4 EUs. The core clock is significantly lower as well. Depending on the specific model, the maximum Turbo Boost is 896 MHz or less and the memory controller can support DDR3(L), DDR3L-RS or LPDDR3 in single- or dual-channel operation.

The fastest notebook models equipped with this GPU nearly match the performance of the HD Graphics (Sandy Bridge) and the AMD Radeon HD 6310. Therefore, older and less demanding Windows games like World of Warcraft or Half-Life 2 can be played fluently in very low settings. Performance is not sufficient for most modern titles.

Compared to competing ARM SoCs, Bay Trail outperforms the Adreno 320 (which can be found in different Qualcomm SoCs like the Snapdragon 600) and offers a performance similar to the Tegra 4 GPU. That is enough power to run even the most demanding Android games smoothly in very high resolutions as of 2013.

The integrated video decoder supports all popular codecs such as MPEG2, H.264, VC1, VP8 and MVC and is suitable for resolutions up to 4K up to 100 Mbit/s. The user can connect up to two displays via HDMI 1.4 (max. 1920 x 1080) or DisplayPort 1.2 (max. 2560 x 1600). Another new feature is the support for Wireless Display and Quick Sync, Intel's fast and power efficient H-264 hardware encoder. Some of these features are not available on all models.

Depending on the model, the power consumption of the entire SoC is somewhere between 2 and 10 W. The most efficient versions are therefore suitable for passively cooled tablets, whereas faster variants are used in larger subnotebooks with active cooling.

NVIDIA NVS 4200MIntel HD Graphics 6000Intel HD Graphics (Bay Trail)
HD Graphics Series
NVS 4200M 48 @ 0.81 GHz64 Bit @ 800 MHz
NVS 3100M 16 @ 0.6 GHz64 Bit @ 800 MHz
NVS 2100M 16 @ 0.54 GHz64 Bit @ 800 MHz
HD Graphics P530 24 @ 0.35 - 1.05 GHz64/128 Bit
HD Graphics 5600 24 @ 0.3 - 1.05 GHz64/128 Bit
HD Graphics 6000 48 @ 0.3 - 1 GHz64/128 Bit
HD Graphics 4600 20 @ 0.2 - 1.35 GHz64/128 Bit
HD Graphics 5500 24 @ 0.3 - 0.95 GHz64/128 Bit
HD Graphics 5000 40 @ 0.2 - 1.1 GHz64/128 Bit
HD Graphics 4400 20 @ 0.2 - 1.1 GHz64/128 Bit
HD Graphics 5300 24 @ 0.1 - 0.9 GHz64/128 Bit
HD Graphics 4000 16 @ 0.35 - 1.35 GHz64/128 Bit
HD Graphics (Broadwell) 12 @ 0.1 - 0.85 GHz64/128 Bit
HD Graphics 4200 20 @ 0.2 - 0.85 GHz64/128 Bit
HD Graphics (Skylake) 12 @ 0.3 - 0.8 GHz64/128 Bit
HD Graphics 405 (Braswell) 16 @ 0.32 - 0.7 GHz64/128 Bit
HD Graphics (Braswell) 16 @ 0.32 - 0.7 GHz64/128 Bit
HD Graphics 400 (Braswell) 12 @ 0.32 - 0.64 GHz64/128 Bit
HD Graphics (Haswell) 10 @ 0.2 - 1 GHz64/128 Bit
HD Graphics (Cherry Trail) 16 @ 0.2 - 0.6 GHz64/128 Bit
HD Graphics 3000 12 @ 0.35 - 1.35 GHz64/128 Bit
HD Graphics 2500 6 @ 0.65 - 1.15 GHz64/128 Bit
HD Graphics (Ivy Bridge) 6 @ 0.35 - 1.1 GHz64/128 Bit
HD Graphics 2000 6 @ 0.85 - 1.35 GHz64/128 Bit
HD Graphics (Sandy Bridge) 6 @ 0.35 - 1.1 GHz64/128 Bit
HD Graphics (Bay Trail) 4 @ 0.31 - 0.9 GHz32/64/128 Bit
ArchitectureFermiGen. 8 BroadwellGen. 7 Ivy Bridge
Pipelines48 - unified48 - unified4 - unified
Core Speed810 MHz300 - 1000 (Boost) MHz311 - 896 (Boost) MHz
Shader Speed1620 MHz
Memory Speed800 MHz
Memory Bus Width64 Bit64/128 Bit32/64/128 Bit
Memory TypeDDR3
Max. Amount of Memory1024 MB
Shared Memorynoyesyes
APIDirectX 11, Shader 5.0DirectX 12 (FL 11_1), OpenGL 4.3DirectX 11, Shader 5.0, OpenGL 4.0, ES 3.0
technology40 nm14 nm22 nm
Notebook Sizemedium sized
Date of Announcement22.02.2011 05.01.2015 11.09.2013
Link to Manufacturer Pagewww.nvidia.com
CodenameBroadwell GT3Bay Trail
Transistors1.9 Billion
FeaturesQuickSync
CPU in HD Graphics 6000GPU Base SpeedGPU Boost / Turbo
Intel Core i7-5650U2 x 2200 MHz, 15 W300 MHz1000 MHz
Intel Core i7-5550U2 x 2000 MHz, 15 W300 MHz1000 MHz
Intel Core i5-5350U2 x 1800 MHz, 15 W300 MHz1000 MHz
Intel Core i5-5250U2 x 1600 MHz, 15 W300 MHz1000 MHz
min. - max.300 MHz1000 MHz
CPU in HD Graphics (Bay Trail)GPU Base SpeedGPU Boost / Turbo
Intel Pentium N35404 x 2160 MHz, 7.5 W313 MHz896 MHz
Intel Pentium J29004 x 2410 MHz, 10 W688 MHz896 MHz
Intel Pentium N35304 x 2160 MHz, 7.5 W313 MHz896 MHz
min. - max.311 - ? MHz400 - 896 MHz

Benchmarks

Performance Rating - 3DMark 11 + Fire Strike + Time Spy - HD Graphics 6000
0.4 pt (1%)
Restrict / Search: Model: Max. age: years
Performance Rating - 3DMark 11 + Fire Strike + Time Spy - HD Graphics (Bay Trail)
0.1 pt (0%)
Restrict / Search: Model: Max. age: years
3DMark - 3DMark Time Spy Score
374 Points (1%)
3DMark - 3DMark Time Spy Graphics
334 Points (1%)
3DMark - 3DMark Cloud Gate Score
min: 5425     avg: 5737     median: 5872 (6%)     max: 6061 Points
min: 354     avg: 1182     median: 1188 (1%)     max: 1703 Points
3DMark - 3DMark Cloud Gate Graphics
min: 7378     avg: 7700     median: 7660 (2%)     max: 8102 Points
min: 362     avg: 1230     median: 1228.5 (0%)     max: 1670 Points
3DMark - 3DMark Fire Strike Standard Score
min: 844     avg: 906     median: 903 (1%)     max: 971 Points
3DMark - 3DMark Fire Strike Standard Graphics
min: 858     avg: 947     median: 951 (1%)     max: 1033 Points
3DMark - 3DMark Ice Storm Graphics
min: 61674     avg: 62508     median: 61979 (7%)     max: 63871 Points
min: 5056     avg: 15391     median: 16047 (2%)     max: 21351 Points
3DMark - 3DMark Sling Shot (ES 3.0)
0 Points (0%)
3DMark - 3DMark Sling Shot Extreme (ES 3.1)
0 Points (0%)
3DMark 11 - 3DM11 Performance Score
min: 507     avg: 605     median: 572 (1%)     max: 806 Points
min: 1328     avg: 1487     median: 1513.5 (2%)     max: 1591 Points
min: 143     avg: 222.6     median: 216 (0%)     max: 280 Points
3DMark 11 - 3DM11 Performance GPU
min: 496     avg: 519     median: 507 (0%)     max: 541 Points
min: 1210     avg: 1372     median: 1395.5 (1%)     max: 1487 Points
min: 122     avg: 192.1     median: 186.5 (0%)     max: 237 Points
3DMark Vantage
3DM Vant. Perf. total + NVIDIA NVS 4200M
3DMark Vantage - 3DM Vant. Perf. total
min: 2142     avg: 2309     median: 2298 (1%)     max: 2443 Points
3DM Vant. Perf. total + Intel HD Graphics 6000
min: 5797     avg: 6106     median: 6188 (2%)     max: 6333 Points
3DM Vant. Perf. total + Intel HD Graphics (Bay Trail)
3DM Vant. Perf. GPU no PhysX + NVIDIA NVS 4200M
3DMark Vantage - 3DM Vant. Perf. GPU no PhysX
min: 1819     avg: 1896     median: 1917 (1%)     max: 1969 Points
3DM Vant. Perf. GPU no PhysX + Intel HD Graphics 6000
min: 5129     avg: 5410     median: 5432 (3%)     max: 5670 Points
3DM Vant. Perf. GPU no PhysX + Intel HD Graphics (Bay Trail)
3DMark 2001SE - 3DMark 2001 - Standard
7727 Points (8%)
3DMark 03 - 3DMark 03 - Standard
min: 12527     avg: 12674     median: 12634 (7%)     max: 12860 Points
min: 4226     avg: 4997     median: 5220 (3%)     max: 5323 Points
3DMark 05 - 3DMark 05 - Standard
min: 9189     avg: 9507     median: 9462 (10%)     max: 9801 Points
min: 2666     avg: 3195     median: 3331 (4%)     max: 3445 Points
3DMark 06 3DMark 06 - Standard 1280x1024 + NVIDIA NVS 4200M
3DMark 06
min: 4601     avg: 4906     median: 4929 (6%)     max: 5118 Points
3DMark 06 - Standard 1280x1024 + Intel HD Graphics 6000
min: 7844     avg: 8448     median: 8091 (11%)     max: 9408 Points
3DMark 06 - Standard 1280x1024 + Intel HD Graphics (Bay Trail)
min: 814     avg: 1785     median: 1866 (2%)     max: 2151 Points
3DMark 06 - Score Unknown Settings + Intel HD Graphics (Bay Trail)
3DMark 06
2108 Points (3%)
3DMark 06 - Standard 1280x800 + Intel HD Graphics (Bay Trail)
3DMark 06
2087 Points (3%)
Unigine Valley 1.0 - Unigine Valley 1.0 DX
3.7 fps (1%)
Unigine Heaven 3.0 - Unigine Heaven 3.0 DX 11
3.6 fps (1%)
Unigine Heaven 2.1 - Heaven 2.1 high
min: 7.1     avg: 7.5     median: 7.5 (1%)     max: 7.8 fps
min: 18.6     avg: 19     median: 18.7 (4%)     max: 19.8 fps
SPECviewperf 11
specvp11 snx-01 + NVIDIA NVS 4200M
SPECviewperf 11 - specvp11 snx-01
min: 1.99     avg: 2.4     median: 2.1 (1%)     max: 3.29 fps
specvp11 tcvis-02 + NVIDIA NVS 4200M
SPECviewperf 11 - specvp11 tcvis-02
min: 0.7     avg: 0.8     median: 0.8 (0%)     max: 0.97 fps
specvp11 sw-02 + NVIDIA NVS 4200M
SPECviewperf 11 - specvp11 sw-02
min: 4.4     avg: 5.4     median: 5.1 (4%)     max: 6.68 fps
specvp11 proe-05 + NVIDIA NVS 4200M
SPECviewperf 11 - specvp11 proe-05
min: 0.82     avg: 1     median: 1 (1%)     max: 1.12 fps
specvp11 maya-03 + NVIDIA NVS 4200M
SPECviewperf 11 - specvp11 maya-03
min: 3.04     avg: 4.9     median: 5.4 (4%)     max: 6.27 fps
specvp11 lightwave-01 + NVIDIA NVS 4200M
SPECviewperf 11 - specvp11 lightwave-01
min: 6.79     avg: 8.6     median: 9 (10%)     max: 9.97 fps
specvp11 ensight-04 + NVIDIA NVS 4200M
SPECviewperf 11 - specvp11 ensight-04
min: 5.1     avg: 5.7     median: 5.8 (3%)     max: 6.36 fps
specvp11 catia-03 + NVIDIA NVS 4200M
SPECviewperf 11 - specvp11 catia-03
min: 2.6     avg: 3.2     median: 3.1 (2%)     max: 3.71 fps
SPECviewperf 12
specvp12 sw-03 + Intel HD Graphics 6000
SPECviewperf 12 - specvp12 sw-03
16.6 fps (4%)
specvp12 snx-02 + Intel HD Graphics 6000
SPECviewperf 12 - specvp12 snx-02
2.5 fps (0%)
specvp12 showcase-01 + Intel HD Graphics 6000
SPECviewperf 12 - specvp12 showcase-01
5.6 fps (1%)
specvp12 mediacal-01 + Intel HD Graphics 6000
SPECviewperf 12 - specvp12 mediacal-01
1.6 fps (0%)
specvp12 maya-04 + Intel HD Graphics 6000
SPECviewperf 12 - specvp12 maya-04
3.3 fps (1%)
specvp12 energy-01 + Intel HD Graphics 6000
SPECviewperf 12 - specvp12 energy-01
0.1 fps (0%)
specvp12 creo-01 + Intel HD Graphics 6000
SPECviewperf 12 - specvp12 creo-01
9.9 fps (4%)
specvp12 catia-04 + Intel HD Graphics 6000
SPECviewperf 12 - specvp12 catia-04
11.3 fps (2%)
Windows 7 Experience Index - Win7 Gaming graphics
min: 6.4     avg: 6.4     median: 6.4 (81%)     max: 6.5 Points
6.9 Points (87%)
Windows 7 Experience Index - Win7 Graphics
min: 4.7     avg: 5.5     median: 5.6 (71%)     max: 6.4 Points
5.9 Points (75%)
Cinebench R10 Cinebench R10 Shading (32bit) + NVIDIA NVS 4200M
Cinebench R10 - Cinebench R10 Shading (32bit)
min: 4816     avg: 5327     median: 5185 (4%)     max: 6163 Points
Cinebench R10 Shading (32bit) + Intel HD Graphics 6000
min: 6148     avg: 6928     median: 6527 (5%)     max: 8110 Points
Cinebench R10 Shading (32bit) + Intel HD Graphics (Bay Trail)
min: 898     avg: 2014     median: 1991.5 (1%)     max: 2889 Points
Cinebench R11.5 Cinebench R11.5 OpenGL 64 Bit + NVIDIA NVS 4200M
Cinebench R11.5 - Cinebench R11.5 OpenGL 64 Bit
min: 15.5     avg: 16.1     median: 16.1 (5%)     max: 16.71 fps
Cinebench R11.5 OpenGL 64 Bit + Intel HD Graphics 6000
min: 21.27     avg: 23.7     median: 23.9 (8%)     max: 25.67 fps
Cinebench R11.5 OpenGL 64 Bit + Intel HD Graphics (Bay Trail)
min: 0.37     avg: 6.2     median: 6.4 (2%)     max: 7.69 fps
Cinebench R15
Cinebench R15 OpenGL 64 Bit + Intel HD Graphics 6000
Cinebench R15 - Cinebench R15 OpenGL 64 Bit
min: 25.89     avg: 30.1     median: 30.7 (2%)     max: 34.45 fps
Cinebench R15 OpenGL 64 Bit + Intel HD Graphics (Bay Trail)
min: 2.88     avg: 5     median: 5.5 (0%)     max: 6.55 fps
Cinebench R15 OpenGL Ref. Match 64 Bit + Intel HD Graphics 6000
Cinebench R15 - Cinebench R15 OpenGL Ref. Match 64 Bit
min: 98     avg: 98.5     median: 98 (98%)     max: 99.3 %
Cinebench R15 OpenGL Ref. Match 64 Bit + Intel HD Graphics (Bay Trail)
min: 63     avg: 96.1     median: 97.8 (98%)     max: 97.8 %
GFXBench 3.1 - GFXBench Manhattan ES 3.1 Offscreen
5.2 fps (0%)
GFXBench 3.0 - GFXBench 3.0 Manhattan Offscreen
min: 34.22     avg: 39.5     median: 39.5 (2%)     max: 44.7 fps
GFXBench (DX / GLBenchmark) 2.7
GFXBench T-Rex HD Offscreen C24Z16 + Intel HD Graphics (Bay Trail)
Basemark ES 2.0 - Basemark ES 2.0
min: 45.08     avg: 49.1     median: 49.1 (81%)     max: 53.1 fps
Basemark X 1.0 - Basemark X 1.0 Off-Screen
10.1 fps (48%)
Basemark X 1.1 - Basemark X 1.1 High Quality
min: 3008     avg: 6663     median: 8456 (19%)     max: 8524 Points
Basemark X 1.1 - Basemark X 1.1 Medium Quality
min: 4802     avg: 12880     median: 14509 (32%)     max: 17701 Points
NenaMark2 - NenaMark2 Score
min: 59     avg: 59.4     median: 59.4 (88%)     max: 59.7 fps
LuxMark v2.0 64Bit - LuxMark v2.0 Room GPU
min: 127     avg: 136     median: 135 (0%)     max: 146 Samples/s
min: 25     avg: 28.5     median: 27 (0%)     max: 35 Samples/s
LuxMark v2.0 64Bit - LuxMark v2.0 Sala GPU
min: 342     avg: 357     median: 350 (1%)     max: 379 Samples/s
min: 26     avg: 29     median: 29 (0%)     max: 34 Samples/s
ComputeMark v2.1 - ComputeMark v2.1 Result
min: 941     avg: 1032     median: 1021 (1%)     max: 1134 Points
min: 160     avg: 172.8     median: 174 (0%)     max: 192 Points
PassMark PerformanceTest Mobile V1 - PerformanceTest Mobile V1 2D Graphics Tests
min: 3822     avg: 4036     median: 3866 (1%)     max: 4588 Points
PassMark PerformanceTest Mobile V1 - PerformanceTest Mobile V1 3D Graphics Tests
min: 1058     avg: 1251     median: 1228 (2%)     max: 1488 Points
Power Consumption - Furmark Stress Test Power Consumption - external Monitor *
32.9 Watt (4%)
Power Consumption - The Witcher 3 Power Consumption - external Monitor *
32.1 Watt (4%)
Clock Speed - GPU Clock Witcher 3 ultra
850 MHz (33%)
Clock Speed - GPU Clock Speed Furmark
649 MHz (26%)

Average Benchmarks NVIDIA NVS 4200M → 100% n=8

Average Benchmarks Intel HD Graphics 6000 → 223% n=8

Average Benchmarks Intel HD Graphics (Bay Trail) → 35% n=8

- Range of benchmark values for this graphics card
red legend - Average benchmark values for this graphics card
* Smaller numbers mean a higher performance
1 This benchmark is not used for the average calculation

Game Benchmarks

The following benchmarks stem from our benchmarks of review laptops. The performance depends on the used graphics memory, clock rate, processor, system settings, drivers, and operating systems. So the results don't have to be representative for all laptops with this GPU. For detailed information on the benchmark results, click on the fps number.

low 1280x720
HD Graphics 6000:
18.4  fps
low 1280x720
HD Graphics 6000:
18.2  fps
med. 1920x1080
HD Graphics 6000:
12.9  fps
high 1920x1080
HD Graphics 6000:
11.6  fps
low 1280x720
HD Graphics 6000:
64.2  fps
HD Graphics (Bay Trail):
26.7  fps
med. 1366x768
HD Graphics (Bay Trail):
23.4  fps
high 1920x1080
HD Graphics 6000:
37.4 (!)  fps
Dirt 4

Dirt 4

2017
low 1280x720
HD Graphics 6000:
41.3  fps
HD Graphics (Bay Trail):
6  fps
low 1280x720
HD Graphics 6000:
28.4  fps
HD Graphics (Bay Trail):
12.6  fps
low 1280x720
HD Graphics 6000:
55.3 61 ~ 58 fps
med. 1366x768
HD Graphics 6000:
32.7  fps
high 1920x1080
HD Graphics 6000:
18.9  fps
low 1280x720
HD Graphics 6000:
20.8  fps
Overwatch

Overwatch

2016
low 1280x720
HD Graphics 6000:
25  fps
low 1024x768
HD Graphics 6000:
28.9  fps
med. 1366x768
HD Graphics 6000:
18.2  fps
high 1920x1080
HD Graphics 6000:
10.9  fps
ultra 1920x1080
HD Graphics 6000:
9.1  fps
low 1024x768
HD Graphics 6000:
18.6  fps
med. 1366x768
HD Graphics 6000:
14  fps
low 1024x768
HD Graphics 6000:
24.6  fps
HD Graphics (Bay Trail):
0 (!)  fps
med. 1366x768
HD Graphics 6000:
16.6  fps
FIFA 16

FIFA 16

2015
low 1280x720
HD Graphics 6000:
53 (!)  fps
high 1366x768
HD Graphics 6000:
39 (!)  fps
ultra 1920x1080
HD Graphics 6000:
21.3  fps
low 1366x768
HD Graphics 6000:
52.3  fps
HD Graphics (Bay Trail):
12.1  fps
ultra 1920x1080
HD Graphics 6000:
16  fps
low 1024x768
HD Graphics 6000:
35  fps
HD Graphics (Bay Trail):
10.8  fps
med. 1366x768
HD Graphics 6000:
24.8  fps
high 1920x1080
HD Graphics 6000:
9.5  fps
Mad Max

Mad Max

2015
med. 1366x768
HD Graphics 6000:
19.3  fps
low 1280x720
HD Graphics 6000:
54.7  fps
HD Graphics (Bay Trail):
24.7  fps
med. 1366x768
HD Graphics 6000:
33.9  fps
HD Graphics (Bay Trail):
9.7  fps
high 1920x1080
HD Graphics 6000:
16.7  fps
HD Graphics (Bay Trail):
5.5  fps
ultra 1920x1080
HD Graphics 6000:
15.4  fps
HD Graphics (Bay Trail):
5.4  fps
low 1280x720
HD Graphics 6000:
11  fps
med. 1366x768
HD Graphics 6000:
10  fps
low 1024x768
HD Graphics 6000:
13.4 13.8 ~ 14 fps
low 1024x768
HD Graphics 6000:
93  fps
HD Graphics (Bay Trail):
22 24.2 ~ 23 fps
med. 1366x768
HD Graphics 6000:
22.8  fps
HD Graphics (Bay Trail):
0 (!) 12.5 ~ 6 fps
high 1920x1080
HD Graphics 6000:
12.9  fps
low 1024x768
HD Graphics 6000:
35.3  fps
HD Graphics (Bay Trail):
7.3  fps
med. 1366x768
HD Graphics 6000:
26.9  fps
HD Graphics (Bay Trail):
5.1  fps
high 1920x1080
HD Graphics 6000:
9.1  fps
Evolve

Evolve

2015
low 1024x768
HD Graphics 6000:
18.7  fps
HD Graphics (Bay Trail):
3.2  fps
med. 1366x768
HD Graphics 6000:
13.5  fps
HD Graphics (Bay Trail):
1.7  fps
The Crew

The Crew

2014
low 1280x720
HD Graphics (Bay Trail):
8.1  fps
med. 1366x768
HD Graphics (Bay Trail):
4.7  fps
low 1024x768
HD Graphics 6000:
20.9  fps
HD Graphics (Bay Trail):
7  fps
med. 1366x768
HD Graphics 6000:
16.8  fps
HD Graphics (Bay Trail):
4.6  fps
high 1920x1080
HD Graphics 6000:
6.1  fps
Far Cry 4

Far Cry 4

2014
low 1024x768
HD Graphics (Bay Trail):
5.6  fps
med. 1366x768
HD Graphics (Bay Trail):
3.8  fps
low 1024x768
HD Graphics 6000:
0 (!)  fps
HD Graphics (Bay Trail):
4.3  fps
med. 1366x768
HD Graphics (Bay Trail):
2.4  fps
low 1024x768
HD Graphics 6000:
33  fps
med. 1366x768
HD Graphics 6000:
17.6  fps
low 1024x768
HD Graphics 6000:
40.9  fps
HD Graphics (Bay Trail):
9.6 11.5 ~ 11 fps
med. 1366x768
HD Graphics 6000:
20.8  fps
HD Graphics (Bay Trail):
4.3  fps
high 1920x1080
HD Graphics 6000:
13.3  fps
ultra 1920x1080
HD Graphics 6000:
10.7  fps
F1 2014

F1 2014

2014
low 1024x768
HD Graphics 6000:
55  fps
HD Graphics (Bay Trail):
12 14 ~ 13 fps
med. 1366x768
HD Graphics 6000:
37  fps
HD Graphics (Bay Trail):
12  fps
high 1920x1080
HD Graphics 6000:
21  fps
ultra 1920x1080
HD Graphics 6000:
13  fps
low 1024x768
HD Graphics (Bay Trail):
5.2  fps
med. 1366x768
HD Graphics (Bay Trail):
3.6  fps
low 1024x768
HD Graphics 6000:
19  fps
HD Graphics (Bay Trail):
3.7  fps
med. 1366x768
HD Graphics 6000:
12  fps
HD Graphics (Bay Trail):
2.5  fps
low 1024x768
HD Graphics 6000:
34  fps
HD Graphics (Bay Trail):
9.1  fps
med. 1366x768
HD Graphics 6000:
26.4  fps
HD Graphics (Bay Trail):
5.1  fps
low 1280x720
HD Graphics (Bay Trail):
8.5  fps
med. 1344x756
HD Graphics (Bay Trail):
6.1  fps
Fifa 15

Fifa 15

2014
low 1280x720
HD Graphics 6000:
50  fps
HD Graphics (Bay Trail):
12.4  fps
high 1366x768
HD Graphics 6000:
35.7  fps
HD Graphics (Bay Trail):
8.5  fps
ultra 1920x1080
HD Graphics 6000:
23.3  fps
Sims 4

Sims 4

2014
low 1024x768
HD Graphics 6000:
144  fps
HD Graphics (Bay Trail):
53.7 56 ~ 55 fps
med. 1366x768
HD Graphics 6000:
45.4  fps
HD Graphics (Bay Trail):
6.6 7 ~ 7 fps
high 1920x1080
HD Graphics 6000:
21.8  fps
ultra 1920x1080
HD Graphics 6000:
14.1  fps
low 1024x768
HD Graphics (Bay Trail):
8.4  fps
med. 1366x768
HD Graphics (Bay Trail):
5.9  fps
low 1024x768
HD Graphics 6000:
94  fps
HD Graphics (Bay Trail):
31.6 41.8 ~ 37 fps
med. 1366x768
HD Graphics 6000:
32  fps
HD Graphics (Bay Trail):
12.5 12.5 ~ 13 fps
high 1920x1080
HD Graphics 6000:
22  fps
ultra 1920x1080
HD Graphics 6000:
13  fps
low 1024x768
HD Graphics (Bay Trail):
8.3  fps
med. 1366x768
HD Graphics (Bay Trail):
4.6  fps
low 1280x720
HD Graphics (Bay Trail):
11.1  fps
med. 1280x720
HD Graphics (Bay Trail):
9.6  fps
low 1024x768
HD Graphics (Bay Trail):
25.2  fps
med. 1366x768
HD Graphics (Bay Trail):
9.2  fps
Thief

Thief

2014
low 1024x768
HD Graphics 6000:
18  fps
HD Graphics (Bay Trail):
3.1 5.1 ~ 4 fps
med. 1366x768
HD Graphics 6000:
12  fps
HD Graphics (Bay Trail):
3.3  fps
low 1024x768
HD Graphics (Bay Trail):
8.7  fps
med. 1366x768
HD Graphics (Bay Trail):
5.8  fps
low 1024x768
HD Graphics 6000:
40  fps
HD Graphics (Bay Trail):
12.8  fps
med. 1366x768
HD Graphics 6000:
13  fps
HD Graphics (Bay Trail):
6  fps
high 1366x768
HD Graphics 6000:
6.9  fps
low 1024x768
HD Graphics 6000:
32  fps
HD Graphics (Bay Trail):
7.3  fps
med. 1366x768
HD Graphics 6000:
22.2  fps
high 1366x768
HD Graphics 6000:
15.6  fps
ultra 1920x1080
HD Graphics 6000:
5.6  fps
low 1024x768
HD Graphics (Bay Trail):
14  fps
med. 1366x768
HD Graphics (Bay Trail):
8  fps
F1 2013

F1 2013

2013
low 1024x768
HD Graphics (Bay Trail):
12  fps
Fifa 14

Fifa 14

2013
low 1024x768
HD Graphics (Bay Trail):
12.6 18.7 19.9 29.8 33.6 60 ~ 29 fps
med. 1366x768
HD Graphics (Bay Trail):
10.5 19.5 33 ~ 21 fps
high 1366x768
HD Graphics (Bay Trail):
7.8 12.8 22 ~ 14 fps
low 1024x768
HD Graphics 6000:
48  fps
HD Graphics (Bay Trail):
7.7  fps
med. 1366x768
HD Graphics 6000:
36  fps
high 1366x768
HD Graphics 6000:
28  fps
low 1280x720
HD Graphics (Bay Trail):
6.3  fps
low 1024x768
HD Graphics (Bay Trail):
10.2  fps
med. 1366x768
HD Graphics (Bay Trail):
6.1  fps
low 1024x768
HD Graphics (Bay Trail):
11  fps
med. 1366x768
HD Graphics (Bay Trail):
7.8  fps
Dota 2

Dota 2

2013
low 1024x768
HD Graphics (Bay Trail):
18.2 20.8 28.4 31.9 ~ 25 fps
med. 1366x768
HD Graphics (Bay Trail):
9.5 10.4 13.7 19.4 ~ 13 fps
low 1024x768
HD Graphics 6000:
23  fps
HD Graphics (Bay Trail):
4.4  fps
GRID 2

GRID 2

2013
low 1024x768
HD Graphics (Bay Trail):
14.1 16.2 17.9 20.4 23.2 ~ 18 fps
med. 1366x768
HD Graphics (Bay Trail):
12.5 12.6 ~ 13 fps
low 1024x768
HD Graphics 6000:
19  fps
HD Graphics (Bay Trail):
5  fps
med. 1366x768
HD Graphics 6000:
15.7  fps
high 1366x768
HD Graphics 6000:
12  fps
ultra 1920x1080
HD Graphics 6000:
6  fps
low 1280x720
HD Graphics 6000:
42.9 43.9 ~ 43 fps
HD Graphics (Bay Trail):
8.4 8.4 10.9 11.4 12.2 13.3 14.2 14.7 15 ~ 12 fps
med. 1366x768
HD Graphics 6000:
26.4 26.6 ~ 27 fps
HD Graphics (Bay Trail):
3.5 5.3 5.6 5.7 6.3 6.8 6.9 7.1 ~ 6 fps
high 1366x768
HD Graphics 6000:
22.1  fps
HD Graphics (Bay Trail):
2.1 4.8 4.9 5.8 5.9 6.2 ~ 5 fps
ultra 1920x1080
HD Graphics (Bay Trail):
1.2  fps
low 1024x768
HD Graphics (Bay Trail):
39 56.2 69 ~ 55 fps
med. 1366x768
HD Graphics (Bay Trail):
12.3 12.8 14 ~ 13 fps
low 1024x768
HD Graphics 6000:
60 64.7 ~ 62 fps
HD Graphics (Bay Trail):
10 11.7 11.8 12 12.4 12.5 12.5 12.6 12.7 12.9 13.2 13.4 13.7 13.8 14 14.1 14.2 14.4 14.4 14.7 14.8 15 15.3 15.4 15.5 15.5 15.9 15.9 16 16.5 16.9 17.6 18 ~ 14 fps
med. 1366x768
HD Graphics 6000:
33 34.5 ~ 34 fps
HD Graphics (Bay Trail):
5.1 6.1 6.2 6.4 6.7 6.7 6.9 6.9 7 7 7.1 7.1 7.4 7.4 7.4 7.5 7.5 7.6 7.8 7.9 8 8 8.1 8.1 8.2 8.3 8.4 9.2 10.4 ~ 7 fps
high 1366x768
HD Graphics 6000:
22 22.9 ~ 22 fps
HD Graphics (Bay Trail):
3.1 4.5 4.6 4.8 4.8 4.8 4.8 4.9 4.9 5.2 5.2 5.4 5.4 6.1 7.3 ~ 5 fps
ultra 1920x1080
HD Graphics (Bay Trail):
0.3  fps
Crysis 3

Crysis 3

2013
low 1024x768
HD Graphics 6000:
20.9  fps
med. 1366x768
HD Graphics 6000:
13.9  fps
low 1024x768
HD Graphics (Bay Trail):
15.1 23.6 ~ 19 fps
med. 1366x768
HD Graphics (Bay Trail):
5.2 9.7 ~ 7 fps
Far Cry 3

Far Cry 3

2012
low 1024x768
HD Graphics (Bay Trail):
10.3  fps
med. 1366x768
HD Graphics (Bay Trail):
6.2  fps
low 1024x768
HD Graphics (Bay Trail):
10.1  fps
med. 1366x768
HD Graphics (Bay Trail):
6  fps
low 1024x768
HD Graphics (Bay Trail):
12.4  fps
med. 1366x768
HD Graphics (Bay Trail):
7.3  fps
low 1024x768
HD Graphics (Bay Trail):
12.5 14.3 ~ 13 fps
med. 1366x768
HD Graphics (Bay Trail):
9.8 11.2 ~ 11 fps
Torchlight 2

Torchlight 2

2012
low 1024x768
HD Graphics (Bay Trail):
42  fps
low 1024x768
HD Graphics (Bay Trail):
26.1 46.6 ~ 36 fps
med. 1366x768
HD Graphics (Bay Trail):
20 23.9 ~ 22 fps
low 1024x768
HD Graphics (Bay Trail):
12.9 13.2 ~ 13 fps
med. 1366x768
HD Graphics (Bay Trail):
7.5 8.1 ~ 8 fps
low 1024x768
HD Graphics 6000:
57  fps
HD Graphics (Bay Trail):
28  fps
med. 1366x768
HD Graphics 6000:
36  fps
high 1366x768
HD Graphics 6000:
23  fps
ultra 1920x1080
HD Graphics 6000:
10  fps
low 1024x768
HD Graphics 6000:
68  fps
HD Graphics (Bay Trail):
9.2 10.7 14.8 15.6 16.5 18.4 19.3 ~ 15 fps
med. 1366x768
HD Graphics 6000:
39  fps
HD Graphics (Bay Trail):
6 9.5 10.3 11.4 12 ~ 10 fps
high 1366x768
HD Graphics 6000:
31  fps
HD Graphics (Bay Trail):
7.9 9.6 ~ 9 fps
ultra 1920x1080
HD Graphics 6000:
24  fps
HD Graphics (Bay Trail):
5 5.9 ~ 5 fps
low 1280x720
HD Graphics (Bay Trail):
8.5 12.4 ~ 10 fps
high 1366x768
HD Graphics (Bay Trail):
8.1  fps
Alan Wake

Alan Wake

2012
low 1024x768
HD Graphics (Bay Trail):
5.8  fps
med. 1366x768
HD Graphics (Bay Trail):
2.3  fps
Anno 2070

Anno 2070

2011
low 1024x768
100%
NVS 4200M:
47.7  fps
36%
HD Graphics (Bay Trail):
11.8 14.6 15 15.1 15.3 16.1 16.5 16.8 16.8 17.4 17.4 18 18 18.2 19.7 22.8 ~ 17 fps
med. 1366x768
100%
NVS 4200M:
17.6  fps
40%
HD Graphics (Bay Trail):
6.3 6.4 6.4 6.8 6.9 7.2 7.5 7.5 7.6 8 8.1 9.3 ~ 7 fps
high 1366x768
100%
NVS 4200M:
11.7  fps
34%
HD Graphics (Bay Trail):
3.6 4 4 4.1 5.5 ~ 4 fps
ultra 1920x1080
HD Graphics (Bay Trail):
1.1  fps
low 1280x720
HD Graphics (Bay Trail):
11 11.8 ~ 11 fps
med. 1366x768
HD Graphics (Bay Trail):
10  fps
low 1024x768
HD Graphics (Bay Trail):
8  fps
med. 1366x768
HD Graphics (Bay Trail):
4.8  fps
low 1024x768
HD Graphics (Bay Trail):
19.7  fps
Dirt 3

Dirt 3

2011
low 800x600
100%
NVS 4200M:
95  fps
33%
HD Graphics (Bay Trail):
24.1 36.9 ~ 31 fps
med. 1024x768
100%
NVS 4200M:
36  fps
36%
HD Graphics (Bay Trail):
12.9 13.3 ~ 13 fps
high 1360x768
100%
NVS 4200M:
24  fps
ultra 1920x1080
100%
NVS 4200M:
12  fps
Fifa 11

Fifa 11

2010
med. 1024x768
100%
NVS 4200M:
108.6 116 ~ 112 fps
high 1360x768
100%
NVS 4200M:
74 76 ~ 75 fps
Civilization 5

Civilization 5

2010
low 1024x768
HD Graphics (Bay Trail):
9.3  fps
Mafia 2

Mafia 2

2010
low 800x600
100%
NVS 4200M:
41  fps
20%
HD Graphics (Bay Trail):
5 10.5 ~ 8 fps
med. 1024x768
100%
NVS 4200M:
24.7 31 ~ 28 fps
20%
HD Graphics (Bay Trail):
5.6  fps
high 1360x768
100%
NVS 4200M:
19.1 25 ~ 22 fps
17%
HD Graphics (Bay Trail):
3.7  fps
ultra 1920x1080
100%
NVS 4200M:
14  fps
low 1024x768
100%
NVS 4200M:
149  fps
79%
HD Graphics 6000:
118  fps
31%
HD Graphics (Bay Trail):
32 48 49 53.3 ~ 46 fps
med. 1360x768
100%
NVS 4200M:
30  fps
143%
HD Graphics 6000:
43  fps
27%
HD Graphics (Bay Trail):
6 9 9 ~ 8 fps
high 1360x768
100%
NVS 4200M:
19  fps
111%
HD Graphics 6000:
21  fps
16%
HD Graphics (Bay Trail):
3  fps
ultra 1920x1080
HD Graphics 6000:
14  fps
low 800x600
HD Graphics (Bay Trail):
12  fps
med. 1360x768
HD Graphics (Bay Trail):
9  fps
low 1024x768
HD Graphics (Bay Trail):
12.8  fps
med. 1366x768
HD Graphics (Bay Trail):
9  fps
Risen

Risen

2009
low 800x600
HD Graphics (Bay Trail):
23.1 25 26.2 28.8 ~ 26 fps
med. 1024x768
100%
NVS 4200M:
22 25.5 ~ 24 fps
42%
HD Graphics (Bay Trail):
8.7 9 10.4 11.1 ~ 10 fps
high 1366x768
100%
NVS 4200M:
14 16.1 ~ 15 fps
Resident Evil 5

Resident Evil 5

2009
low 800x600
HD Graphics (Bay Trail):
17.1 26.1 26.2 26.3 ~ 24 fps
Need for Speed Shift

Need for Speed Shift

2009
med. 1024x768
100%
NVS 4200M:
33  fps
high 1366x768
100%
NVS 4200M:
23  fps
Colin McRae: DIRT 2

Colin McRae: DIRT 2

2009
med. 1024x768
100%
NVS 4200M:
43.2 48 ~ 46 fps
high 1360x768
100%
NVS 4200M:
19 19.1 ~ 19 fps
Anno 1404

Anno 1404

2009
low 1024x768
100%
NVS 4200M:
100.7  fps
ultra 1280x1024
100%
NVS 4200M:
12.9  fps
Trackmania Nations Forever

Trackmania Nations Forever

2008
low 640x480
HD Graphics (Bay Trail):
42.9 69.8 69.8 71.6 72 72.7 75.1 75.5 76 76.7 77.1 80.9 83.1 83.9 84.3 84.8 85.6 86.9 90.2 ~ 77 fps
high 1024x768
HD Graphics (Bay Trail):
10.3 14 17.7 18 18.1 18.1 18.7 18.8 19.3 19.4 19.4 19.8 19.8 20.5 20.5 20.6 21 21.5 23.6 ~ 19 fps
ultra 1920x1080
HD Graphics (Bay Trail):
6.4 7.7 ~ 7 fps
Crysis - GPU Benchmark

Crysis - GPU Benchmark

2007
low 1024x768
HD Graphics (Bay Trail):
18.9 19 ~ 19 fps
med. 1024x768
HD Graphics (Bay Trail):
7.6 8.7 ~ 8 fps
World of Warcraft

World of Warcraft

2005
low 800x600
HD Graphics 6000:
123  fps
HD Graphics (Bay Trail):
33 33 35 38 44 46.2 47 48 49 49 50 52 ~ 44 fps
med. 1024x768
HD Graphics 6000:
47  fps
HD Graphics (Bay Trail):
9.6 11.5 20 22 23 25.3 26 26 28 34 ~ 23 fps
high 1280x1024
HD Graphics 6000:
18  fps
HD Graphics (Bay Trail):
12 12 13.5 ~ 13 fps
ultra 1920x1080
HD Graphics 6000:
10  fps
HD Graphics (Bay Trail):
5.6 7 ~ 6 fps
Quake 3 Arena - Timedemo

Quake 3 Arena - Timedemo

1999
high 1024x768
HD Graphics (Bay Trail):
190  fps

Average Gaming NVIDIA NVS 4200M → 100%

Average Gaming 30-70 fps → 100%

Average Gaming Intel HD Graphics 6000 → 111%

Average Gaming 30-70 fps → 143%

Average Gaming Intel HD Graphics (Bay Trail) → 29%

Average Gaming 30-70 fps → 32%

NVIDIA NVS 4200MIntel HD Graphics 6000Intel HD Graphics (Bay Trail)
lowmed.highultraQHD4Klowmed.highultraQHD4Klowmed.highultraQHD4K
Total War: Three Kingdoms18.4
X-Plane 11.1118.212.911.6
Team Fortress 264.237.426.723.4
Dirt 441.36
Rocket League28.412.6
Farming Simulator 175832.718.9
Mirror's Edge Catalyst20.8
Overwatch25
Rainbow Six Siege28.918.210.99.1
Just Cause 318.614
Call of Duty: Black Ops 324.616.60
FIFA 16533921.3
World of Warships52.31612.1
Metal Gear Solid V3524.89.510.8
Mad Max19.3
Dota 2 Reborn54.733.916.715.424.79.75.55.4
Batman: Arkham Knight1110
The Witcher 314
Dirt Rally9322.812.9236
Battlefield Hardline35.326.99.17.35.1
Evolve18.713.53.21.7
Dragon Age: Inquisition20.916.86.174.6
Assassin's Creed Unity04.32.4
Call of Duty: Advanced Warfare3317.6
Civilization: Beyond Earth40.920.813.310.7114.3
F1 2014553721131312
Ryse: Son of Rome19123.72.5
Alien: Isolation3426.419.15.1
Fifa 155035.723.312.48.5
Sims 414445.421.814.1557
GRID: Autosport943222133713
Thief181243.3
X-Plane 10.2540136.912.86
Battlefield 43222.215.65.67.3
Total War: Rome II4836287.7
Company of Heroes 2234.4
Metro: Last Light1915.71265
BioShock Infinite432722.0812651.2
Tomb Raider62342214750.3
Crysis 320.913.9
Dirt Showdown5736231028
Diablo III68393124151095
StarCraft 214930191184321144683
World of Warcraft1234718104423136
NVIDIA NVS 4200MIntel HD Graphics 6000Intel HD Graphics (Bay Trail)
lowmed.highultraQHD4Klowmed.highultraQHD4Klowmed.highultraQHD4K
< 30 fps
< 60 fps
< 120 fps
≥ 120 fps


1

1

1


< 30 fps
< 60 fps
< 120 fps
≥ 120 fps
17
17
6
2
21
11

21
4

15


< 30 fps
< 60 fps
< 120 fps
≥ 120 fps
26
4

20


7


5


For more games that might be playable and a list of all games and graphics cards visit our Gaming List

v1.33
log 25. 06:48:27

#0 ran 0s before starting gpusingle class +0s ... 0s

#1 checking url part for id 2439 +0s ... 0s

#2 checking url part for id 5943 +0s ... 0s

#3 checking url part for id 4922 +0s ... 0s

#4 redirected to Ajax server, took 1750826907s time from redirect:0 +0s ... 0s

#5 did not recreate cache, as it is less than 5 days old! Created at Wed, 25 Jun 2025 05:20:07 +0200 +0s ... 0s

#6 composed specs +0.02s ... 0.02s

#7 did output specs +0s ... 0.02s

#8 start showIntegratedCPUs +0s ... 0.02s

#9 getting avg benchmarks for device 2439 +0.022s ... 0.041s

#10 got single benchmarks 2439 +0.007s ... 0.049s

#11 getting avg benchmarks for device 5943 +0.004s ... 0.052s

#12 got single benchmarks 5943 +0.005s ... 0.057s

#13 getting avg benchmarks for device 4922 +0.003s ... 0.06s

#14 got single benchmarks 4922 +0.071s ... 0.131s

#15 got avg benchmarks for devices +0s ... 0.131s

#16 No cached benchmark found, getting uncached values +0.01s ... 0.141s

#17 No cached benchmark found, getting uncached values +0s ... 0.142s

#18 min, max, avg, median took s +0.038s ... 0.18s

#19 before gaming benchmark output +0s ... 0.18s

#20 Got 563 rows for game benchmarks. +0.029s ... 0.208s

#21 composed SQL query for gamebenchmarks +0s ... 0.208s

#22 got data and put it in $dataArray +0.004s ... 0.213s

#23 benchmarks composed for output. +0.028s ... 0.241s

#24 calculated avg scores. +0s ... 0.241s

#25 return log +0.001s ... 0.241s

Please share our article, every link counts!
Mail Logo
> Expert Reviews and News on Laptops, Smartphones and Tech Innovations > Benchmarks / Tech > Graphics Card Comparison - Head 2 Head
Redaktion, 2017-09- 8 (Update: 2023-07- 1)