Notebookcheck Logo

NVIDIA T600 vs Nvidia RTX A2000 vs NVIDIA Quadro RTX 5000 Max-Q

NVIDIA T600

► remove from comparison NVIDIA T600

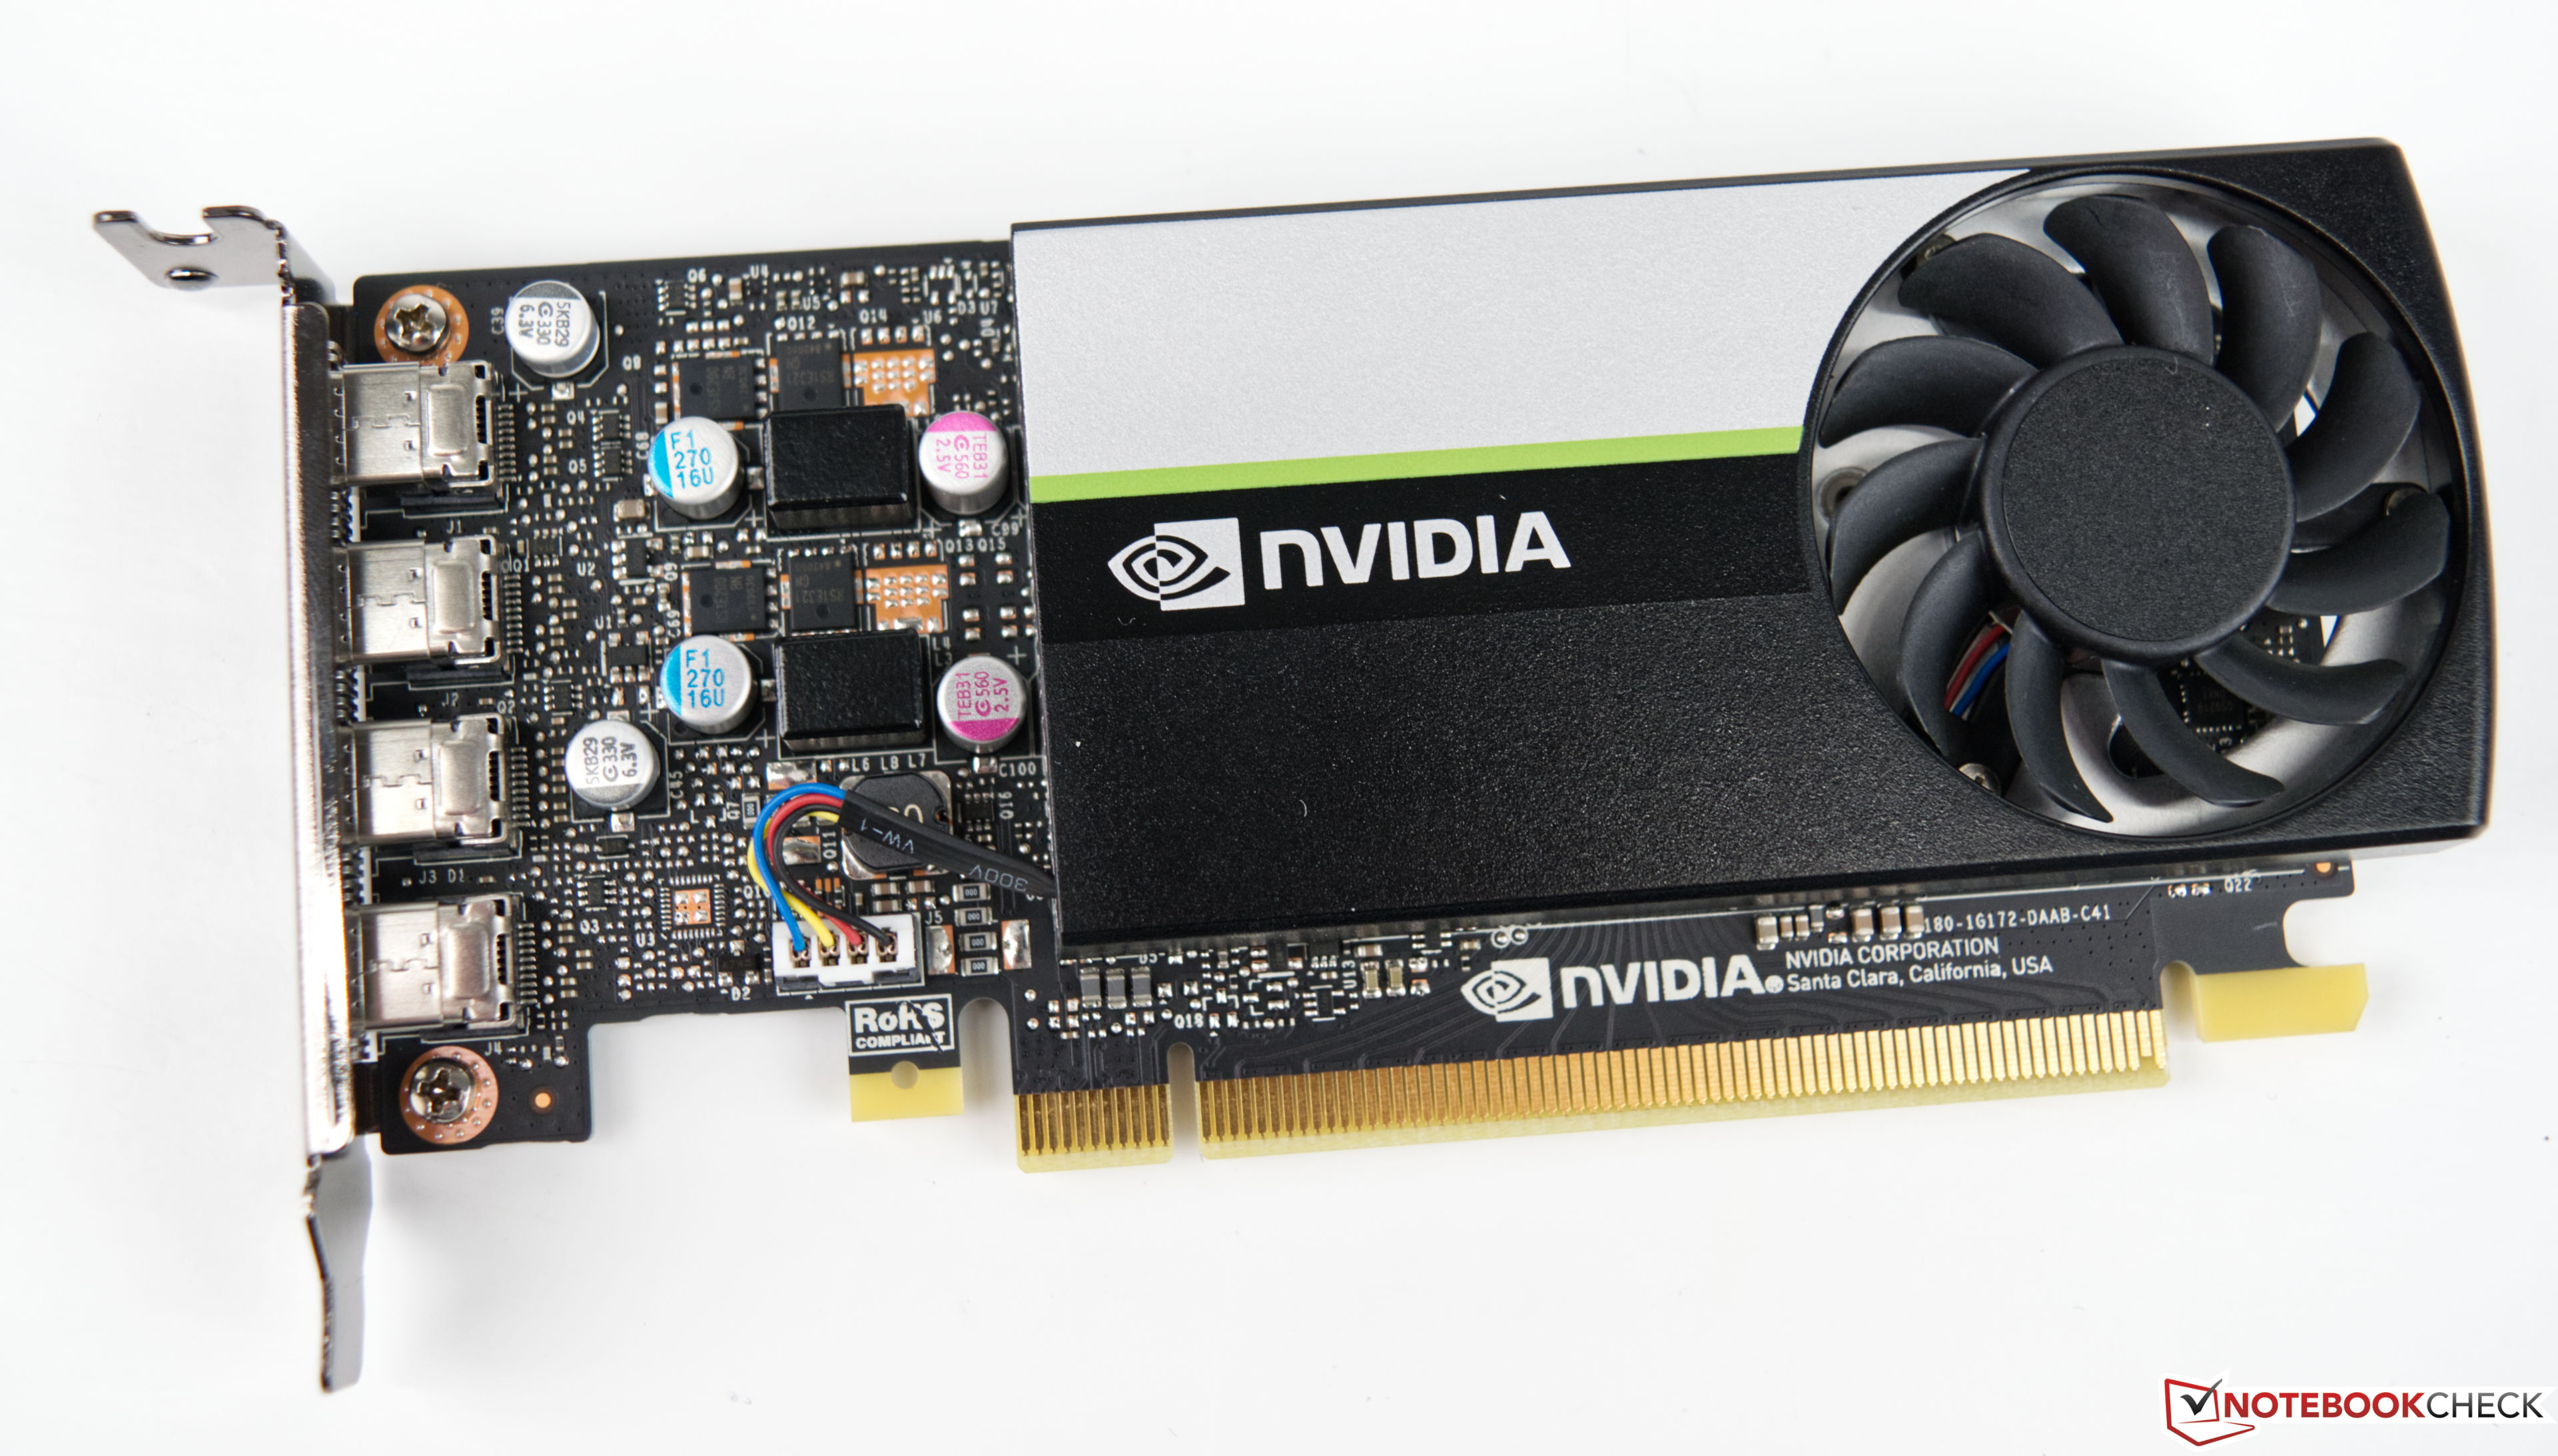
The Nvidia T600 Desktop GPU is a professional graphics card for workstations that is based on the Turing architecture (TU117 chip). The desktop version only offers 640 of the 1024 cores and therefore also less than the T600 mobile (896 CUDA cores). The card offers 4 GB GDDR6 graphics memory connected with a 128 bit bus (up to 160 GB/s bandwidth). The T600 supports certified drivers (former Quadro line) for professional applications like CAD, 3D modelling, DCC, medicine, or visualization applications.

The maximum power consumption of the card is rated at 40W.

Nvidia RTX A2000

► remove from comparison NVIDIA RTX A2000

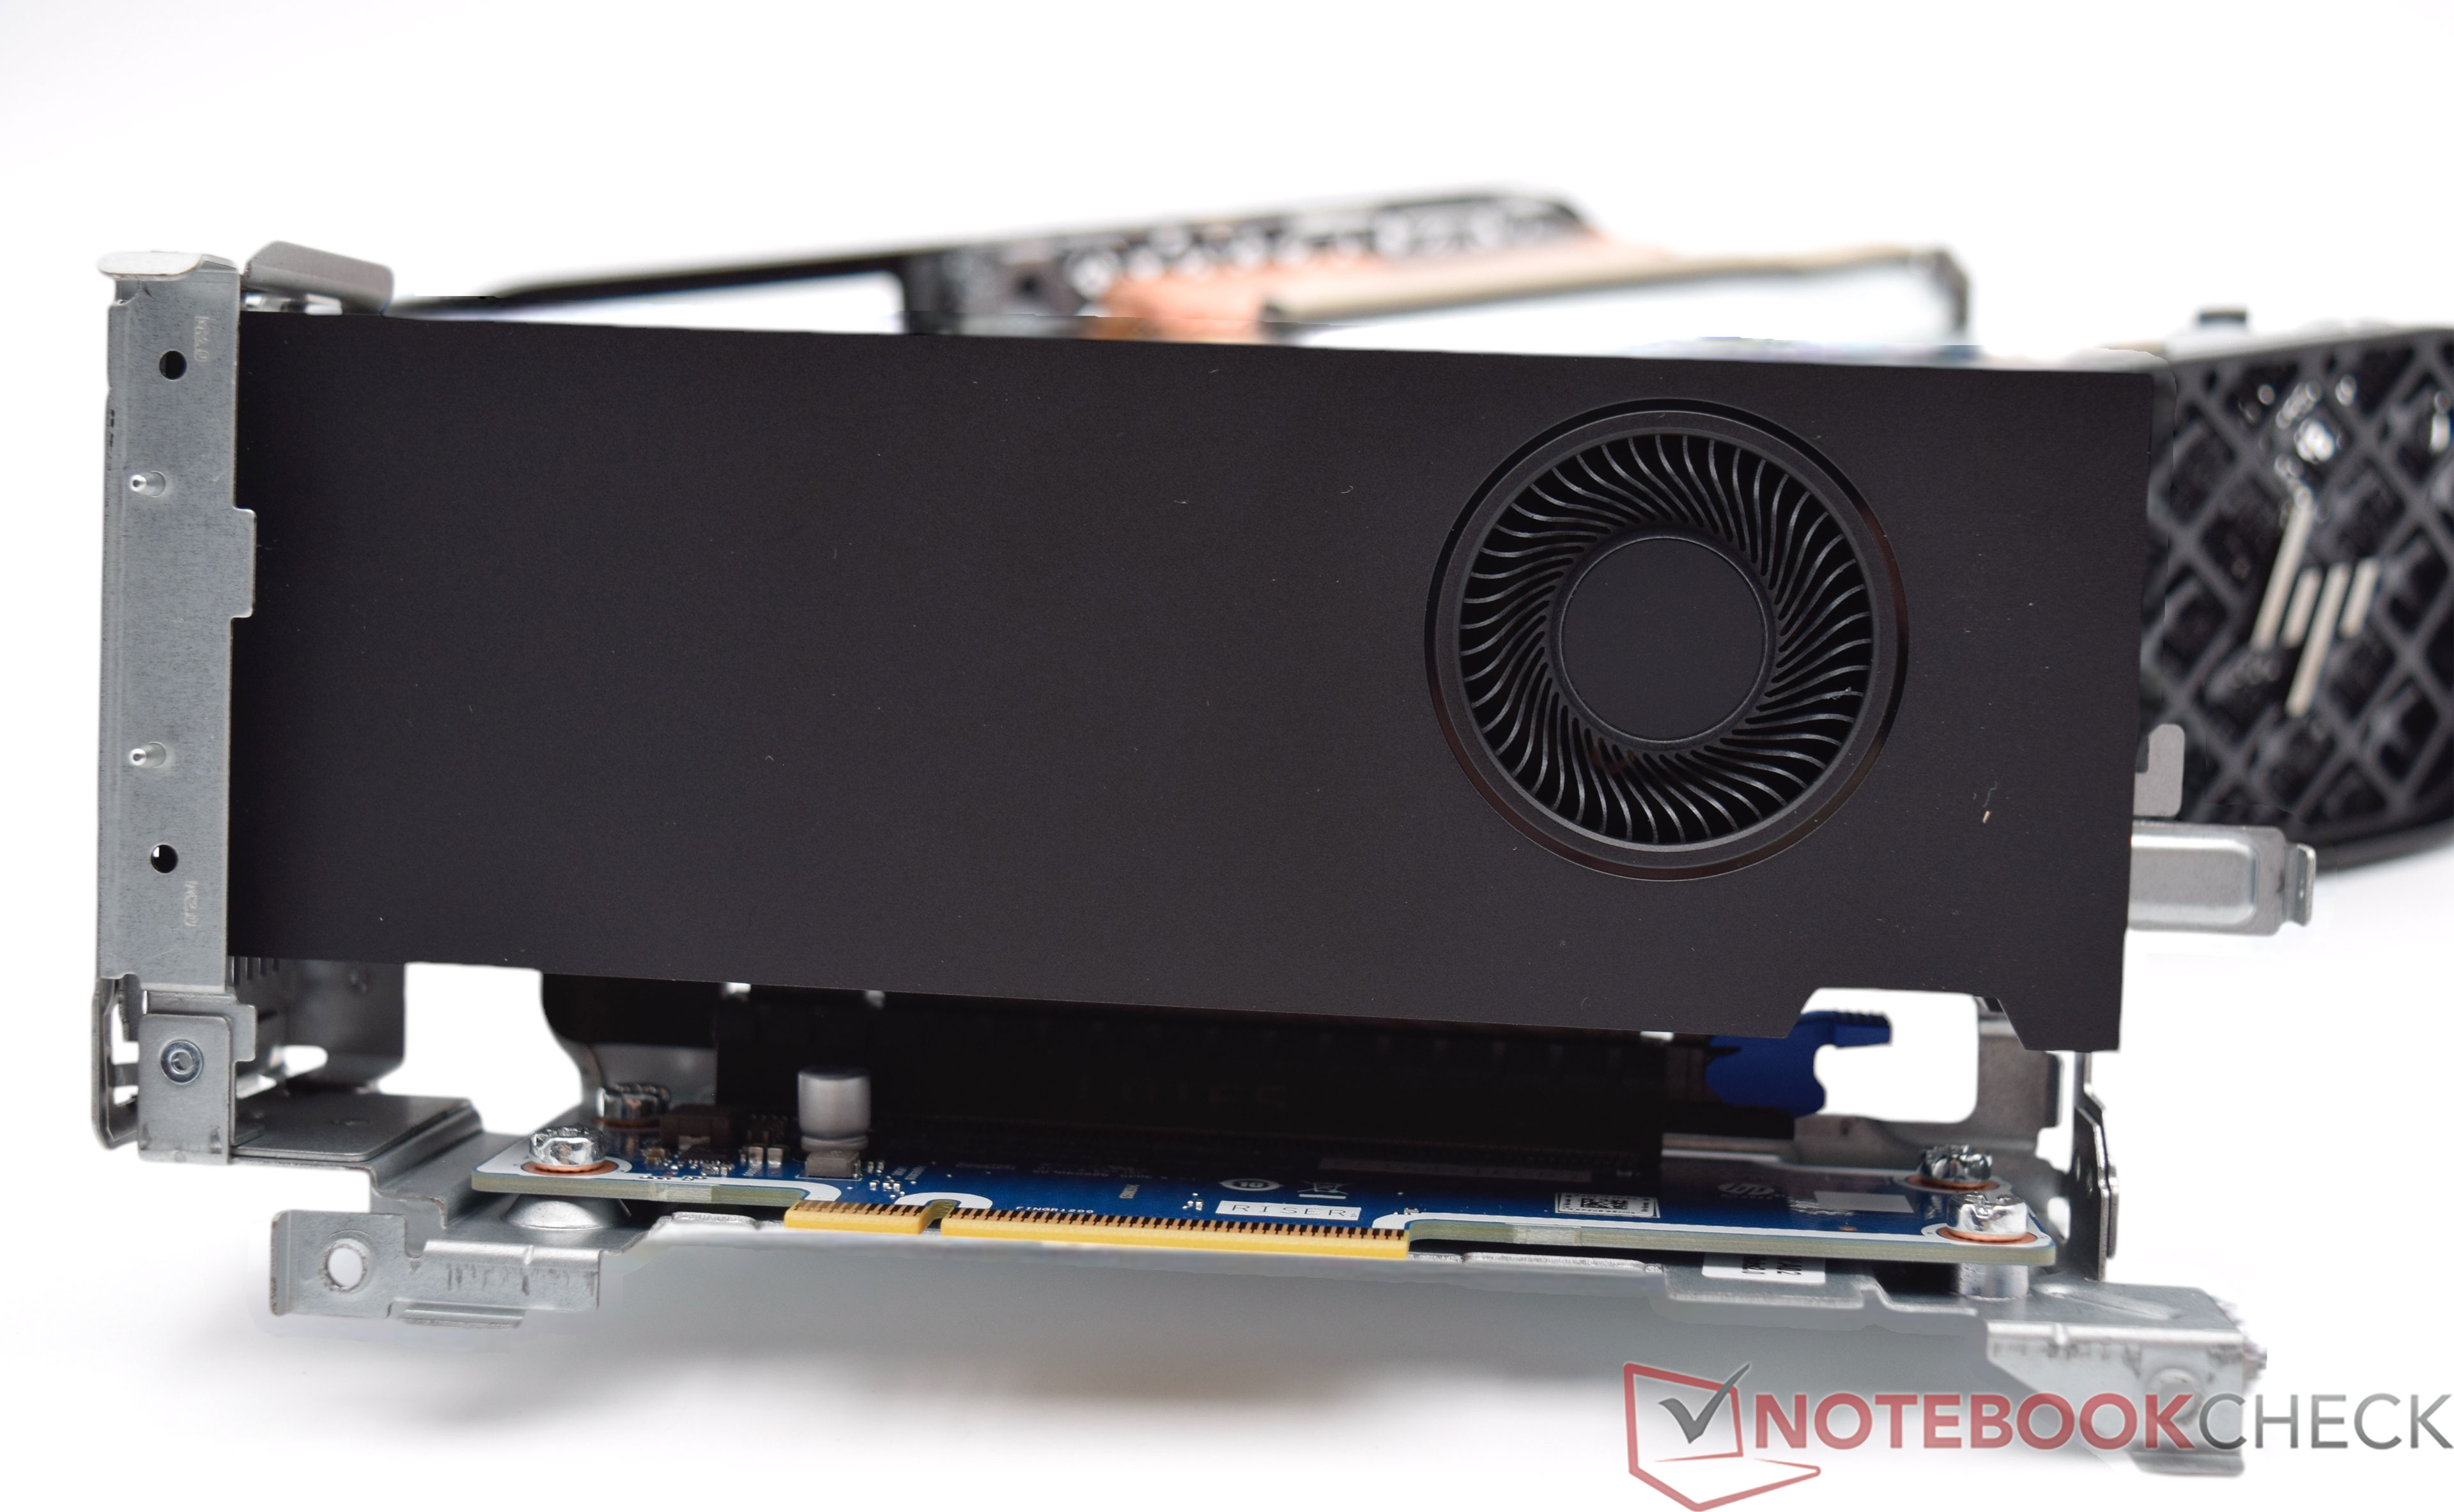
The Nvidia RTX A2000 Desktop GPU is a professional graphics card for small workstation PCs. It is based on the GA106 graphics chip, which is used in the GeForce RTX 3050 or GeForce RTX 3060 consumer graphics cards, among others. However, the GA106 only works with 3,328 active shader units, as well as 26 RT cores and 104 tensor units. The VRAM comprises 12 GB GDDR6 and communicates via a 192-bit memory interface. This results in a memory bandwidth of 288 GB/s.


The professional graphics cards from Nvidia offer certified drivers that are optimized for stability and performance in professional applications (CAD, DCC, medical, prospecting, visualization applications). This results in many advantages over consumer graphics cards.


Compact design and flexibility:


The RTX A2000 is designed in a low-profile form factor, making it ideal for smaller workstations or systems where space is a limited resource. Despite its compact size, the Nvidia RTX A2000 offers considerable computing power.


The graphics card is ideal for 3D modeling, CAD applications, video editing and visual effects where high precision and speed are paramount. Thanks to the combination of CUDA, Tensor and Raytracing cores, the Nvidia RTX A2000 offers significant performance improvements in the areas of real-time rendering and AI-supported image processing.


Energy efficiency and power consumption:


With a TDP of just 70 watts, the Nvidia RTX A2000 is one of the most energy efficient workstation GPUs on the market. This efficiency makes it possible to be more productive in workflows that require intensive graphics processing without compromising system performance or consuming excessive power.


In summary, the NVIDIA RTX A2000 is a compact, powerful and energy-efficient solution for professional users.

NVIDIA Quadro RTX 5000 Max-Q

► remove from comparison

The Nvidia Quadro RTX 5000 with Max-Q Design is a professional high-end graphics card for powerful laptops and mobile workstations. The Max-Q variants are lower clocked versions that are running more efficient and can be used in smaller chassis than the regular versions. It is based on the same TU104 chip as the consumer GeForce RTX 2080 Max-Q but offers more shaders (128 more). Compared to the desktop RTX 5000, the mobile variant offers lower clock speeds. There are different versions available with 90, 85 and 80 Watt TGP power consumption.

ModelTGP (W)Base (MHz)Boost (MHz)
Quadro RTX 5000 Desktop23016201815
Quadro RTX 5000 Mobile15013501770
Quadro RTX 5000 Mobile11010351545
Quadro RTX 5000 Max-Q909301455
Quadro RTX 5000 Max-Q857651395
Quadro RTX 5000 Max-Q806001350

The Quadro GPUs offer certified drivers, which are optimized for stability and performance in professional applications (CAD, DCC, medical, prospection, and visualizing applications). The performance in these areas is therefore much better compared to corresponding consumer GPUs.

Features

NVIDIA manufacturers the TU104 chip on a 12 nm FinFET process and includes features like Deep Learning Super Sampling (DLSS) and Real-Time Ray Tracing (RTRT), which should combine to create more realistic lighting effects than older GPUs based on the company's Pascal architecture (if the games support it). The Quadro RTX 5000 is also DisplayPort 1.4 ready, while there is also support for HDMI 2.0b, HDR, Simultaneous Multi-Projection (SMP) and H.265 video en/decoding (PlayReady 3.0).

Performance

Compared to the regular Quadro RTX 5000 version, the Max-Q variants can be up to 27% slower (lower Turbo speeds) and therefore reach levels of the slower RTX 4000. Compared to consumer verisons, the Quadro variants have advantages due to the professional drivers and the large VRAM.

The still relatively high power consumption of the RTX5000 Max-Q makes the card most suited for big laptops.

NVIDIA T600Nvidia RTX A2000NVIDIA Quadro RTX 5000 Max-Q
Quadro Turing Series
Quadro RTX 6000 (Laptop) 4608 @ 1.28 - 1.46 GHz384 Bit @ 14000 MHz
Quadro RTX 5000 (Laptop) 3072 @ 1.04 - 1.55 GHz256 Bit @ 14000 MHz
Quadro RTX 5000 Max-Q 3072 @ 0.6 - 1.35 GHz256 Bit @ 14000 MHz
Quadro RTX 4000 (Laptop) 2560 @ 1.11 - 1.56 GHz256 Bit @ 14000 MHz
Quadro RTX 4000 Max-Q 2560 @ 0.78 - 1.38 GHz256 Bit @ 14000 MHz
Quadro RTX 3000 (Laptop) 1920 @ 0.95 - 1.38 GHz192 Bit @ 14000 MHz
Quadro RTX 3000 Max-Q 1920 @ 0.6 - 1.22 GHz192 Bit @ 14000 MHz
Quadro T2000 (Laptop) 1024 @ 1.58 - 1.79 GHz128 Bit @ 8000 MHz
Quadro T2000 Max-Q 1024 @ 0.93 - 1.5 GHz128 Bit @ 8000 MHz
Quadro T1000 (Laptop) 768 @ 1.4 - 1.46 GHz128 Bit @ 8000 MHz
T1000 896 @ 1.07 - 1.4 GHz128 Bit @ 10000 MHz
T1200 Laptop GPU 1024 @ 0.86 - 1.43 GHz128 Bit @ 10000 MHz
Quadro T1000 Max-Q 768 @ 0.8 - 1.46 GHz128 Bit @ 8000 MHz
T600 Laptop GPU 896 @ 1.4 GHz128 Bit @ 10000 MHz
T550 Laptop GPU 1024 @ 1.07 - 1.67 GHz64 Bit @ 12000 MHz
T500 Laptop GPU 896 @ 1.37 - 1.7 GHz64 Bit @ 10000 MHz
T600 640 @ 0.74 - 1.34 GHz128 Bit @ 10000 MHz
RTX A5500 Laptop GPU 7424 256 Bit @ 16000 MHz
RTX A4500 Laptop GPU 5888 @ 0.93 - 1.5 GHz256 Bit @ 16000 MHz
RTX A5000 Laptop GPU 6144 @ 1.22 - 1.77 GHz256 Bit @ 14000 MHz
RTX A4000 Laptop GPU 5120 @ 0.78 - 1.68 GHz256 Bit @ 12000 MHz
RTX A3000 Laptop GPU 4096 @ 1.08 - 1.56 GHz192 Bit @ 14000 MHz
RTX A2000 3328 @ 0.56 - 1.2 GHz192 Bit @ 12000 MHz
RTX A2000 Laptop GPU 2560 @ 0.89 - 1.69 GHz128 Bit @ 14000 MHz
RTX A1000 Laptop GPU 2048 128 Bit @ 14000 MHz
RTX A500 Laptop GPU 2048 64 Bit @ 14000 MHz
Quadro RTX 6000 (Laptop) 4608 @ 1.28 - 1.46 GHz384 Bit @ 14000 MHz
Quadro RTX 5000 (Laptop) 3072 @ 1.04 - 1.55 GHz256 Bit @ 14000 MHz
Quadro RTX 5000 Max-Q 3072 @ 0.6 - 1.35 GHz256 Bit @ 14000 MHz
Quadro RTX 4000 (Laptop) 2560 @ 1.11 - 1.56 GHz256 Bit @ 14000 MHz
Quadro RTX 4000 Max-Q 2560 @ 0.78 - 1.38 GHz256 Bit @ 14000 MHz
Quadro RTX 3000 (Laptop) 1920 @ 0.95 - 1.38 GHz192 Bit @ 14000 MHz
Quadro RTX 3000 Max-Q 1920 @ 0.6 - 1.22 GHz192 Bit @ 14000 MHz
Quadro T2000 (Laptop) 1024 @ 1.58 - 1.79 GHz128 Bit @ 8000 MHz
Quadro T2000 Max-Q 1024 @ 0.93 - 1.5 GHz128 Bit @ 8000 MHz
Quadro T1000 (Laptop) 768 @ 1.4 - 1.46 GHz128 Bit @ 8000 MHz
T1000 896 @ 1.07 - 1.4 GHz128 Bit @ 10000 MHz
T1200 Laptop GPU 1024 @ 0.86 - 1.43 GHz128 Bit @ 10000 MHz
Quadro T1000 Max-Q 768 @ 0.8 - 1.46 GHz128 Bit @ 8000 MHz
T600 Laptop GPU 896 @ 1.4 GHz128 Bit @ 10000 MHz
T550 Laptop GPU 1024 @ 1.07 - 1.67 GHz64 Bit @ 12000 MHz
T500 Laptop GPU 896 @ 1.37 - 1.7 GHz64 Bit @ 10000 MHz
T600 640 @ 0.74 - 1.34 GHz128 Bit @ 10000 MHz
ArchitectureTuringQuadro AmpereTuring
Pipelines640 - unified3328 - unified3072 - unified
TMUs40104
ROPs3248
Core Speed735 - 1335 (Boost) MHz562 - 1200 (Boost) MHz600 - 930 - 1350 - 1455 (Boost) MHz
Memory Speed10000 effective = 1250 MHz12000 effective = 1500 MHz14000 MHz
Memory Bus Width128 Bit192 Bit256 Bit
Memory TypeGDDR6GDDR6GDDR6
Max. Amount of Memory4 GB12 GB16 GB
Shared Memorynonono
Memory Bandwidth160 GB/s288 GB/s
APIDirectX 12_1, Shader 6.6, OpenGL 4.6, OpenCL 3.0, Vulkan 1.3DirectX 12 Ultimate (12_2), Shader 6.8, OpenGL 4.6, OpenCL 3.0, Vulkan 1.3DirectX 12_1, OpenGL 4.6
Power Consumption40 Watt70 Watt80 - 90 Watt
Transistors4.7 Billion12 Billion13.6 Billion
Die Size 200 mm² 276 mm²
technology12 nm8 nm12 nm
PCIe3.0 x164.0 x16
Displays4 Displays (max.), DisplayPort 4x mini-DisplayPort 1.4a4 Displays (max.), DisplayPort 1.4a
Date of Announcement12.04.2021 23.11.2021 27.05.2019
CodenameGA106N19E-Q5 MAX-Q
Raytracing Cores26
Tensor / AI Cores104
Theoretical Performance7987 TFLOPS FP16, 7987 TFLOPS FP32, 0.1248 TFLOPS FP64
Features4x DisplayPort 1.4a, PCIe 4.0 x16NVLink, DLSS, Raytraycing, VR Ready, G-SYNC, Vulkan, Multi Monitor
Notebook Sizelarge

Benchmarks

Performance Rating - 3DMark 11 + Fire Strike + Time Spy - T600
2.5 pt (7%)
Restrict / Search: Model: Max. age: years
Performance Rating - 3DMark 11 + Fire Strike + Time Spy - RTX A2000
5.6 pt (17%)
Restrict / Search: Model: Max. age: years
Performance Rating - 3DMark 11 + Fire Strike + Time Spy - Quadro RTX 5000 Max-Q
7.4 pt (22%)
Restrict / Search: Model: Max. age: years
3DMark - 3DMark Time Spy Score
100%
T600 +
2496 Points (7%)
6282 Points (17%)
min: 6801     avg: 7289     median: 7282.5 (19%)     max: 7920 Points
3DMark - 3DMark Time Spy Graphics
100%
T600 +
2195 Points (4%)
5675 Points (12%)
min: 6999     avg: 7432     median: 7396 (15%)     max: 7977 Points
3DMark - 3DMark Ice Storm Unlimited Graphics
100%
T600 +
304731 Points (31%)
561627 Points (57%)
min: 414147     avg: 428807     median: 433183 (44%)     max: 439090 Points
3DMark - 3DMark Ice Storm Extreme Graphics
100%
T600 +
152912 Points (18%)
310737 Points (36%)
47453 Points (6%)
3DMark - 3DMark Cloud Gate Score
100%
T600 +
31922 Points (30%)
56330 Points (53%)
min: 25769     avg: 34615     median: 32096 (30%)     max: 52005 Points
3DMark - 3DMark Cloud Gate Graphics
100%
T600 +
40917 Points (10%)
94407 Points (23%)
min: 50993     avg: 78524     median: 64768 (16%)     max: 126073 Points
3DMark - 3DMark Fire Strike Standard Score
100%
T600 +
6284 Points (9%)
14566 Points (22%)
min: 16005     avg: 16773     median: 16600.5 (25%)     max: 18226 Points
3DMark - 3DMark Fire Strike Standard Graphics
100%
T600 +
6552 Points (6%)
14934 Points (14%)
min: 18247     avg: 19825     median: 19790 (18%)     max: 21115 Points
3DMark - 3DMark Ice Storm Graphics
100%
T600 +
182459 Points (20%)
369883 Points (41%)
min: 70493     avg: 94644     median: 94644 (10%)     max: 118795 Points
3DMark - 3DMark Night Raid
48115 Points (45%)
3DMark - 3DMark Night Raid Graphics Score
68223 Points (26%)
3DMark 11 - 3DM11 Performance Score
100%
T600 +
9497 Points (11%)
20964 Points (25%)
min: 19250     avg: 21300     median: 20890 (25%)     max: 23789 Points
3DMark 11 - 3DM11 Performance GPU
100%
T600 +
8694 Points (7%)
19978 Points (15%)
min: 24156     avg: 26602     median: 26465 (20%)     max: 28524 Points
3DMark Vantage
3DM Vant. Perf. total + NVIDIA T600
3DMark Vantage - 3DM Vant. Perf. total
100%
T600 +
344838 Points (100%)
3DM Vant. Perf. total + Nvidia RTX A2000
76281 Points (22%)
3DM Vant. Perf. total + NVIDIA Quadro RTX 5000 Max-Q
min: 52289     avg: 53221     median: 53221 (15%)     max: 54153 Points
3DM Vant. Perf. GPU no PhysX + NVIDIA T600
3DMark Vantage - 3DM Vant. Perf. GPU no PhysX
100%
T600 +
30400 Points (17%)
3DM Vant. Perf. GPU no PhysX + Nvidia RTX A2000
71338 Points (39%)
3DM Vant. Perf. GPU no PhysX + NVIDIA Quadro RTX 5000 Max-Q
min: 62319     avg: 62862     median: 62861.5 (34%)     max: 63404 Points
3DMark 05 - 3DMark 05 - Standard
100%
1 T600 +
46380 Points (51%)
63697 Points (70%)
3DMark 06 3DMark 06 - Standard 1280x1024 + NVIDIA T600
3DMark 06
100%
T600 +
43997 Points (57%)
3DMark 06 - Standard 1280x1024 + Nvidia RTX A2000
43178 Points (56%)
3DMark 06 - Standard 1280x1024 + NVIDIA Quadro RTX 5000 Max-Q
min: 38739     avg: 40510     median: 40509.5 (53%)     max: 42280 Points
Unigine Valley 1.0 - Unigine Valley 1.0 DX
100%
T600 +
32.7 fps (10%)
72.1 fps (22%)
94.6 fps (29%)
Unigine Heaven 3.0 - Unigine Heaven 3.0 DX 11
236.6 fps (78%)
Unigine Heaven 3.0 - Unigine Heaven 3.0 OpenGL
174.6 fps (77%)
Unigine Heaven 2.1 - Heaven 2.1 high
236.1 fps (44%)
Blender - Blender 3.3 Classroom CUDA *
70 Seconds (10%)
Blender - Blender 3.3 Classroom OPTIX *
37 Seconds (14%)
SPECviewperf 12
specvp12 sw-03 + NVIDIA T600
SPECviewperf 12 - specvp12 sw-03
100%
T600 +
115 fps (29%)
specvp12 sw-03 + Nvidia RTX A2000
135 fps (33%)
specvp12 sw-03 + NVIDIA Quadro RTX 5000 Max-Q
min: 106.8     avg: 125.7     median: 122.8 (30%)     max: 156.9 fps
specvp12 snx-02 + NVIDIA T600
SPECviewperf 12 - specvp12 snx-02
100%
T600 +
68.6 fps (10%)
specvp12 snx-02 + Nvidia RTX A2000
125 fps (18%)
specvp12 snx-02 + NVIDIA Quadro RTX 5000 Max-Q
min: 120.7     avg: 139.8     median: 138.4 (20%)     max: 165 fps
specvp12 showcase-01 + NVIDIA T600
SPECviewperf 12 - specvp12 showcase-01
100%
T600 +
35.3 fps (6%)
specvp12 showcase-01 + Nvidia RTX A2000
79 fps (14%)
specvp12 showcase-01 + NVIDIA Quadro RTX 5000 Max-Q
min: 89     avg: 95.8     median: 96.5 (17%)     max: 100.3 fps
specvp12 mediacal-01 + NVIDIA T600
SPECviewperf 12 - specvp12 mediacal-01
100%
T600 +
19.5 fps (5%)
specvp12 mediacal-01 + Nvidia RTX A2000
48 fps (12%)
specvp12 mediacal-01 + NVIDIA Quadro RTX 5000 Max-Q
min: 57.8     avg: 62.6     median: 62.7 (16%)     max: 66.4 fps
specvp12 maya-04 + NVIDIA T600
SPECviewperf 12 - specvp12 maya-04
100%
T600 +
67.4 fps (18%)
specvp12 maya-04 + Nvidia RTX A2000
137 fps (37%)
specvp12 maya-04 + NVIDIA Quadro RTX 5000 Max-Q
min: 70.3     avg: 83.4     median: 81.6 (22%)     max: 105.4 fps
specvp12 energy-01 + NVIDIA T600
SPECviewperf 12 - specvp12 energy-01
100%
T600 +
5 fps (4%)
specvp12 energy-01 + Nvidia RTX A2000
10.2 fps (9%)
specvp12 energy-01 + NVIDIA Quadro RTX 5000 Max-Q
min: 13.3     avg: 14.5     median: 14.3 (13%)     max: 16.1 fps
specvp12 creo-01 + NVIDIA T600
SPECviewperf 12 - specvp12 creo-01
100%
T600 +
78.5 fps (31%)
specvp12 creo-01 + Nvidia RTX A2000
117 fps (47%)
specvp12 creo-01 + NVIDIA Quadro RTX 5000 Max-Q
min: 114.1     avg: 127     median: 125.2 (50%)     max: 145.1 fps
specvp12 catia-04 + NVIDIA T600
SPECviewperf 12 - specvp12 catia-04
100%
T600 +
76.9 fps (13%)
specvp12 catia-04 + Nvidia RTX A2000
129 fps (21%)
specvp12 catia-04 + NVIDIA Quadro RTX 5000 Max-Q
min: 113.1     avg: 126.4     median: 123.6 (20%)     max: 154.9 fps
specvp12 3dsmax-05 + NVIDIA T600
SPECviewperf 12 - specvp12 3dsmax-05
100%
T600 +
80 fps (12%)
specvp12 3dsmax-05 + Nvidia RTX A2000
162 fps (24%)
specvp12 3dsmax-05 + NVIDIA Quadro RTX 5000 Max-Q
min: 158.9     avg: 176.3     median: 180.9 (27%)     max: 184.3 fps
SPECviewperf 13 specvp13 sw-04 + NVIDIA T600
SPECviewperf 13 - specvp13 sw-04
100%
T600 +
114 fps (31%)
specvp13 sw-04 + Nvidia RTX A2000
138 fps (37%)
specvp13 sw-04 + NVIDIA Quadro RTX 5000 Max-Q
min: 119.7     avg: 135.3     median: 134 (36%)     max: 158.9 fps
specvp13 snx-03 + NVIDIA T600
SPECviewperf 13 - specvp13 snx-03
100%
T600 +
122 fps (14%)
specvp13 snx-03 + Nvidia RTX A2000
239 fps (27%)
specvp13 snx-03 + NVIDIA Quadro RTX 5000 Max-Q
min: 244.1     avg: 287     median: 289.8 (32%)     max: 306.1 fps
specvp13 showcase-02 + NVIDIA T600
SPECviewperf 13 - specvp13 showcase-02
100%
T600 +
34.9 fps (6%)
specvp13 showcase-02 + Nvidia RTX A2000
79.2 fps (13%)
specvp13 showcase-02 + NVIDIA Quadro RTX 5000 Max-Q
min: 89.2     avg: 95.2     median: 95.5 (16%)     max: 98.7 fps
specvp13 medical-02 + NVIDIA T600
SPECviewperf 13 - specvp13 medical-02
100%
T600 +
35.7 fps (6%)
specvp13 medical-02 + Nvidia RTX A2000
119 fps (20%)
specvp13 medical-02 + NVIDIA Quadro RTX 5000 Max-Q
min: 79     avg: 89.8     median: 89.9 (15%)     max: 102.5 fps
specvp13 maya-05 + NVIDIA T600
SPECviewperf 13 - specvp13 maya-05
100%
T600 +
99.8 fps (11%)
specvp13 maya-05 + Nvidia RTX A2000
221 fps (25%)
specvp13 maya-05 + NVIDIA Quadro RTX 5000 Max-Q
min: 179.5     avg: 206.4     median: 206 (23%)     max: 231.3 fps
specvp13 energy-02 + NVIDIA T600
SPECviewperf 13 - specvp13 energy-02
100%
T600 +
12.6 fps (4%)
specvp13 energy-02 + Nvidia RTX A2000
32.9 fps (11%)
specvp13 energy-02 + NVIDIA Quadro RTX 5000 Max-Q
min: 35.39     avg: 37.3     median: 36.9 (12%)     max: 39.92 fps
specvp13 creo-02 + NVIDIA T600
SPECviewperf 13 - specvp13 creo-02
100%
T600 +
98 fps (14%)
specvp13 creo-02 + Nvidia RTX A2000
217 fps (32%)
specvp13 creo-02 + NVIDIA Quadro RTX 5000 Max-Q
min: 181.9     avg: 217.7     median: 220.5 (32%)     max: 238.4 fps
specvp13 3dsmax-06 + NVIDIA T600
SPECviewperf 13 - specvp13 3dsmax-06
100%
T600 +
79.9 fps (13%)
specvp13 3dsmax-06 + Nvidia RTX A2000
162 fps (25%)
specvp13 3dsmax-06 + NVIDIA Quadro RTX 5000 Max-Q
min: 157.3     avg: 174.8     median: 176.5 (28%)     max: 181.8 fps
specvp13 catia-05 + NVIDIA Quadro RTX 5000 Max-Q
SPECviewperf 13 - specvp13 catia-05
min: 186.9     avg: 222.1     median: 220.4 (24%)     max: 259.7 fps
SPECviewperf 2020 specvp2020 solidworks-05 4k + NVIDIA T600
SPECviewperf 2020 - specvp2020 solidworks-05 4k
100%
1 T600 +
16.9 fps (4%)
specvp2020 snx-04 4k + NVIDIA T600
SPECviewperf 2020 - specvp2020 snx-04 4k
100%
1 T600 +
75.6 fps (8%)
specvp2020 snx-04 4k + Nvidia RTX A2000
159 fps (16%)
specvp2020 medical-03 4k + NVIDIA T600
SPECviewperf 2020 - specvp2020 medical-03 4k
100%
1 T600 +
4.5 fps (3%)
specvp2020 medical-03 4k + Nvidia RTX A2000
24.2 fps (16%)
specvp2020 maya-06 4k + NVIDIA T600
SPECviewperf 2020 - specvp2020 maya-06 4k
100%
1 T600 +
46.1 fps (7%)
specvp2020 maya-06 4k + Nvidia RTX A2000
126 fps (18%)
specvp2020 energy-03 4k + NVIDIA T600
SPECviewperf 2020 - specvp2020 energy-03 4k
100%
1 T600 +
6.7 fps (1%)
specvp2020 energy-03 4k + Nvidia RTX A2000
15.8 fps (2%)
specvp2020 creo-03 4k + NVIDIA T600
SPECviewperf 2020 - specvp2020 creo-03 4k
100%
1 T600 +
32.3 fps (14%)
specvp2020 creo-03 4k + Nvidia RTX A2000
75.1 fps (34%)
specvp2020 catia-06 4k + NVIDIA T600
SPECviewperf 2020 - specvp2020 catia-06 4k
100%
1 T600 +
13.8 fps (9%)
specvp2020 catia-06 4k + Nvidia RTX A2000
38.8 fps (25%)
specvp2020 3dsmax-07 4k + NVIDIA T600
SPECviewperf 2020 - specvp2020 3dsmax-07 4k
100%
1 T600 +
19.4 fps (7%)
specvp2020 3dsmax-07 4k + Nvidia RTX A2000
49.8 fps (17%)
specvp2020 medical-03 1080p + Nvidia RTX A2000
SPECviewperf 2020 - specvp2020 medical-03 1080p
68.8 fps (19%)
specvp2020 maya-06 1080p + Nvidia RTX A2000
SPECviewperf 2020 - specvp2020 maya-06 1080p
271 fps (29%)
specvp2020 energy-03 1080p + Nvidia RTX A2000
SPECviewperf 2020 - specvp2020 energy-03 1080p
33.6 fps (5%)
specvp2020 creo-03 1080p + Nvidia RTX A2000
SPECviewperf 2020 - specvp2020 creo-03 1080p
112 fps (38%)
specvp2020 catia-06 1080p + Nvidia RTX A2000
SPECviewperf 2020 - specvp2020 catia-06 1080p
64 fps (31%)
specvp2020 3dsmax-07 1080p + Nvidia RTX A2000
SPECviewperf 2020 - specvp2020 3dsmax-07 1080p
79.1 fps (21%)
Cinebench R10 Cinebench R10 Shading (32bit) + NVIDIA T600
Cinebench R10 - Cinebench R10 Shading (32bit)
100%
T600 +
6830 Points (5%)
Cinebench R10 Shading (32bit) + Nvidia RTX A2000
6827 Points (5%)
Cinebench R10 Shading (32bit) + NVIDIA Quadro RTX 5000 Max-Q
min: 6814     avg: 6821     median: 6819 (5%)     max: 6830 Points
Cinebench R11.5 Cinebench R11.5 OpenGL 64 Bit + NVIDIA T600
Cinebench R11.5 - Cinebench R11.5 OpenGL 64 Bit
100%
T600 +
104.1 fps (34%)
Cinebench R11.5 OpenGL 64 Bit + Nvidia RTX A2000
303.9 fps (100%)
Cinebench R11.5 OpenGL 64 Bit + NVIDIA Quadro RTX 5000 Max-Q
min: 130.9     avg: 140.2     median: 140.2 (46%)     max: 149.4 fps
Cinebench R15
Cinebench R15 OpenGL 64 Bit + NVIDIA T600
Cinebench R15 - Cinebench R15 OpenGL 64 Bit
100%
T600 +
227.1 fps (13%)
Cinebench R15 OpenGL 64 Bit + Nvidia RTX A2000
371.8 fps (22%)
Cinebench R15 OpenGL 64 Bit + NVIDIA Quadro RTX 5000 Max-Q
min: 175.3     avg: 205.9     median: 210 (12%)     max: 230 fps
Cinebench R15 OpenGL Ref. Match 64 Bit + NVIDIA T600
Cinebench R15 - Cinebench R15 OpenGL Ref. Match 64 Bit
100%
T600 +
99.6 % (100%)
Cinebench R15 OpenGL Ref. Match 64 Bit + Nvidia RTX A2000
99.6 % (100%)
Cinebench R15 OpenGL Ref. Match 64 Bit + NVIDIA Quadro RTX 5000 Max-Q
99.6 % (100%)
GFXBench - GFXBench 5.0 Aztec Ruins High Tier Offscreen
min: 138.7     avg: 153     median: 153 (27%)     max: 167.2 fps
GFXBench - GFXBench 5.0 Aztec Ruins Normal Tier Offscreen
min: 343.2     avg: 383.1     median: 383.1 (28%)     max: 422.9 fps
GFXBench - GFXBench Car Chase Offscreen
min: 300.8     avg: 311.8     median: 311.8 (29%)     max: 322.7 fps
GFXBench 3.1 - GFXBench Manhattan ES 3.1 Offscreen
min: 447.1     avg: 466.7     median: 466.7 (10%)     max: 486.3 fps
GFXBench 3.0 - GFXBench 3.0 Manhattan Offscreen
min: 512     avg: 522     median: 522 (22%)     max: 532 fps
GFXBench (DX / GLBenchmark) 2.7
GFXBench T-Rex HD Offscreen C24Z16 + NVIDIA Quadro RTX 5000 Max-Q
GFXBench (DX / GLBenchmark) 2.7 - GFXBench T-Rex HD Offscreen C24Z16
min: 1282     avg: 1335     median: 1334.5 (11%)     max: 1387 fps
Basemark GPU 1.2 - Basemark GPU 1.2 Vulkan Official Medium Offscreen 1080
667 fps (16%)
Basemark GPU 1.2 - Basemark GPU 1.2 Vulkan Official High Offscreen 2160
61.5 fps (11%)
Geekbench 6.5 - Geekbench 6.5 GPU OpenCL
72935 Points (19%)
Geekbench 6.5 - Geekbench 6.5 GPU Vulkan
72741 Points (18%)
LuxMark v2.0 64Bit - LuxMark v2.0 Room GPU
100%
T600 +
1121 Samples/s (4%)
3120 Samples/s (11%)
min: 1972     avg: 1990     median: 1990 (7%)     max: 2008 Samples/s
LuxMark v2.0 64Bit - LuxMark v2.0 Sala GPU
100%
T600 +
2049 Samples/s (4%)
6758 Samples/s (12%)
min: 4913     avg: 4983     median: 4983 (9%)     max: 5053 Samples/s
ComputeMark v2.1 - ComputeMark v2.1 Result
100%
T600 +
4825 Points (4%)
15520 Points (13%)
min: 14095     avg: 14179     median: 14178.5 (12%)     max: 14262 Points
Power Consumption - Furmark Stress Test Power Consumption - external Monitor *
100%
1 T600 +
76.7 Watt (10%)
119.2 Watt (16%)
min: 117     avg: 126     median: 126 (17%)     max: 135 Watt
Power Consumption - The Witcher 3 Power Consumption - external Monitor *
100%
1 T600 +
83.5 Watt (12%)
min: 122     avg: 123     median: 123 (17%)     max: 124 Watt
Power Consumption - Witcher 3 Power Consumption *
min: 145     avg: 151.9     median: 151.6 (33%)     max: 157.5 Watt
Power Consumption - Power Efficiency - Witcher 3 ultra
min: 0.4765     avg: 0.5     median: 0.5 (46%)     max: 0.577 fps per Watt
Power Consumption - Power Efficiency - Witcher 3 ultra external Monitor
100%
1 T600 +
0.3 fps per Watt (27%)
min: 0.682     avg: 0.7     median: 0.7 (57%)     max: 0.685 fps per Watt
Power Consumption - Cyberpunk 2077 Power Consumption - external Monitor *
244 Watt (31%)
Power Consumption - Power Efficiency - Cyberpunk 2077 ultra
0.2 fps per Watt (1%)
Emissions Witcher 3 Fan Noise + NVIDIA Quadro RTX 5000 Max-Q
Emissions - Witcher 3 Fan Noise
min: 38.3     avg: 46.6     median: 47.4 (68%)     max: 51.9 dB(A)
Clock Speed - GPU Clock Witcher 3 ultra
min: 1137     avg: 1171     median: 1170.5 (46%)     max: 1204 MHz
Clock Speed - GPU Clock Speed Furmark
min: 465     avg: 920     median: 919.5 (36%)     max: 1374 MHz

Average Benchmarks NVIDIA T600 → 100% n=39

Average Benchmarks Nvidia RTX A2000 → 207% n=39

Average Benchmarks NVIDIA Quadro RTX 5000 Max-Q → 196% n=39

- Range of benchmark values for this graphics card
red legend - Average benchmark values for this graphics card
* Smaller numbers mean a higher performance
1 This benchmark is not used for the average calculation

Game Benchmarks

The following benchmarks stem from our benchmarks of review laptops. The performance depends on the used graphics memory, clock rate, processor, system settings, drivers, and operating systems. So the results don't have to be representative for all laptops with this GPU. For detailed information on the benchmark results, click on the fps number.

low 1920x1080
RTX A2000:
45  fps
med. 1920x1080
RTX A2000:
34  fps
high 1920x1080
RTX A2000:
26  fps
ultra 1920x1080
RTX A2000:
13  fps
QHD 2560x1440
RTX A2000:
10  fps
low 1920x1080
RTX A2000:
117.7  fps
med. 1920x1080
RTX A2000:
78.2  fps
high 1920x1080
RTX A2000:
64  fps
ultra 1920x1080
RTX A2000:
57.6  fps
QHD 2560x1440
RTX A2000:
36.6  fps
4K 3840x2160
RTX A2000:
18.3  fps
low 1920x1080
RTX A2000:
102.6  fps
med. 1920x1080
RTX A2000:
64.6  fps
high 1920x1080
RTX A2000:
49.6  fps
ultra 1920x1080
RTX A2000:
41.1  fps
QHD 2560x1440
RTX A2000:
25.6  fps
4K 3840x2160
RTX A2000:
13.3  fps
F1 24

F1 24

2024
low 1920x1080
RTX A2000:
173.3  fps
med. 1920x1080
RTX A2000:
144.7  fps
high 1920x1080
RTX A2000:
104.6  fps
ultra 1920x1080
RTX A2000:
32.5  fps
QHD 2560x1440
RTX A2000:
20.2  fps
4K 3840x2160
RTX A2000:
9.7  fps
4K DLSS 3840x2160
RTX A2000:
17.9  fps
QHD DLSS 2560x1440
RTX A2000:
34.2  fps
low 1920x1080
RTX A2000:
90  fps
med. 1920x1080
RTX A2000:
84  fps
high 1920x1080
RTX A2000:
58  fps
ultra 1920x1080
RTX A2000:
39  fps
QHD 2560x1440
RTX A2000:
32  fps
4K 3840x2160
RTX A2000:
22  fps
4K DLSS 3840x2160
RTX A2000:
24  fps
low 1920x1080
RTX A2000:
44  fps
med. 1920x1080
RTX A2000:
39  fps
high 1920x1080
RTX A2000:
34  fps
ultra 1920x1080
RTX A2000:
25  fps
QHD 2560x1440
RTX A2000:
16  fps
4K 3840x2160
RTX A2000:
7  fps
4K DLSS 3840x2160
RTX A2000:
14  fps
low 1920x1080
RTX A2000:
85.4  fps
med. 1920x1080
RTX A2000:
60.2  fps
high 1920x1080
RTX A2000:
54.2  fps
ultra 1920x1080
RTX A2000:
49.7  fps
QHD 2560x1440
RTX A2000:
34.4  fps
4K 3840x2160
RTX A2000:
18.6  fps
4K DLSS 3840x2160
RTX A2000:
28.3  fps
low 1920x1080
RTX A2000:
244.4  fps
med. 1920x1080
RTX A2000:
155.3  fps
high 1920x1080
RTX A2000:
87.3  fps
ultra 1920x1080
RTX A2000:
69  fps
QHD 2560x1440
RTX A2000:
46.2  fps
4K 3840x2160
RTX A2000:
23.3  fps
low 1920x1080
RTX A2000:
83.9  fps
med. 1920x1080
RTX A2000:
61.9  fps
high 1920x1080
RTX A2000:
51.8  fps
ultra 1920x1080
RTX A2000:
44.7  fps
QHD 2560x1440
RTX A2000:
25.5  fps
4K 3840x2160
RTX A2000:
11  fps
low 1920x1080
RTX A2000:
74.9  fps
med. 1920x1080
RTX A2000:
58.8  fps
high 1920x1080
RTX A2000:
50.8  fps
ultra 1920x1080
RTX A2000:
49.9  fps
QHD 2560x1440
RTX A2000:
34.4  fps
4K 3840x2160
RTX A2000:
18.2  fps
4K DLSS 3840x2160
RTX A2000:
30.2  fps
Starfield

Starfield

2023
low 1920x1080
RTX A2000:
77.3  fps
med. 1920x1080
RTX A2000:
61.1  fps
high 1920x1080
RTX A2000:
40.5  fps
ultra 1920x1080
RTX A2000:
33  fps
QHD 2560x1440
RTX A2000:
26.6  fps
4K 3840x2160
RTX A2000:
17.1  fps
F1 23

F1 23

2023
low 1920x1080
RTX A2000:
185.1  fps
med. 1920x1080
RTX A2000:
165.1  fps
high 1920x1080
RTX A2000:
111.2  fps
ultra 1920x1080
RTX A2000:
32.2  fps
QHD 2560x1440
RTX A2000:
20  fps
4K 3840x2160
RTX A2000:
9.4  fps
4K DLSS 3840x2160
RTX A2000:
17.4  fps
low 1920x1080
RTX A2000:
110  fps
med. 1920x1080
RTX A2000:
92  fps
high 1920x1080
RTX A2000:
69  fps
ultra 1920x1080
RTX A2000:
68  fps
QHD 2560x1440
RTX A2000:
50  fps
4K 3840x2160
RTX A2000:
28  fps
Returnal

Returnal

2023
low 1920x1080
RTX A2000:
65  fps
med. 1920x1080
RTX A2000:
60  fps
high 1920x1080
RTX A2000:
53  fps
ultra 1920x1080
RTX A2000:
45  fps
QHD 2560x1440
RTX A2000:
32  fps
4K 3840x2160
RTX A2000:
18  fps
F1 22

F1 22

2022
low 1920x1080
RTX A2000:
197.4  fps
med. 1920x1080
RTX A2000:
181.5  fps
high 1920x1080
RTX A2000:
125.3  fps
ultra 1920x1080
RTX A2000:
37.5  fps
QHD 2560x1440
RTX A2000:
23  fps
4K 3840x2160
RTX A2000:
10.9  fps
low 1920x1080
RTX A2000:
124  fps
med. 1920x1080
RTX A2000:
99.4  fps
high 1920x1080
RTX A2000:
66  fps
ultra 1920x1080
RTX A2000:
51.2  fps
QHD 2560x1440
RTX A2000:
34.3  fps
4K 3840x2160
RTX A2000:
17.7  fps
low 1920x1080
RTX A2000:
198  fps
med. 1920x1080
RTX A2000:
142.1  fps
high 1920x1080
RTX A2000:
115.4  fps
ultra 1920x1080
RTX A2000:
81.7  fps
QHD 2560x1440
RTX A2000:
62  fps
4K 3840x2160
RTX A2000:
36.6  fps
low 1920x1080
RTX A2000:
86.1  fps
med. 1920x1080
RTX A2000:
72.9  fps
high 1920x1080
RTX A2000:
57.4  fps
ultra 1920x1080
RTX A2000:
38.9  fps
QHD 2560x1440
RTX A2000:
30.9  fps
4K 3840x2160
RTX A2000:
19.9  fps
low 1280x720
RTX A2000:
351  fps
med. 1920x1080
RTX A2000:
181.9  fps
high 1920x1080
RTX A2000:
131.5  fps
ultra 1920x1080
RTX A2000:
108.5  fps
QHD 2560x1440
RTX A2000:
78.7  fps
4K 3840x2160
RTX A2000:
45.2  fps
low 1280x720
RTX A2000:
231  fps
med. 1920x1080
RTX A2000:
121  fps
high 1920x1080
RTX A2000:
106  fps
ultra 1920x1080
RTX A2000:
59  fps
QHD 2560x1440
RTX A2000:
43  fps
4K 3840x2160
RTX A2000:
29  fps
low 1280x720
RTX A2000:
199  fps
med. 1920x1080
RTX A2000:
142  fps
high 1920x1080
RTX A2000:
143  fps
ultra 1920x1080
RTX A2000:
131  fps
QHD 2560x1440
RTX A2000:
98  fps
4K 3840x2160
RTX A2000:
55  fps
Far Cry 6

Far Cry 6

2021
low 1280x720
100%
T600:
93.5  fps
193%
RTX A2000:
180.4  fps
med. 1920x1080
100%
T600:
44.6  fps
219%
RTX A2000:
97.6  fps
high 1920x1080
100%
T600:
21.3  fps
391%
RTX A2000:
83.2  fps
ultra 1920x1080
100%
T600:
6.3  fps
1079%
RTX A2000:
68.3  fps
QHD 2560x1440
RTX A2000:
48.8  fps
4K 3840x2160
RTX A2000:
25.7  fps
F1 2021

F1 2021

2021
low 1280x720
100%
T600:
171.9  fps
261%
RTX A2000:
448  fps
med. 1920x1080
100%
T600:
78.8  fps
259%
RTX A2000:
204  fps
high 1920x1080
100%
T600:
63.7  fps
247%
RTX A2000:
157.3  fps
ultra 1920x1080
100%
T600:
40.2  fps
187%
RTX A2000:
75.1  fps
QHD 2560x1440
100%
T600:
29.1  fps
184%
RTX A2000:
53.4  fps
4K 3840x2160
100%
T600:
15.7  fps
181%
RTX A2000:
28.4  fps
low 1280x720
Quadro RTX 5000 Max-Q:
90  fps
med. 1920x1080
Quadro RTX 5000 Max-Q:
85  fps
high 1920x1080
Quadro RTX 5000 Max-Q:
75  fps
ultra 1920x1080
Quadro RTX 5000 Max-Q:
51  fps
QHD 2560x1440
Quadro RTX 5000 Max-Q:
37  fps
4K 3840x2160
Quadro RTX 5000 Max-Q:
21  fps
FIFA 21

FIFA 21

2020
low 1280x720
Quadro RTX 5000 Max-Q:
208.3  fps
med. 1920x1080
Quadro RTX 5000 Max-Q:
188.7  fps
high 1920x1080
Quadro RTX 5000 Max-Q:
181.6  fps
ultra 1920x1080
Quadro RTX 5000 Max-Q:
170  fps
QHD 2560x1440
Quadro RTX 5000 Max-Q:
143  fps
4K 3840x2160
Quadro RTX 5000 Max-Q:
84.4  fps
low 1280x720
Quadro RTX 5000 Max-Q:
296  fps
med. 1920x1080
Quadro RTX 5000 Max-Q:
225.7  fps
high 1920x1080
Quadro RTX 5000 Max-Q:
203.3  fps
ultra 1920x1080
Quadro RTX 5000 Max-Q:
185.3  fps
QHD 2560x1440
Quadro RTX 5000 Max-Q:
125.9  fps
4K 3840x2160
Quadro RTX 5000 Max-Q:
70.4  fps
low 1280x720
Quadro RTX 5000 Max-Q:
113.6  fps
med. 1920x1080
Quadro RTX 5000 Max-Q:
90.3  fps
high 1920x1080
Quadro RTX 5000 Max-Q:
82.9  fps
QHD 2560x1440
Quadro RTX 5000 Max-Q:
56.7  fps
4K 3840x2160
Quadro RTX 5000 Max-Q:
30.2  fps
low 1280x720
Quadro RTX 5000 Max-Q:
106  fps
med. 1920x1080
Quadro RTX 5000 Max-Q:
84.7  fps
high 1920x1080
Quadro RTX 5000 Max-Q:
79.8  fps
ultra 1920x1080
Quadro RTX 5000 Max-Q:
69.6  fps
QHD 2560x1440
Quadro RTX 5000 Max-Q:
57.5  fps
4K 3840x2160
Quadro RTX 5000 Max-Q:
34.9  fps
low 1280x720
Quadro RTX 5000 Max-Q:
58.3  fps
med. 1920x1080
Quadro RTX 5000 Max-Q:
49  fps
high 1920x1080
Quadro RTX 5000 Max-Q:
44  fps
ultra 1920x1080
Quadro RTX 5000 Max-Q:
34.3  fps
QHD 2560x1440
Quadro RTX 5000 Max-Q:
26.9  fps
4K 3840x2160
Quadro RTX 5000 Max-Q:
16.1  fps
low 1280x720
RTX A2000:
184  fps
Quadro RTX 5000 Max-Q:
120  fps
med. 1920x1080
RTX A2000:
104  fps
Quadro RTX 5000 Max-Q:
103  fps
high 1920x1080
RTX A2000:
83  fps
Quadro RTX 5000 Max-Q:
93  fps
ultra 1920x1080
RTX A2000:
68  fps
Quadro RTX 5000 Max-Q:
86 89 ~ 88 fps
QHD 2560x1440
RTX A2000:
52  fps
Quadro RTX 5000 Max-Q:
69  fps
4K 3840x2160
RTX A2000:
26  fps
Quadro RTX 5000 Max-Q:
42  fps
4K DLSS 3840x2160
RTX A2000:
39  fps
low 1280x720
Quadro RTX 5000 Max-Q:
100.1 127.2 ~ 114 fps
med. 1920x1080
Quadro RTX 5000 Max-Q:
100.5 112.6 ~ 107 fps
high 1920x1080
Quadro RTX 5000 Max-Q:
97.3 103.8 ~ 101 fps
ultra 1920x1080
Quadro RTX 5000 Max-Q:
97.4 101.5 ~ 99 fps
QHD 2560x1440
Quadro RTX 5000 Max-Q:
70 73.7 ~ 72 fps
4K 3840x2160
Quadro RTX 5000 Max-Q:
39 41.1 ~ 40 fps
F1 2020

F1 2020

2020
low 1280x720
100%
T600:
150.4  fps
269%
RTX A2000:
405  fps
144%
Quadro RTX 5000 Max-Q:
214 219 ~ 217 fps
med. 1920x1080
100%
T600:
73.1  fps
270%
RTX A2000:
197.2  fps
222%
Quadro RTX 5000 Max-Q:
158 166 ~ 162 fps
high 1920x1080
100%
T600:
55.5  fps
269%
RTX A2000:
149.4  fps
250%
Quadro RTX 5000 Max-Q:
135 143 ~ 139 fps
ultra 1920x1080
100%
T600:
38.6  fps
262%
RTX A2000:
101.2  fps
280%
Quadro RTX 5000 Max-Q:
107 108 ~ 108 fps
QHD 2560x1440
100%
T600:
27  fps
267%
RTX A2000:
72  fps
307%
Quadro RTX 5000 Max-Q:
82.8 83 ~ 83 fps
4K 3840x2160
100%
T600:
14.5  fps
268%
RTX A2000:
38.8  fps
317%
Quadro RTX 5000 Max-Q:
44.4 47 ~ 46 fps
low 1280x720
Quadro RTX 5000 Max-Q:
177.7 226.8 ~ 202 fps
med. 1920x1080
Quadro RTX 5000 Max-Q:
126.6 151 ~ 139 fps
high 1920x1080
Quadro RTX 5000 Max-Q:
90.7 110.2 ~ 100 fps
ultra 1920x1080
Quadro RTX 5000 Max-Q:
73.6 84.6 ~ 79 fps
QHD 2560x1440
Quadro RTX 5000 Max-Q:
50 54.3 ~ 52 fps
4K 3840x2160
Quadro RTX 5000 Max-Q:
24 27.6 ~ 26 fps
low 1280x720
Quadro RTX 5000 Max-Q:
213.8 216.7 ~ 215 fps
med. 1920x1080
Quadro RTX 5000 Max-Q:
159.9 161.9 ~ 161 fps
high 1920x1080
Quadro RTX 5000 Max-Q:
142.3 145 ~ 144 fps
ultra 1920x1080
Quadro RTX 5000 Max-Q:
137.8 140.6 145.3 ~ 141 fps
QHD 2560x1440
Quadro RTX 5000 Max-Q:
92.5 103.2 ~ 98 fps
4K 3840x2160
Quadro RTX 5000 Max-Q:
47.1 54.5 ~ 51 fps
low 1280x720
Quadro RTX 5000 Max-Q:
158.2  fps
med. 1920x1080
Quadro RTX 5000 Max-Q:
106.2  fps
high 1920x1080
Quadro RTX 5000 Max-Q:
94  fps
QHD 2560x1440
Quadro RTX 5000 Max-Q:
52.5  fps
4K 3840x2160
Quadro RTX 5000 Max-Q:
26.7  fps
low 1280x720
Quadro RTX 5000 Max-Q:
107.5 124.2 ~ 116 fps
med. 1920x1080
Quadro RTX 5000 Max-Q:
84.8 89.1 ~ 87 fps
high 1920x1080
Quadro RTX 5000 Max-Q:
54.8 63.9 ~ 59 fps
ultra 1920x1080
Quadro RTX 5000 Max-Q:
39.7 41.3 ~ 41 fps
QHD 2560x1440
Quadro RTX 5000 Max-Q:
32 32.9 ~ 32 fps
4K 3840x2160
Quadro RTX 5000 Max-Q:
19.8 25.2 ~ 23 fps
med. 1920x1080
Quadro RTX 5000 Max-Q:
88.5 105 ~ 97 fps
high 1920x1080
Quadro RTX 5000 Max-Q:
83.1 99.5 ~ 91 fps
ultra 1920x1080
Quadro RTX 5000 Max-Q:
80.4 89.7 ~ 85 fps
QHD 2560x1440
Quadro RTX 5000 Max-Q:
64 66.3 ~ 65 fps
4K 3840x2160
Quadro RTX 5000 Max-Q:
33.5 34 ~ 34 fps
low 1280x720
Quadro RTX 5000 Max-Q:
92.3  fps
med. 1920x1080
Quadro RTX 5000 Max-Q:
84.4  fps
high 1920x1080
Quadro RTX 5000 Max-Q:
77.5  fps
ultra 1920x1080
Quadro RTX 5000 Max-Q:
72.1  fps
QHD 2560x1440
Quadro RTX 5000 Max-Q:
65.4  fps
4K 3840x2160
Quadro RTX 5000 Max-Q:
36.9  fps
low 1280x720
Quadro RTX 5000 Max-Q:
156.5 185.2 ~ 171 fps
med. 1920x1080
Quadro RTX 5000 Max-Q:
111.2 130.6 ~ 121 fps
high 1920x1080
Quadro RTX 5000 Max-Q:
99 103.6 ~ 101 fps
ultra 1920x1080
Quadro RTX 5000 Max-Q:
86.7 91.8 ~ 89 fps
QHD 2560x1440
Quadro RTX 5000 Max-Q:
62.2 65.2 ~ 64 fps
4K 3840x2160
Quadro RTX 5000 Max-Q:
34 35.2 ~ 35 fps
GRID 2019

GRID 2019

2019
low 1280x720
Quadro RTX 5000 Max-Q:
131.5 178.8 ~ 155 fps
med. 1920x1080
Quadro RTX 5000 Max-Q:
107.8 155.6 ~ 132 fps
high 1920x1080
Quadro RTX 5000 Max-Q:
96.2 118.5 ~ 107 fps
ultra 1920x1080
Quadro RTX 5000 Max-Q:
79.2 87.2 ~ 83 fps
QHD 2560x1440
Quadro RTX 5000 Max-Q:
61.4 62.7 ~ 62 fps
4K 3840x2160
Quadro RTX 5000 Max-Q:
36.8 38.6 ~ 38 fps
low 1280x720
Quadro RTX 5000 Max-Q:
117 127 ~ 122 fps
med. 1920x1080
Quadro RTX 5000 Max-Q:
96 105 ~ 101 fps
high 1920x1080
Quadro RTX 5000 Max-Q:
92 93 ~ 93 fps
ultra 1920x1080
Quadro RTX 5000 Max-Q:
65 68 ~ 67 fps
QHD 2560x1440
Quadro RTX 5000 Max-Q:
47 49 ~ 48 fps
4K 3840x2160
Quadro RTX 5000 Max-Q:
26 28 ~ 27 fps
low 1280x720
100%
T600:
107.6  fps
208%
RTX A2000:
224  fps
110%
Quadro RTX 5000 Max-Q:
118.8  fps
med. 1920x1080
100%
T600:
42  fps
257%
RTX A2000:
108.1  fps
238%
Quadro RTX 5000 Max-Q:
99.9  fps
high 1920x1080
100%
T600:
26.7  fps
257%
RTX A2000:
68.6  fps
294%
Quadro RTX 5000 Max-Q:
78.4  fps
ultra 1920x1080
100%
T600:
19.9  fps
261%
RTX A2000:
52  fps
314%
Quadro RTX 5000 Max-Q:
62.5  fps
QHD 2560x1440
100%
T600:
13.4  fps
263%
RTX A2000:
35.2  fps
320%
Quadro RTX 5000 Max-Q:
42.9  fps
4K 3840x2160
100%
T600:
5.5  fps
338%
RTX A2000:
18.7  fps
412%
Quadro RTX 5000 Max-Q:
22.8  fps
Control

Control

2019
low 1280x720
Quadro RTX 5000 Max-Q:
223.5 228.8 ~ 226 fps
med. 1920x1080
Quadro RTX 5000 Max-Q:
93.2 96.7 ~ 95 fps
high 1920x1080
Quadro RTX 5000 Max-Q:
66.5 69.9 ~ 68 fps
QHD 2560x1440
Quadro RTX 5000 Max-Q:
42.7 43 ~ 43 fps
4K 3840x2160
Quadro RTX 5000 Max-Q:
19.1 20 ~ 20 fps
F1 2019

F1 2019

2019
low 1280x720
Quadro RTX 5000 Max-Q:
113 192 ~ 153 fps
med. 1920x1080
Quadro RTX 5000 Max-Q:
101 165 ~ 133 fps
high 1920x1080
Quadro RTX 5000 Max-Q:
93 131 ~ 112 fps
ultra 1920x1080
Quadro RTX 5000 Max-Q:
88 118 ~ 103 fps
QHD 2560x1440
Quadro RTX 5000 Max-Q:
83 86 ~ 85 fps
4K 3840x2160
Quadro RTX 5000 Max-Q:
52 56 ~ 54 fps
low 1280x720
RTX A2000:
370.4  fps
Quadro RTX 5000 Max-Q:
218.6 243.7 ~ 231 fps
med. 1920x1080
RTX A2000:
116.2  fps
Quadro RTX 5000 Max-Q:
120.2 129 ~ 125 fps
high 1920x1080
RTX A2000:
70.5  fps
Quadro RTX 5000 Max-Q:
80.9 87.3 ~ 84 fps
ultra 1920x1080
RTX A2000:
48.4  fps
Quadro RTX 5000 Max-Q:
57.5 64.9 ~ 61 fps
QHD 2560x1440
RTX A2000:
28.9  fps
Quadro RTX 5000 Max-Q:
34.1 43.5 ~ 39 fps
4K 3840x2160
RTX A2000:
13.8  fps
Quadro RTX 5000 Max-Q:
18.5 21.5 ~ 20 fps
Rage 2

Rage 2

2019
low 1280x720
Quadro RTX 5000 Max-Q:
224  fps
med. 1920x1080
Quadro RTX 5000 Max-Q:
114.8  fps
high 1920x1080
Quadro RTX 5000 Max-Q:
96.4  fps
ultra 1920x1080
Quadro RTX 5000 Max-Q:
94.3  fps
QHD 2560x1440
Quadro RTX 5000 Max-Q:
59.4  fps
4K 3840x2160
Quadro RTX 5000 Max-Q:
28.7  fps
Anno 1800

Anno 1800

2019
low 1280x720
Quadro RTX 5000 Max-Q:
94.5 95.8 ~ 95 fps
med. 1920x1080
Quadro RTX 5000 Max-Q:
90.9 97.8 ~ 94 fps
high 1920x1080
Quadro RTX 5000 Max-Q:
69.3 73.9 ~ 72 fps
ultra 1920x1080
Quadro RTX 5000 Max-Q:
37.4 38.9 ~ 38 fps
QHD 2560x1440
Quadro RTX 5000 Max-Q:
31.5 34.7 ~ 33 fps
4K 3840x2160
Quadro RTX 5000 Max-Q:
21.2  fps
low 1280x720
Quadro RTX 5000 Max-Q:
144  fps
med. 1920x1080
Quadro RTX 5000 Max-Q:
112  fps
high 1920x1080
Quadro RTX 5000 Max-Q:
97  fps
ultra 1920x1080
Quadro RTX 5000 Max-Q:
56  fps
QHD 2560x1440
Quadro RTX 5000 Max-Q:
51  fps
4K 3840x2160
Quadro RTX 5000 Max-Q:
27  fps
low 1280x720
Quadro RTX 5000 Max-Q:
241.2 275 ~ 258 fps
med. 1920x1080
Quadro RTX 5000 Max-Q:
169.4 188.9 ~ 179 fps
high 1920x1080
Quadro RTX 5000 Max-Q:
153 160.3 ~ 157 fps
ultra 1920x1080
Quadro RTX 5000 Max-Q:
89.3 90.7 ~ 90 fps
QHD 2560x1440
Quadro RTX 5000 Max-Q:
66.8 70.2 ~ 69 fps
4K 3840x2160
Quadro RTX 5000 Max-Q:
39.8  fps
low 1280x720
RTX A2000:
181  fps
Quadro RTX 5000 Max-Q:
104 107 ~ 106 fps
med. 1920x1080
RTX A2000:
106  fps
Quadro RTX 5000 Max-Q:
90 98 ~ 94 fps
high 1920x1080
RTX A2000:
97  fps
Quadro RTX 5000 Max-Q:
88 90 ~ 89 fps
ultra 1920x1080
RTX A2000:
87  fps
Quadro RTX 5000 Max-Q:
81 86 ~ 84 fps
QHD 2560x1440
RTX A2000:
62  fps
Quadro RTX 5000 Max-Q:
72 74 ~ 73 fps
4K 3840x2160
RTX A2000:
33  fps
Quadro RTX 5000 Max-Q:
43 43 ~ 43 fps
low 1280x720
100%
T600:
74.6  fps
227%
RTX A2000:
169.6  fps
174%
Quadro RTX 5000 Max-Q:
115.2 145.6 ~ 130 fps
med. 1920x1080
100%
T600:
34  fps
232%
RTX A2000:
79  fps
271%
Quadro RTX 5000 Max-Q:
87.8 96.3 ~ 92 fps
high 1920x1080
100%
T600:
24  fps
237%
RTX A2000:
56.9  fps
292%
Quadro RTX 5000 Max-Q:
66.9 72.8 ~ 70 fps
ultra 1920x1080
100%
T600:
19.4  fps
231%
RTX A2000:
44.8  fps
294%
Quadro RTX 5000 Max-Q:
55.4 59.2 ~ 57 fps
QHD 2560x1440
100%
T600:
14.8  fps
230%
RTX A2000:
34  fps
243%
Quadro RTX 5000 Max-Q:
25.4 45.6 ~ 36 fps
4K 3840x2160
100%
T600:
8.5  fps
238%
RTX A2000:
20.2  fps
307%
Quadro RTX 5000 Max-Q:
25.2 27 ~ 26 fps
low 1280x720
Quadro RTX 5000 Max-Q:
144  fps
med. 1920x1080
Quadro RTX 5000 Max-Q:
144  fps
high 1920x1080
Quadro RTX 5000 Max-Q:
144  fps
ultra 1920x1080
Quadro RTX 5000 Max-Q:
142.8  fps
QHD 2560x1440
Quadro RTX 5000 Max-Q:
104.9  fps
4K 3840x2160
Quadro RTX 5000 Max-Q:
53.4  fps
low 1280x720
Quadro RTX 5000 Max-Q:
139.4 153.6 156.6 ~ 150 fps
med. 1920x1080
Quadro RTX 5000 Max-Q:
105.4 130.7 130.8 ~ 122 fps
high 1920x1080
Quadro RTX 5000 Max-Q:
88.2 120.4 124.5 ~ 111 fps
ultra 1920x1080
Quadro RTX 5000 Max-Q:
81.2 112.1 114.7 ~ 103 fps
QHD 2560x1440
Quadro RTX 5000 Max-Q:
68.3 90.8 91.6 ~ 84 fps
4K 3840x2160
Quadro RTX 5000 Max-Q:
42.5 53.4 53.5 ~ 50 fps
Hitman 2

Hitman 2

2018
low 1280x720
Quadro RTX 5000 Max-Q:
87.7  fps
med. 1920x1080
Quadro RTX 5000 Max-Q:
85.3  fps
high 1920x1080
Quadro RTX 5000 Max-Q:
78.4  fps
ultra 1920x1080
Quadro RTX 5000 Max-Q:
75.3  fps
QHD 2560x1440
Quadro RTX 5000 Max-Q:
73.3  fps
4K 3840x2160
Quadro RTX 5000 Max-Q:
46.6  fps
low 1280x720
Quadro RTX 5000 Max-Q:
95 107 ~ 101 fps
med. 1920x1080
Quadro RTX 5000 Max-Q:
80 91 ~ 86 fps
high 1920x1080
Quadro RTX 5000 Max-Q:
75 80 ~ 78 fps
ultra 1920x1080
Quadro RTX 5000 Max-Q:
54 57 ~ 56 fps
QHD 2560x1440
Quadro RTX 5000 Max-Q:
47 48 ~ 48 fps
4K 3840x2160
Quadro RTX 5000 Max-Q:
30 31 ~ 31 fps
low 1280x720
RTX A2000:
229  fps
Quadro RTX 5000 Max-Q:
105 127 ~ 116 fps
med. 1920x1080
RTX A2000:
96.8  fps
Quadro RTX 5000 Max-Q:
94 102 ~ 98 fps
high 1920x1080
RTX A2000:
86.5  fps
Quadro RTX 5000 Max-Q:
91 98 ~ 95 fps
ultra 1920x1080
RTX A2000:
77.4  fps
Quadro RTX 5000 Max-Q:
85 87 90 ~ 87 fps
QHD 2560x1440
RTX A2000:
51.5  fps
Quadro RTX 5000 Max-Q:
59 62 ~ 61 fps
4K 3840x2160
RTX A2000:
26.7  fps
Quadro RTX 5000 Max-Q:
29 33 ~ 31 fps
Strange Brigade

Strange Brigade

2018
low 1280x720
100%
T600:
174.4  fps
233%
RTX A2000:
407  fps
med. 1920x1080
100%
T600:
64.9  fps
256%
RTX A2000:
166.4  fps
high 1920x1080
100%
T600:
51.4  fps
253%
RTX A2000:
130.1  fps
ultra 1920x1080
100%
T600:
44.8  fps
244%
RTX A2000:
109.3  fps
QHD 2560x1440
100%
T600:
31.9  fps
248%
RTX A2000:
79  fps
4K 3840x2160
100%
T600:
17.9  fps
253%
RTX A2000:
45.2  fps
Far Cry 5

Far Cry 5

2018
low 1280x720
100%
T600:
95  fps
214%
RTX A2000:
203  fps
135%
Quadro RTX 5000 Max-Q:
128  fps
med. 1920x1080
100%
T600:
46  fps
235%
RTX A2000:
108  fps
230%
Quadro RTX 5000 Max-Q:
106  fps
high 1920x1080
100%
T600:
42  fps
233%
RTX A2000:
98  fps
240%
Quadro RTX 5000 Max-Q:
101  fps
ultra 1920x1080
100%
T600:
39  fps
233%
RTX A2000:
91  fps
246%
Quadro RTX 5000 Max-Q:
96  fps
QHD 2560x1440
100%
T600:
26  fps
235%
RTX A2000:
61  fps
285%
Quadro RTX 5000 Max-Q:
74  fps
4K 3840x2160
100%
T600:
12  fps
250%
RTX A2000:
30  fps
333%
Quadro RTX 5000 Max-Q:
40  fps
World of Tanks enCore

World of Tanks enCore

2018
low 1366x768
Quadro RTX 5000 Max-Q:
595  fps
med. 1920x1080
Quadro RTX 5000 Max-Q:
367.5  fps
ultra 1920x1080
Quadro RTX 5000 Max-Q:
175.5  fps
QHD 2560x1440
Quadro RTX 5000 Max-Q:
109.6  fps
4K 3840x2160
Quadro RTX 5000 Max-Q:
52.3  fps
low 1280x720
100%
T600:
132.8  fps
153%
RTX A2000:
203  fps
81%
Quadro RTX 5000 Max-Q:
96.1 96.3 100 109 113 117 118 ~ 107 fps
med. 1920x1080
100%
T600:
107  fps
165%
RTX A2000:
176.4  fps
88%
Quadro RTX 5000 Max-Q:
84.9 86.9 88 94.9 98.9 99 102 ~ 94 fps
high 1920x1080
100%
T600:
95.9  fps
142%
RTX A2000:
136.4  fps
82%
Quadro RTX 5000 Max-Q:
72.2 72.9 73.4 78.7 82 85 85.7 ~ 79 fps
4K 3840x2160
100%
T600:
40.8  fps
245%
RTX A2000:
99.8  fps
135%
Quadro RTX 5000 Max-Q:
48.8 56.6 60.6 ~ 55 fps
low 1280x720
100%
T600:
70.7  fps
231%
RTX A2000:
163.1  fps
195%
Quadro RTX 5000 Max-Q:
87 132 154 177 ~ 138 fps
med. 1920x1080
100%
T600:
34.9  fps
236%
RTX A2000:
82.3  fps
278%
Quadro RTX 5000 Max-Q:
82.3 99.7 101 103 ~ 97 fps
high 1920x1080
100%
T600:
25.1  fps
244%
RTX A2000:
61.3  fps
303%
Quadro RTX 5000 Max-Q:
65.8 77.3 79.4 80.8 ~ 76 fps
QHD 2560x1440
100%
T600:
17.8  fps
247%
RTX A2000:
43.9  fps
320%
Quadro RTX 5000 Max-Q:
56 58.4 ~ 57 fps
4K 3840x2160
100%
T600:
10  fps
247%
RTX A2000:
24.7  fps
321%
Quadro RTX 5000 Max-Q:
30.6 32.8 33.9 ~ 32 fps
low 1280x720
Quadro RTX 5000 Max-Q:
113  fps
med. 1920x1080
Quadro RTX 5000 Max-Q:
108  fps
high 1920x1080
Quadro RTX 5000 Max-Q:
98  fps
ultra 1920x1080
Quadro RTX 5000 Max-Q:
86  fps
4K 3840x2160
Quadro RTX 5000 Max-Q:
38  fps
low 1280x720
Quadro RTX 5000 Max-Q:
130.4  fps
med. 1920x1080
Quadro RTX 5000 Max-Q:
91.9  fps
high 1920x1080
Quadro RTX 5000 Max-Q:
85.7  fps
ultra 1920x1080
Quadro RTX 5000 Max-Q:
58.7  fps
4K 3840x2160
Quadro RTX 5000 Max-Q:
38.6  fps
For Honor

For Honor

2017
low 1280x720
Quadro RTX 5000 Max-Q:
246.1  fps
med. 1920x1080
Quadro RTX 5000 Max-Q:
162.1  fps
high 1920x1080
Quadro RTX 5000 Max-Q:
156  fps
ultra 1920x1080
Quadro RTX 5000 Max-Q:
123.2  fps
4K 3840x2160
Quadro RTX 5000 Max-Q:
48.1  fps
low 1280x768
Quadro RTX 5000 Max-Q:
84.4  fps
med. 1920x1080
Quadro RTX 5000 Max-Q:
77.7  fps
high 1920x1080
Quadro RTX 5000 Max-Q:
75.4  fps
4K 3840x2160
Quadro RTX 5000 Max-Q:
42.3  fps
low 1024x768
Quadro RTX 5000 Max-Q:
281.4  fps
med. 1366x768
Quadro RTX 5000 Max-Q:
198.6  fps
high 1920x1080
Quadro RTX 5000 Max-Q:
134.5  fps
ultra 1920x1080
Quadro RTX 5000 Max-Q:
110.1  fps
4K 3840x2160
Quadro RTX 5000 Max-Q:
45.4  fps
low 1024x768
Quadro RTX 5000 Max-Q:
254.8  fps
med. 1366x768
Quadro RTX 5000 Max-Q:
226.7  fps
high 1920x1080
Quadro RTX 5000 Max-Q:
191.8  fps
ultra 1920x1080
Quadro RTX 5000 Max-Q:
183.4  fps
4K 3840x2160
Quadro RTX 5000 Max-Q:
86.9  fps
low 1280x720
100%
T600:
162.8  fps
163%
RTX A2000:
265.4  fps
91%
Quadro RTX 5000 Max-Q:
138.4 140.8 142 148 156 161 ~ 148 fps
med. 1366x768
100%
T600:
148.6  fps
158%
RTX A2000:
234.2  fps
90%
Quadro RTX 5000 Max-Q:
126 128.7 130.1 137 142 143 ~ 134 fps
high 1920x1080
100%
T600:
120.7  fps
176%
RTX A2000:
212  fps
103%
Quadro RTX 5000 Max-Q:
117 119 120.1 124.5 130 132 ~ 124 fps
ultra 1920x1080
100%
T600:
110.5  fps
172%
RTX A2000:
190.2  fps
107%
Quadro RTX 5000 Max-Q:
111 112 114.9 122 122.3 126 ~ 118 fps
4K 3840x2160
100%
T600:
39.6  fps
219%
RTX A2000:
86.6  fps
250%
Quadro RTX 5000 Max-Q:
96.7 98.7 102 ~ 99 fps
low 1024x768
100%
T600:
139.1  fps
248%
RTX A2000:
345  fps
222%
Quadro RTX 5000 Max-Q:
281.8 286.9 298.9 299 320 323.2 353.2 ~ 309 fps
med. 1366x768
100%
T600:
82.8  fps
262%
RTX A2000:
217  fps
287%
Quadro RTX 5000 Max-Q:
225.5 229.5 235 235.8 238.8 249.4 249.8 ~ 238 fps
high 1920x1080
100%
T600:
47.5  fps
246%
RTX A2000:
117  fps
301%
Quadro RTX 5000 Max-Q:
125.4 139.1 141 144.8 145.3 149.8 158.2 ~ 143 fps
ultra 1920x1080
100%
T600:
27.2  fps
235%
RTX A2000:
63.9  fps
301%
Quadro RTX 5000 Max-Q:
71 77.3 79.5 81.1 83.3 83.6 84.6 85 85.3 88.5 ~ 82 fps
QHD 2560x1440
RTX A2000:
47.2  fps
4K 3840x2160
100%
T600:
16.1  fps
249%
RTX A2000:
40.1  fps
311%
Quadro RTX 5000 Max-Q:
46.4 47.5 49.2 50.4 52.5 55.4 ~ 50 fps
GTA V

GTA V

2015
low 1024x768
100%
T600:
181.5  fps
103%
RTX A2000:
187.7  fps
95%
Quadro RTX 5000 Max-Q:
169.1 177 ~ 173 fps
med. 1366x768
100%
T600:
175.6  fps
107%
RTX A2000:
187.5  fps
95%
Quadro RTX 5000 Max-Q:
163.4 170 ~ 167 fps
high 1920x1080
100%
T600:
80.3  fps
217%
RTX A2000:
174.1  fps
176%
Quadro RTX 5000 Max-Q:
132.3 150.4 ~ 141 fps
ultra 1920x1080
100%
T600:
38.2  fps
217%
RTX A2000:
82.9  fps
196%
Quadro RTX 5000 Max-Q:
72 77.6 ~ 75 fps
QHD 2560x1440
100%
T600:
26.6  fps
217%
RTX A2000:
57.8  fps
4K 3840x2160
100%
T600:
25  fps
222%
RTX A2000:
55.6  fps
316%
Quadro RTX 5000 Max-Q:
68.4 89.1 ~ 79 fps
low 1280x720
Quadro RTX 5000 Max-Q:
320.5 365.3 ~ 343 fps
med. 1366x768
Quadro RTX 5000 Max-Q:
283.2 321.5 ~ 302 fps
high 1366x768
Quadro RTX 5000 Max-Q:
265 296.5 ~ 281 fps
ultra 1920x1080
Quadro RTX 5000 Max-Q:
167.2 168.5 174.3 ~ 170 fps

Average Gaming NVIDIA T600 → 100%

Average Gaming 30-70 fps → 100%

Average Gaming Nvidia RTX A2000 → 243%

Average Gaming 30-70 fps → 289%

Average Gaming NVIDIA Quadro RTX 5000 Max-Q → 229%

Average Gaming 30-70 fps → 291%

NVIDIA T600Nvidia RTX A2000NVIDIA Quadro RTX 5000 Max-Q
lowmed.highultraQHD4Klowmed.highultraQHD4Klowmed.highultraQHD4K
Black Myth: Wukong4534261310
Once Human117.778.26457.636.618.3
The First Descendant102.664.649.641.125.613.3
F1 24173.3144.7104.632.520.29.7
Skull & Bones908458393222
Avatar Frontiers of Pandora44393425167
EA Sports WRC85.460.254.249.734.418.6
Total War Pharaoh244.4155.387.36946.223.3
Cyberpunk 2077 2.2 Phantom Liberty83.961.951.844.725.511
Baldur's Gate 374.958.850.849.934.418.2
Starfield77.361.140.53326.617.1
F1 23185.1165.1111.232.2209.4
Company of Heroes 31109269685028
Returnal656053453218
F1 22197.4181.5125.337.52310.9
Tiny Tina's Wonderlands12499.46651.234.317.7
GRID Legends198142.1115.481.76236.6
God of War86.172.957.438.930.919.9
Farming Simulator 22351181.9131.5108.578.745.2
Forza Horizon 5231121106594329
Guardians of the Galaxy1991421431319855
Far Cry 693.544.621.36.33180.497.683.268.348.825.7
F1 2021171.978.863.740.229.115.7448204157.375.153.428.4
Horizon Zero Dawn1841048368522612010393886942
F1 2020150.473.155.538.62714.5405197.2149.4101.27238.82171621391088346
Borderlands 3107.64226.719.913.45.54224108.168.65235.218.7118.899.978.462.542.922.8
Total War: Three Kingdoms370.4116.270.548.428.913.823112584613920
Far Cry New Dawn181106978762331069489847343
Metro Exodus74.6342419.414.88.47169.67956.944.83420.21309270573626
Shadow of the Tomb Raider22996.886.577.451.526.71169895876131
Strange Brigade174.464.951.444.831.917.9407166.4130.1109.37945.2
Far Cry 595464239261220310898916130128106101967440
X-Plane 11.11132.810795.940.8203176.4136.499.8107947955
Final Fantasy XV Benchmark70.734.925.117.89.98163.182.361.343.924.713897765732
Dota 2 Reborn162.8148.6120.7110.539.6265.4234.2212190.286.614813412411899
The Witcher 3139.182.847.527.216.134521711763.947.240.13092381438250
GTA V181.5175.680.338.226.625187.7187.5174.182.957.855.61731671417579
NVIDIA T600Nvidia RTX A2000NVIDIA Quadro RTX 5000 Max-Q
lowmed.highultraQHD4Klowmed.highultraQHD4Klowmed.highultraQHD4K
< 30 fps
< 60 fps
< 120 fps
≥ 120 fps


5
7

5
5
2
4
4
3
1
4
5
1
7
1

9
2

< 30 fps
< 60 fps
< 120 fps
≥ 120 fps

2
10
25

3
19
15
1
10
17
9
2
17
14
2
9
19
7
25
9
2
< 30 fps
< 60 fps
< 120 fps
≥ 120 fps


4
9


8
5


9
4

1
10

4
5
3
8
2

For more games that might be playable and a list of all games and graphics cards visit our Gaming List

v1.33
log 29. 03:16:42

#0 ran 0s before starting gpusingle class +0s ... 0s

#1 checking url part for id 11373 +0s ... 0s

#2 checking url part for id 12778 +0s ... 0s

#3 checking url part for id 9880 +0s ... 0s

#4 redirected to Ajax server, took 1759108601s time from redirect:1 +0s ... 0s

#5 did not recreate cache, as it is less than 5 days old! Created at Sun, 28 Sep 2025 05:18:17 +0200 +0s ... 0s

#6 composed specs +0.033s ... 0.033s

#7 did output specs +0s ... 0.033s

#8 start showIntegratedCPUs +0s ... 0.033s

#9 getting avg benchmarks for device 11373 +0.028s ... 0.061s

#10 got single benchmarks 11373 +0.004s ... 0.065s

#11 getting avg benchmarks for device 12778 +0.004s ... 0.069s

#12 got single benchmarks 12778 +0.005s ... 0.074s

#13 getting avg benchmarks for device 9880 +0.004s ... 0.078s

#14 got single benchmarks 9880 +0.011s ... 0.089s

#15 got avg benchmarks for devices +0s ... 0.089s

#16 min, max, avg, median took s +0.079s ... 0.168s

#17 before gaming benchmark output +0s ... 0.168s

#18 Got 767 rows for game benchmarks. +0.032s ... 0.2s

#19 composed SQL query for gamebenchmarks +0s ... 0.2s

#20 got data and put it in $dataArray +0.005s ... 0.204s

#21 benchmarks composed for output. +0.024s ... 0.229s

#22 calculated avg scores. +0s ... 0.229s

#23 return log +0.001s ... 0.23s

Please share our article, every link counts!
Mail Logo
> Expert Reviews and News on Laptops, Smartphones and Tech Innovations > Benchmarks / Tech > Graphics Card Comparison - Head 2 Head
Redaktion, 2017-09- 8 (Update: 2023-07- 1)