Intel HD Graphics 5000 vs Intel HD Graphics (Braswell) vs Intel HD Graphics 3000
Intel HD Graphics 5000
► remove from comparison 
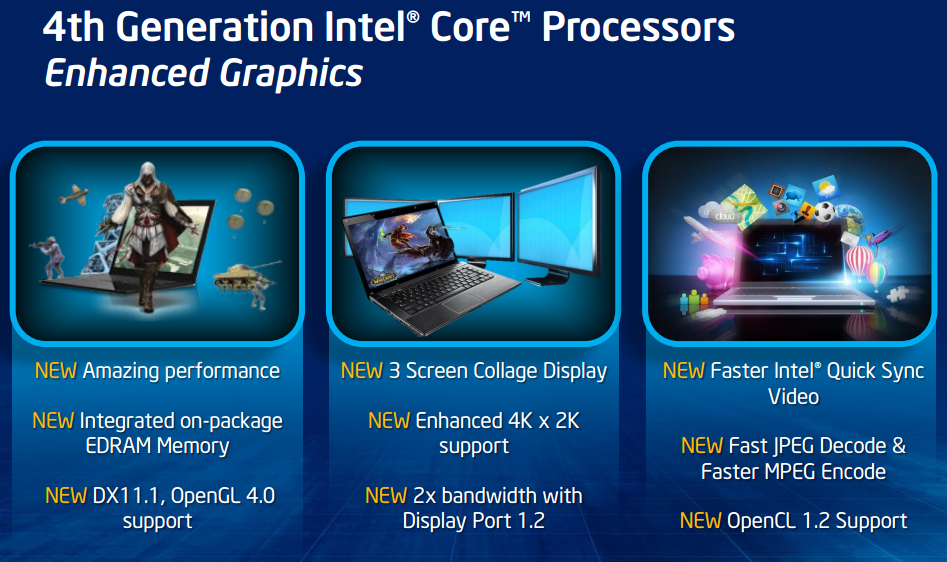
The Intel HD Graphics 5000 (GT3) is a processor graphics card included in some of the ULV Haswell processors of 2013 (e.g. Core i5-4250U). It represents the highest configuration of the integrated graphics unit (40 execution units), but lacks the additional eDRAM cache of the Iris Pro Graphics 5200. The relatively low base clock can be automatically overclocked using Turbo Boost technology. Depending on the processor model, the base and turbo clock rates may differ, resulting in varying graphics performance between CPU models.
In comparison to the HD 4000, the graphics core has been modified extensively. The GPU supports DirectX 11.1, OpenCL 1.2 and OpenGL 4.0. It also features an improved decoder for 4K videos and the fast Quick Sync encoder.
According to benchmarks in 3DMark 11, the HD Graphics 5000 is up to 50 percent faster than the previous HD 4000. In games, however, the performance advantage is significantly lower. With simultaneous load on the CPU, the low TDP of the ULV models (15 W) limits the Turbo Boost of the GPU. Although the HD 5000 features 40 Execution Units, the graphics performance is still somewhat below the HD Graphics 4600 with only 20 EUs (HD 4000: 16 EUs). Overall, the HD 5000 is thus just behind the AMD Radeon HD 7660G and at the level of a dedicated Radeon HD 7650M. Current games (as of 2013) will run fluently in low to medium-low settings.
Due to the 22nm 3D Tri-Gate production process, power consumption is relatively low. The HD Graphics 5000 is available on certain ULV dual-core Haswell models in the 15 Watt TDP range.
Intel HD Graphics (Braswell)
► remove from comparison 
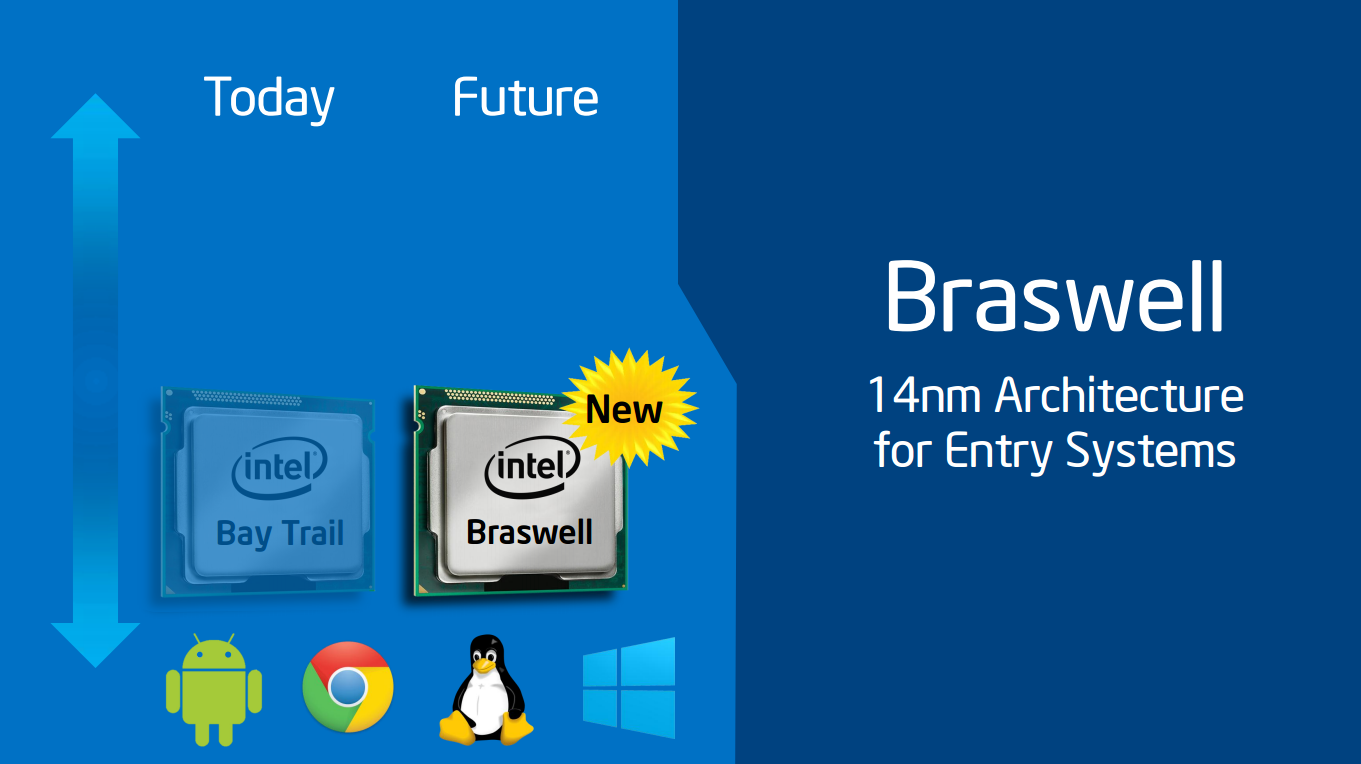
The Intel HD Graphics (Braswell) is an integrated graphics card in the low end SoCs of the Braswell series (e.g. Pentium N3700). It is based on the same architecture as the integrated GPU of the Broadwell graphics cards (e.g. HD Graphics 5300), but offers less shader cores and slower clock speeds.
The performance depends on the processor. The fastest models offer 16 EUs (shader cores) at 400 - 700 MHz. It should be about twice as fast as the old HD Graphics in Bay Trail SoCs. At the time of announcement in Q1 2015 the following models exist:
- Pentium N3700: 16 EUs @ 400 - 700 MHz, Dual-Channel Memory
- Celeron N3150: 12 EUs @ 320 - 640 MHz, Dual-Channel Memory
- Celeron N3050: 12 EUs @ 320 - 600 MHz, Dual-Channel Memory
- Celeron N3000: 12 EUs @ 320 - 600 MHz, Dual-Channel Memory
In the first CPUs the graphics card was only called Intel HD Graphics. Later (e.g. in the Celeron N3060) Intel renamed it to Intel HD Graphics 400 (Celeron with 12 EUs) and Intel HD Graphics 405 (Pentium with 16 EUs).
Gaming performance ist still only suited for older or less demanding games. Often also the processor is limited gaming performance (e.g. in the dual-core N3000).
The SoC also integrates a video decoding engine that should be able to handle 4K H.265 videos.
Intel HD Graphics 3000
► remove from comparison 
The Intel HD Graphics 3000 (or Intel Graphics Media Accelerator HD 3000, GMA HD 3000, Intel HD Graphics 200) is an integrated graphics card in the Sandy Bridge codenamed processors. The HD Graphics 3000 has no dedicated memory but shares the Level 3 / LLC Cache with the CPU cores and also part of the main memory. Due to TurboBoost, the GPU can be overclocked depending on the current CPU load and power consumption. The base speed and the turbo boost speed of the HD Graphics 3000 depend on the processor:
- ULV processors Core ix-2xx7 (base 350MHz, Turbo 900-1000MHz)
- LV processors Core ix-2xx5 (base 500MHz, Turbo 1000MHz)
- Mainstream and high-end Dual und Quad-Core Core ix-2xx0 (base 650MHz, Turbo 1100-1300MHz)
- Desktop K processors (base 850, Turbo 1100-1350MHz)
The HD 3000 offers 12 Execution Units (EUs) like the old Intel GMA HD but due to architectural changes each EU is now faster. The slower HD Graphics 2000 uses only 6 Execution Units. The EUs can be accessed using DirectX 10.1, OpenGL 3.0 and DirectCompute 4.1. OpenCL is not supported (the media SDK only uses the CPU).
Our performance tests with the high clocked mainstream version of the HD Graphics 3000 in quad-core processors showed a performance level on par with older entry level generations from NVIDIA (e.g. GeForce 310M) and AMD (HD 5450). In comparison with AMD's APU models, the HD 3000 can only compete against the C-and E-series, but not the faster Llano and Trinity models. The quality of the Intel drivers has been improved over the years, so most games are flawlessly playable (if the minimum requirements are fullfilled).
We could measure smooth frame rates in games like Dead Space 3, World of Tanks, Fifa 13, Torchlight 2, Counter-Strike: GO reach, Diablo 3, and many older games, though usually only in minimal detail settings. For accurate performance analysis and gaming benchmarks, read our article "Intel HD Graphics 3000" or scroll down in this article.
Altought 2x Antialiasing (AA) is supported, the chip is as fast as when rendering 4x AA. In the Unigine Valley benchmark a i7-2637M for example reached the same score with 2x AA and 4x AA.
In addition to the GPU, the chip also houses some dedicated units for decoding and encoding HD videos. On the IDF Intel demonstrated the encoding of a 3 minute long 1080p video to an iPhone compatible format in 640x360 in only 14s. Another novelty of the Sandy Bridge GPU is the embedded DisplayPort eDP to connect internal Displays.
Due to the integration in the 32nm built CPU, the power consumption of the GPU should be quite low.
| Intel HD Graphics 5000 | Intel HD Graphics (Braswell) | Intel HD Graphics 3000 |
Manufacturer | Intel | Intel | Intel |
HD Graphics Series | | | |
Codename | Haswell GT3 | Braswell | Sandy Bridge |
Architecture | Gen. 7.5 Haswell | Gen. 8 | Gen. 6 Sandy Bridge |
Pipelines | 40 - unified | 16 - unified | 12 - unified |
Core Speed | 200 - 1100 (Boost) MHz | 320 - 700 (Boost) MHz | 350 - 1350 (Boost) MHz |
Memory Bus Width | 64/128 Bit | 64/128 Bit | 64/128 Bit |
Shared Memory | yes | yes | yes |
DirectX | DirectX 11.1, Shader 5.0 | DirectX 11.2, Shader 5.0 | DirectX 10.1, Shader 4.1 |
technology | 22 nm | 14 nm | 32 nm |
Features | QuickSync | | |
Date of Announcement | 05.06.2013 | 01.04.2015 | 01.02.2011 |
| | CPU in HD Graphics 3000 | GPU Base Speed | GPU Boost / Turbo |
---|
Intel Core i7-2700K | 4 x 3500 MHz, 95 W | 850 MHz | 1350 MHz | Intel Core i7-2600K | 4 x 3400 MHz, 95 W | 850 MHz | 1350 MHz | Intel Core i7-2960XM | 4 x 2700 MHz, 55 W | 650 MHz | 1300 MHz | » show 41 more | Intel Core i7-2860QM | 4 x 2500 MHz, 45 W | 650 MHz | 1300 MHz | Intel Core i7-2920XM | 4 x 2500 MHz, 55 W | 650 MHz | 1300 MHz | Intel Core i5-2500K | 4 x 3300 MHz, 95 W | 850 MHz | 1100 MHz | Intel Core i7-2760QM | 4 x 2400 MHz, 45 W | 650 MHz | 1300 MHz | Intel Core i7-2820QM | 4 x 2300 MHz, 45 W | 650 MHz | 1300 MHz | Intel Core i7-2720QM | 4 x 2200 MHz, 45 W | 650 MHz | 1300 MHz | Intel Core i7-2675QM | 4 x 2200 MHz, 45 W | 650 MHz | 1200 MHz | Intel Core i7-2670QM | 4 x 2200 MHz, 45 W | 650 MHz | 1100 MHz | Intel Core i7-2635QM | 4 x 2000 MHz, 45 W | 650 MHz | 1200 MHz | Intel Core i7-2630QM | 4 x 2000 MHz, 45 W | 650 MHz | 1100 MHz | Intel Core i7-2640M | 2 x 2800 MHz, 35 W | 650 MHz | 1300 MHz | Intel Core i7-2620M | 2 x 2700 MHz, 35 W | 650 MHz | 1300 MHz | Intel Core i5-2540M | 2 x 2600 MHz, 35 W | 650 MHz | 1300 MHz | Intel Core i5-2520M | 2 x 2500 MHz, 35 W | 650 MHz | 1300 MHz | Intel Core i5-2450M | 2 x 2500 MHz, 35 W | 650 MHz | 1300 MHz | Intel Core i5-2435M | 2 x 2400 MHz, 35 W | 650 MHz | 1300 MHz | Intel Core i5-2430M | 2 x 2400 MHz, 35 W | 650 MHz | 1200 MHz | Intel Core i5-2415M | 2 x 2300 MHz, 35 W | 650 MHz | 1300 MHz | Intel Core i5-2410M | 2 x 2300 MHz, 35 W | 650 MHz | 1200 MHz | Intel Core i7-2649M | 2 x 2300 MHz, 25 W | 500 MHz | 1100 MHz | Intel Core i3-2370M | 2 x 2400 MHz, 35 W | 650 MHz | 1150 MHz | Intel Core i3-2350M | 2 x 2300 MHz, 35 W | 650 MHz | 1150 MHz | Intel Core i3-2348M | 2 x 2300 MHz, 35 W | 650 MHz | 1150 MHz | Intel Core i7-2629M | 2 x 2100 MHz, 25 W | 500 MHz | 1100 MHz | Intel Core i7-2677M | 2 x 1800 MHz, 17 W | 350 MHz | 1200 MHz | Intel Core i3-2330M | 2 x 2200 MHz, 35 W | 650 MHz | 1100 MHz | Intel Core i3-2328M | 2 x 2200 MHz, 35 W | 650 MHz | 1100 MHz | Intel Core i7-2637M | 2 x 1700 MHz, 17 W | 350 MHz | 1200 MHz | Intel Core i7-2657M | 2 x 1600 MHz, 17 W | 350 MHz | 1000 MHz | Intel Core i3-2312M | 2 x 2100 MHz, 35 W | 350 MHz | 1100 MHz | Intel Core i3-2310M | 2 x 2100 MHz, 35 W | 650 MHz | 1100 MHz | Intel Core i3-2308M | 2 x 2100 MHz, 35 W | 650 MHz | 1100 MHz | Intel Core i5-2557M | 2 x 1700 MHz, 17 W | 350 MHz | 1200 MHz | Intel Core i7-2617M | 2 x 1500 MHz, 17 W | 350 MHz | 950 MHz | Intel Core i5-2467M | 2 x 1600 MHz, 17 W | 350 MHz | 1150 MHz | Intel Core i5-2537M | 2 x 1400 MHz, 17 W | 350 MHz | 900 MHz | Intel Core i3-2377M | 2 x 1500 MHz, 17 W | 350 MHz | 1000 MHz | Intel Core i3-2375M | 2 x 1500 MHz, 17 W | 350 MHz | 1000 MHz | Intel Core i3-2367M | 2 x 1400 MHz, 17 W | 350 MHz | 1000 MHz | Intel Core i3-2365M | 2 x 1400 MHz, 17 W | 350 MHz | 1000 MHz | Intel Core i3-2357M | 2 x 1300 MHz, 17 W | 350 MHz | 950 MHz | min. - max. | | 200 - 850 MHz | 600 - 1350 MHz |
|
Benchmarks
Performance Rating - 3DMark 11 + Fire Strike + Time Spy - HD Graphics 5000
4.1 pt (4%)
...
...
Performance Rating - 3DMark 11 + Fire Strike + Time Spy - HD Graphics (Braswell)
2.2 pt (2%)
...
Intel HD Graphics (Braswell)
...
3DMark - 3DMark Ice Storm Unlimited Graphics
65904 Points (10%)
3DMark - 3DMark Ice Storm Extreme Graphics
37346 Points (5%)
3DMark - 3DMark Cloud Gate Score
min: 4331 avg: 4586 median: 4496.5 (6%) max: 5059 Points
min: 1327 avg: 1595 median: 1529 (2%) max: 2134 Points
min: 2277 avg: 2642 median: 2656.5 (4%) max: 2979 Points
3DMark - 3DMark Cloud Gate Graphics
min: 5381 avg: 5981 median: 5693.5 (3%) max: 6762 Points
min: 1950 avg: 2187 median: 2193 (1%) max: 2457 Points
min: 2356 avg: 2593 median: 2502.5 (1%) max: 3011 Points
3DMark - 3DMark Fire Strike Standard Score
min: 583 avg: 669 median: 651 (2%) max: 808 Points
min: 204 avg: 235 median: 238 (1%) max: 256 Points
3DMark - 3DMark Fire Strike Standard Graphics
min: 620 avg: 725 median: 715.5 (1%) max: 875 Points
min: 218 avg: 257 median: 261 (1%) max: 299 Points
3DMark - 3DMark Ice Storm Graphics
min: 35584 avg: 41867 median: 40454 (5%) max: 52302 Points
min: 20067 avg: 24121 median: 24638 (3%) max: 26079 Points
min: 25494 avg: 29036 median: 27124 (4%) max: 36403 Points
3DMark 11 - 3DM11 Performance Score
min: 962 avg: 1088 median: 1125.5 (3%) max: 1163 Points
min: 310 avg: 435 median: 436 (1%) max: 518 Points
3DMark 11 - 3DM11 Performance GPU
min: 859 avg: 993 median: 1033.5 (2%) max: 1072 Points
min: 275 avg: 390 median: 395 (1%) max: 468 Points
3DMark Vantage
3DM Vant. Perf. total + Intel HD Graphics 5000 3DMark Vantage - 3DM Vant. Perf. total
min: 3418 avg: 4231 median: 4276.5 (4%) max: 4734 Points
3DM Vant. Perf. total + Intel HD Graphics (Braswell) 1479 Points (1%)
3DM Vant. Perf. total + Intel HD Graphics 3000 min: 1135 avg: 1560 median: 1568 (2%) max: 2164 Points
3DM Vant. Perf. GPU no PhysX + Intel HD Graphics 5000 3DMark Vantage - 3DM Vant. Perf. GPU no PhysX
min: 2917 avg: 3639 median: 3665 (3%) max: 4108 Points
3DM Vant. Perf. GPU no PhysX + Intel HD Graphics (Braswell) 1328 Points (1%)
3DM Vant. Perf. GPU no PhysX + Intel HD Graphics 3000 min: 927 avg: 1331 median: 1240 (1%) max: 8858 Points
3DMark 2001SE - 3DMark 2001 - Standard
min: 7796 avg: 12752 median: 11654 (12%) max: 19742 Points
3DMark 03 - 3DMark 03 - Standard
min: 15752 avg: 18768 median: 18768 (10%) max: 21784 Points
min: 5162 avg: 8577 median: 7751 (4%) max: 12358 Points
3DMark 05 - 3DMark 05 - Standard
min: 9623 avg: 9763 median: 9763 (14%) max: 9903 Points
min: 3498 avg: 6355 median: 5968 (9%) max: 9344 Points
3DMark 06 3DMark 06 - Standard 1280x1024 + Intel HD Graphics 5000 min: 4751 avg: 5775 median: 5940 (11%) max: 6160 Points
3DMark 06 - Standard 1280x1024 + Intel HD Graphics (Braswell) 1311 Points (2%)
3DMark 06 - Standard 1280x1024 + Intel HD Graphics 3000 min: 1392 avg: 3451 median: 3286.5 (6%) max: 5853 Points
3DMark 06 - Standard 1280x800 + Intel HD Graphics 5000 6675 Points (12%)
3DMark 06 - Standard 1280x800 + Intel HD Graphics 3000 min: 2550 avg: 3176 median: 3224 (6%) max: 3753 Points
3DMark 06 - Score Unknown Settings + Intel HD Graphics 3000 min: 3508 avg: 3847 median: 3617 (7%) max: 5041
3DMark 06 - Standard 1280x768 + Intel HD Graphics 3000 min: 2788 avg: 3293 median: 3308 (6%) max: 3942 Points
Unigine Heaven 3.0 - Unigine Heaven 3.0 DX 11
12.1 fps (4%)
Unigine Heaven 3.0 - Unigine Heaven 3.0 OpenGL
12.1 fps (5%)
Unigine Heaven 2.1 - Heaven 2.1 high
min: 12.3 avg: 13 median: 13.1 (2%) max: 13.5 fps
min: 3.2 avg: 4.9 median: 4.9 (1%) max: 6.6 fps
min: 4 avg: 7.7 median: 7.8 (1%) max: 9.3 fps
SPECviewperf 11
specvp11 snx-01 + Intel HD Graphics 5000 SPECviewperf 11 - specvp11 snx-01
min: 1.26 avg: 1.5 median: 1.5 (1%) max: 1.64 fps
specvp11 snx-01 + Intel HD Graphics 3000 min: 0.18 avg: 0.3 median: 0.2 (0%) max: 0.75 fps
MSI CR640-048XPL | 2310M | 2048 | | | 0.18 |
Lenovo ThinkPad T420i NW16NPB | 2310M | 2048 | | | 0.19 |
HP ProBook 4330s XX946EA | 2310M | 3072 | | | 0.19 |
Dell Vostro 3450 (Vostro0150) | 2310M | 2048 | | | 0.19 |
Toshiba Satellite Pro R850-122 | 2310M | 4096 | | | 0.19 |
Samsung 400B2B-H01PL | 2410M | 4096 | | | 0.24 |
HP ProBook 6360b LG632EA | 2410M | 4096 | | | 0.25 |
HP ProBook 5330m (LG724EA) | 2520M | | | | 0.29 |
Lenovo ThinkPad Edge E130 (NZU36PB) | 2367M | 4096 | | | 0.41 |
Fujitsu LifeBook P771 (VFY:P7710MF011PL) | 2617M | 4096 | | | 0.64 |
HP ProBook 4340s (B6M41EA) | 2370M | 4096 | | | 0.75 |
specvp11 tcvis-02 + Intel HD Graphics 5000 SPECviewperf 11 - specvp11 tcvis-02
min: 1.77 avg: 2.1 median: 2.1 (4%) max: 2.51 fps
specvp11 tcvis-02 + Intel HD Graphics 3000 min: 0.12 avg: 0.3 median: 0.2 (0%) max: 0.86 fps
Lenovo ThinkPad T420i NW16NPB | 2310M | 2048 | | | 0.12 |
MSI CR640-048XPL | 2310M | 2048 | | | 0.12 |
HP ProBook 4330s XX946EA | 2310M | 3072 | | | 0.12 |
Dell Vostro 3450 (Vostro0150) | 2310M | 2048 | | | 0.12 |
Toshiba Satellite Pro R850-122 | 2310M | 4096 | | | 0.12 |
HP ProBook 6360b LG632EA | 2410M | 4096 | | | 0.16 |
HP ProBook 5330m (LG724EA) | 2520M | | | | 0.16 |
Samsung 400B2B-H01PL | 2410M | 4096 | | | 0.16 |
Fujitsu LifeBook P771 (VFY:P7710MF011PL) | 2617M | 4096 | | | 0.44 |
Lenovo ThinkPad Edge E130 (NZU36PB) | 2367M | 4096 | | | 0.46 |
HP ProBook 4340s (B6M41EA) | 2370M | 4096 | | | 0.86 |
specvp11 sw-02 + Intel HD Graphics 5000 SPECviewperf 11 - specvp11 sw-02
min: 7.95 avg: 9.9 median: 9.9 (12%) max: 11.8 fps
specvp11 sw-02 + Intel HD Graphics 3000 min: 2.55 avg: 3.6 median: 3.6 (4%) max: 4.61 fps
Lenovo ThinkPad Edge E130 (NZU36PB) | 2367M | 4096 | | | 2.55 |
Fujitsu LifeBook P771 (VFY:P7710MF011PL) | 2617M | 4096 | | | 3.58 |
HP ProBook 4340s (B6M41EA) | 2370M | 4096 | | | 4.61 |
specvp11 proe-05 + Intel HD Graphics 5000 SPECviewperf 11 - specvp11 proe-05
min: 1.42 avg: 1.6 median: 1.6 (7%) max: 1.78 fps
specvp11 proe-05 + Intel HD Graphics 3000 min: 0.26 avg: 0.5 median: 0.5 (2%) max: 0.65 fps
Lenovo ThinkPad Edge E130 (NZU36PB) | 2367M | 4096 | | | 0.26 |
Fujitsu LifeBook P771 (VFY:P7710MF011PL) | 2617M | 4096 | | | 0.41 |
Lenovo ThinkPad T420i NW16NPB | 2310M | 2048 | | | 0.44 |
MSI CR640-048XPL | 2310M | 2048 | | | 0.44 |
Dell Vostro 3450 (Vostro0150) | 2310M | 2048 | | | 0.44 |
Toshiba Satellite Pro R850-122 | 2310M | 4096 | | | 0.45 |
HP ProBook 4330s XX946EA | 2310M | 3072 | | | 0.46 |
HP ProBook 4340s (B6M41EA) | 2370M | 4096 | | | 0.53 |
Samsung 400B2B-H01PL | 2410M | 4096 | | | 0.58 |
HP ProBook 6360b LG632EA | 2410M | 4096 | | | 0.6 |
HP ProBook 5330m (LG724EA) | 2520M | | | | 0.65 |
specvp11 maya-03 + Intel HD Graphics 5000 SPECviewperf 11 - specvp11 maya-03
min: 12.95 avg: 14.2 median: 14.2 (11%) max: 15.43 fps
specvp11 maya-03 + Intel HD Graphics 3000 min: 1.07 avg: 4.6 median: 5 (4%) max: 7.63 fps
Fujitsu LifeBook P771 (VFY:P7710MF011PL) | 2617M | 4096 | | | 1.07 |
Lenovo ThinkPad Edge E130 (NZU36PB) | 2367M | 4096 | | | 4.95 |
HP ProBook 4340s (B6M41EA) | 2370M | 4096 | | | 7.63 |
specvp11 lightwave-01 + Intel HD Graphics 5000 SPECviewperf 11 - specvp11 lightwave-01
min: 13.34 avg: 14.5 median: 14.5 (16%) max: 15.62 fps
specvp11 lightwave-01 + Intel HD Graphics 3000 min: 3.63 avg: 5.5 median: 5.5 (6%) max: 7.35 fps
Lenovo ThinkPad Edge E130 (NZU36PB) | 2367M | 4096 | | | 3.63 |
HP ProBook 4340s (B6M41EA) | 2370M | 4096 | | | 7.35 |
specvp11 ensight-04 + Intel HD Graphics 5000 SPECviewperf 11 - specvp11 ensight-04
min: 2.06 avg: 2.1 median: 2.1 (1%) max: 2.11 fps
specvp11 ensight-04 + Intel HD Graphics 3000 min: 0.1 avg: 0.4 median: 0.1 (0%) max: 1.29 fps
MSI CR640-048XPL | 2310M | 2048 | | | 0.1 |
Lenovo ThinkPad T420i NW16NPB | 2310M | 2048 | | | 0.11 |
HP ProBook 4330s XX946EA | 2310M | 3072 | | | 0.11 |
Dell Vostro 3450 (Vostro0150) | 2310M | 2048 | | | 0.11 |
Toshiba Satellite Pro R850-122 | 2310M | 4096 | | | 0.11 |
HP ProBook 6360b LG632EA | 2410M | 4096 | | | 0.14 |
Samsung 400B2B-H01PL | 2410M | 4096 | | | 0.16 |
HP ProBook 5330m (LG724EA) | 2520M | | | | 0.19 |
Lenovo ThinkPad Edge E130 (NZU36PB) | 2367M | 4096 | | | 0.76 |
Fujitsu LifeBook P771 (VFY:P7710MF011PL) | 2617M | 4096 | | | 1.29 |
HP ProBook 4340s (B6M41EA) | 2370M | 4096 | | | 1.29 |
specvp11 catia-03 + Intel HD Graphics 5000 SPECviewperf 11 - specvp11 catia-03
4.5 fps (5%)
Windows 7 Experience Index - Win7 Gaming graphics
min: 6.5 avg: 6.6 median: 6.6 (84%) max: 6.7 Points
min: 5.5 avg: 6.1 median: 6.1 (77%) max: 6.4 Points
Windows 7 Experience Index - Win7 Graphics
min: 5.8 avg: 5.9 median: 5.9 (74%) max: 5.9 Points
min: 4.1 avg: 5.1 median: 4.7 (59%) max: 6.4 Points
Cinebench R10 Cinebench R10 Shading (32bit) + Intel HD Graphics 5000 Cinebench R10 - Cinebench R10 Shading (32bit)
min: 5143 avg: 6901 median: 6946.5 (33%) max: 7959
Cinebench R10 Shading (32bit) + Intel HD Graphics (Braswell) min: 1788 avg: 2276 median: 2284 (11%) max: 2747
Cinebench R10 Shading (32bit) + Intel HD Graphics 3000 min: 1712 avg: 4274 median: 4414 (21%) max: 7038
Cinebench R11.5 Cinebench R11.5 OpenGL 64 Bit + Intel HD Graphics 5000 Cinebench R11.5 - Cinebench R11.5 OpenGL 64 Bit
min: 15.01 avg: 19.6 median: 19.6 (9%) max: 24.76 fps
Cinebench R11.5 OpenGL 64 Bit + Intel HD Graphics (Braswell) min: 6.89 avg: 9.1 median: 9.5 (4%) max: 9.86 fps
Cinebench R11.5 OpenGL 64 Bit + Intel HD Graphics 3000 min: 4.75 avg: 8.7 median: 8.4 (4%) max: 13.02 fps
Cinebench R15
Cinebench R15 OpenGL 64 Bit + Intel HD Graphics 5000 Cinebench R15 - Cinebench R15 OpenGL 64 Bit
min: 24.15 avg: 27.4 median: 27.4 (8%) max: 30.64 fps
Cinebench R15 OpenGL 64 Bit + Intel HD Graphics (Braswell) min: 11.13 avg: 12.4 median: 12.3 (3%) max: 13.82 fps
Cinebench R15 OpenGL 64 Bit + Intel HD Graphics 3000 0 fps (0%)
Acer Aspire M3-581TG | 2637M | 4096 | 350 - 1200 / MHz | | 0 (!) |
Cinebench R15 OpenGL Ref. Match 64 Bit + Intel HD Graphics 5000 Cinebench R15 - Cinebench R15 OpenGL Ref. Match 64 Bit
min: 63.3 avg: 81.1 median: 80.7 (81%) max: 99.6 %
Cinebench R15 OpenGL Ref. Match 64 Bit + Intel HD Graphics (Braswell) 98 % (98%)
Cinebench R15 OpenGL Ref. Match 64 Bit + Intel HD Graphics 3000 min: 32.2 avg: 32.6 median: 32.6 (33%) max: 32.9 %
Acer Aspire M3-581TG | 2637M | 4096 | 350 - 1200 / MHz | | 32.2 |
Compal Barebone | 2860QM | 4096 | | | 32.9 |
GFXBench (DX / GLBenchmark) 2.7
GLBench 2.7 T-Rex HD Offscreen C24Z16 + Intel HD Graphics 5000 GFXBench (DX / GLBenchmark) 2.7 - GLBench 2.7 T-Rex HD Offscreen C24Z16
min: 62 avg: 72.5 median: 72.5 (1%) max: 83 fps
GLBench 2.7 T-Rex HD Offscreen C24Z16 + Intel HD Graphics (Braswell) 33 fps (0%)
GLBench 2.7 T-Rex HD Onscreen C24Z16 + Intel HD Graphics 5000 GFXBench (DX / GLBenchmark) 2.7 - GLBench 2.7 T-Rex HD Onscreen C24Z16
59.9 fps (2%)
GLBench 2.7 T-Rex HD Onscreen C24Z16 + Intel HD Graphics (Braswell) 43 fps (1%)
GFXBench 3.0 - GFXBench 3.0 Manhattan Offscreen
22.5 fps (2%)
16.1 fps (2%)
GFXBench 3.0 - GFXBench 3.0 Manhattan
30.2 fps (8%)
25.4 fps (7%)
LuxMark v2.0 64Bit - LuxMark v2.0 Room GPU
min: 139 avg: 187 median: 201 (2%) max: 221 Samples/s
min: 54 avg: 54.5 median: 54.5 (1%) max: 55 Samples/s
LuxMark v2.0 64Bit - LuxMark v2.0 Sala GPU
min: 286 avg: 305 median: 306 (1%) max: 324 Samples/s
min: 76 avg: 80.5 median: 80.5 (0%) max: 85 Samples/s
ComputeMark v2.1 - ComputeMark v2.1 Result
min: 775 avg: 817 median: 816.5 (2%) max: 858
306 (1%)
Average Benchmarks Intel HD Graphics 5000 → 100% n=11
Average Benchmarks Intel HD Graphics (Braswell) → 46% n=11
Average Benchmarks Intel HD Graphics 3000 → 46% n=11
- Range of benchmark values for this graphics card

- Average benchmark values for this graphics card
* Smaller numbers mean a higher performance
1 This benchmark is not used for the average calculation
Game Benchmarks
The following benchmarks stem from our benchmarks of review laptops. The performance depends on the used graphics memory, clock rate, processor, system settings, drivers, and operating systems. So the results don't have to be representative for all laptops with this GPU. For detailed information on the benchmark results, click on the fps number.
HD Graphics 3000:
48.4 [X] Acer Aspire M3-581TGIntel Core i7-2637M 1.7GHz
HD Graphics 3000
min:
40 fps
fps
HD Graphics 3000:
22.1 [X] Acer Aspire M3-581TGIntel Core i7-2637M 1.7GHz
HD Graphics 3000
min:
13 fps, max:
27 fps
fps
HD Graphics 3000:
13.2 [X] Acer Aspire M3-581TGIntel Core i7-2637M 1.7GHz
HD Graphics 3000
min:
6 fps, max:
17 fps
fps
HD Graphics 3000:
0 (!) [X] Acer Aspire M3-581TGIntel Core i7-2637M 1.7GHz
HD Graphics 3000
Problem during benchmarking occured: game wont start fps
HD Graphics 3000:
0 (!) [X] Acer Aspire M3-581TGIntel Core i7-2637M 1.7GHz
HD Graphics 3000
Problem during benchmarking occured: game wont start fps
HD Graphics (Braswell):
16.8 fps
HD Graphics 3000:
25.1 [X] Acer Aspire M3-581TGIntel Core i7-2637M 1.7GHz
HD Graphics 3000
38 [X] Compal BareboneIntel Core i7-2860QM 2.5GHz
HD Graphics 3000
min:
29 fps, max:
49 fps
~ 32 fps
HD Graphics (Braswell):
11.9 fps
HD Graphics 3000:
15.6 [X] Acer Aspire M3-581TGIntel Core i7-2637M 1.7GHz
HD Graphics 3000
min:
11 fps, max:
21 fps
21.7 [X] Compal BareboneIntel Core i7-2860QM 2.5GHz
HD Graphics 3000
min:
14 fps, max:
31 fps
~ 19 fps
HD Graphics (Braswell):
13.7 fps
HD Graphics (Braswell):
9.5 fps
HD Graphics 3000:
48.1 fps [X] Compal BareboneIntel Core i7-2860QM 2.5GHz
HD Graphics 3000
min:
41.1 fps
50.9 [X] Acer Aspire M3-581TGIntel Core i7-2637M 1.7GHz
HD Graphics 3000
min:
42 fps
~ 50 fps
HD Graphics 3000:
19.4 [X] Acer Aspire M3-581TGIntel Core i7-2637M 1.7GHz
HD Graphics 3000
min:
17 fps
21.3 fps [X] Compal BareboneIntel Core i7-2860QM 2.5GHz
HD Graphics 3000
min:
19.8 fps
~ 20 fps
HD Graphics 3000:
8.3 fps [X] Compal BareboneIntel Core i7-2860QM 2.5GHz
HD Graphics 3000
min:
7.9 fps
fps
HD Graphics 3000:
7.4 fps [X] Compal BareboneIntel Core i7-2860QM 2.5GHz
HD Graphics 3000
min:
7.1 fps
fps
HD Graphics (Braswell):
27.2 fps
HD Graphics 3000:
0 (!) [X] Acer Aspire M3-581TGIntel Core i7-2637M 1.7GHz
HD Graphics 3000
Problem during benchmarking occured: game wont start DirectX Error fps
HD Graphics (Braswell):
7.1 fps
100%
HD Graphics 5000:
19.2 fps
39%
HD Graphics 3000:
7.5 [X] Acer Aspire M3-581TGIntel Core i7-2637M 1.7GHz
HD Graphics 3000
min:
4 fps, max:
17 fps
fps
100%
HD Graphics 5000:
16 fps
100%
HD Graphics 5000:
4.4 fps
100%
HD Graphics 5000:
2.6 fps
100%
HD Graphics 5000:
20.8 fps
63%
HD Graphics (Braswell):
13.2 fps
100%
HD Graphics 5000:
15.1 fps
58%
HD Graphics (Braswell):
8.7 fps
100%
HD Graphics 5000:
7 fps
100%
HD Graphics 5000:
4.3 fps
100%
HD Graphics 5000:
12.7 fps
43%
HD Graphics (Braswell):
5.4 fps
0%
HD Graphics 3000:
0 (!) [X] Acer Aspire M3-581TGIntel Core i7-2637M 1.7GHz
HD Graphics 3000
Problem during benchmarking occured: game wont start fps
100%
HD Graphics 5000:
9.6 fps
41%
HD Graphics (Braswell):
3.9 fps
100%
HD Graphics 5000:
5.5 fps
100%
HD Graphics 5000:
2.9 fps
100%
HD Graphics 5000:
15.8 fps
100%
HD Graphics 5000:
10.6 fps
100%
HD Graphics 5000:
17.4 fps
47%
HD Graphics (Braswell):
8.2 fps
100%
HD Graphics 5000:
12 fps
51%
HD Graphics (Braswell):
6.1 fps
100%
HD Graphics 5000:
4.5 fps
100%
HD Graphics 5000:
2.1 fps
100%
HD Graphics 5000:
14.3 fps
43%
HD Graphics (Braswell):
6.1 fps
0%
HD Graphics 3000:
0 (!) [X] Acer Aspire M3-581TGIntel Core i7-2637M 1.7GHz
HD Graphics 3000
Problem during benchmarking occured: game wont start fps
100%
HD Graphics 5000:
10.6 fps
41%
HD Graphics (Braswell):
4.3 fps
100%
HD Graphics 5000:
5.4 fps
100%
HD Graphics 5000:
25.4 fps
100%
HD Graphics 5000:
16.2 fps
100%
HD Graphics 5000:
9.7 fps
100%
HD Graphics 5000:
15.5 fps
39%
HD Graphics (Braswell):
6 fps
61%
HD Graphics 3000:
9.5 [X] Acer Aspire M3-581TGIntel Core i7-2637M 1.7GHz
HD Graphics 3000
min:
4 fps, max:
15 fps
fps
100%
HD Graphics 5000:
12.2 fps
26%
HD Graphics (Braswell):
3.2 fps
100%
HD Graphics 5000:
51 fps
25%
HD Graphics (Braswell):
13 13 ~ 13 fps
100%
HD Graphics 5000:
35 fps
34%
HD Graphics (Braswell):
12 12.5 ~ 12 fps
100%
HD Graphics 5000:
20 fps
100%
HD Graphics 5000:
13 fps
100%
HD Graphics 5000:
14.2 fps
100%
HD Graphics 5000:
10.6 fps
100%
HD Graphics 5000:
14.7 fps
100%
HD Graphics 5000:
9.2 fps
100%
HD Graphics 5000:
28.9 fps
47%
HD Graphics (Braswell):
13.7 fps
100%
HD Graphics 5000:
20.9 fps
42%
HD Graphics (Braswell):
8.8 fps
100%
HD Graphics 5000:
11.4 fps
100%
HD Graphics 5000:
20.1 fps
100%
HD Graphics 5000:
13 fps
100%
HD Graphics 5000:
7.2 fps
100%
HD Graphics 5000:
36.2 fps
100%
HD Graphics 5000:
28.1 fps
100%
HD Graphics 5000:
17.4 fps
100%
HD Graphics 5000:
168.3 fps
38%
HD Graphics (Braswell):
64 fps
100%
HD Graphics 5000:
32.8 fps
57%
HD Graphics (Braswell):
18.7 fps
100%
HD Graphics 5000:
14.2 fps
100%
HD Graphics 5000:
10 fps
100%
HD Graphics 5000:
28.7 fps
28%
HD Graphics (Braswell):
7.9 fps
59%
HD Graphics 3000:
17 [X] Acer Aspire M3-581TGIntel Core i7-2637M 1.7GHz
HD Graphics 3000
min:
13 fps, max:
22 fps
fps
100%
HD Graphics 5000:
17.6 fps
32%
HD Graphics (Braswell):
5.6 fps
54%
HD Graphics 3000:
9.5 [X] Acer Aspire M3-581TGIntel Core i7-2637M 1.7GHz
HD Graphics 3000
min:
6 fps, max:
14 fps
fps
100%
HD Graphics 5000:
6.6 fps
65%
HD Graphics 3000:
4.3 [X] Acer Aspire M3-581TGIntel Core i7-2637M 1.7GHz
HD Graphics 3000
fps
100%
HD Graphics 5000:
5.2 fps
65%
HD Graphics 3000:
3.4 [X] Acer Aspire M3-581TGIntel Core i7-2637M 1.7GHz
HD Graphics 3000
fps
100%
HD Graphics 5000:
85.7 fps
27%
HD Graphics (Braswell):
23 fps
77%
HD Graphics 3000:
50 [X] Acer Aspire M3-581TGIntel Core i7-2637M 1.7GHz
HD Graphics 3000
min:
37 fps, max:
65 fps
82.5 [X] i7-2600K HD Graphics 3000Intel Core i7-2600K 3.4GHz
HD Graphics 3000
min:
59 fps, max:
109 fps
~ 66 fps
100%
HD Graphics 5000:
30.2 fps
41%
HD Graphics (Braswell):
12.5 fps
76%
HD Graphics 3000:
17.8 [X] Acer Aspire M3-581TGIntel Core i7-2637M 1.7GHz
HD Graphics 3000
min:
14 fps, max:
25 fps
27.2 [X] i7-2600K HD Graphics 3000Intel Core i7-2600K 3.4GHz
HD Graphics 3000
min:
22 fps, max:
36 fps
~ 23 fps
100%
HD Graphics 5000:
14.9 fps
87%
HD Graphics 3000:
12.5 [X] Acer Aspire M3-581TGIntel Core i7-2637M 1.7GHz
HD Graphics 3000
min:
12.5 fps, max:
14 fps
13.2 [X] i7-2600K HD Graphics 3000Intel Core i7-2600K 3.4GHz
HD Graphics 3000
min:
13 fps, max:
16 fps
~ 13 fps
100%
HD Graphics 5000:
12.5 fps
100%
HD Graphics 3000:
12.5 [X] Acer Aspire M3-581TGIntel Core i7-2637M 1.7GHz
HD Graphics 3000
min:
12.5 fps, max:
12.5 fps
fps
100%
HD Graphics 5000:
17 18.1 ~ 18 fps
0%
HD Graphics 3000:
0 (!) [X] Acer Aspire M3-581TGIntel Core i7-2637M 1.7GHz
HD Graphics 3000
Problem during benchmarking occured: game wont start DX11 game fps
100%
HD Graphics 5000:
10.9 11.6 ~ 11 fps
100%
HD Graphics 5000:
27.2 fps
0%
HD Graphics 3000:
0 (!) [X] Acer Aspire M3-581TGIntel Core i7-2637M 1.7GHz
HD Graphics 3000
Problem during benchmarking occured: game wont start fps
100%
HD Graphics 5000:
22.1 fps
100%
HD Graphics 5000:
10.7 fps
HD Graphics 3000:
22.5 [X] Acer Aspire M3-581TGIntel Core i7-2637M 1.7GHz
HD Graphics 3000
min:
17 fps, max:
26 fps
fps
HD Graphics 3000:
14.8 [X] Acer Aspire M3-581TGIntel Core i7-2637M 1.7GHz
HD Graphics 3000
min:
12 fps, max:
19 fps
fps
100%
HD Graphics 5000:
33.2 fps
0%
HD Graphics 3000:
0 (!) [X] Acer Aspire M3-581TGIntel Core i7-2637M 1.7GHz
HD Graphics 3000
Problem during benchmarking occured: game wont start fps
100%
HD Graphics 5000:
20.2 fps
100%
HD Graphics 5000:
13.2 fps
100%
HD Graphics 5000:
11.9 14.8 ~ 13 fps
100%
HD Graphics 5000:
8.4 9.7 ~ 9 fps
100%
HD Graphics 5000:
7.6 fps
100%
HD Graphics 5000:
3.9 fps
HD Graphics 3000:
9.2 [X] Acer Aspire M3-581TGIntel Core i7-2637M 1.7GHz
HD Graphics 3000
min:
5 fps, max:
18 fps
fps
HD Graphics 3000:
14.6 [X] Acer Aspire M3-581TGIntel Core i7-2637M 1.7GHz
HD Graphics 3000
21.5 [X] Compal BareboneIntel Core i7-2860QM 2.5GHz
HD Graphics 3000
~ 18 fps
HD Graphics 3000:
8 [X] Acer Aspire M3-581TGIntel Core i7-2637M 1.7GHz
HD Graphics 3000
11.3 [X] Compal BareboneIntel Core i7-2860QM 2.5GHz
HD Graphics 3000
~ 10 fps
HD Graphics 3000:
4 [X] Acer Aspire M3-581TGIntel Core i7-2637M 1.7GHz
HD Graphics 3000
5.7 [X] Compal BareboneIntel Core i7-2860QM 2.5GHz
HD Graphics 3000
~ 5 fps
HD Graphics 3000:
2.9 [X] Acer Aspire M3-581TGIntel Core i7-2637M 1.7GHz
HD Graphics 3000
3.9 [X] Compal BareboneIntel Core i7-2860QM 2.5GHz
HD Graphics 3000
~ 3 fps
100%
HD Graphics 5000:
24 fps
100%
HD Graphics 5000:
20.5 fps
100%
HD Graphics 5000:
6.2 fps
100%
HD Graphics 5000:
28.6 fps
0%
HD Graphics 3000:
0 (!) [X] Acer Aspire M3-581TGIntel Core i7-2637M 1.7GHz
HD Graphics 3000
Problem during benchmarking occured: game wont start fps
100%
HD Graphics 5000:
19.9 fps
100%
HD Graphics 5000:
13.3 fps
HD Graphics 3000:
32 [X] Schenker Xesia M501Intel Core i7-2630QM 2GHz
HD Graphics 3000
fps
HD Graphics 3000:
21 [X] Schenker Xesia M501Intel Core i7-2630QM 2GHz
HD Graphics 3000
fps
100%
HD Graphics 5000:
51 fps
59%
HD Graphics 3000:
26 [X] Acer Aspire M3-581TGIntel Core i7-2637M 1.7GHz
HD Graphics 3000
min:
19 fps
34 [X] Schenker Xesia M501Intel Core i7-2630QM 2GHz
HD Graphics 3000
~ 30 fps
100%
HD Graphics 5000:
34 fps
65%
HD Graphics 3000:
19 [X] Acer Aspire M3-581TGIntel Core i7-2637M 1.7GHz
HD Graphics 3000
min:
14 fps
24 [X] Schenker Xesia M501Intel Core i7-2630QM 2GHz
HD Graphics 3000
~ 22 fps
100%
HD Graphics 5000:
28 fps
57%
HD Graphics 3000:
15 [X] Acer Aspire M3-581TGIntel Core i7-2637M 1.7GHz
HD Graphics 3000
min:
12 fps
17 [X] Schenker Xesia M501Intel Core i7-2630QM 2GHz
HD Graphics 3000
~ 16 fps
100%
HD Graphics 5000:
12 fps
100%
HD Graphics 3000:
12 [X] Schenker Xesia M501Intel Core i7-2630QM 2GHz
HD Graphics 3000
fps
100%
HD Graphics 5000:
165.1 fps
76%
HD Graphics 3000:
124.9 [X] Schenker Xesia M501Intel Core i7-2630QM 2GHz
HD Graphics 3000
fps
100%
HD Graphics 5000:
100.2 fps
61%
HD Graphics 3000:
58 [X] Acer Aspire M3-581TGIntel Core i7-2637M 1.7GHz
HD Graphics 3000
min:
46 fps
63.6 [X] Schenker Xesia M501Intel Core i7-2630QM 2GHz
HD Graphics 3000
~ 61 fps
100%
HD Graphics 5000:
71.4 fps
45%
HD Graphics 3000:
30.5 [X] Acer Aspire M3-581TGIntel Core i7-2637M 1.7GHz
HD Graphics 3000
min:
25 fps
34.2 [X] Schenker Xesia M501Intel Core i7-2630QM 2GHz
HD Graphics 3000
~ 32 fps
100%
HD Graphics 5000:
39.3 fps
46%
HD Graphics 3000:
17 [X] Schenker Xesia M501Intel Core i7-2630QM 2GHz
HD Graphics 3000
18 [X] Acer Aspire M3-581TGIntel Core i7-2637M 1.7GHz
HD Graphics 3000
~ 18 fps
100%
HD Graphics 5000:
39.8 fps
48%
HD Graphics 3000:
18.4 [X] Acer Aspire M3-581TGIntel Core i7-2637M 1.7GHz
HD Graphics 3000
min:
15 fps
19.2 [X] Schenker Xesia M501Intel Core i7-2630QM 2GHz
HD Graphics 3000
~ 19 fps
100%
HD Graphics 5000:
29.4 fps
48%
HD Graphics 3000:
14 [X] Acer Aspire M3-581TGIntel Core i7-2637M 1.7GHz
HD Graphics 3000
min:
12 fps
14.2 [X] Schenker Xesia M501Intel Core i7-2630QM 2GHz
HD Graphics 3000
~ 14 fps
100%
HD Graphics 5000:
21.6 fps
100%
HD Graphics 5000:
6.6 fps
HD Graphics (Braswell):
3.8 fps
HD Graphics 3000:
11.5 [X] Acer Aspire M3-581TGIntel Core i7-2637M 1.7GHz
HD Graphics 3000
14 [X] Schenker Xesia M501Intel Core i7-2630QM 2GHz
HD Graphics 3000
~ 13 fps
HD Graphics (Braswell):
2.1 fps
HD Graphics 3000:
9.5 [X] Schenker Xesia M501Intel Core i7-2630QM 2GHz
HD Graphics 3000
fps
HD Graphics 3000:
6.5 [X] Schenker Xesia M501Intel Core i7-2630QM 2GHz
HD Graphics 3000
fps
HD Graphics 3000:
4.1 [X] Schenker Xesia M501Intel Core i7-2630QM 2GHz
HD Graphics 3000
fps
HD Graphics 3000:
16.8 [X] Acer Aspire M3-581TGIntel Core i7-2637M 1.7GHz
HD Graphics 3000
19.4 [X] Schenker Xesia M501Intel Core i7-2630QM 2GHz
HD Graphics 3000
~ 18 fps
HD Graphics 3000:
21.9 [X] Schenker Xesia M501Intel Core i7-2630QM 2GHz
HD Graphics 3000
fps
100%
HD Graphics 5000:
59.6 69.8 ~ 65 fps
86%
HD Graphics 3000:
47.8 [X] Acer Aspire M3-581TGIntel Core i7-2637M 1.7GHz
HD Graphics 3000
63.8 [X] Schenker Xesia M501Intel Core i7-2630QM 2GHz
HD Graphics 3000
~ 56 fps
100%
HD Graphics 5000:
31.5 36.8 ~ 34 fps
85%
HD Graphics 3000:
24.9 [X] Acer Aspire M3-581TGIntel Core i7-2637M 1.7GHz
HD Graphics 3000
33.4 [X] Schenker Xesia M501Intel Core i7-2630QM 2GHz
HD Graphics 3000
~ 29 fps
100%
HD Graphics 5000:
14.4 15.5 ~ 15 fps
73%
HD Graphics 3000:
11.2 [X] Acer Aspire M3-581TGIntel Core i7-2637M 1.7GHz
HD Graphics 3000
11.5 [X] Schenker Xesia M501Intel Core i7-2630QM 2GHz
HD Graphics 3000
~ 11 fps
100%
HD Graphics 5000:
13.3 fps
67%
HD Graphics 3000:
8.9 [X] Schenker Xesia M501Intel Core i7-2630QM 2GHz
HD Graphics 3000
fps
100%
HD Graphics 5000:
10.4 fps
63%
HD Graphics 3000:
6.6 [X] Schenker Xesia M501Intel Core i7-2630QM 2GHz
HD Graphics 3000
fps
100%
HD Graphics 5000:
6 fps
65%
HD Graphics 3000:
3.9 [X] Schenker Xesia M501Intel Core i7-2630QM 2GHz
HD Graphics 3000
fps
100%
HD Graphics 5000:
58.6 fps
33%
HD Graphics (Braswell):
19.2 fps
68%
HD Graphics 3000:
39.9 [X] Schenker Xesia M501Intel Core i7-2630QM 2GHz
HD Graphics 3000
fps
100%
HD Graphics 5000:
31.3 fps
40%
HD Graphics (Braswell):
12.6 fps
78%
HD Graphics 3000:
24.4 [X] Schenker Xesia M501Intel Core i7-2630QM 2GHz
HD Graphics 3000
fps
100%
HD Graphics 5000:
22.7 fps
55%
HD Graphics (Braswell):
12.5 fps
66%
HD Graphics 3000:
14.9 [X] Schenker Xesia M501Intel Core i7-2630QM 2GHz
HD Graphics 3000
fps
100%
HD Graphics 5000:
12.5 fps
100%
HD Graphics 5000:
18.8 18.9 ~ 19 fps
58%
HD Graphics 3000:
10.6 (!) [X] Acer Aspire M3-581TGIntel Core i7-2637M 1.7GHz
HD Graphics 3000
Problem during benchmarking occured: small graphical problems 11.2 [X] Schenker Xesia M501Intel Core i7-2630QM 2GHz
HD Graphics 3000
~ 11 fps
100%
HD Graphics 5000:
13.9 13.9 ~ 14 fps
53%
HD Graphics 3000:
7.4 [X] Schenker Xesia M501Intel Core i7-2630QM 2GHz
HD Graphics 3000
fps
100%
HD Graphics 5000:
8.6 10.4 ~ 10 fps
100%
HD Graphics 5000:
32 [X] Dell XPS 12 HaswellIntel Core i7-4650U 1.7GHz
HD Graphics 5000
34.3 34.3 38.3 ~ 35 fps
51%
HD Graphics (Braswell):
16.2 17.4 17.5 17.7 [X] Medion Akoya S4219 
Intel Pentium N3700 1.6GHz
HD Graphics (Braswell)
22.1 ~ 18 fps
66%
HD Graphics 3000:
22.8 [X] Acer Aspire M3-581TGIntel Core i7-2637M 1.7GHz
HD Graphics 3000
23.3 [X] Schenker Xesia M501Intel Core i7-2630QM 2GHz
HD Graphics 3000
~ 23 fps
100%
HD Graphics 5000:
17 [X] Dell XPS 12 HaswellIntel Core i7-4650U 1.7GHz
HD Graphics 5000
20.1 20.9 22.5 ~ 20 fps
50%
HD Graphics (Braswell):
8.3 9.1 9.8 10 [X] Medion Akoya S4219 
Intel Pentium N3700 1.6GHz
HD Graphics (Braswell)
11.4 ~ 10 fps
55%
HD Graphics 3000:
10.6 [X] Schenker Xesia M501Intel Core i7-2630QM 2GHz
HD Graphics 3000
10.7 [X] Acer Aspire M3-581TGIntel Core i7-2637M 1.7GHz
HD Graphics 3000
~ 11 fps
100%
HD Graphics 5000:
14 [X] Dell XPS 12 HaswellIntel Core i7-4650U 1.7GHz
HD Graphics 5000
14.2 16.6 18.2 ~ 16 fps
50%
HD Graphics (Braswell):
6.9 7 7.4 8.4 [X] Medion Akoya S4219 
Intel Pentium N3700 1.6GHz
HD Graphics (Braswell)
9.6 ~ 8 fps
56%
HD Graphics 3000:
9.2 [X] Schenker Xesia M501Intel Core i7-2630QM 2GHz
HD Graphics 3000
9.3 [X] Acer Aspire M3-581TGIntel Core i7-2637M 1.7GHz
HD Graphics 3000
~ 9 fps
100%
HD Graphics 5000:
7.7 fps
HD Graphics 3000:
71 107 [X] Acer Aspire M3-581TGIntel Core i7-2637M 1.7GHz
HD Graphics 3000
138 [X] Schenker Xesia M501Intel Core i7-2630QM 2GHz
HD Graphics 3000
~ 105 fps
HD Graphics 3000:
19.4 [X] Acer Aspire M3-581TGIntel Core i7-2637M 1.7GHz
HD Graphics 3000
20 27 [X] Schenker Xesia M501Intel Core i7-2630QM 2GHz
HD Graphics 3000
~ 22 fps
HD Graphics 3000:
10 12.4 [X] Schenker Xesia M501Intel Core i7-2630QM 2GHz
HD Graphics 3000
~ 11 fps
HD Graphics 3000:
4.2 [X] Schenker Xesia M501Intel Core i7-2630QM 2GHz
HD Graphics 3000
fps
HD Graphics 3000:
15.8 [X] Schenker Xesia M501Intel Core i7-2630QM 2GHz
HD Graphics 3000
fps
HD Graphics 3000:
8.4 [X] Schenker Xesia M501Intel Core i7-2630QM 2GHz
HD Graphics 3000
fps
HD Graphics 3000:
6.4 [X] Schenker Xesia M501Intel Core i7-2630QM 2GHz
HD Graphics 3000
fps
100%
HD Graphics 5000:
44 [X] Dell XPS 12 HaswellIntel Core i7-4650U 1.7GHz
HD Graphics 5000
52.5 53.9 54.3 55.3 56 ~ 53 fps
49%
HD Graphics 3000:
26 [X] Schenker Xesia M501Intel Core i7-2630QM 2GHz
HD Graphics 3000
fps
100%
HD Graphics 5000:
23 [X] Dell XPS 12 HaswellIntel Core i7-4650U 1.7GHz
HD Graphics 5000
25 26 27.5 28.3 28.6 ~ 26 fps
53%
HD Graphics 3000:
13.7 [X] Schenker Xesia M501Intel Core i7-2630QM 2GHz
HD Graphics 3000
fps
100%
HD Graphics 5000:
14 14.9 15 [X] Dell XPS 12 HaswellIntel Core i7-4650U 1.7GHz
HD Graphics 5000
15.8 17.4 17.5 ~ 16 fps
62%
HD Graphics 3000:
9.9 [X] Schenker Xesia M501Intel Core i7-2630QM 2GHz
HD Graphics 3000
fps
100%
HD Graphics 5000:
7.9 8 [X] Dell XPS 12 HaswellIntel Core i7-4650U 1.7GHz
HD Graphics 5000
9.5 ~ 8 fps
100%
HD Graphics 5000:
20.9 fps
45%
HD Graphics (Braswell):
9.3 fps
100%
HD Graphics 5000:
13 fps
44%
HD Graphics (Braswell):
5.7 fps
100%
HD Graphics 5000:
9.4 fps
22%
HD Graphics (Braswell):
2.1