 Deutsch
 English
 Español
 Français
 Italiano
 Nederlands
 Polski
 Português
 Русский
 Türkçe
 Svenska
 Chinese
 Magyar
Intel Core i7-8650U vs Intel Core i7-6870HQ vs Intel Core i7-8550U
Intel Core i7-8650U
► remove from comparisonThe Intel Core i7-8650U is a power efficient quad-core SoC for notebooks and Ultrabooks based on the Kaby Lake Refresh generation and was announced in August 2017. Contrary to its direct predecessor the Core i7-7600U, which were still dual-cores, the i7-8650U is equipped with four cores but at a lower base frequency of 1.9 GHz. The Turbo Boost can go up to 4,2 GHz and therefore also offer good short term single core speeds. The GPU is now named Intel UHD Graphics 620 but otherwise identical to the Intel HD Graphics 620. The integrated memory controller supports DDR4-2400 / LPDDR3-2133 and dual channel memory.
Architecture
Intel basically uses the same micro architecture compared to Skylake, so the per-MHz performance does not differ. The manufacturer only reworked the Speed Shift technology for faster dynamic adjustments of voltages and clocks, and the improved 14nm process allows much higher frequencies combined with better efficiency than before.
Performance
According to Intel, the new quad core models are up to 40% faster than their dual core predecessors. Due to the reduced TDP and the same 14nm+ process, the long term performance and throttling behaviour will be interesting and depending on the laptop design. Therefore, the older 35 Watt quad-core models should be faster in applications that demand longer CPU loads. The performance however is highly depending on the TDP settings and cooling solution of the laptop. Especially, longer loads will show varying results in different laptops.
Graphics
The integrated Intel UHD Graphics 620 (Intel Gen 9.5) is untouched from the 8th Gen Kaby Lake chips. With fast dual-channel memory it can reach the performance of a dedicated GeForce 920M.
Contrary to Skylake, Kaby lake now also supports H.265/HEVC Main 10 with a 10-bit color depth as well as Google's VP9 codec. The dual-core Kaby Lake processors announced in January should also support HDCP 2.2.
Power Consumption
The chip is manufactured in an improved 14nm process with FinFET transistors (14nm+), the same as the 7th Gen Kaby Lake processors. Intel still specifies the TDP with 15 Watts, which is typical for ULV chips. Depending on the usage scenario, the TDP can vary between 7.5 (cTDP Down) and 25 Watts.
Intel Core i7-6870HQ
► remove from comparison
The Intel Core i7-6870HQ is a fast quad-core processor for notebooks based on the Skylake architecture and was introduced in the beginning of 2016. Besides four CPU cores including Hyperthreading, which are clocked between 2.7-3.6 GHz (probable Turbo steps: 4 cores: up to 3.2 GHz, 2 cores: up to 3.4 GHz), the processor also includes a very fast graphics unit. The Iris Pro Graphics 580 (GT4e) has 72 EUs as well as 128 MB eDRAM cache, which can also be used by the CPU cores. It is manufactured using a 14 nm process with FinFET transistors.
Contrary to other models like the Core i7-6820HQ, the i7-6870HQ does have a much faster GPU, but neither supports the instruction set extensions TSX-NI nor vPro.
Architecture
Intel uses Skylake to replace both Broadwell as well as Haswell and therefore uses one core design for all TDP classes between 4.5-45 Watts. Several improvements of the Skylake architecture include bigger Out-to-Order-Buffer, optimizations for pre-fetching as well as bigger gains by Hyperthreading. However, the changes are small for a "Tock" – a new micro architecture – in general, so the per-MHz performance is only between 5-10 % (compared to Haswell) or less than 5 % higher (compared to Broadwell), respectively.
The i7-6870HQ also benefits from the additional eDRAM cache in some cases, which can accelerate memory-heavy applications in particular.
Performance
Thanks to the additional eDRAM cache, the i7-6870HQ should even compete with the similarly clocked i7-6820HQ and is therefore one of the fastest notebook processors in the beginning of 2016. Even the most demanding applications and excessive multi-tasking are no problem for the high-end CPU.
Graphics
The integrated GPU with the designation Iris Pro Graphics 580 (also known as "GT4e") represents the fastest version of the Skylake GPU (Intel Gen. 9). 72 Execution Units (EUs) run at 350 up to 1000 MHz and allow a performance comparable to a dedicated mainstream chip. The GPU might be able to compete with a GeForce 945M under perfect conditions and it is therefore the fastest iGPU on the market by a pretty big margin. Modern games from 2015/2016 can usually be played smoothly at medium settings. More information about the performance and the features is available on our dedicated page for the Iris Pro Graphics 580.
Power Consumption
According to its TDP of 45 Watts, the chip is primarily designed for bigger notebooks starting with 15-inch screens. The TDP can optionally be reduced to 35 Watts (cTDP down), but this would obviously affect the performance.
Intel Core i7-8550U
► remove from comparison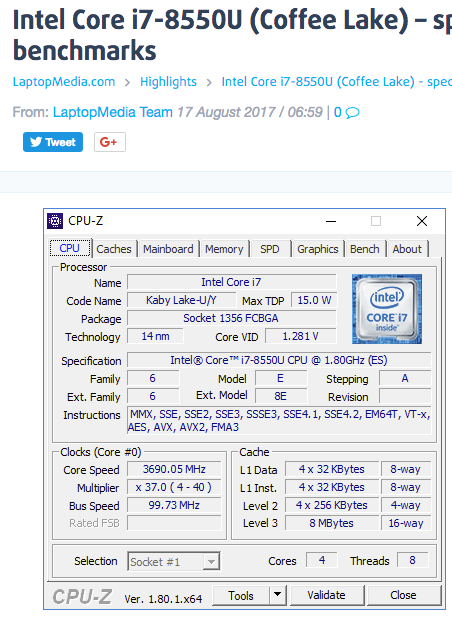
The Intel Core i7-8550U is a power efficient quad-core SoC for notebooks and Ultrabooks based on the Kaby Lake Refresh generation and was announced in August 2017. Contrary to its direct predecessors Core i7-7500U and i5-7260U, respectively, which were still dual-cores, the i7-8550U is equipped with four cores but at a lower base frequency of 1.8 GHz. The Turbo Boost is not specified yet, but should be at least 3.7 - 4 GHz and therefore also offer good short term single core speeds. The GPU is now named Intel UHD Graphics 620 but otherwise identical to the Intel HD Graphics 620. The integrated memory controller supports DDR4-2400 / LPDDR3-2133 and dual channel memory.
Architecture
Intel basically uses the same micro architecture compared to Skylake, so the per-MHz performance does not differ. The manufacturer only reworked the Speed Shift technology for faster dynamic adjustments of voltages and clocks, and the improved 14nm process allows much higher frequencies combined with better efficiency than before.
Performance
The performance of the i7-8550U depends on the cooling solution of the laptop and the defined TDP limits for short and long term performance. This leads to big differences in our benchmark scores ranging from the 15 Watt reference by Intel up to the 23% higher score of the Inspiron 17-7773 in the Cinebench R15 Multi benchmark. Especially when taxing the CPU for longer periods, these differences can be even higher.
In our usual benchmarks, the average i7-8550U is as fast as the 35 Watt rated Core i5-7440HQ. For single thread performance, the high Turbo Boost frequency helps achieving one of the highest scores for mobile CPUs.
Graphics
The integrated Intel UHD Graphics 620 (Intel Gen 9.5) is untouched from the 8th Gen Kaby Lake chips. With fast dual-channel memory it can reach the performance of a dedicated GeForce 920M.
Contrary to Skylake, Kaby lake now also supports H.265/HEVC Main 10 with a 10-bit color depth as well as Google's VP9 codec. The dual-core Kaby Lake processors announced in January should also support HDCP 2.2.
Power Consumption
The chip is manufactured in an improved 14nm process with FinFET transistors (14nm+), the same as the 7th Gen Kaby Lake processors. Intel still specifies the TDP with 15 Watts, which is typical for ULV chips. Depending on the usage scenario, the TDP can vary between 7.5 (cTDP Down) and 25 Watts.
| Model | Intel Core i7-8650U | Intel Core i7-6870HQ | Intel Core i7-8550U | ||||||||||||||||||||||||||||||||||||||||||||||||||||||||||||||||||||||||||||||||||||||||||||||||
| Series | Intel Kaby Lake Refresh | Intel Core i7 | Intel Kaby Lake Refresh | ||||||||||||||||||||||||||||||||||||||||||||||||||||||||||||||||||||||||||||||||||||||||||||||||
| Codename | Kaby Lake Refresh | Skylake | Kaby Lake Refresh | ||||||||||||||||||||||||||||||||||||||||||||||||||||||||||||||||||||||||||||||||||||||||||||||||
| Series: Kaby Lake Refresh Kaby Lake Refresh |
|
|
| ||||||||||||||||||||||||||||||||||||||||||||||||||||||||||||||||||||||||||||||||||||||||||||||||
| Clock | 1900 - 4200 MHz | 2700 - 3600 MHz | 1800 - 4000 MHz | ||||||||||||||||||||||||||||||||||||||||||||||||||||||||||||||||||||||||||||||||||||||||||||||||
| L1 Cache | 256 KB | 256 KB | 256 KB | ||||||||||||||||||||||||||||||||||||||||||||||||||||||||||||||||||||||||||||||||||||||||||||||||
| L2 Cache | 1 MB | 1 MB | 1 MB | ||||||||||||||||||||||||||||||||||||||||||||||||||||||||||||||||||||||||||||||||||||||||||||||||
| L3 Cache | 8 MB | 8 MB | 8 MB | ||||||||||||||||||||||||||||||||||||||||||||||||||||||||||||||||||||||||||||||||||||||||||||||||
| Cores / Threads | 4 / 8 | 4 / 8 | 4 / 8 | ||||||||||||||||||||||||||||||||||||||||||||||||||||||||||||||||||||||||||||||||||||||||||||||||
| TDP | 15 Watt | 45 Watt | 15 Watt | ||||||||||||||||||||||||||||||||||||||||||||||||||||||||||||||||||||||||||||||||||||||||||||||||
| Technology | 14 nm | 14 nm | 14 nm | ||||||||||||||||||||||||||||||||||||||||||||||||||||||||||||||||||||||||||||||||||||||||||||||||
| Socket | BGA1356 | BGA | BGA1356 | ||||||||||||||||||||||||||||||||||||||||||||||||||||||||||||||||||||||||||||||||||||||||||||||||
| Features | Dual-Channel DDR4 Memory Controller, HyperThreading, AVX, AVX2, Quick Sync, Virtualization, AES-NI | Dual-Channel DDR3L-1600/DDR4-2133 Memory Controller, AVX, AVX2, Quick Sync, Virtualization, AES-NI, TXT | Dual-Channel DDR4 Memory Controller, HyperThreading, AVX, AVX2, Quick Sync, Virtualization, AES-NI | ||||||||||||||||||||||||||||||||||||||||||||||||||||||||||||||||||||||||||||||||||||||||||||||||
| iGPU | Intel UHD Graphics 620 (300 - 1150 MHz) | Intel Iris Pro Graphics 580 (350 - 1000 MHz) | Intel UHD Graphics 620 (300 - 1150 MHz) | ||||||||||||||||||||||||||||||||||||||||||||||||||||||||||||||||||||||||||||||||||||||||||||||||
| Architecture | x86 | x86 | x86 | ||||||||||||||||||||||||||||||||||||||||||||||||||||||||||||||||||||||||||||||||||||||||||||||||
| $409 U.S. | $434 U.S. | $409 U.S. | |||||||||||||||||||||||||||||||||||||||||||||||||||||||||||||||||||||||||||||||||||||||||||||||||
| Announced | |||||||||||||||||||||||||||||||||||||||||||||||||||||||||||||||||||||||||||||||||||||||||||||||||||
| Manufacturer | ark.intel.com | ark.intel.com | |||||||||||||||||||||||||||||||||||||||||||||||||||||||||||||||||||||||||||||||||||||||||||||||||
| max. Temp. | 100 °C |

