Notebookcheck Logo

Intel Graphics 4-Core iGPU (Arc) vs Intel HD Graphics (Cherry Trail)

Intel Graphics 4-Core iGPU (Arc)

► remove from comparison Intel Graphics 4-Core

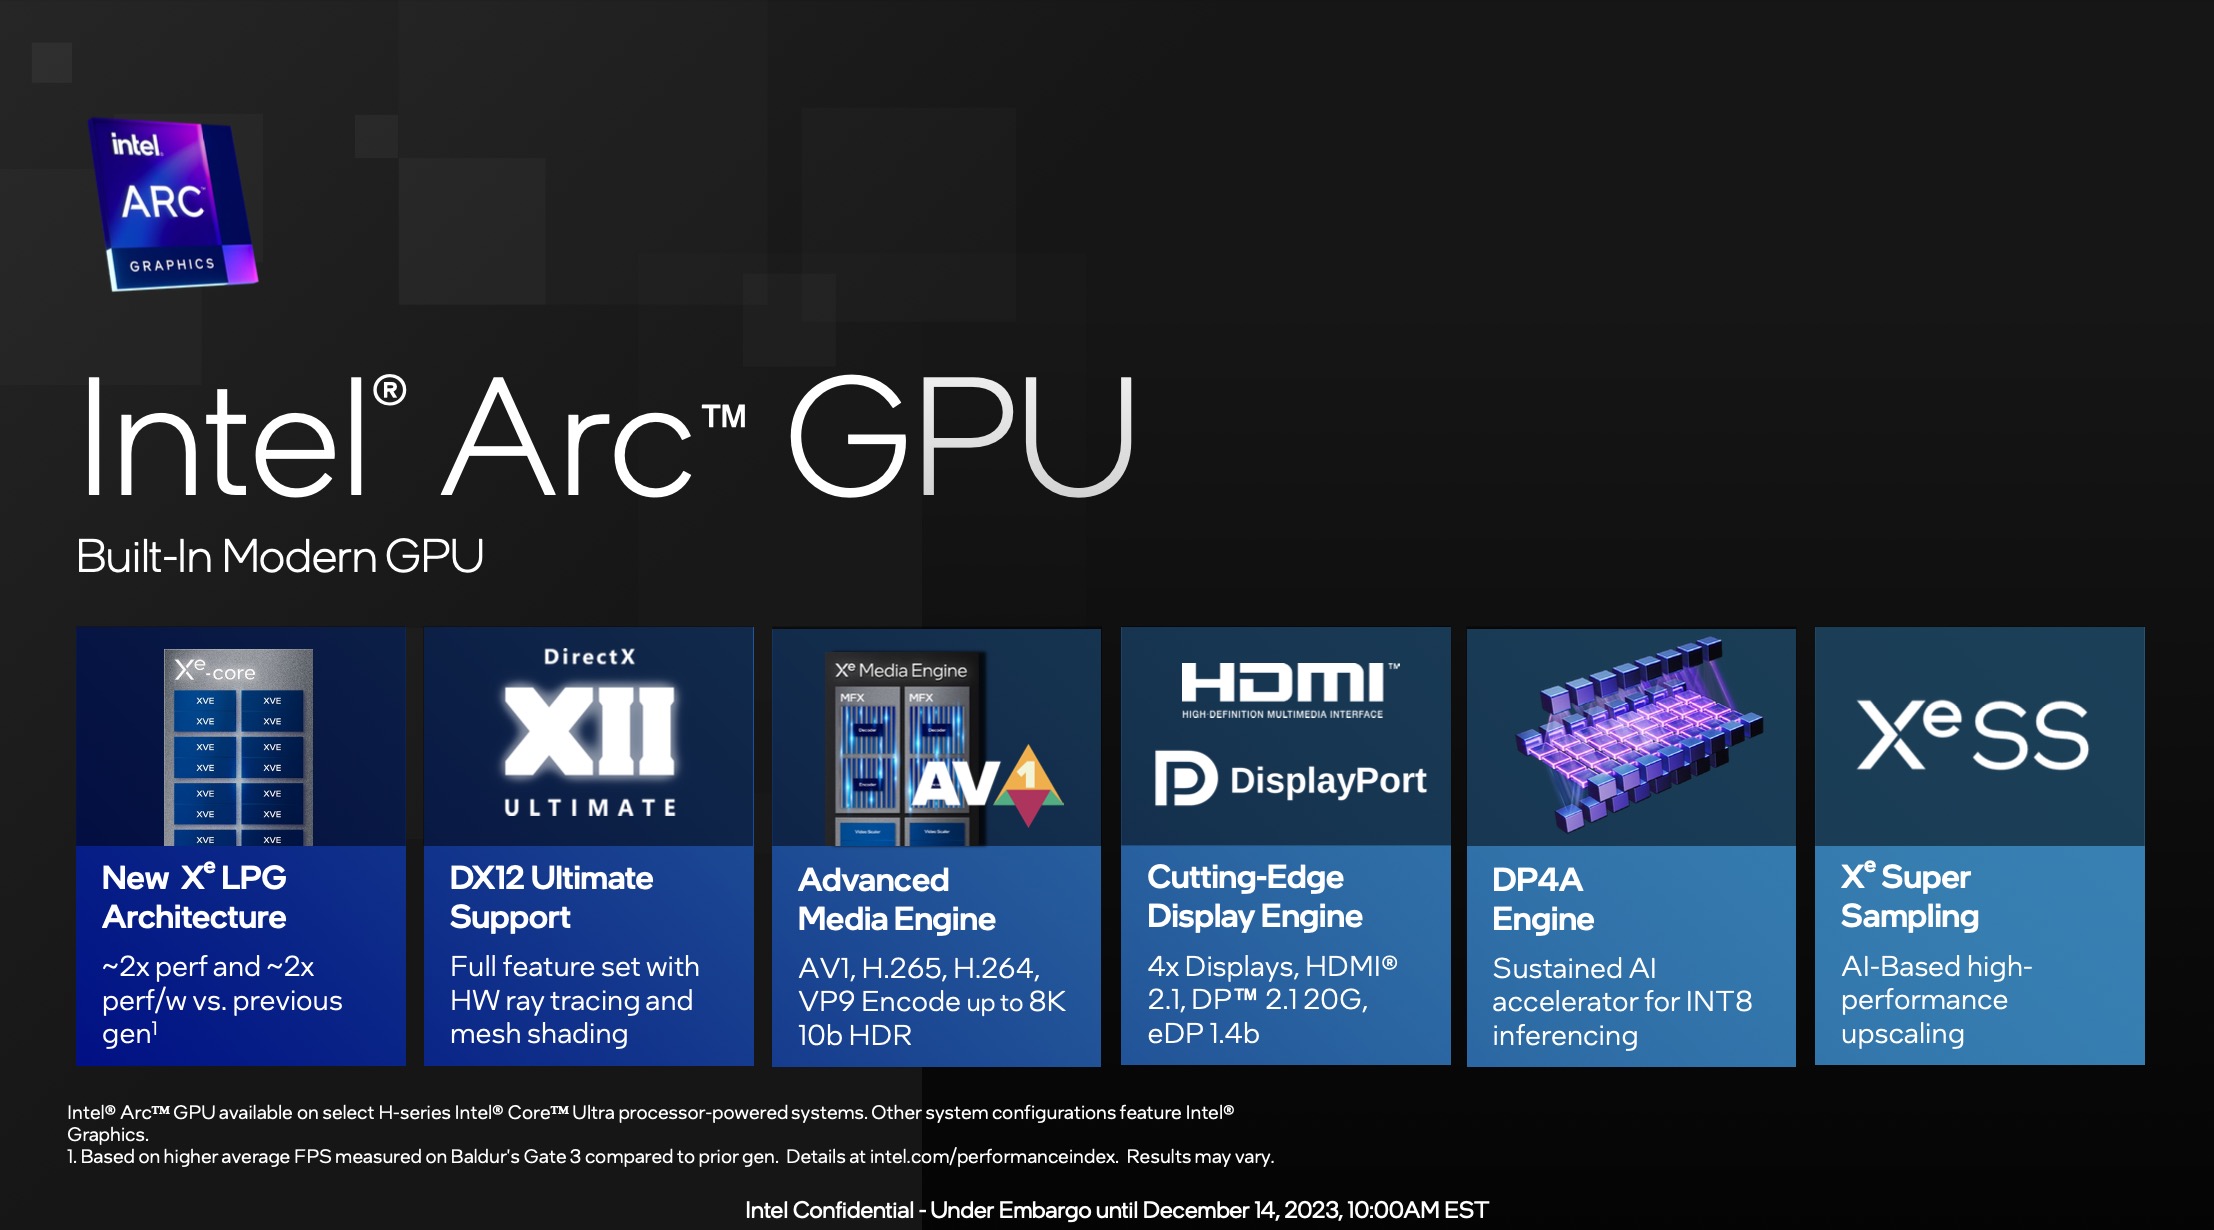
The Intel Graphics iGPU with 4 cores is an integrated graphics card based on the Xe LPG architecture (similar to the dedicated Arc GPUs, but with a focus on efficiency). It offers 4 Xe cores (64 Xe vector engines), 4 ray tracing units, 4 samplers and 2 pixel backends.

In contrast to the more powerful variant with 8 cores in the H Meteor Lake CPUs, the small variant is not allowed to use the Arc name.

The iGPU supports DirectX 12 Ultimate (probably DX 12_2 like the desktop Arc GPUs). The graphics unit also supports XeSS AI Super Sampling.

The media engine of Meteor Lake is in the SOC tile and supports up to 8k60 10-bit HDR encode and decode of MPEG2, AVC, VP9, HEVC and AV1. The display engine is also in the SoC tile and supports HDMI 2.1 and DisplayPort 2.1 20G with up to 8K60 HDR.

The GPU Tile of the Meteor Lake chip is manufactured at TSMC in 5nm (5N process).

Intel HD Graphics (Cherry Trail)

► remove from comparison Intel HD Graphics (Cherry Trail)

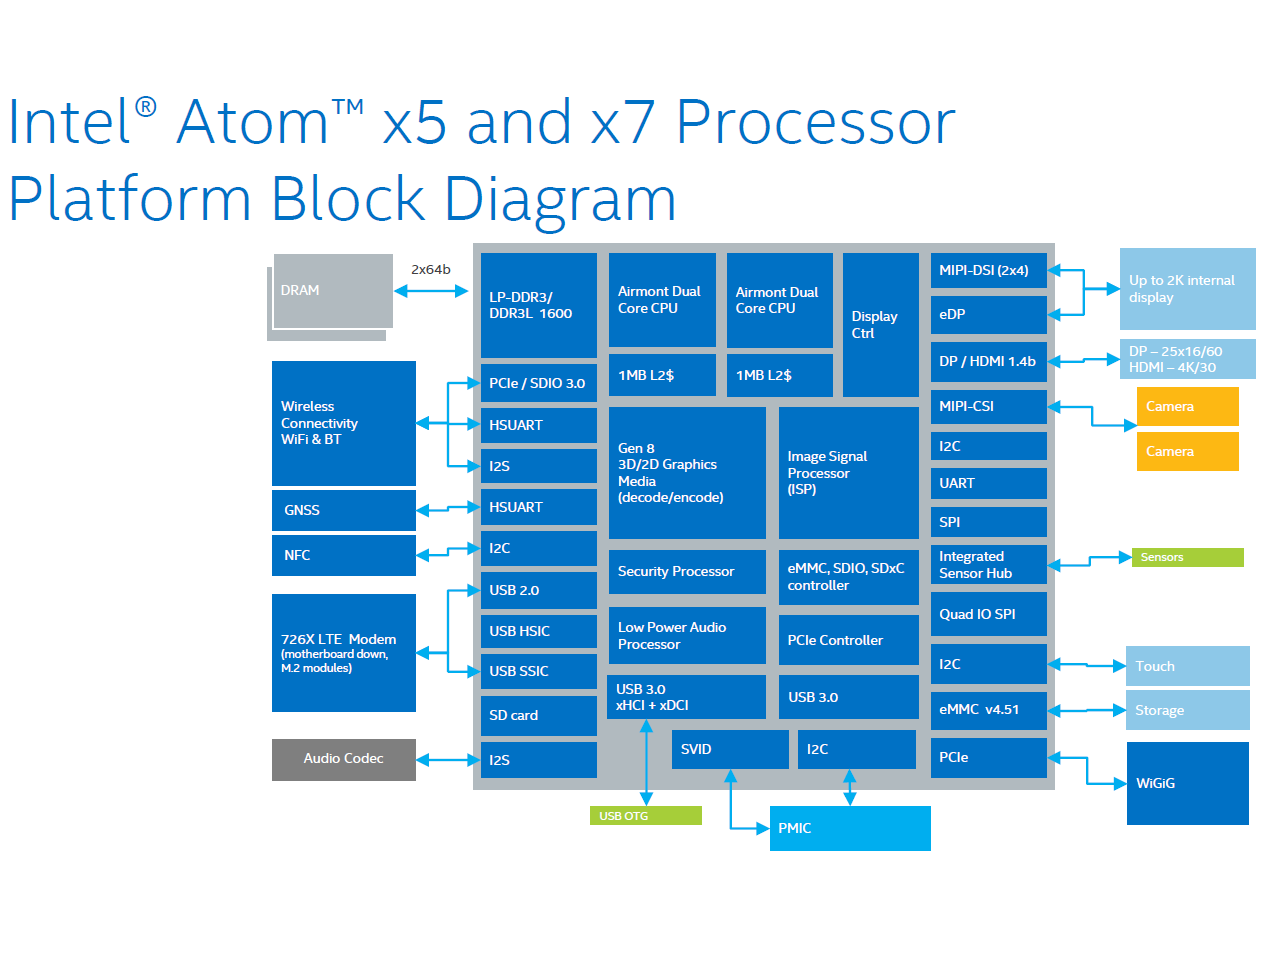
The Intel HD Graphics (Cherry Trail) is an integrated graphics card in the Cherry-Trail SoCs (e.g. Atom x7-Z8700). Based on a Broadwell GPU (Intel Gen8) and supports DirectX 11.2. Depending on the SoC offers 12 or 16 EUs.

Atom x7-Z8700: 16 EUs @ 200 - 600 MHz, dual-channel memory
Atom x5-Z8500: 12 EUs @ 200 - 600 MHz, dual-channel memory
Atom x5-Z8300: 12 EUs @ 200 - 500 MHz, single-channel memory

In Windows, gaming is limited to less demanding or quite old games. Using Android, even high end 3D games should run fluently. For example Team Fortress 2 was running on the Surface 3 (x7-Z8700) only in lowest settings and 1280x720 fluently (11 - 69 fps range).

The integrated video decoder is able to display even 4K videos (H.264 tested) fluently.

The Intel HD Graphics GPU in our review sample of the MS Surface 3 (Atom x7-Z8700) only supported DisplayPort 1.1 as it seems, as 4K (3840x2160) with 30 Hz was the maximum Refresh Rate we could achieve (no 60 Hz selectable with the pre-installed drivers).

Intel Graphics 4-Core iGPU (Arc)Intel HD Graphics (Cherry Trail)
HD Graphics Series
Arc 8-Core compare 8 @ 2.3 GHz
Arc 7-Core compare 7 @ 2.2 GHz
Graphics 4-Core 64 @ 0.3 - 1.95 GHz
HD Graphics P530 compare 24 @ 0.35 - 1.05 GHz64/128 Bit
HD Graphics 5600 compare 24 @ 0.3 - 1.05 GHz64/128 Bit
HD Graphics 6000 compare 48 @ 0.3 - 1 GHz64/128 Bit
HD Graphics 4600 compare 20 @ 0.2 - 1.35 GHz64/128 Bit
HD Graphics 5500 compare 24 @ 0.3 - 0.95 GHz64/128 Bit
HD Graphics 5000 compare 40 @ 0.2 - 1.1 GHz64/128 Bit
HD Graphics 4400 compare 20 @ 0.2 - 1.1 GHz64/128 Bit
HD Graphics 5300 compare 24 @ 0.1 - 0.9 GHz64/128 Bit
HD Graphics 4000 compare 16 @ 0.35 - 1.35 GHz64/128 Bit
HD Graphics (Broadwell) compare 12 @ 0.1 - 0.85 GHz64/128 Bit
HD Graphics 4200 compare 20 @ 0.2 - 0.85 GHz64/128 Bit
HD Graphics (Skylake) compare 12 @ 0.3 - 0.8 GHz64/128 Bit
HD Graphics 405 (Braswell) compare 16 @ 0.32 - 0.7 GHz64/128 Bit
HD Graphics (Braswell) compare 16 @ 0.32 - 0.7 GHz64/128 Bit
HD Graphics 400 (Braswell) compare 12 @ 0.32 - 0.64 GHz64/128 Bit
HD Graphics (Haswell) compare 10 @ 0.2 - 1 GHz64/128 Bit
HD Graphics (Cherry Trail) 16 @ 0.2 - 0.6 GHz64/128 Bit
HD Graphics 3000 compare 12 @ 0.35 - 1.35 GHz64/128 Bit
HD Graphics 2500 compare 6 @ 0.65 - 1.15 GHz64/128 Bit
HD Graphics (Ivy Bridge) compare 6 @ 0.35 - 1.1 GHz64/128 Bit
HD Graphics 2000 compare 6 @ 0.85 - 1.35 GHz64/128 Bit
HD Graphics (Sandy Bridge) compare 6 @ 0.35 - 1.1 GHz64/128 Bit
HD Graphics (Bay Trail) compare 4 @ 0.31 - 0.9 GHz32/64/128 Bit
CodenameMeteor Lake iGPUCherry Trail
ArchitectureXe LPGGen. 8
Pipelines64 - unified16 - unified
TMUs32
ROPs16
Raytracing Cores4
Core Speed300 - 1950 (Boost) MHz200 - 600 (Boost) MHz
AI GPU8 TOPS INT8
CacheL1: 768 KB
Shared Memorynoyes
APIDirectX 12_2, Shader 6.8, OpenGL 4.6, OpenCL 3.0, Vulkan 1.3DirectX 12 (FL 11_1), Shader 5.0, OpenGL 4.3
technology5 nm14 nm
DisplaysHDMI 2.1, DisplayPort 2.1 20G
Date of Announcement06.01.2025 02.03.2015
Memory Bus Width64/128 Bit
CPU in Graphics 4-CoreGPU Base SpeedGPU Boost / Turbo
Intel Core Ultra 9 285K24 x 3200 MHz, 125 W? MHz? MHz
Intel Core Ultra 9 28524 x 1900 MHz, 65 W? MHz2000 MHz
Intel Core Ultra 9 285HX24 x 2100 MHz, 55 W300 MHz2000 MHz
min. - max.? - 300 MHz1750 - 2100 MHz
CPU in HD Graphics (Cherry Trail)GPU Base SpeedGPU Boost / Turbo
Intel Atom x7-Z87004 x 1600 MHz200 MHz600 MHz
Intel Atom x5-Z85004 x 1440 MHz200 MHz600 MHz
Intel Atom x5-Z83504 x 1440 MHz200 MHz500 MHz
min. - max.200 - 320 MHz? - 600 MHz

Benchmarks

Performance Rating - 3DMark 11 + Fire Strike + Time Spy - Graphics 4-Core
1.9 pt (6%)
Restrict / Search: Model: Max. age: years
Performance Rating - 3DMark 11 + Fire Strike + Time Spy - HD Graphics (Cherry Trail)
0.1 pt (0%)
Restrict / Search: Model: Max. age: years
3DMark - 3DMark Speed Way Score
min: 226     avg: 234.5     median: 234 (2%)     max: 244 Points
3DMark - 3DMark Steel Nomad
min: 335     avg: 390.2     median: 387 (3%)     max: 427 Points
3DMark - 3DMark Steel Nomad Light
min: 1434     avg: 1593     median: 1626 (4%)     max: 1749 Points
3DMark - 3DMark Wild Life Unlimited
14464 Points (7%)
3DMark - 3DMark Wild Life Extreme Unlimited
min: 2332     avg: 3416     median: 3631 (4%)     max: 3997 Points
3DMark - 3DMark Solar Bay
min: 6414     avg: 7005     median: 7002 (3%)     max: 7598 Points
3DMark - 3DMark Fire Strike Standard Score
min: 3591     avg: 4578     median: 4750.5 (7%)     max: 5295 Points
3DMark - 3DMark Fire Strike Standard Graphics
min: 3838     avg: 4905     median: 5130.5 (5%)     max: 5554 Points
min: 193     avg: 233     median: 225 (0%)     max: 281 Points
3DMark - 3DMark Ice Storm Graphics
min: 89439     avg: 140883     median: 155226 (17%)     max: 163640 Points
3DMark - 3DMark Time Spy Score
min: 1737     avg: 2063     median: 2081.5 (6%)     max: 2397 Points
3DMark - 3DMark Time Spy Graphics
min: 1530     avg: 1846     median: 1849 (4%)     max: 2144 Points
3DMark - 3DMark Ice Storm Unlimited Graphics
min: 294961     avg: 299673     median: 295187 (30%)     max: 308872 Points
3DMark - 3DMark Ice Storm Extreme Graphics
min: 75102     avg: 102926     median: 113230 (13%)     max: 120447 Points
3DMark - 3DMark Cloud Gate Score
min: 16625     avg: 21629     median: 21927 (21%)     max: 26389 Points
3DMark - 3DMark Cloud Gate Graphics
min: 22976     avg: 28163     median: 29517 (7%)     max: 33120 Points
3DMark - 3DMark Sling Shot (ES 3.0) Unlimited
min: 1445     avg: 1525     median: 1525 (7%)     max: 1605 Points
3DMark - 3DMark Sling Shot (ES 3.0) Unlimited Graphics
min: 1598     avg: 1684     median: 1684 (4%)     max: 1770 Points
3DMark - 3DMark Sling Shot Extreme (ES 3.1) Unlimited
min: 1072     avg: 1215     median: 1159 (5%)     max: 1414 Points
3DMark - 3DMark Sling Shot Extreme (ES 3.1) Unlimited Graphics
min: 1058     avg: 1251     median: 1142 (3%)     max: 1554 Points
3DMark - 3DMark Sling Shot (ES 3.0)
min: 1353     avg: 1429     median: 1398 (12%)     max: 1593 Points
3DMark - 3DMark Sling Shot (ES 3.0) Graphics
min: 1300     avg: 1505     median: 1530 (9%)     max: 1732 Points
3DMark - 3DMark Sling Shot Extreme (ES 3.1)
min: 1037     avg: 1133     median: 1070 (5%)     max: 1319 Points
3DMark - 3DMark Sling Shot Extreme (ES 3.1) Graphics
min: 973     avg: 1102     median: 1054 (4%)     max: 1261 Points
3DMark - 3DMark Night Raid
min: 18070     avg: 18839     median: 18446 (17%)     max: 20000 Points
3DMark - 3DMark Night Raid Graphics Score
min: 21081     avg: 22151     median: 21828 (8%)     max: 23544 Points
3DMark 11 - 3DM11 Performance Score
min: 4964     avg: 6680     median: 6833 (8%)     max: 7632 Points
min: 314     avg: 359.4     median: 343 (0%)     max: 562 Points
3DMark 11 - 3DM11 Performance GPU
min: 4520     avg: 6215     median: 6291 (5%)     max: 7109 Points
min: 278     avg: 319.9     median: 298 (0%)     max: 494 Points
3DMark 06 3DMark 06 - Standard 1280x1024 + Intel Graphics 4-Core iGPU (Arc)
3DMark 06
27772 Points (36%)
3DMark 06 - Standard 1280x1024 + Intel HD Graphics (Cherry Trail)
min: 2403     avg: 2833     median: 2595 (3%)     max: 3330 Points
3DMark 06 - Standard 1024x768 + Intel HD Graphics (Cherry Trail)
3DMark 06
2877 Points (4%)
Unigine Valley 1.0 - Unigine Valley 1.0 DX
1.2 fps (0%)
Unigine Heaven 2.1 - Heaven 2.1 high
5.7 fps (1%)
Cinebench R10 Cinebench R10 Shading (32bit) + Intel Graphics 4-Core iGPU (Arc)
Cinebench R10 - Cinebench R10 Shading (32bit)
15457 Points (11%)
Cinebench R10 Shading (32bit) + Intel HD Graphics (Cherry Trail)
Cinebench R11.5 Cinebench R11.5 OpenGL 64 Bit + Intel Graphics 4-Core iGPU (Arc)
Cinebench R11.5 - Cinebench R11.5 OpenGL 64 Bit
88.4 fps (29%)
Cinebench R11.5 OpenGL 64 Bit + Intel HD Graphics (Cherry Trail)
Cinebench R15
Cinebench R15 OpenGL 64 Bit + Intel Graphics 4-Core iGPU (Arc)
Cinebench R15 - Cinebench R15 OpenGL 64 Bit
min: 92.6     avg: 103.8     median: 103.8 (6%)     max: 119.3 fps
Cinebench R15 OpenGL 64 Bit + Intel HD Graphics (Cherry Trail)
Cinebench R15 OpenGL Ref. Match 64 Bit + Intel Graphics 4-Core iGPU (Arc)
Cinebench R15 - Cinebench R15 OpenGL Ref. Match 64 Bit
97.8 % (98%)
Cinebench R15 OpenGL Ref. Match 64 Bit + Intel HD Graphics (Cherry Trail)
GFXBench - GFXBench 5.0 4K Aztec Ruins High Tier Offscreen
min: 16.8173     avg: 19.4     median: 20.7 (8%)     max: 20.8 fps
GFXBench - GFXBench 5.0 Aztec Ruins High Tier Offscreen
min: 37.3169     avg: 45.1     median: 48.8 (9%)     max: 49.1 fps
GFXBench - GFXBench 5.0 Aztec Ruins Normal Tier Offscreen
min: 91.8253     avg: 116.8     median: 129.2 (10%)     max: 129.5 fps
GFXBench - GFXBench Car Chase Offscreen
min: 75.6254     avg: 85.5     median: 89.5 (8%)     max: 91.5 fps
GFXBench 3.1 - GFXBench Manhattan ES 3.1 Offscreen
min: 117.479     avg: 146.5     median: 160.1 (3%)     max: 161.9 fps
GFXBench 3.0 - GFXBench 3.0 Manhattan Offscreen
min: 173.822     avg: 225.5     median: 246.1 (10%)     max: 256.6 fps
GFXBench (DX / GLBenchmark) 2.7
GFXBench T-Rex HD Offscreen C24Z16 + Intel Graphics 4-Core iGPU (Arc)
GFXBench (DX / GLBenchmark) 2.7 - GFXBench T-Rex HD Offscreen C24Z16
min: 370.774     avg: 434.8     median: 466.5 (4%)     max: 467 fps
GFXBench T-Rex HD Offscreen C24Z16 + Intel HD Graphics (Cherry Trail)
Basemark GPU 1.2 - Basemark GPU 1.2 Vulkan Official Medium Offscreen 1080
min: 104.6     avg: 152.5     median: 104.6 (3%)     max: 315 fps
Basemark GPU 1.2 - Basemark GPU 1.2 Vulkan Official High Offscreen 2160
3.6 fps (1%)
Geekbench 6.5 - Geekbench 6.5 GPU OpenCL
min: 12919     avg: 17325     median: 17343 (5%)     max: 20750 Points
Geekbench 6.5 - Geekbench 6.5 GPU Vulkan
min: 12337     avg: 17546     median: 18113.5 (5%)     max: 19957 Points
LuxMark v2.0 64Bit - LuxMark v2.0 Room GPU
min: 48     avg: 58.7     median: 59 (0%)     max: 69 Samples/s
LuxMark v2.0 64Bit - LuxMark v2.0 Sala GPU
min: 69     avg: 87.7     median: 89 (0%)     max: 105 Samples/s
ComputeMark v2.1 - ComputeMark v2.1 Result
277 Points (0%)
Power Consumption - Furmark Stress Test Power Consumption - external Monitor *
min: 25.3     avg: 30.5     median: 31.1 (4%)     max: 38 Watt
Power Consumption - The Witcher 3 Power Consumption - external Monitor *
min: 24.4     avg: 27.7     median: 26.8 (4%)     max: 32.2 Watt
Power Consumption - Witcher 3 Power Consumption *
min: 27.4     avg: 32.3     median: 30.7 (7%)     max: 41.5 Watt
Power Consumption - Power Efficiency - Witcher 3 ultra
min: 0.4313     avg: 0.5     median: 0.5 (43%)     max: 0.544 fps per Watt
Power Consumption - Power Efficiency - Witcher 3 ultra external Monitor
min: 0.4877     avg: 0.5     median: 0.5 (45%)     max: 0.603 fps per Watt
Power Consumption - Cyberpunk 2077 Power Consumption 150cd *
min: 22.2     avg: 38.2     median: 39.4 (11%)     max: 50.1 Watt
Power Consumption - Cyberpunk 2077 Power Consumption - external Monitor *
min: 23.7     avg: 37.1     median: 36.7 (5%)     max: 48 Watt
Power Consumption - Power Efficiency - Cyberpunk 2077 ultra
min: 0.1977     avg: 2.3     median: 0.3 (1%)     max: 28.3 fps per Watt
Emissions Witcher 3 Fan Noise + Intel Graphics 4-Core iGPU (Arc)
Emissions - Witcher 3 Fan Noise
min: 27.3     avg: 37.3     median: 37 (53%)     max: 44.9 dB(A)

Average Benchmarks Intel Graphics 4-Core iGPU (Arc) → 100% n=17

Average Benchmarks Intel HD Graphics (Cherry Trail) → 13% n=17

- Range of benchmark values for this graphics card
red legend - Average benchmark values for this graphics card
* Smaller numbers mean a higher performance
1 This benchmark is not used for the average calculation

Game Benchmarks

The following benchmarks stem from our benchmarks of review laptops. The performance depends on the used graphics memory, clock rate, processor, system settings, drivers, and operating systems. So the results don't have to be representative for all laptops with this GPU. For detailed information on the benchmark results, click on the fps number.

low 1920x1080
100%
Graphics 4-Core:
7.1  fps
Stalker 2

Stalker 2

2024
low 1920x1080
100%
Graphics 4-Core:
6.8  fps
med. 1920x1080
100%
Graphics 4-Core:
6  fps
high 1920x1080
100%
Graphics 4-Core:
5.3  fps
low 1920x1080
100%
Graphics 4-Core:
15  fps
med. 1920x1080
100%
Graphics 4-Core:
14  fps
high 1920x1080
100%
Graphics 4-Core:
10  fps
low 1920x1080
100%
Graphics 4-Core:
17.3  fps
med. 1920x1080
100%
Graphics 4-Core:
11.5  fps
high 1920x1080
100%
Graphics 4-Core:
7.4  fps
low 1920x1080
100%
Graphics 4-Core:
8  fps
med. 1920x1080
100%
Graphics 4-Core:
8  fps
high 1920x1080
100%
Graphics 4-Core:
6.7  fps
low 1920x1080
100%
Graphics 4-Core:
10.2  fps
med. 1920x1080
100%
Graphics 4-Core:
8.1  fps
high 1920x1080
100%
Graphics 4-Core:
7.4  fps
low 1920x1080 cinem.
Graphics 4-Core:
0 (!)  fps
med. 1920x1080 cinem.
Graphics 4-Core:
0 (!)  fps
high 1920x1080 cinem.
Graphics 4-Core:
0 (!)  fps
F1 24

F1 24

2024
low 1920x1080
100%
Graphics 4-Core:
33 34.2 35.1 36.3 39.2 39.9 40.6 41.7 ~ 38 fps
med. 1920x1080
100%
Graphics 4-Core:
30.1 30.3 31.2 32.7 33.8 35.7 36.8 39.6 ~ 34 fps
high 1920x1080
100%
Graphics 4-Core:
22.6 23.5 23.8 26.4 26.9 30 ~ 26 fps
ultra 1920x1080
100%
Graphics 4-Core:
7.2 7.3 8.5 ~ 8 fps
low 1920x1080
100%
Graphics 4-Core:
6.4  fps
med. 1920x1080
100%
Graphics 4-Core:
5.4  fps
high 1920x1080
100%
Graphics 4-Core:
4.1  fps
low 1920x1080
100%
Graphics 4-Core:
11.5  fps
med. 1920x1080
100%
Graphics 4-Core:
9.8  fps
high 1920x1080
100%
Graphics 4-Core:
8.9  fps
low 1920x1080
100%
Graphics 4-Core:
13.8  fps
med. 1920x1080
100%
Graphics 4-Core:
12.3  fps
high 1920x1080
100%
Graphics 4-Core:
8  fps
low 1920x1080
100%
Graphics 4-Core:
9.1  fps
high 1920x1080
100%
Graphics 4-Core:
6.8  fps
low 1920x1080
100%
Graphics 4-Core:
16  fps
med. 1920x1080
100%
Graphics 4-Core:
12.2  fps
high 1920x1080
100%
Graphics 4-Core:
11  fps
med. 1920x1080
100%
Graphics 4-Core:
96.4  fps
high 1920x1080
100%
Graphics 4-Core:
48.4  fps
ultra 1920x1080
100%
Graphics 4-Core:
45.7  fps
low 1920x1080
100%
Graphics 4-Core:
16.7 17.2 17.2 17.4 17.5 17.6 17.8 18.5 18.7 18.8 18.9 18.9 19.3 19.4 19.5 19.5 20.2 20.3 20.5 20.6 20.9 21.1 21.6 22.1 22.5 ~ 19 fps
med. 1920x1080
100%
Graphics 4-Core:
13.2 13.4 13.5 13.8 14 14.2 15 15.1 15.1 15.3 15.3 15.4 15.8 15.9 15.9 16.1 16.5 16.6 16.6 16.7 16.9 17.1 17.6 17.6 18.3 ~ 16 fps
high 1920x1080
100%
Graphics 4-Core:
11.4 11.9 11.9 12.2 12.4 12.4 12.4 12.6 12.7 12.8 12.8 13 13 13.3 13.6 13.7 13.7 14.1 14.3 14.4 14.6 14.9 15.4 15.5 ~ 13 fps
ultra 1920x1080
100%
Graphics 4-Core:
10 10.3 10.4 10.6 10.7 10.8 10.9 11.1 11.1 11.2 11.3 11.4 11.6 11.7 11.9 12 12 12.2 12.5 12.6 12.7 13 13.6 13.7 ~ 12 fps
low 1920x1080
100%
Graphics 4-Core:
14.7 15 15.1 15.4 15.5 16.1 16.2 16.4 17.3 17.3 17.6 17.7 17.8 17.9 18.1 18.2 18.6 18.8 19.4 21.1 21.5 21.7 21.7 ~ 18 fps
med. 1920x1080
100%
Graphics 4-Core:
11.9 12.3 12.4 12.4 12.6 12.8 13 13.2 13.4 13.9 14.1 14.2 14.2 14.5 14.7 14.9 15.3 15.5 16.1 16.2 16.4 16.8 ~ 14 fps
high 1920x1080
100%
Graphics 4-Core:
10.4 10.5 10.6 10.7 11 11 11.7 12 12.1 12.2 12.2 12.4 12.8 13.1 13.2 13.7 14 14.2 14.6 14.7 ~ 12 fps
ultra 1920x1080
100%
Graphics 4-Core:
9.7 10.2 10.2 10.5 10.6 11 11.5 11.9 12 12 12.1 12.2 12.3 12.7 12.8 13.5 13.6 13.9 14.2 ~ 12 fps
F1 23

F1 23

2023
low 1920x1080
100%
Graphics 4-Core:
40.1 43.8 ~ 42 fps
med. 1920x1080
100%
Graphics 4-Core:
37.3 39.8 ~ 39 fps
high 1920x1080
100%
Graphics 4-Core:
23.9 26 ~ 25 fps
ultra 1920x1080
100%
Graphics 4-Core:
7.1  fps
F1 22

F1 22

2022
low 1920x1080
100%
Graphics 4-Core:
39.2 39.9 41.7 43.3 43.8 43.9 44.4 44.9 46.3 46.6 ~ 43 fps
med. 1920x1080
100%
Graphics 4-Core:
34.1 35.9 36.8 39.7 40.5 41 41.9 42 42 42.5 ~ 40 fps
high 1920x1080
100%
Graphics 4-Core:
25 27.6 29.5 29.9 30.4 30.8 31 ~ 29 fps
ultra 1920x1080
100%
Graphics 4-Core:
7 7.6 8 8 ~ 8 fps
low 1920x1080
100%
Graphics 4-Core:
24.1 26.4 27.2 27.6 29.6 29.9 30.2 30.8 32.1 ~ 29 fps
med. 1920x1080
100%
Graphics 4-Core:
20.4 21.1 22.9 22.9 23.4 24 24.2 24.4 ~ 23 fps
high 1920x1080
100%
Graphics 4-Core:
13.7 14.1 15.9 16.1 16.1 16.1 16.3 16.8 ~ 16 fps
ultra 1920x1080
100%
Graphics 4-Core:
11.2 11.3 12.3 12.5 12.7 12.8 13.6 13.8 ~ 13 fps
Strange Brigade

Strange Brigade

2018
low 1280x720
100%
Graphics 4-Core:
68.6 72.8 73.2 73.7 77 78.5 78.5 80.4 85.6 93.9 107.2 109.1 111.2 111.6 113.2 115 115 117.1 118.1 118.4 120.4 121.1 123 126.5 ~ 100 fps
med. 1920x1080
100%
Graphics 4-Core:
28.1 31.1 32.3 32.9 34.8 38 38 38.5 40.9 41 41.7 46 47 48.7 49.1 49.5 49.7 50 50 50.7 50.8 51.4 52.1 54.7 ~ 44 fps
high 1920x1080
100%
Graphics 4-Core:
22.5 26.5 26.6 26.6 27.2 31.7 31.8 32.4 33.1 34.7 34.8 35.1 36.1 37 37.7 39 39.2 39.6 39.8 40 40.7 41.9 43.8 ~ 35 fps
ultra 1920x1080
100%
Graphics 4-Core:
22.1 22.8 22.8 22.9 23 25.1 25.9 26.2 26.6 27.1 27.1 27.8 28.2 28.4 29.3 29.4 29.9 30.2 30.3 30.5 31.2 32 33.3 35.2 ~ 28 fps
Far Cry 5

Far Cry 5

2018
low 1280x720
100%
Graphics 4-Core:
33 38 38 40 41 41 42 43 45 46 47 48 48 50 51 ~ 43 fps
med. 1920x1080
100%
Graphics 4-Core:
20 20 21 23 23 23 24 24 24 25 25 25 25 28 28 ~ 24 fps
high 1920x1080
100%
Graphics 4-Core:
19 19 20 21 22 22 22 22 23 23 23 24 25 25 26 ~ 22 fps
ultra 1920x1080
100%
Graphics 4-Core:
18 18 18 18 20 20 20 21 21 21 21 22 22 23 23 ~ 20 fps
low 1280x720
100%
Graphics 4-Core:
28.7 28.7 30.9 31.2 33.1 33.8 34.7 35 35.3 35.5 35.6 35.7 36.2 36.4 36.5 36.7 36.8 36.9 37.5 37.6 37.6 37.8 38.5 39.2 40 41.2 43.3 ~ 36 fps
med. 1920x1080
100%
Graphics 4-Core:
21.6 21.6 24 25.2 25.9 26.1 27.3 28 28 28.1 28.2 28.2 28.3 28.3 28.4 28.9 29.2 29.3 29.7 30 30.1 30.3 30.4 30.8 31.4 31.9 33.4 ~ 28 fps
high 1920x1080
100%
Graphics 4-Core:
19.1 19.1 20.8 21.6 21.8 22.8 23.2 23.3 23.4 23.4 23.6 23.6 23.7 23.8 24.1 24.1 24.5 24.5 24.8 25.1 25.3 25.4 25.8 26 26 27.1 28.2 ~ 24 fps
low 1280x720
100%
Graphics 4-Core:
31.7 33.7 33.7 35 35.4 35.7 36.2 36.9 37.4 37.6 37.8 38.5 39.7 40.1 40.5 40.6 42.3 42.6 42.7 44.9 46 46.6 48.1 48.2 48.6 51.5 ~ 40 fps
med. 1920x1080
100%
Graphics 4-Core:
17.1 19.3 19.4 19.5 19.5 19.7 19.8 20.4 20.8 22 22.2 23 23.4 23.4 23.4 23.6 24.1 24.2 24.2 24.3 24.9 25.2 25.9 26 26.4 27.4 ~ 23 fps
high 1920x1080
100%
Graphics 4-Core:
12.2 14.1 14.4 14.4 14.6 14.7 14.9 15.7 16.3 16.3 16.7 16.8 16.9 17.3 17.3 17.4 17.5 17.9 18.2 18.2 18.2 18.3 18.4 18.5 18.8 19.1 ~ 17 fps
low 1280x720
HD Graphics (Cherry Trail):
21.4  fps
low 1280x720
HD Graphics (Cherry Trail):
15.5  fps
low 1280x720
HD Graphics (Cherry Trail):
22.6  fps
low 1024x768
HD Graphics (Cherry Trail):
11.5  fps
med. 1366x768
HD Graphics (Cherry Trail):
7  fps
low 1024x768
HD Graphics (Cherry Trail):
8.8  fps
med. 1366x768
HD Graphics (Cherry Trail):
4.8  fps
Anno 2205

Anno 2205

2015
low 1024x768
HD Graphics (Cherry Trail):
8.1  fps
med. 1366x768
HD Graphics (Cherry Trail):
3.9  fps
low 1366x768
HD Graphics (Cherry Trail):
13.9 16.8 ~ 15 fps
low 1024x768
HD Graphics (Cherry Trail):
15.1  fps
med. 1366x768
HD Graphics (Cherry Trail):
9.8  fps
low 1280x720
100%
Graphics 4-Core:
66.1 66.1 72.6 74.1 75.2 75.4 82.6 85 89.9 90.1 90.4 90.8 91.2 91.4 91.8 92.5 92.8 92.9 93.8 94 94.4 95 95.3 96.2 99 99.4 101.9 ~ 88 fps
23%
HD Graphics (Cherry Trail):
20  fps
med. 1366x768
100%
Graphics 4-Core:
38.2 38.2 43.7 44.2 48.6 52.2 52.4 52.6 53.9 54.3 54.3 54.9 55.5 57.7 58.9 59.5 59.7 60.2 60.4 60.7 66.7 66.9 67.3 69 72.2 72.7 80.9 ~ 58 fps
26%
HD Graphics (Cherry Trail):
15.2  fps
high 1920x1080
100%
Graphics 4-Core:
37.8 44.4 44.4 44.6 47 48.4 49.7 50.2 50.7 51.4 52.8 52.9 54.5 56.1 57.2 58 59.9 60.4 61 61.1 61.2 61.6 61.6 61.6 62.2 63.3 65.6 ~ 55 fps
13%
HD Graphics (Cherry Trail):
7.2  fps
ultra 1920x1080
100%
Graphics 4-Core:
39.9 39.9 43.9 45.5 47 47.9 48 48 49.9 50 50.7 51.3 51.8 52.4 52.7 54 54.2 54.4 56 56.6 56.9 57.3 57.3 57.6 58.3 60.4 62 ~ 52 fps
low 1024x768
100%
Graphics 4-Core:
66.5 79.6 86.8 88.3 91 92.1 92.1 92.9 ~ 86 fps
med. 1366x768
100%
Graphics 4-Core:
41.3 49.6 51.1 52.2 56.2 57 57 57 ~ 53 fps
high 1920x1080
100%
Graphics 4-Core:
21.4 28 28.4 28.5 31 32.4 32.4 33.3 ~ 29 fps
ultra 1920x1080
100%
Graphics 4-Core:
11.9 14.9 15 15.5 16.3 17.6 17.9 17.9 ~ 16 fps
low 1024x768
HD Graphics (Cherry Trail):
20.1  fps
med. 1366x768
HD Graphics (Cherry Trail):
12.5  fps
GTA V

GTA V

2015
low 1024x768
100%
Graphics 4-Core:
69.1 75.5 94 95.3 97.9 102.8 103.9 104.8 109.9 112.1 114.3 116.5 118.1 127.4 128.9 132.5 135.5 137 139.1 142.9 ~ 113 fps
10%
HD Graphics (Cherry Trail):
10.8 (!)  fps
med. 1366x768
100%
Graphics 4-Core:
68 81.9 83.6 84.8 88.8 91.1 91.7 91.9 95.7 98.1 102.7 105.5 109 109.3 110 110.4 111.7 115.9 116.9 123.9 ~ 100 fps
high 1920x1080
100%
Graphics 4-Core:
17 17.6 19.2 19.5 19.7 19.9 20.3 20.7 21.4 21.6 21.9 22.1 22.2 23.6 24.2 24.3 24.4 25.5 25.8 26.2 ~ 22 fps
ultra 1920x1080
100%
Graphics 4-Core:
6.9 7.1 7.6 7.7 7.9 7.9 8 8.1 8.6 8.8 8.8 8.9 8.9 9 9.5 9.5 9.6 10 10.3 10.5 ~ 9 fps
low 1024x768
HD Graphics (Cherry Trail):
9.5  fps
med. 1366x768
HD Graphics (Cherry Trail):
5.7  fps
low 1024x768
HD Graphics (Cherry Trail):
16.2  fps
med. 1366x768
HD Graphics (Cherry Trail):
6.1  fps
F1 2014

F1 2014

2014
low 1024x768
HD Graphics (Cherry Trail):
16  fps
med. 1366x768
HD Graphics (Cherry Trail):
12  fps
Fifa 15

Fifa 15

2014
low 1280x720
HD Graphics (Cherry Trail):
15.6  fps
Sims 4

Sims 4

2014
low 1024x768
HD Graphics (Cherry Trail):
65.6 66.6 81.4 ~ 71 fps
med. 1366x768
HD Graphics (Cherry Trail):
9.4 16.9 21.2 ~ 16 fps
high 1920x1080
HD Graphics (Cherry Trail):
5.5 10 ~ 8 fps
low 1024x768
HD Graphics (Cherry Trail):
22 27.3 ~ 25 fps
med. 1366x768
HD Graphics (Cherry Trail):
12.5 13.5 ~ 13 fps
low 1024x768
HD Graphics (Cherry Trail):
13.3  fps
Asphalt 8: Airborne

Asphalt 8: Airborne

2013
low
HD Graphics (Cherry Trail):
58  fps
high
HD Graphics (Cherry Trail):
47  fps
Dota 2

Dota 2

2013
low 1024x768
HD Graphics (Cherry Trail):
29.7  fps
med. 1366x768
HD Graphics (Cherry Trail):
16.5  fps
GRID 2

GRID 2

2013
low 1024x768
HD Graphics (Cherry Trail):
24  fps
med. 1366x768
HD Graphics (Cherry Trail):
13.5  fps
low 1280x720
HD Graphics (Cherry Trail):
16 18 18.9 19.8 20.1 20.5 ~ 19 fps
med. 1366x768
HD Graphics (Cherry Trail):
6.4 7.9 9.3 9.8 10 10 ~ 9 fps
high 1366x768
HD Graphics (Cherry Trail):
5.6 5.7 6.7 7.6 7.9 8.4 ~ 7 fps
ultra 1920x1080
HD Graphics (Cherry Trail):
2.4 2.6 ~ 2 fps
low 1024x768
HD Graphics (Cherry Trail):
19.7 25.7 27.8 30.2 33.6 ~ 27 fps
med. 1366x768
HD Graphics (Cherry Trail):
10.5 12 13.2 13.5 14.8 ~ 13 fps
high 1366x768
HD Graphics (Cherry Trail):
7 8.3 9 ~ 8 fps
ultra 1920x1080
HD Graphics (Cherry Trail):
3.7 3.8 ~ 4 fps
Temple Run 2

Temple Run 2

2013
high
HD Graphics (Cherry Trail):
34  fps
low 1024x768
HD Graphics (Cherry Trail):
15.2  fps
med. 1366x768
HD Graphics (Cherry Trail):
11.6  fps
low 1024x768
HD Graphics (Cherry Trail):
0 (!)  fps
med. 1366x768
HD Graphics (Cherry Trail):
0 (!)  fps
low 1024x768
HD Graphics (Cherry Trail):
14.1 21.6 41.1 ~ 26 fps
med. 1366x768
HD Graphics (Cherry Trail):
4.8 18.6 35.1 ~ 20 fps
high 1366x768
HD Graphics (Cherry Trail):
20.3  fps
ultra 1920x1080
HD Graphics (Cherry Trail):
11.4  fps
low 1024x768
HD Graphics (Cherry Trail):
24.3 31.9 ~ 28 fps
med. 1366x768
HD Graphics (Cherry Trail):
16 19 ~ 18 fps
Anno 2070

Anno 2070

2011
low 1024x768
HD Graphics (Cherry Trail):
15.3 28.1 33.1 ~ 26 fps
med. 1366x768
HD Graphics (Cherry Trail):
12.8 13.4 13.7 ~ 13 fps
high 1366x768
HD Graphics (Cherry Trail):
8  fps
low 1280x720
HD Graphics (Cherry Trail):
15.5 18.9 ~ 17 fps
med. 1366x768
HD Graphics (Cherry Trail):
7.2 8.5 ~ 8 fps
low 1024x768
HD Graphics (Cherry Trail):
25.6  fps
high 1366x768
HD Graphics (Cherry Trail):
12  fps
Dirt 3

Dirt 3

2011
low 800x600
HD Graphics (Cherry Trail):
28.1  fps
med. 1024x768
HD Graphics (Cherry Trail):
12.5  fps
Civilization 5

Civilization 5

2010
low 1024x768
HD Graphics (Cherry Trail):
18.7  fps
low 1024x768
HD Graphics (Cherry Trail):
63.2 64 ~ 64 fps
med. 1360x768
HD Graphics (Cherry Trail):
18 18.8 ~ 18 fps
high 1360x768
HD Graphics (Cherry Trail):
14  fps
ultra 1920x1080
HD Graphics (Cherry Trail):
7  fps
Trackmania Nations Forever

Trackmania Nations Forever

2008
low 640x480
HD Graphics (Cherry Trail):
77.3 92.6 96.1 97.8 99.7 105 128 ~ 100 fps
high 1024x768
HD Graphics (Cherry Trail):
18.2 21.3 22.9 24.4 24.7 25 29.2 ~ 24 fps
ultra 1920x1080
HD Graphics (Cherry Trail):
9.6 15.5 16.8 ~ 14 fps
World of Warcraft

World of Warcraft

2005
low 800x600
HD Graphics (Cherry Trail):
44 50.9 ~ 47 fps
med. 1024x768
HD Graphics (Cherry Trail):
18.3  fps

Average Gaming Intel Graphics 4-Core iGPU (Arc) → 100%

Average Gaming 30-70 fps → 100%

Average Gaming Intel HD Graphics (Cherry Trail) → 18%

Intel Graphics 4-Core iGPU (Arc)Intel HD Graphics (Cherry Trail)
lowmed.highultraQHD4Klowmed.highultraQHD4K
Indiana Jones and the Great Circle7.09
Stalker 26.85.995.33
Call of Duty Black Ops 6151410
Until Dawn17.311.57.44
Final Fantasy XVI7.977.966.71
Space Marine 210.28.127.41
Star Wars Outlaws
F1 243834268
Senua's Saga Hellblade 26.435.374.14
Ghost of Tsushima11.59.758.89
Horizon Forbidden West13.812.38
Dragon's Dogma 29.136.81
Helldivers 21612.211
Prince of Persia The Lost Crown96.448.445.7
Cyberpunk 2077 2.2 Phantom Liberty19161312
Baldur's Gate 318141212
F1 234239257.14
F1 224340298
Tiny Tina's Wonderlands29231613
Strange Brigade100443528
Far Cry 543242220
X-Plane 11.11362824
Final Fantasy XV Benchmark402317
Dota 2 Reborn885855522015.27.2
The Witcher 386532916
GTA V11310022910.8
Intel Graphics 4-Core iGPU (Arc)Intel HD Graphics (Cherry Trail)
lowmed.highultraQHD4Klowmed.highultraQHD4K
< 30 fps
< 60 fps
< 120 fps
≥ 120 fps
14
6
4
15
6
2
21
3

10
2


< 30 fps
< 60 fps
< 120 fps
≥ 120 fps
2


1


1


For more games that might be playable and a list of all games and graphics cards visit our Gaming List

Add one or more devices and compare

In the following list you can select (and also search for) devices that should be added to the comparison. You can select more than one device.

restrict list:
v1.34
log 17. 05:35:19

#0 ran 0s before starting gpusingle class +0s ... 0s

#1 checking url part for id 12259 +0s ... 0s

#2 checking url part for id 6197 +0s ... 0s

#3 redirected to Ajax server, took 1760672118s time from redirect:1 +0s ... 0s

#4 did not recreate cache, as it is less than 5 days old! Created at Thu, 16 Oct 2025 05:22:23 +0200 +0s ... 0s

#5 composed specs +0.022s ... 0.023s

#6 did output specs +0s ... 0.023s

#7 start showIntegratedCPUs +0s ... 0.023s

#8 getting avg benchmarks for device 12259 +0.018s ... 0.041s

#9 got single benchmarks 12259 +0.033s ... 0.074s

#10 getting avg benchmarks for device 6197 +0.003s ... 0.077s

#11 got single benchmarks 6197 +0.022s ... 0.099s

#12 got avg benchmarks for devices +0s ... 0.099s

#13 min, max, avg, median took s +0.033s ... 0.132s

#14 before gaming benchmark output +0s ... 0.132s

#15 Got 987 rows for game benchmarks. +0.063s ... 0.195s

#16 composed SQL query for gamebenchmarks +0s ... 0.195s

#17 got data and put it in $dataArray +0.005s ... 0.2s

#18 benchmarks composed for output. +0.021s ... 0.221s

#19 calculated avg scores. +0s ... 0.221s

#20 return log +0.001s ... 0.222s

Please share our article, every link counts!
Mail Logo
> Expert Reviews and News on Laptops, Smartphones and Tech Innovations > Benchmarks / Tech > Graphics Card Comparison - Head 2 Head
Redaktion, 2017-09- 8 (Update: 2023-07- 1)