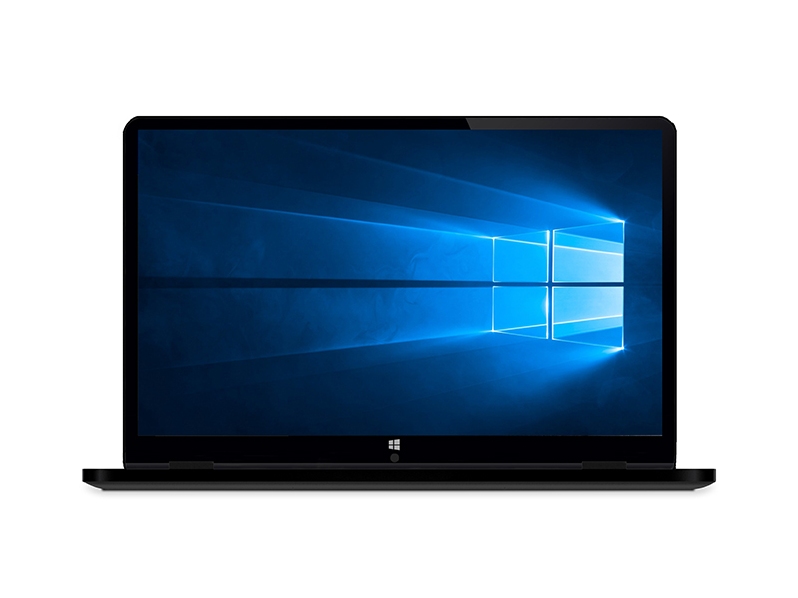
Ematic EWT117 (Atom x5-Z8350) Convertible Review
")
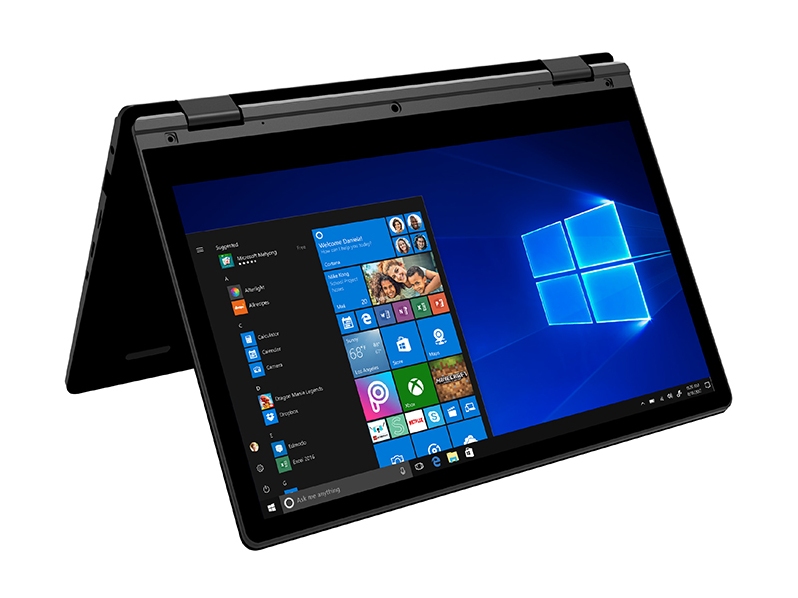
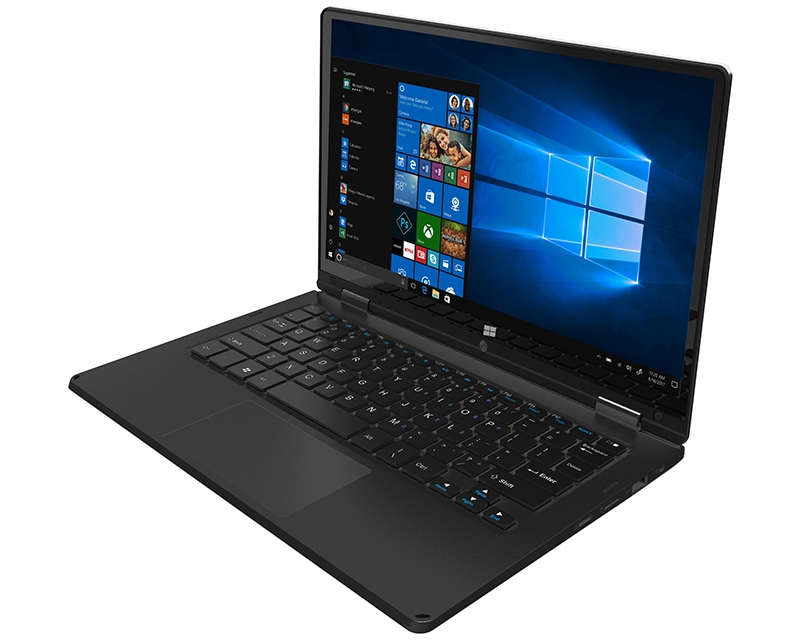
Los Angeles-based company Ematic specializes in inexpensive tablets, laptops, accessories, speakers, and even drones. One of these products is the 11.6-inch EWT117 convertible netbook equipped with the Cherry Trail Atom x5-Z8350 SoC. At under $200 retail, the 2-in-1 system sounds rather compelling especially because it offers a full-HD 1080p IPS touchscreen instead of HD 720p as found on most other netbooks. The EWT117 competes directly with other inexpensive subnotebooks including the Asus E203, Trekstor Yourbook C11B, Lenovo Ideapad 120s, Lenovo Flex 11, and the Acer Spin 1.
As our measurements below will show, however, the netbook leaves subpar impressions even for its price range.
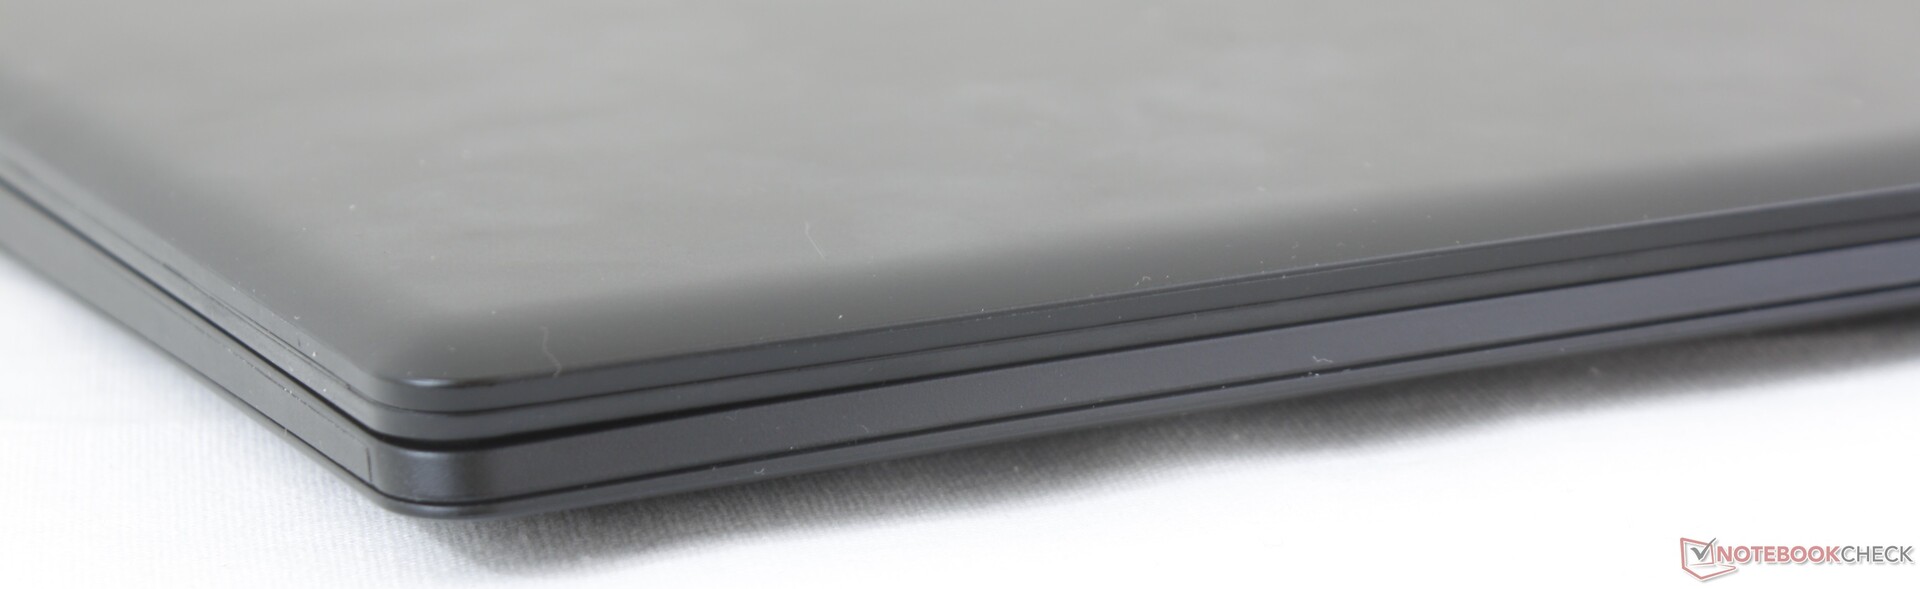
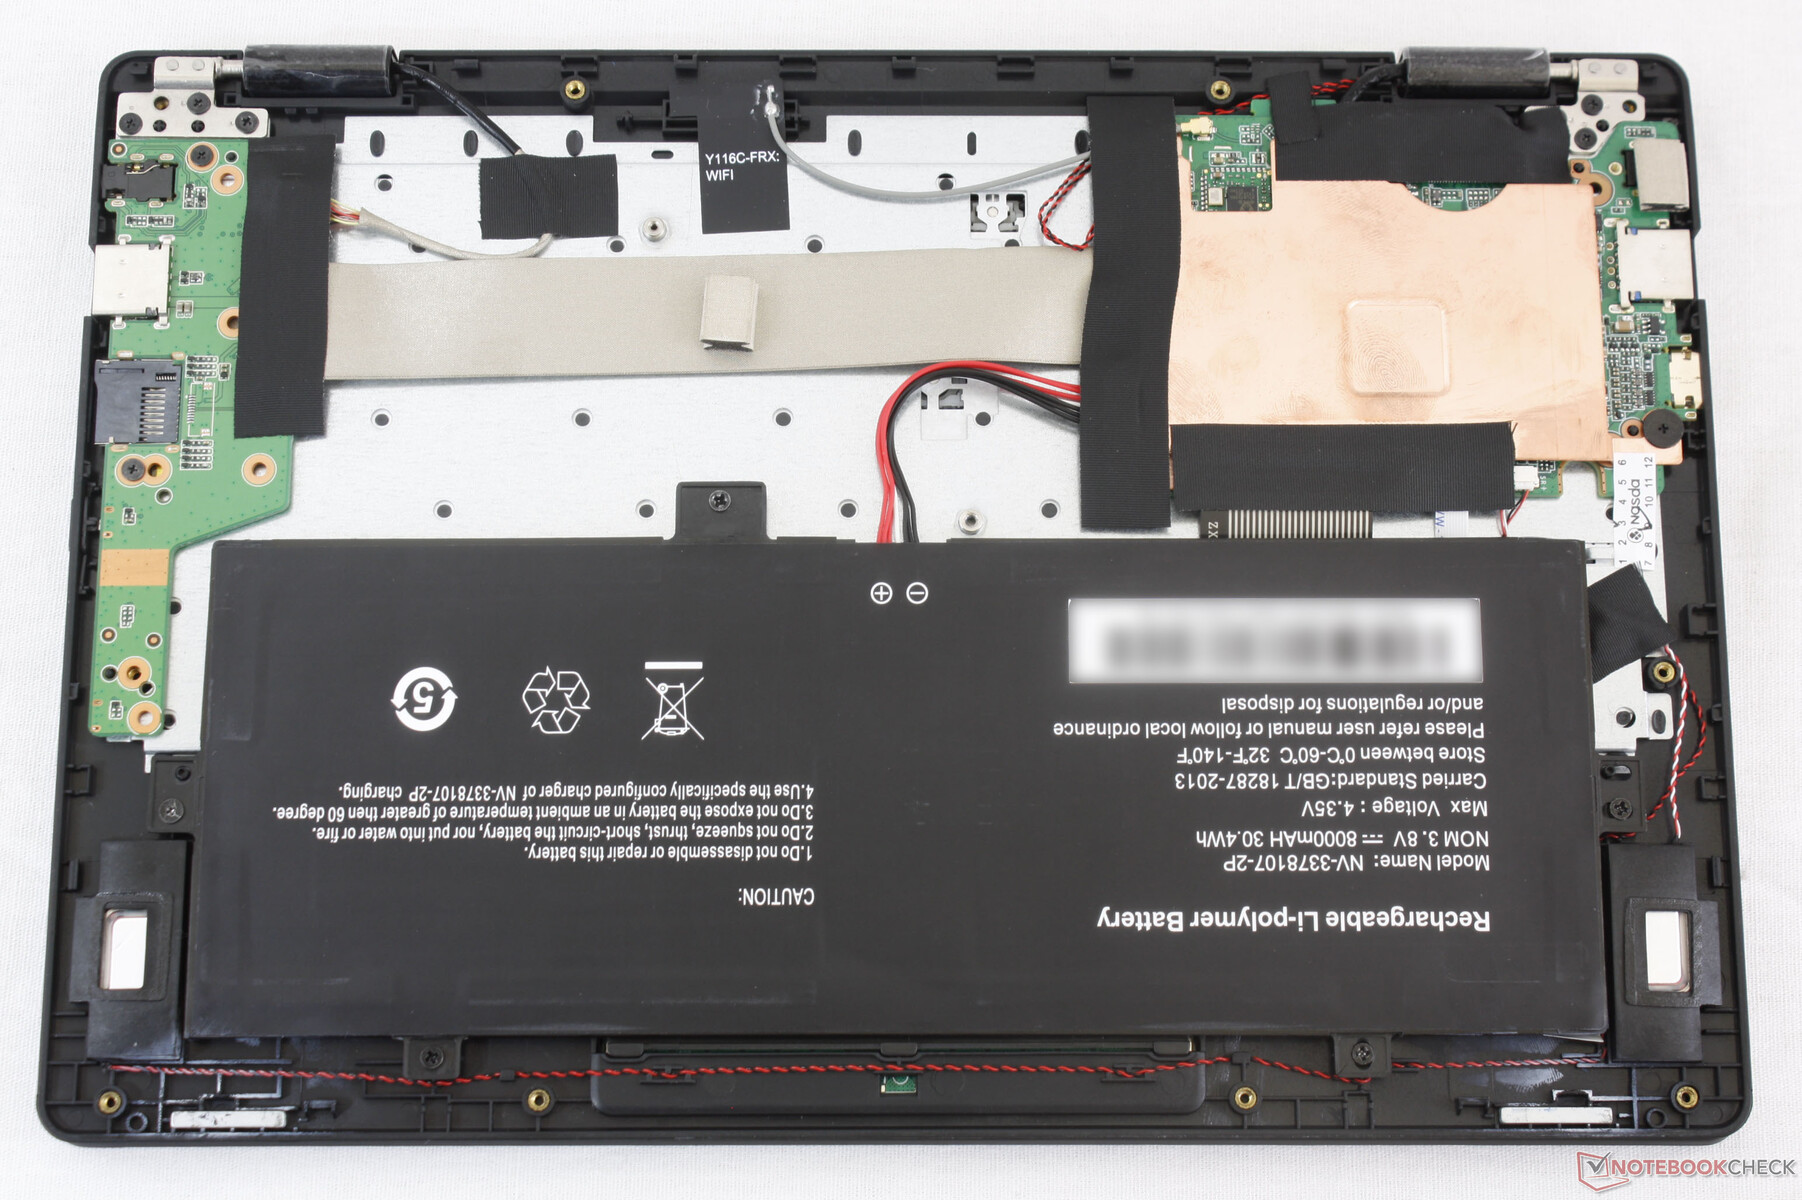
Case
Connectivity
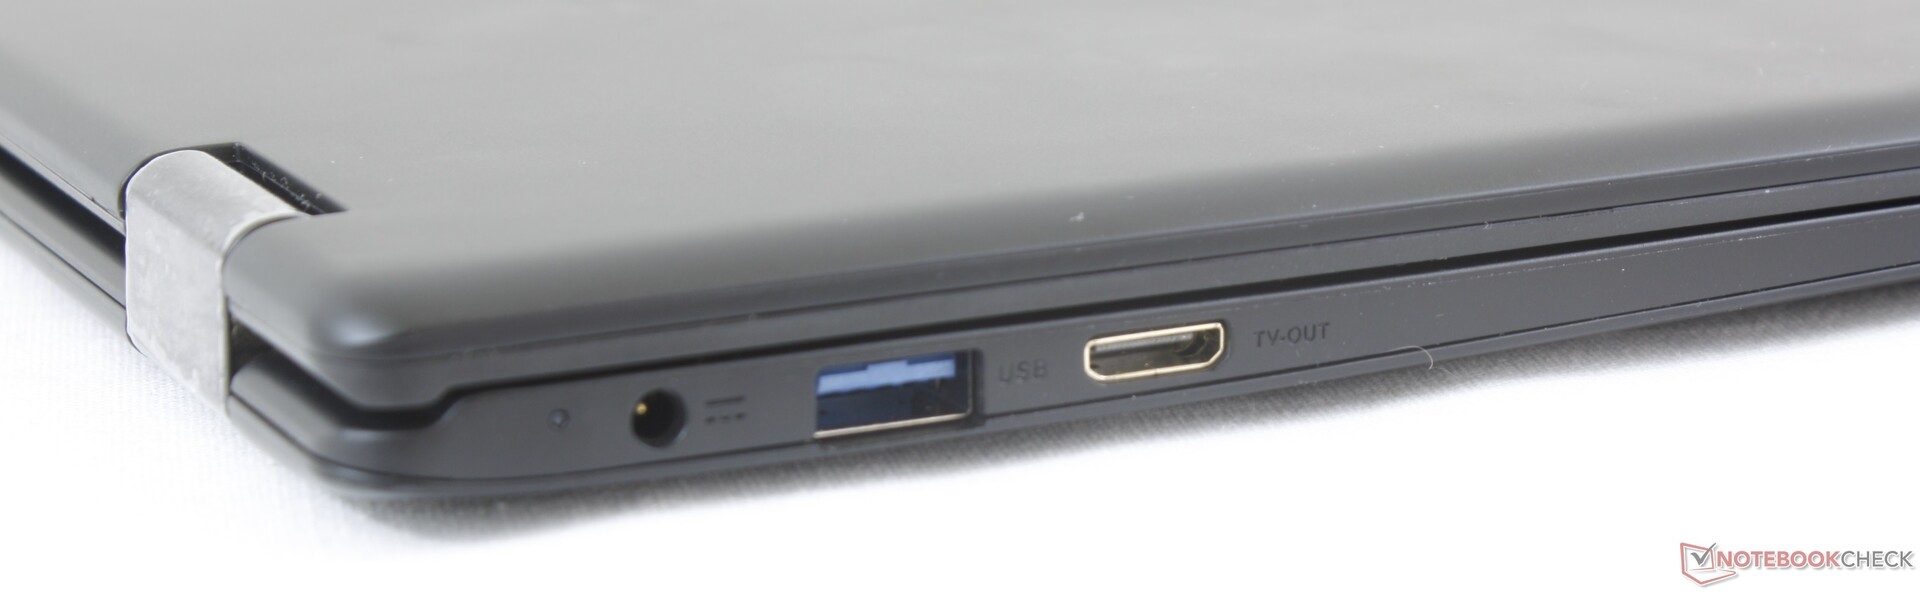
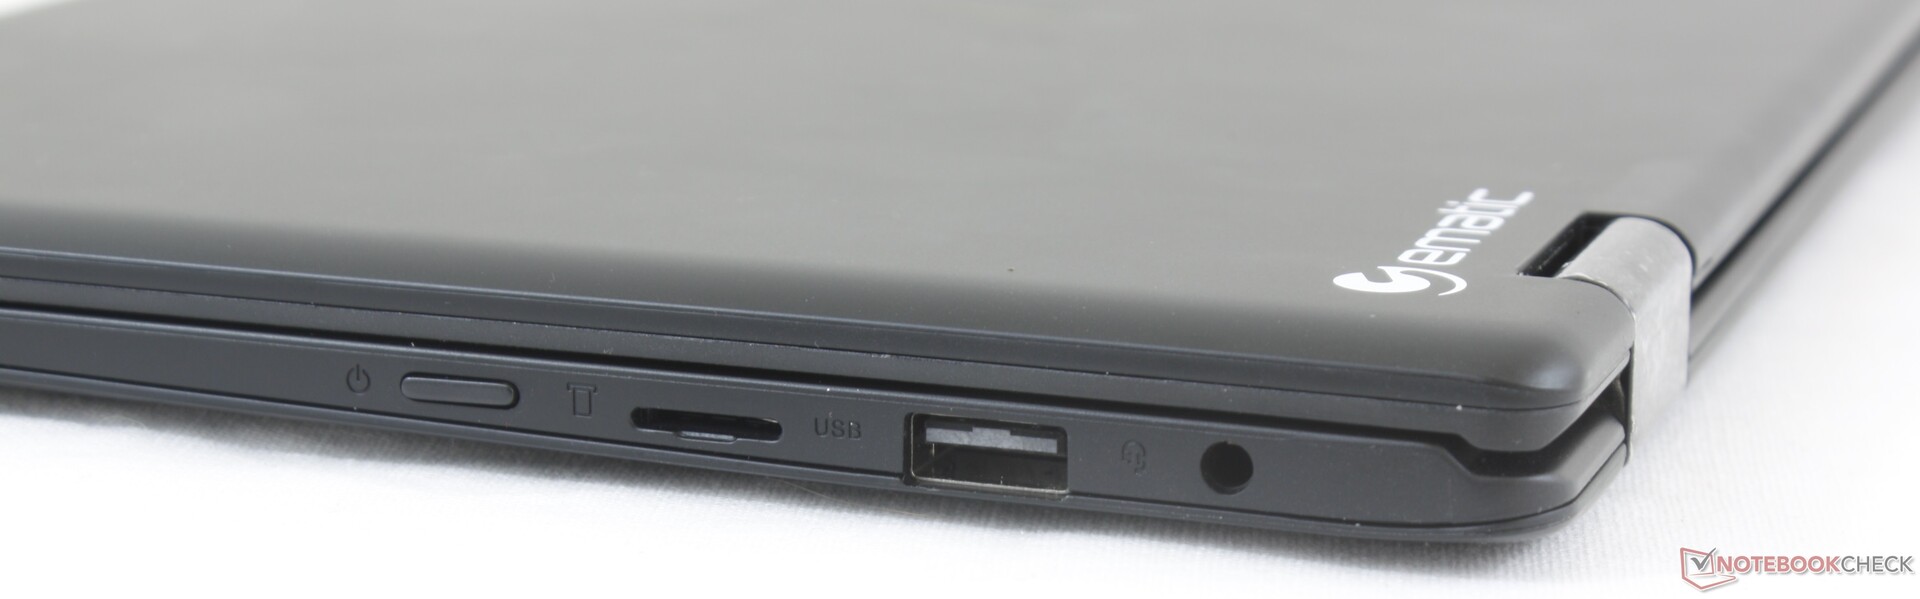
SD Card Reader
| SD Card Reader | |
| average JPG Copy Test (av. of 3 runs) | |
| Lenovo Ideapad 120s-11IAP (Toshiba Exceria Pro M401) | |
| Lenovo Yoga 330-11IGM (Toshiba Exceria Pro SDXC 64 GB UHS-II) | |
| Lenovo IdeaPad 330-15ARR-81D2005JGE (Toshiba Exceria Pro SDXC 64 GB UHS-II) | |
| Asus Zenbook UX360CA-FC060T (Toshiba Exceria Pro SDXC 64 GB UHS-II) | |
| Ematic EWT117 (Toshiba Exceria Pro M401) | |
| maximum AS SSD Seq Read Test (1GB) | |
| Lenovo Ideapad 120s-11IAP (Toshiba Exceria Pro M401) | |
| Lenovo Yoga 330-11IGM (Toshiba Exceria Pro SDXC 64 GB UHS-II) | |
| Asus Zenbook UX360CA-FC060T (Toshiba Exceria Pro SDXC 64 GB UHS-II) | |
| Trekstor Yourbook C11B (Toshiba Exceria Pro M501 microSDXC 64GB) | |
| Ematic EWT117 (Toshiba Exceria Pro M401) | |
Communication
| Networking | |
| iperf3 transmit AX12 | |
| Trekstor Yourbook C11B | |
| Asus E203MA-FD825TS | |
| Lenovo Yoga 330-11IGM | |
| Ematic EWT117 | |
| iperf3 receive AX12 | |
| Trekstor Yourbook C11B | |
| Lenovo Yoga 330-11IGM | |
| Asus E203MA-FD825TS | |
| Ematic EWT117 | |
Maintenance
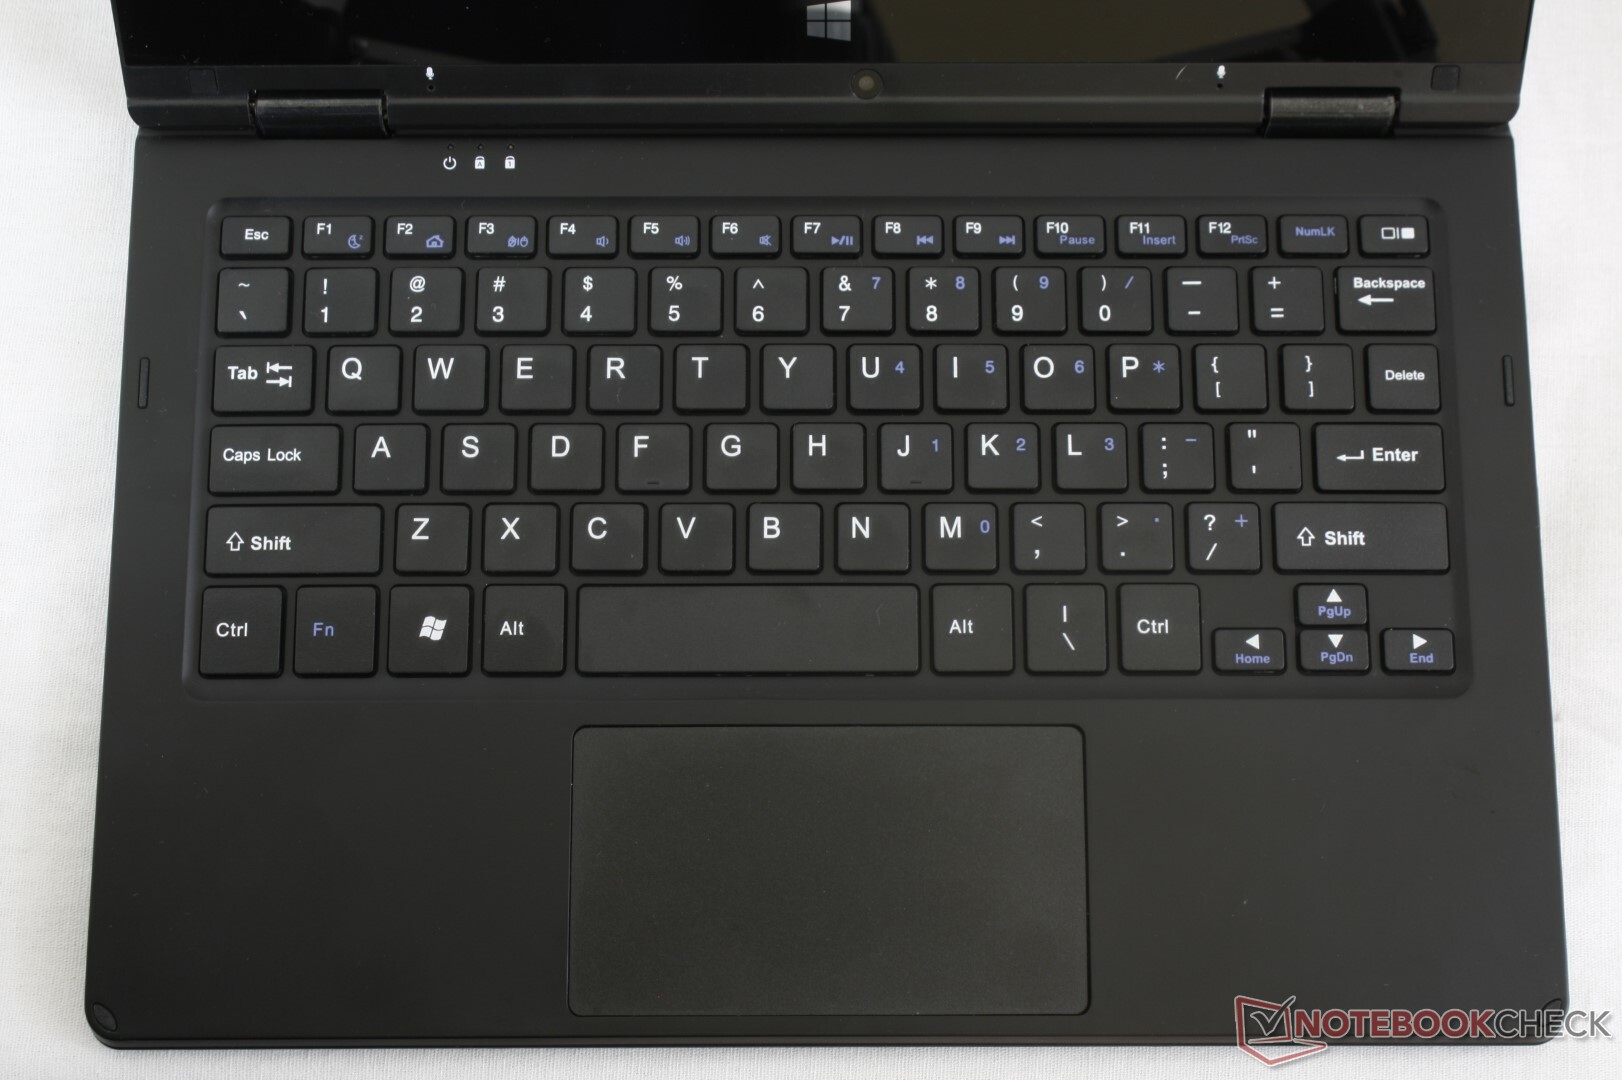
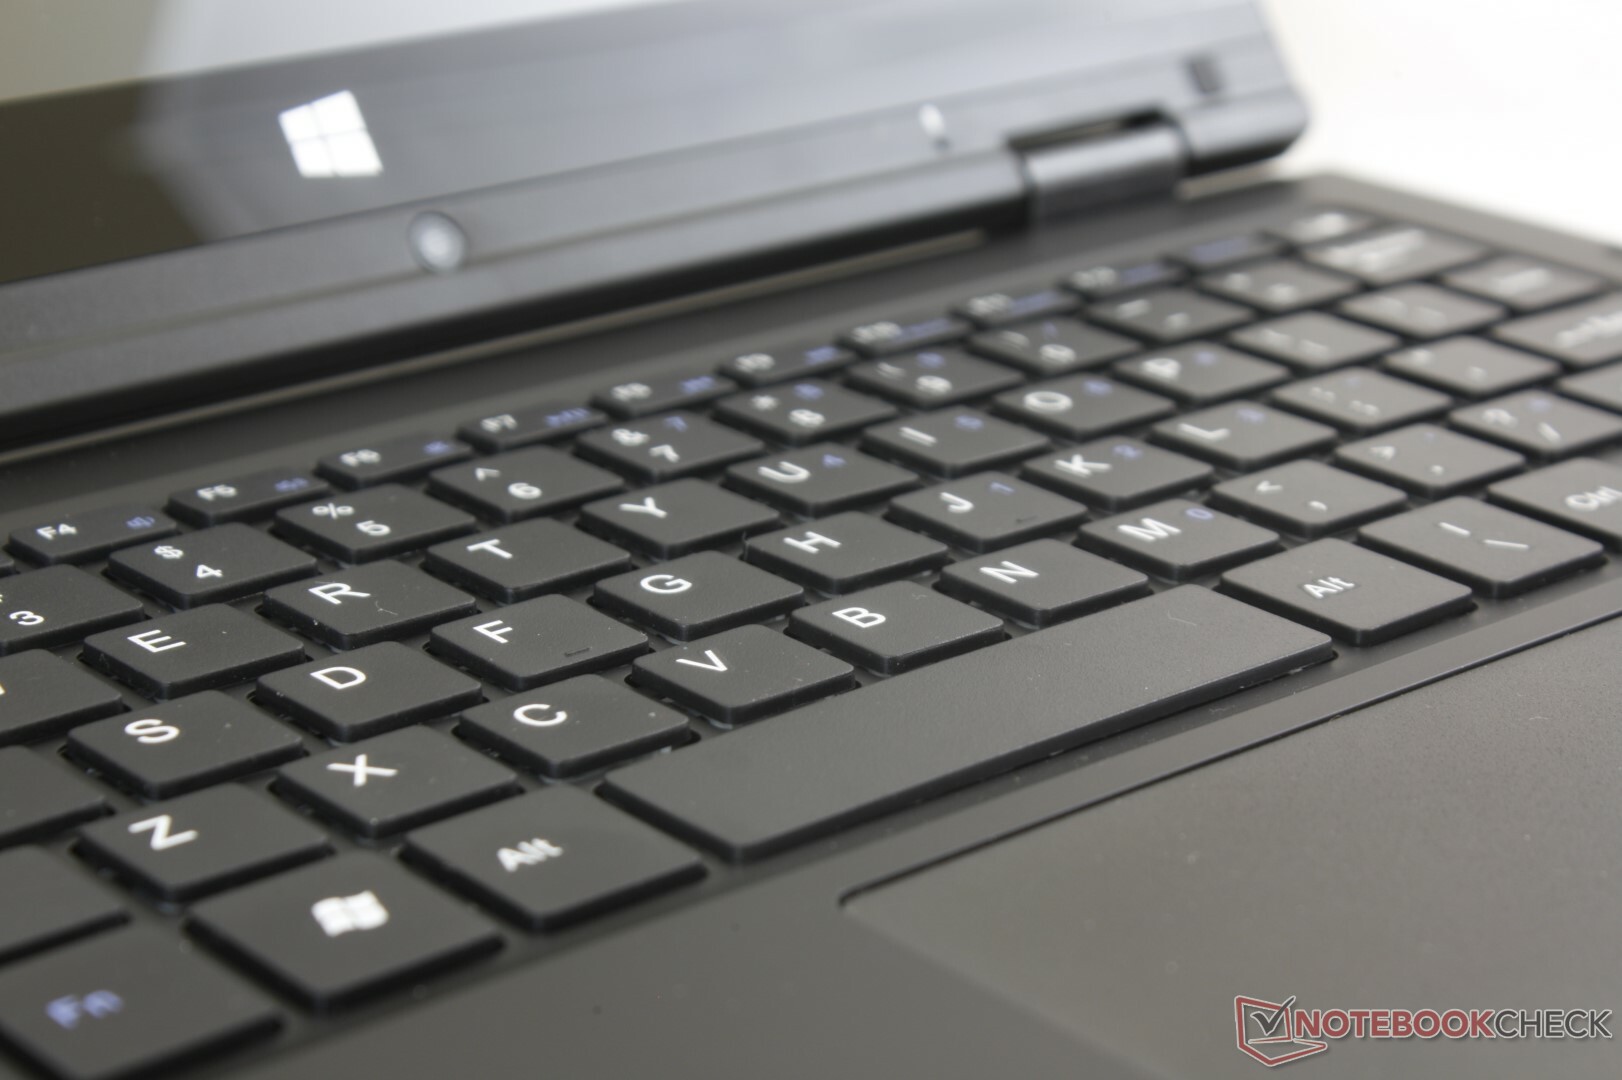
Input Devices
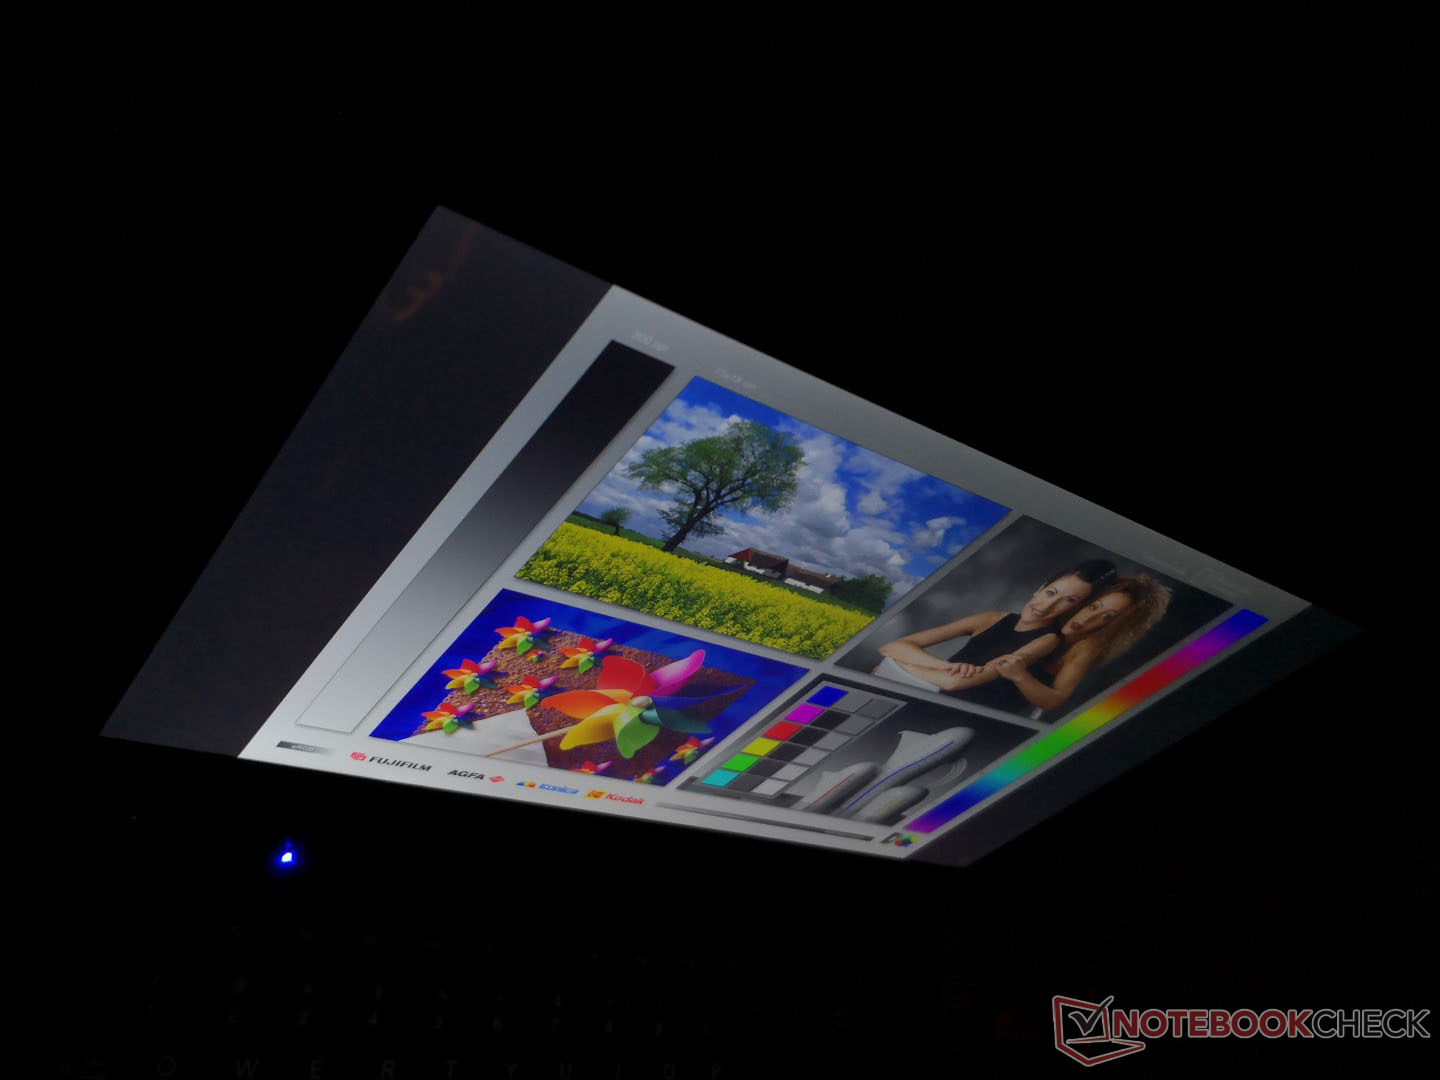
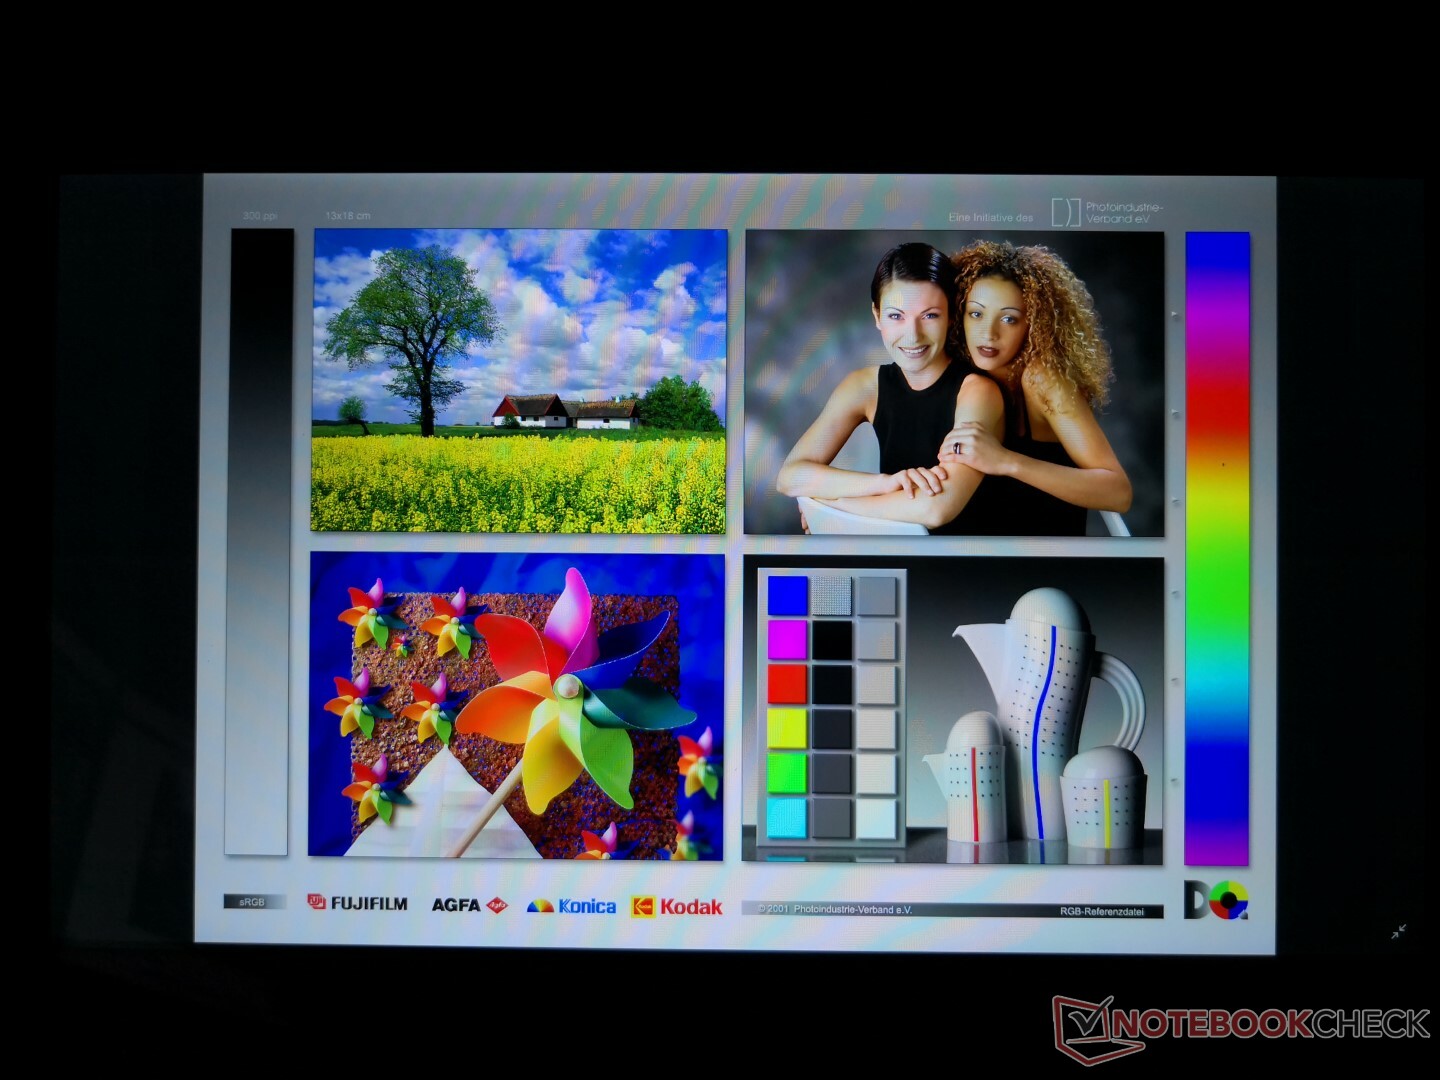
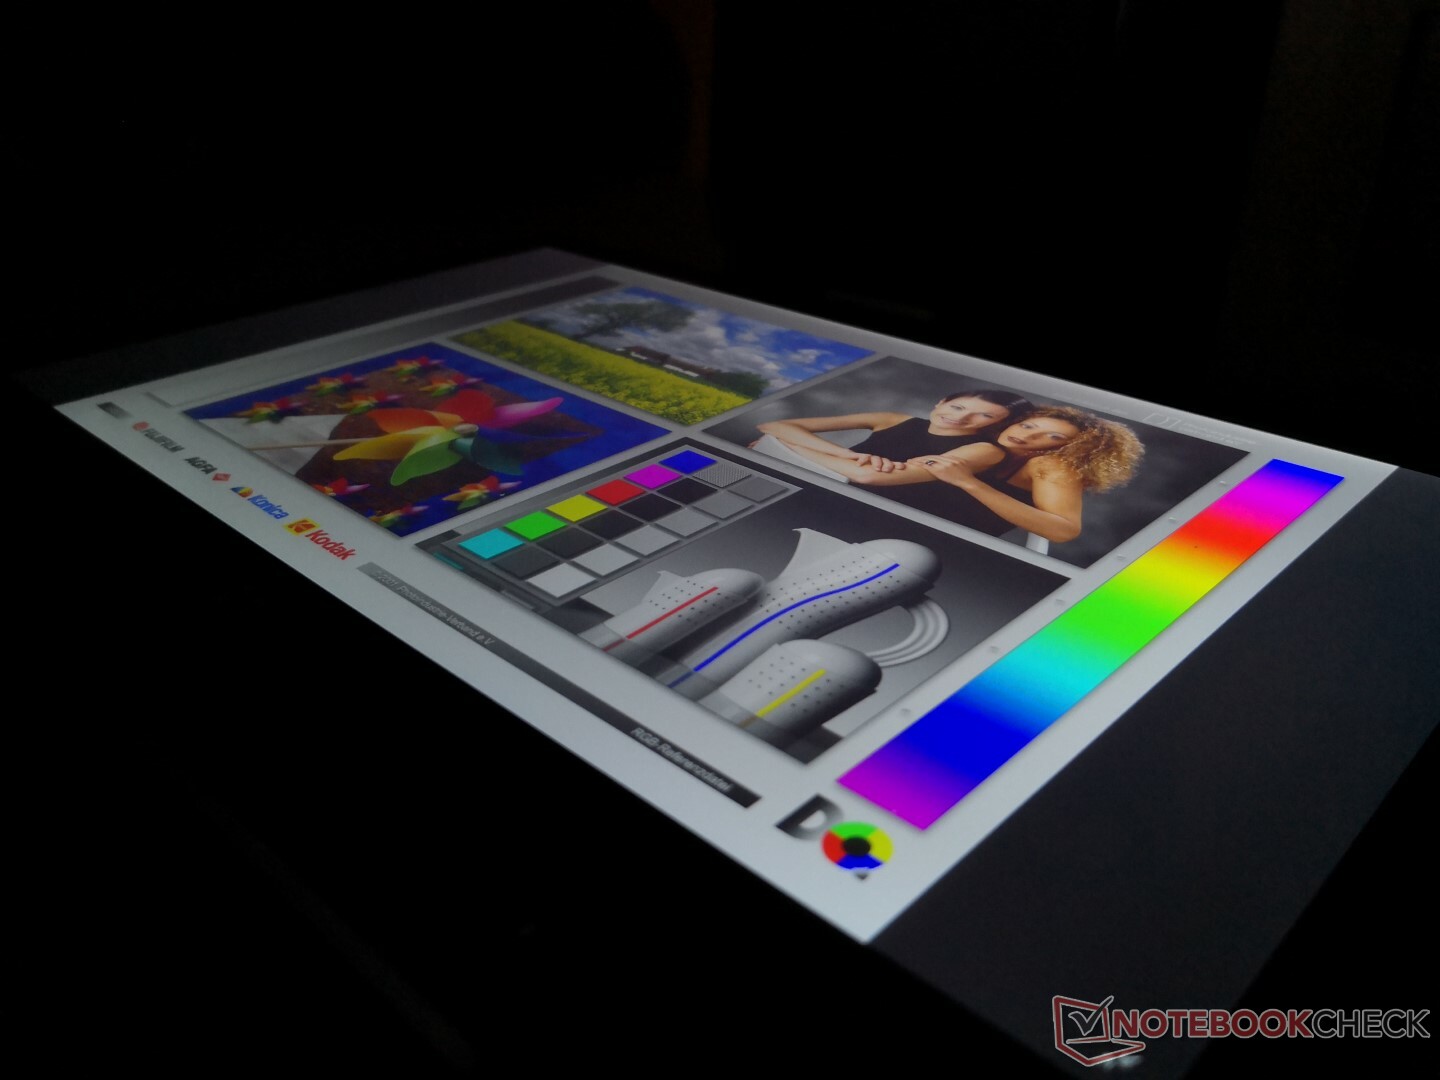
Display

| |||||||||||||||||||||||||
Brightness Distribution: 88 %
Center on Battery: 194.6 cd/m²
Contrast: 556:1 (Black: 0.35 cd/m²)
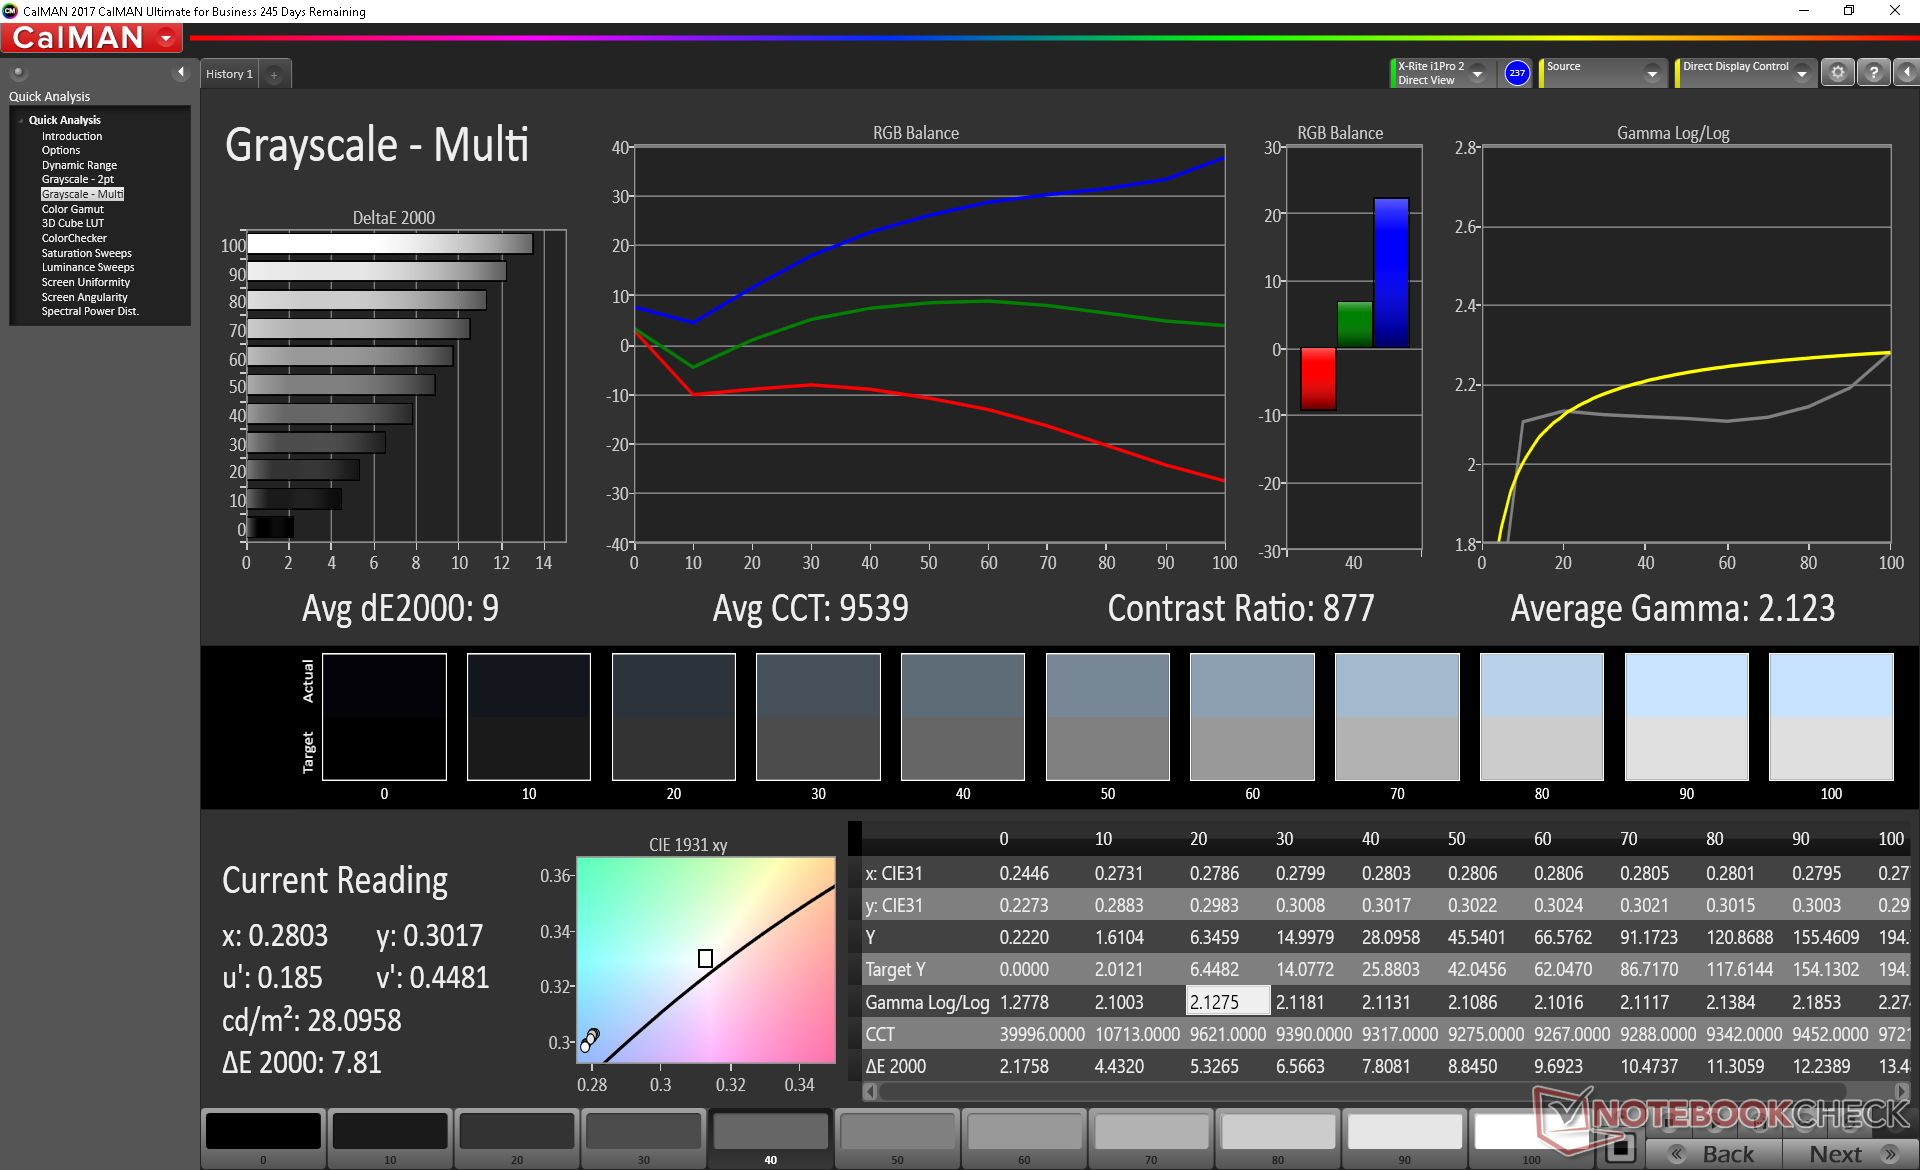
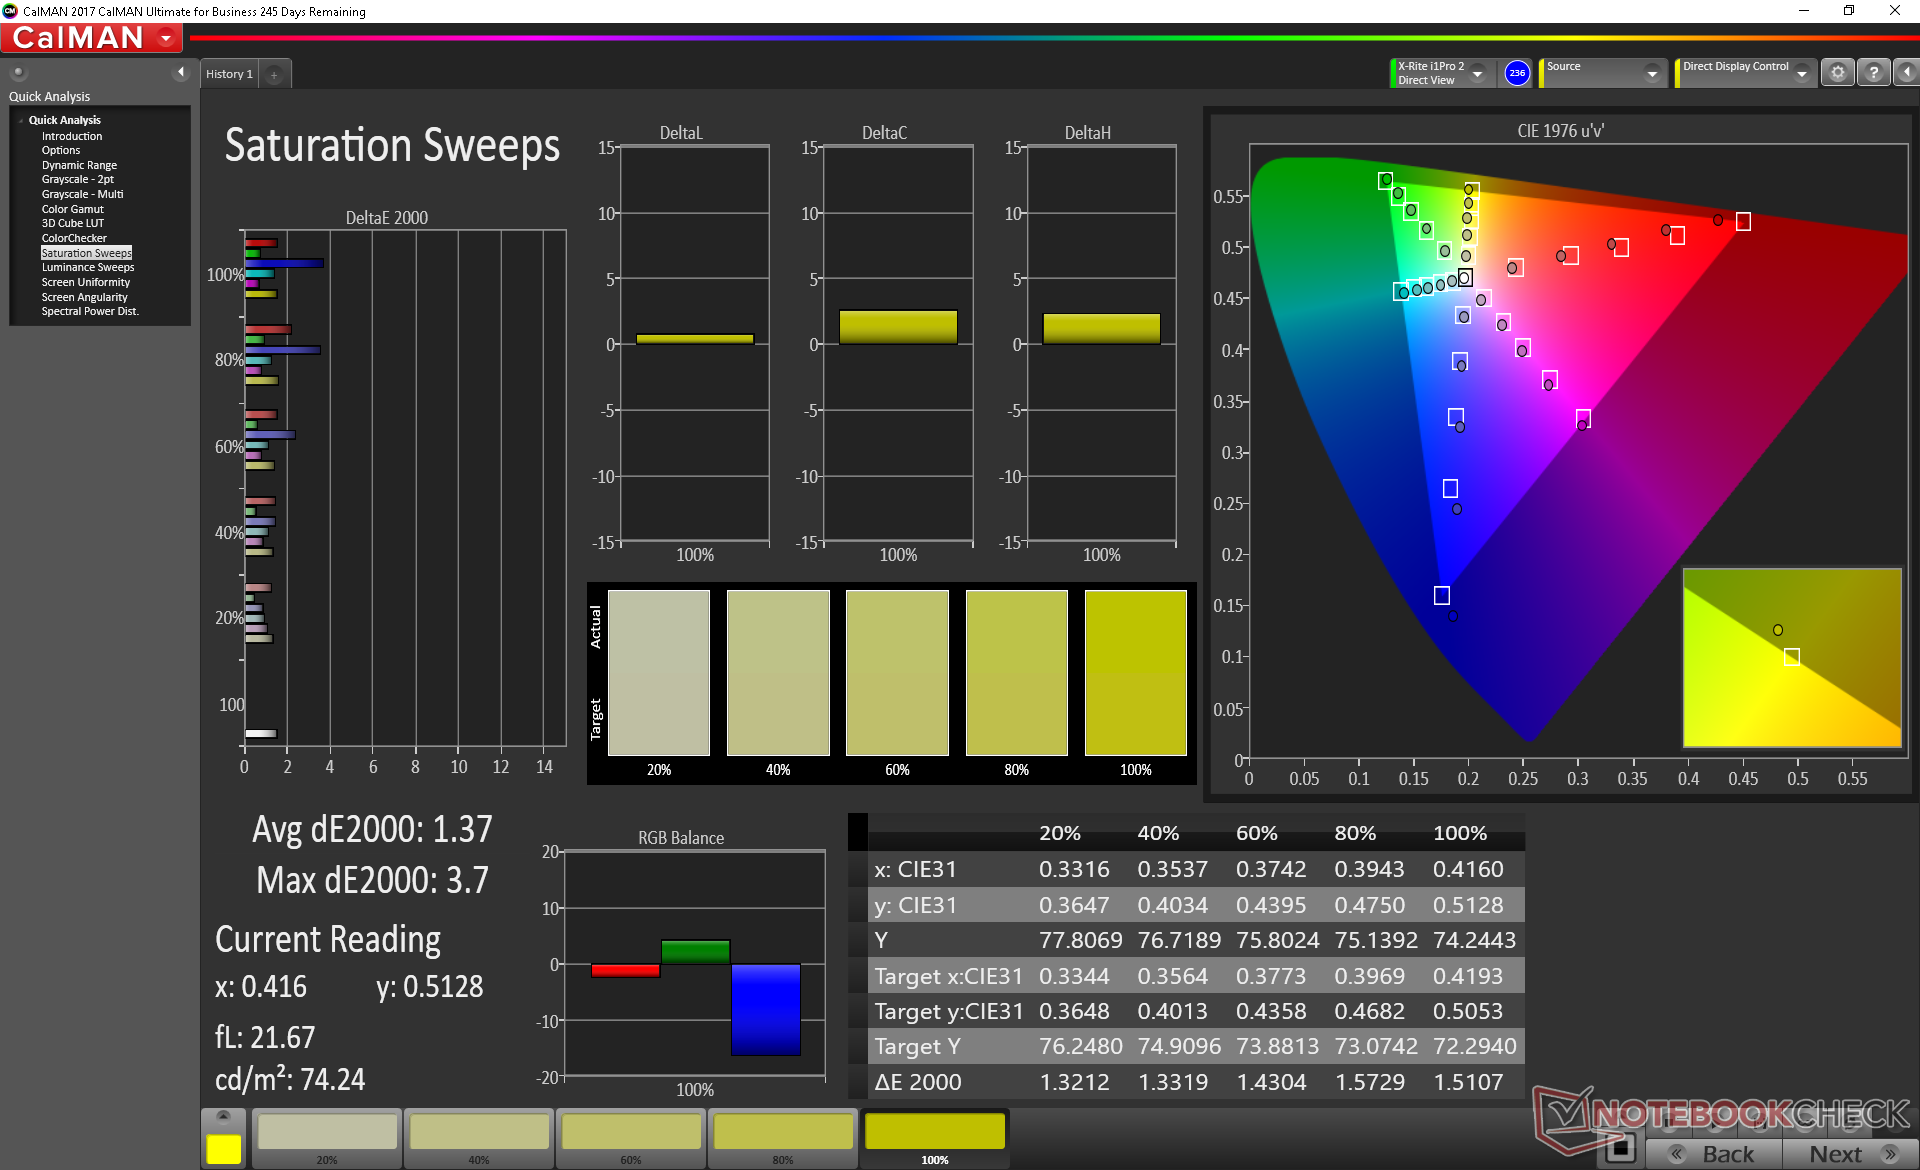
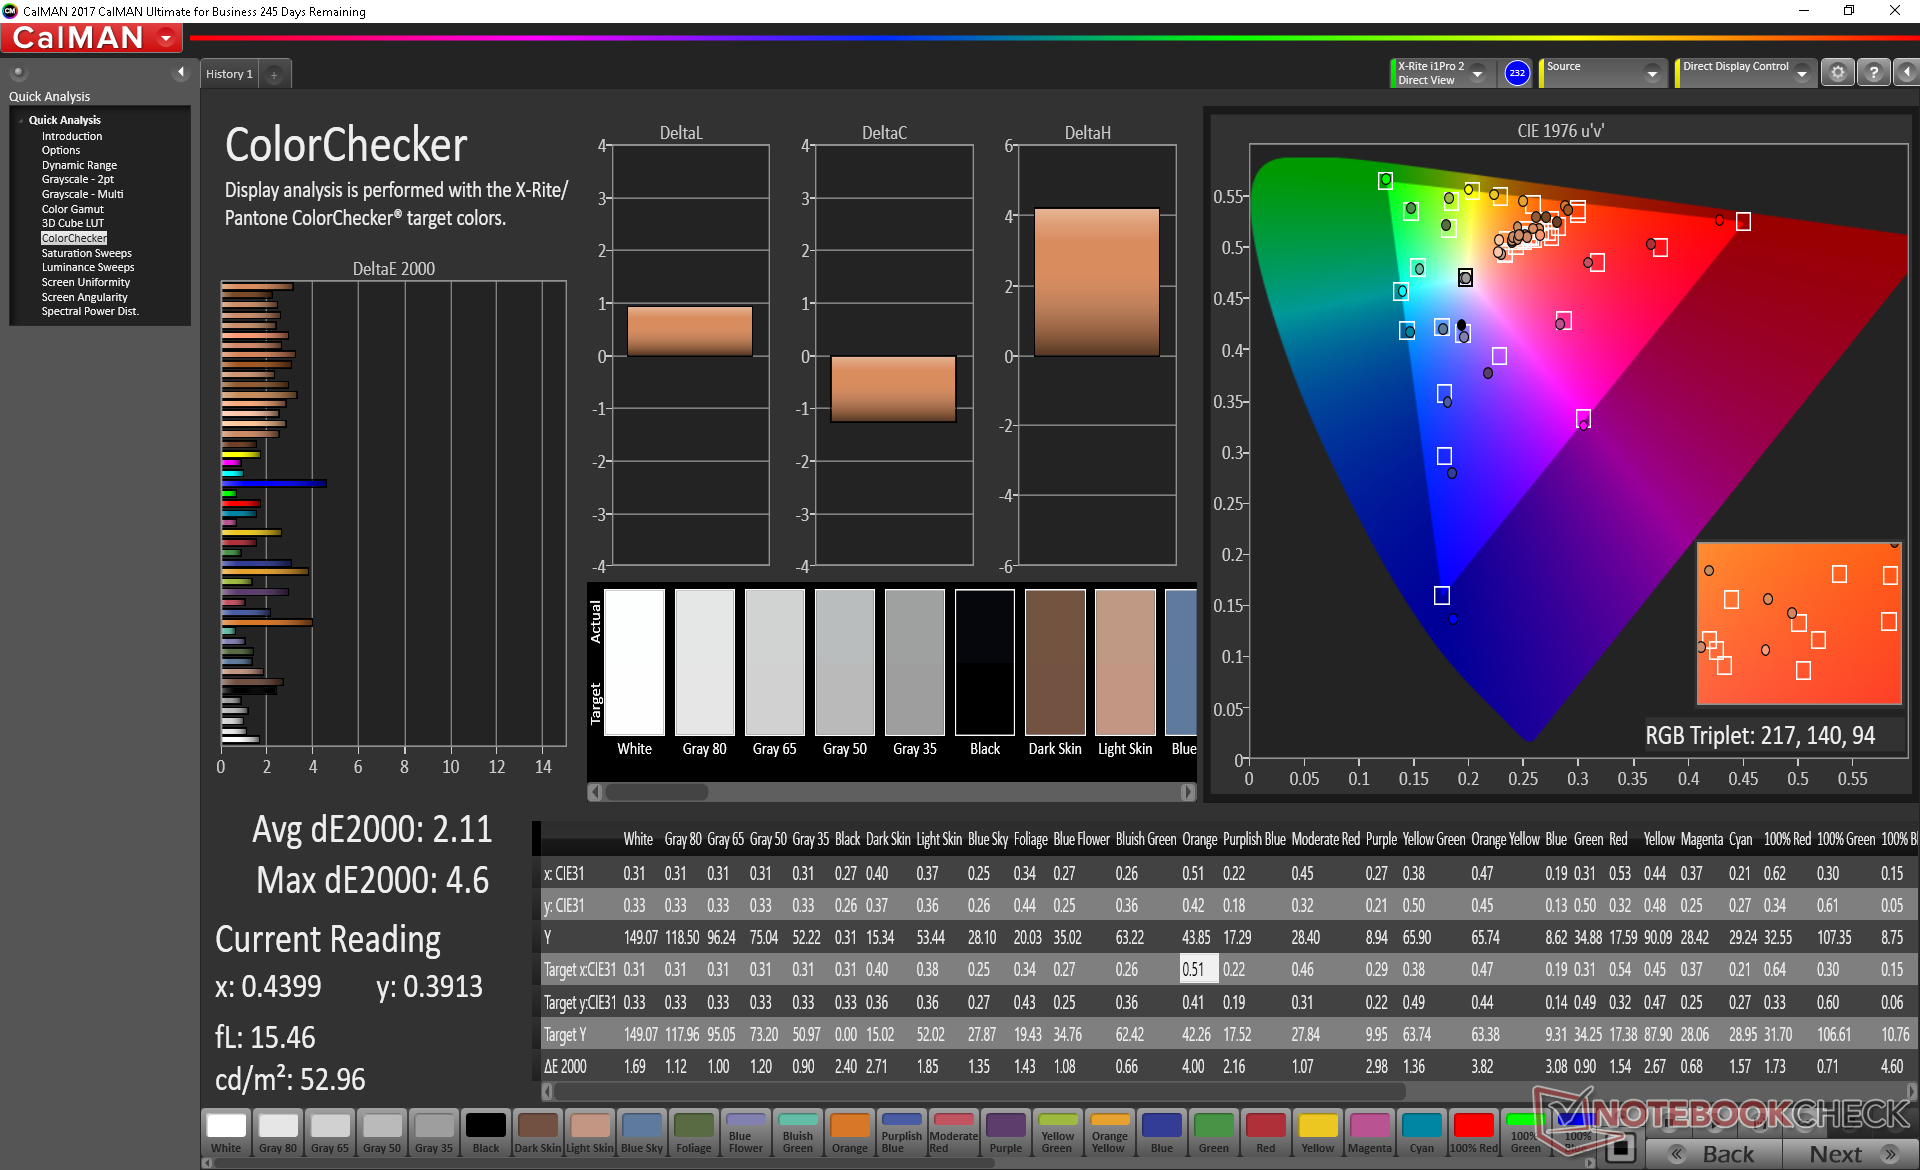
ΔE ColorChecker Calman: 8 | ∀{0.5-29.43 Ø4.71}
calibrated: 2.11
ΔE Greyscale Calman: 9 | ∀{0.09-98 Ø4.96}
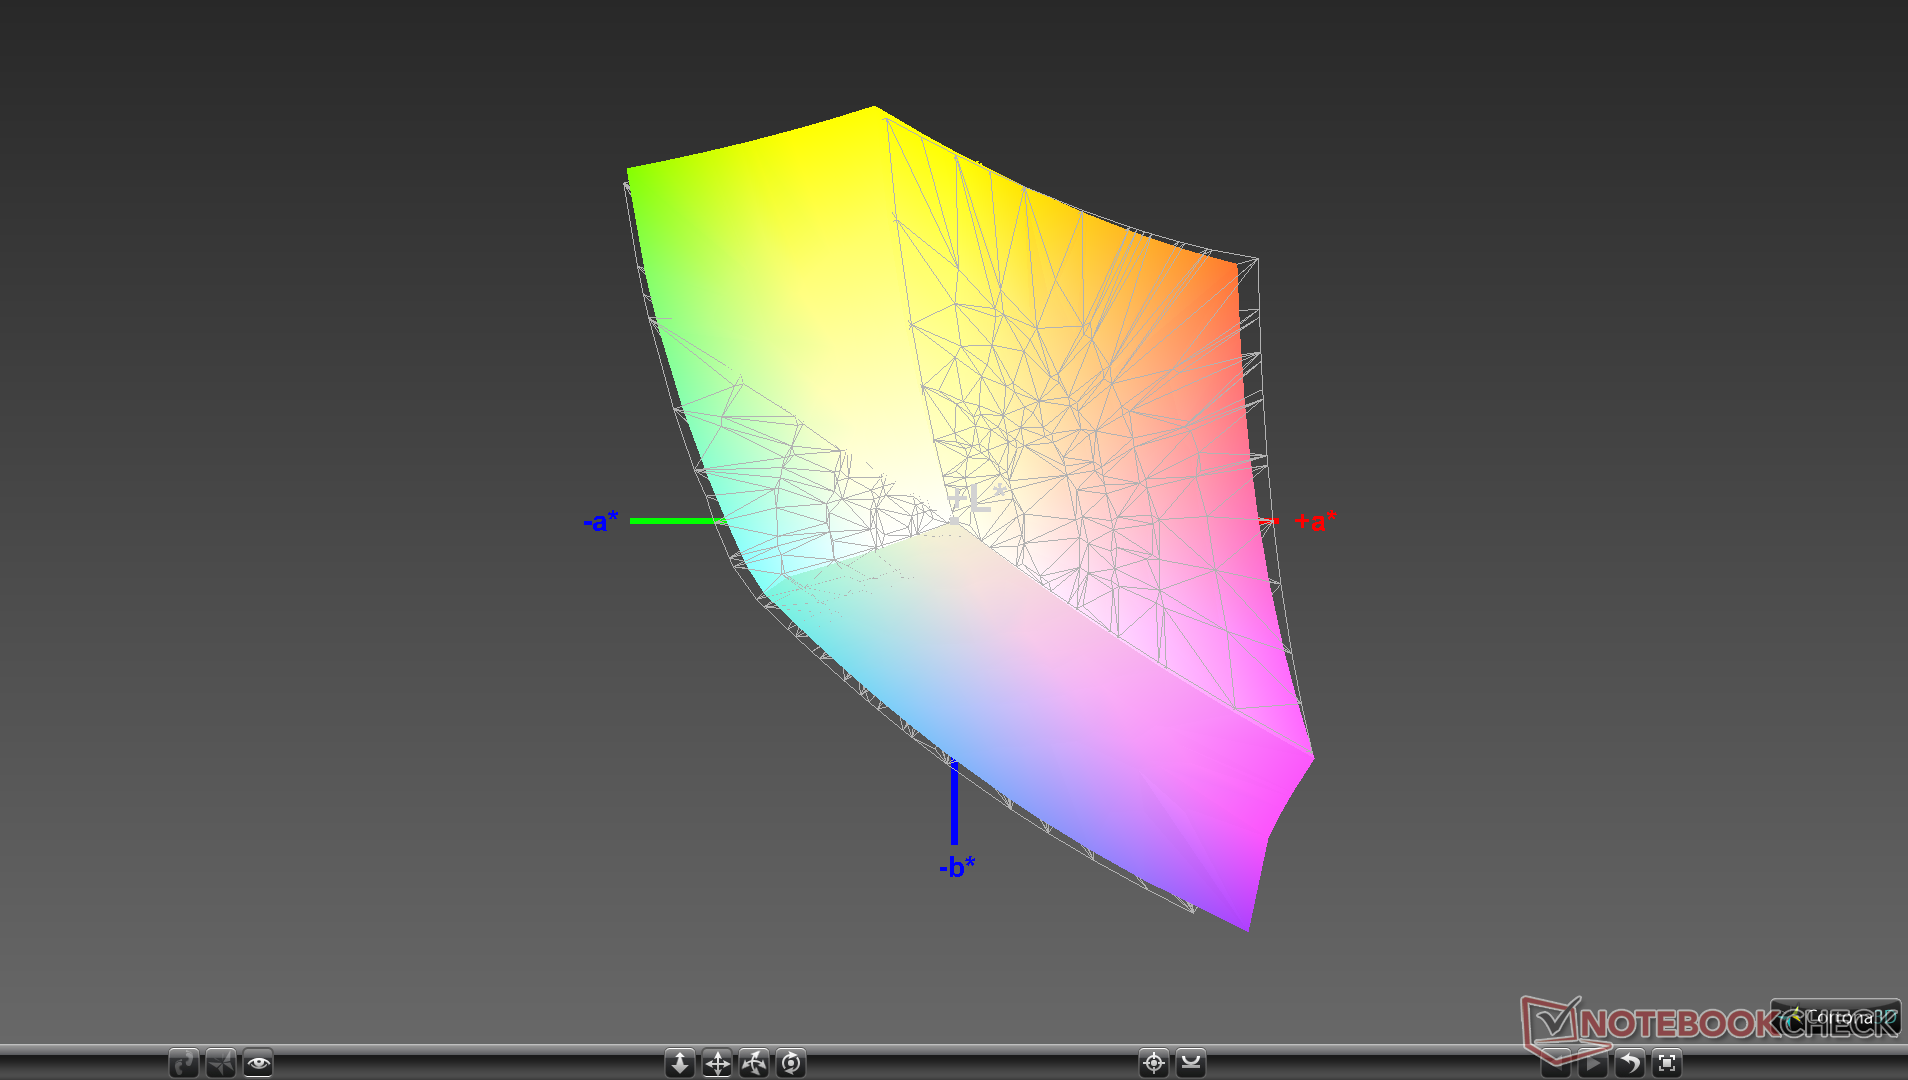
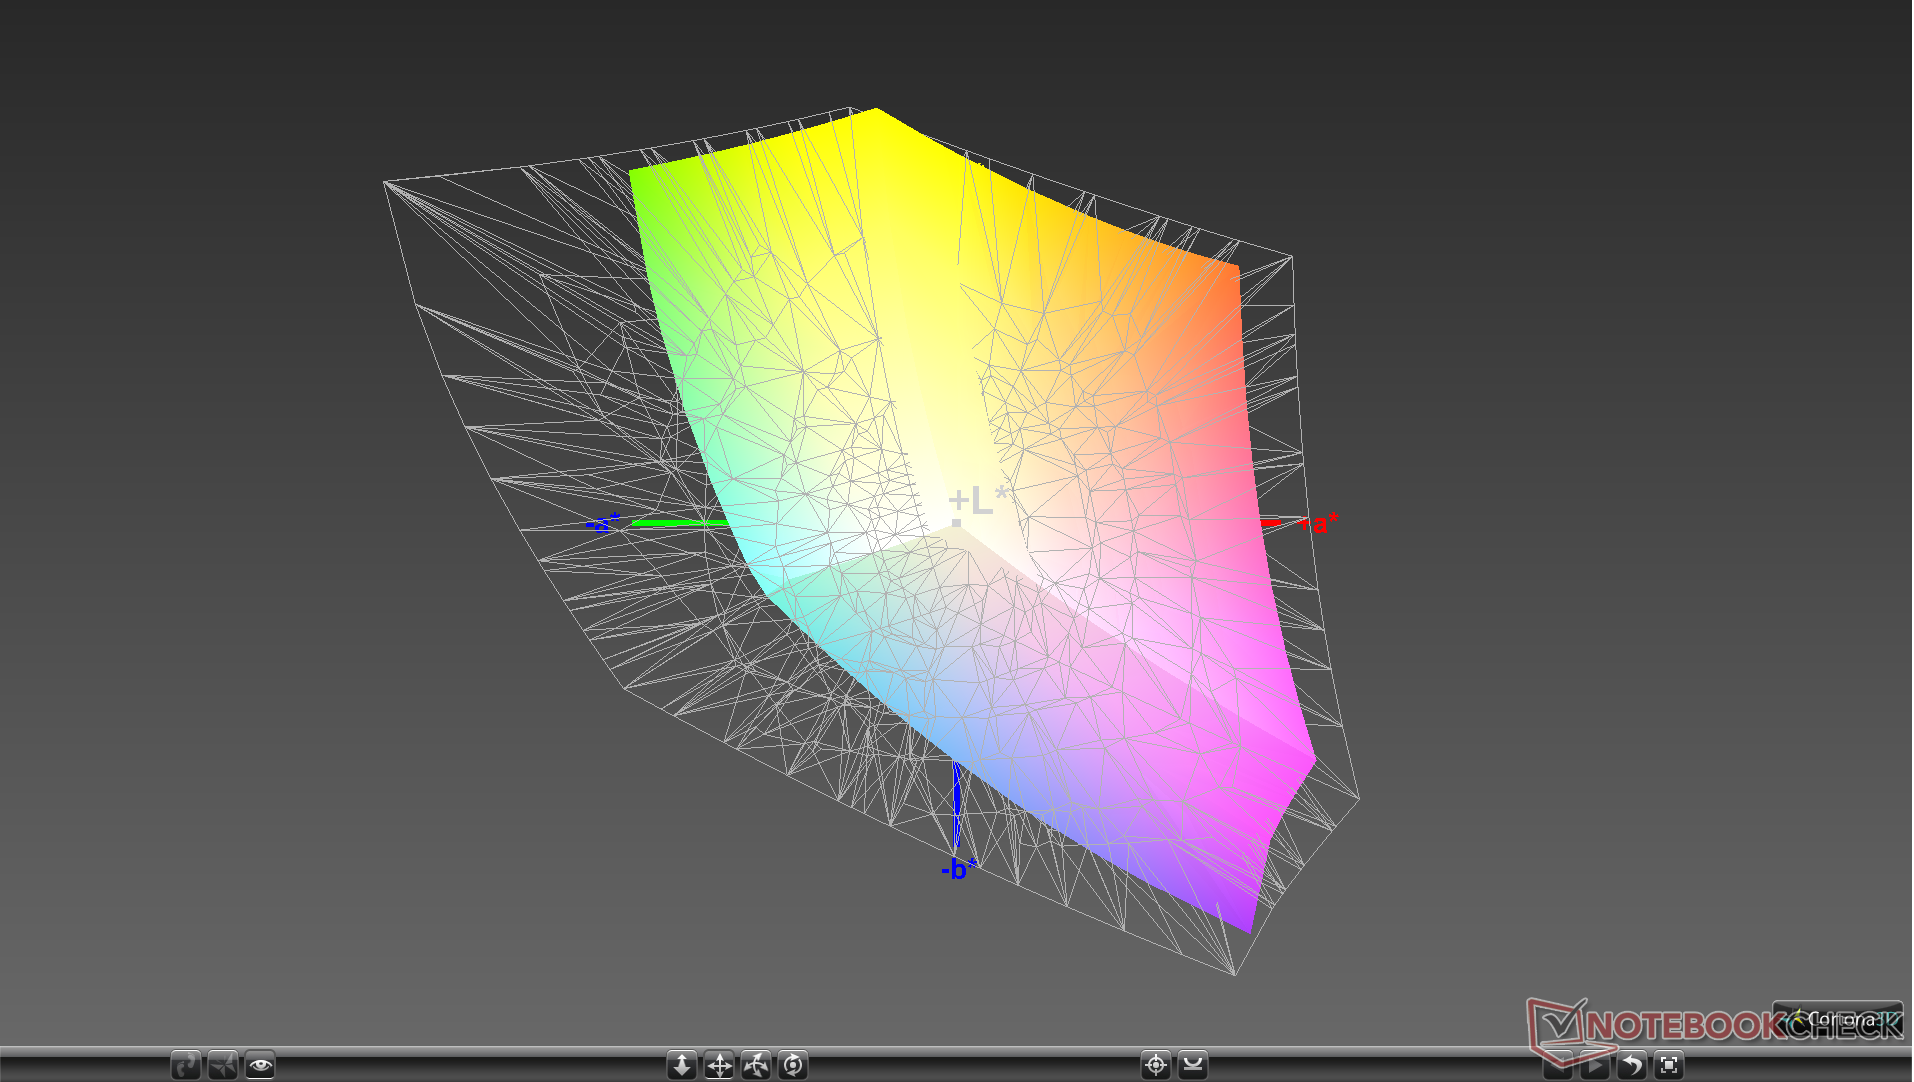
94.8% sRGB (Argyll 1.6.3 3D)
60.9% AdobeRGB 1998 (Argyll 1.6.3 3D)
66.2% AdobeRGB 1998 (Argyll 3D)
95.1% sRGB (Argyll 3D)
64.8% Display P3 (Argyll 3D)
Gamma: 2.12
CCT: 9539 K
| Ematic EWT117 LC116LF3L01, IPS, 11.6", 1920x1080 | Asus E203MA-FD825TS AUO225C, TN LED, 11.6", 1366x768 | Trekstor Yourbook C11B LC116LF1L01, IPS, 11.6", 1920x1080 | Lenovo Yoga 330-11IGM BOE CQ NT116WHM-N42, TN LED, 11.6", 1366x768 | Lenovo Ideapad 120s-11IAP AU Optronics AUO-B116XTN02.5 , TN LED, 11.6", 1366x768 | Dell Latitude 3189 AU Optronics AUO235C B116XAT, IPS, 11.6", 1366x768 | |
|---|---|---|---|---|---|---|
| Display | -44% | -2% | -37% | -39% | -30% | |
| Display P3 Coverage (%) | 64.8 | 35.75 -45% | 64.4 -1% | 40.42 -38% | 39.03 -40% | 44.96 -31% |
| sRGB Coverage (%) | 95.1 | 53.8 -43% | 92.5 -3% | 60.8 -36% | 58.7 -38% | 67.3 -29% |
| AdobeRGB 1998 Coverage (%) | 66.2 | 36.94 -44% | 65.7 -1% | 41.76 -37% | 40.33 -39% | 46.49 -30% |
| Response Times | 30% | -9% | 12% | -34% | -4% | |
| Response Time Grey 50% / Grey 80% * (ms) | 38.4 ? | 41 ? -7% | 42 ? -9% | 50 ? -30% | 72.8 ? -90% | 40 ? -4% |
| Response Time Black / White * (ms) | 29.6 ? | 10 ? 66% | 32 ? -8% | 14 ? 53% | 22.8 ? 23% | 30.4 ? -3% |
| PWM Frequency (Hz) | 500 ? | 200 ? | 200 ? | |||
| Screen | -25% | 21% | -28% | -32% | 49% | |
| Brightness middle (cd/m²) | 194.6 | 235 21% | 304 56% | 224 15% | 266.2 37% | 291 50% |
| Brightness (cd/m²) | 193 | 227 18% | 267 38% | 213 10% | 251 30% | 284 47% |
| Brightness Distribution (%) | 88 | 93 6% | 77 -12% | 80 -9% | 90 2% | 92 5% |
| Black Level * (cd/m²) | 0.35 | 0.44 -26% | 0.28 20% | 0.52 -49% | 0.67 -91% | 0.16 54% |
| Contrast (:1) | 556 | 534 -4% | 1086 95% | 431 -22% | 397 -29% | 1819 227% |
| Colorchecker dE 2000 * | 8 | 11.73 -47% | 7.28 9% | 11.64 -46% | 12.4 -55% | 3.4 57% |
| Colorchecker dE 2000 max. * | 13.71 | 18.8 -37% | 12.65 8% | 20.8 -52% | 24.5 -79% | 9.6 30% |
| Colorchecker dE 2000 calibrated * | 2.11 | 3.73 -77% | 1.89 10% | |||
| Greyscale dE 2000 * | 9 | 12.64 -40% | 8.34 7% | 13.4 -49% | 14.4 -60% | 1.8 80% |
| Gamma | 2.12 104% | 2.61 84% | 2.33 94% | 2.57 86% | 2.16 102% | 2.14 103% |
| CCT | 9539 68% | 14819 44% | 9038 72% | 15186 43% | 19436 33% | 6544 99% |
| Color Space (Percent of AdobeRGB 1998) (%) | 60.9 | 34 -44% | 60 -1% | 38 -38% | 37 -39% | 42.8 -30% |
| Color Space (Percent of sRGB) (%) | 94.8 | 54 -43% | 92 -3% | 61 -36% | 59 -38% | 67 -29% |
| Total Average (Program / Settings) | -13% /
-22% | 3% /
13% | -18% /
-24% | -35% /
-34% | 5% /
26% |
* ... smaller is better
Display Response Times
| ↔ Response Time Black to White | ||
|---|---|---|
| 29.6 ms ... rise ↗ and fall ↘ combined | ↗ 18.4 ms rise | 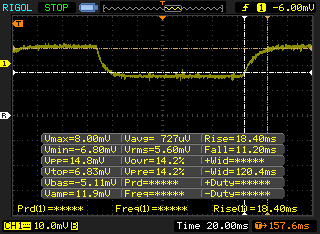 |
| ↘ 11.2 ms fall | ||
| The screen shows relatively slow response rates in our tests and may be too slow for gamers. In comparison, all tested devices range from 0.1 (minimum) to 240 (maximum) ms. » 79 % of all devices are better. This means that the measured response time is worse than the average of all tested devices (19.8 ms). | ||
| ↔ Response Time 50% Grey to 80% Grey | ||
| 38.4 ms ... rise ↗ and fall ↘ combined | ↗ 19.6 ms rise | 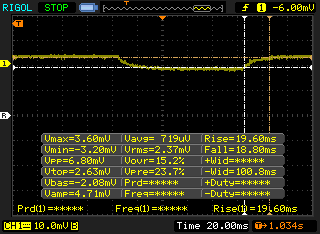 |
| ↘ 18.8 ms fall | ||
| The screen shows slow response rates in our tests and will be unsatisfactory for gamers. In comparison, all tested devices range from 0.165 (minimum) to 636 (maximum) ms. » 58 % of all devices are better. This means that the measured response time is worse than the average of all tested devices (30.9 ms). | ||
Screen Flickering / PWM (Pulse-Width Modulation)
| Screen flickering / PWM detected | 500 Hz | ≤ 25 % brightness setting | 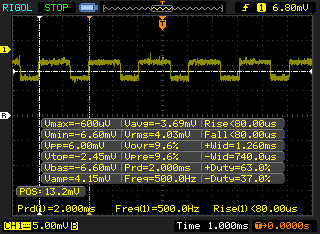 |
The display backlight flickers at 500 Hz (worst case, e.g., utilizing PWM) Flickering detected at a brightness setting of 25 % and below. There should be no flickering or PWM above this brightness setting. The frequency of 500 Hz is relatively high, so most users sensitive to PWM should not notice any flickering. However, there are reports that some users are still sensitive to PWM at 500 Hz and above, so be aware. In comparison: 52 % of all tested devices do not use PWM to dim the display. If PWM was detected, an average of 7741 (minimum: 5 - maximum: 343500) Hz was measured. | |||
Performance
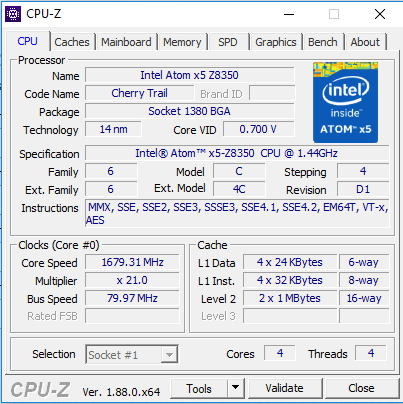
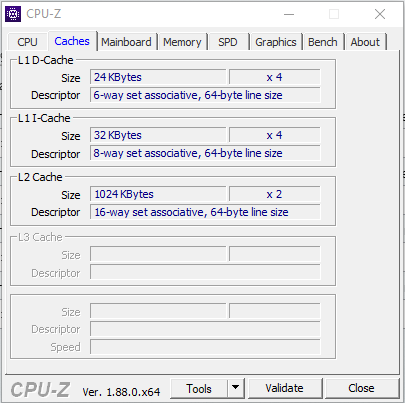
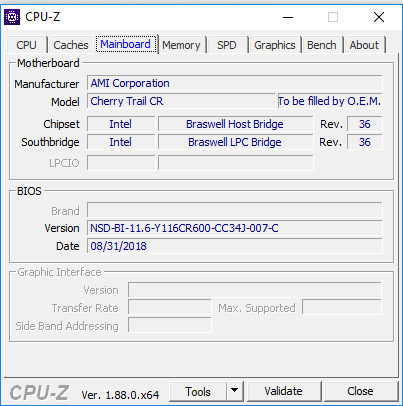
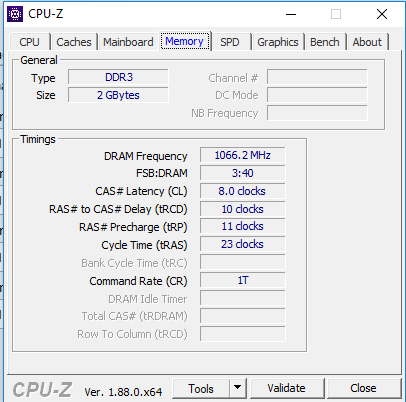
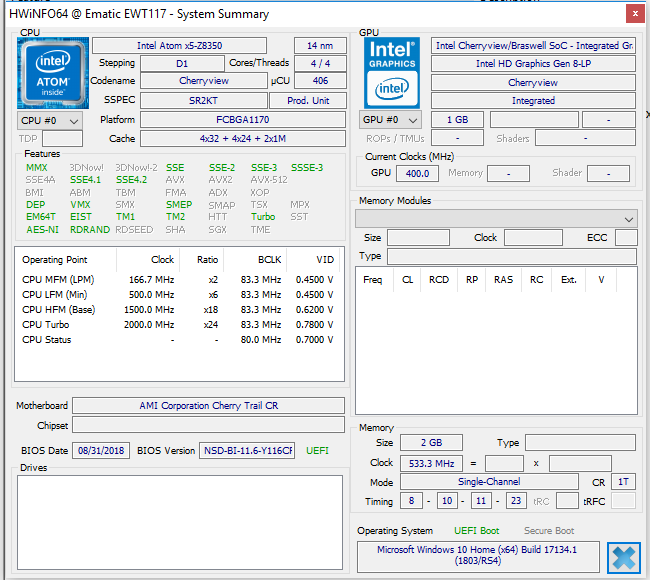
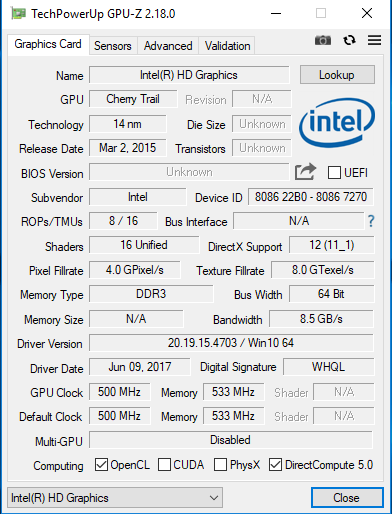
Processor
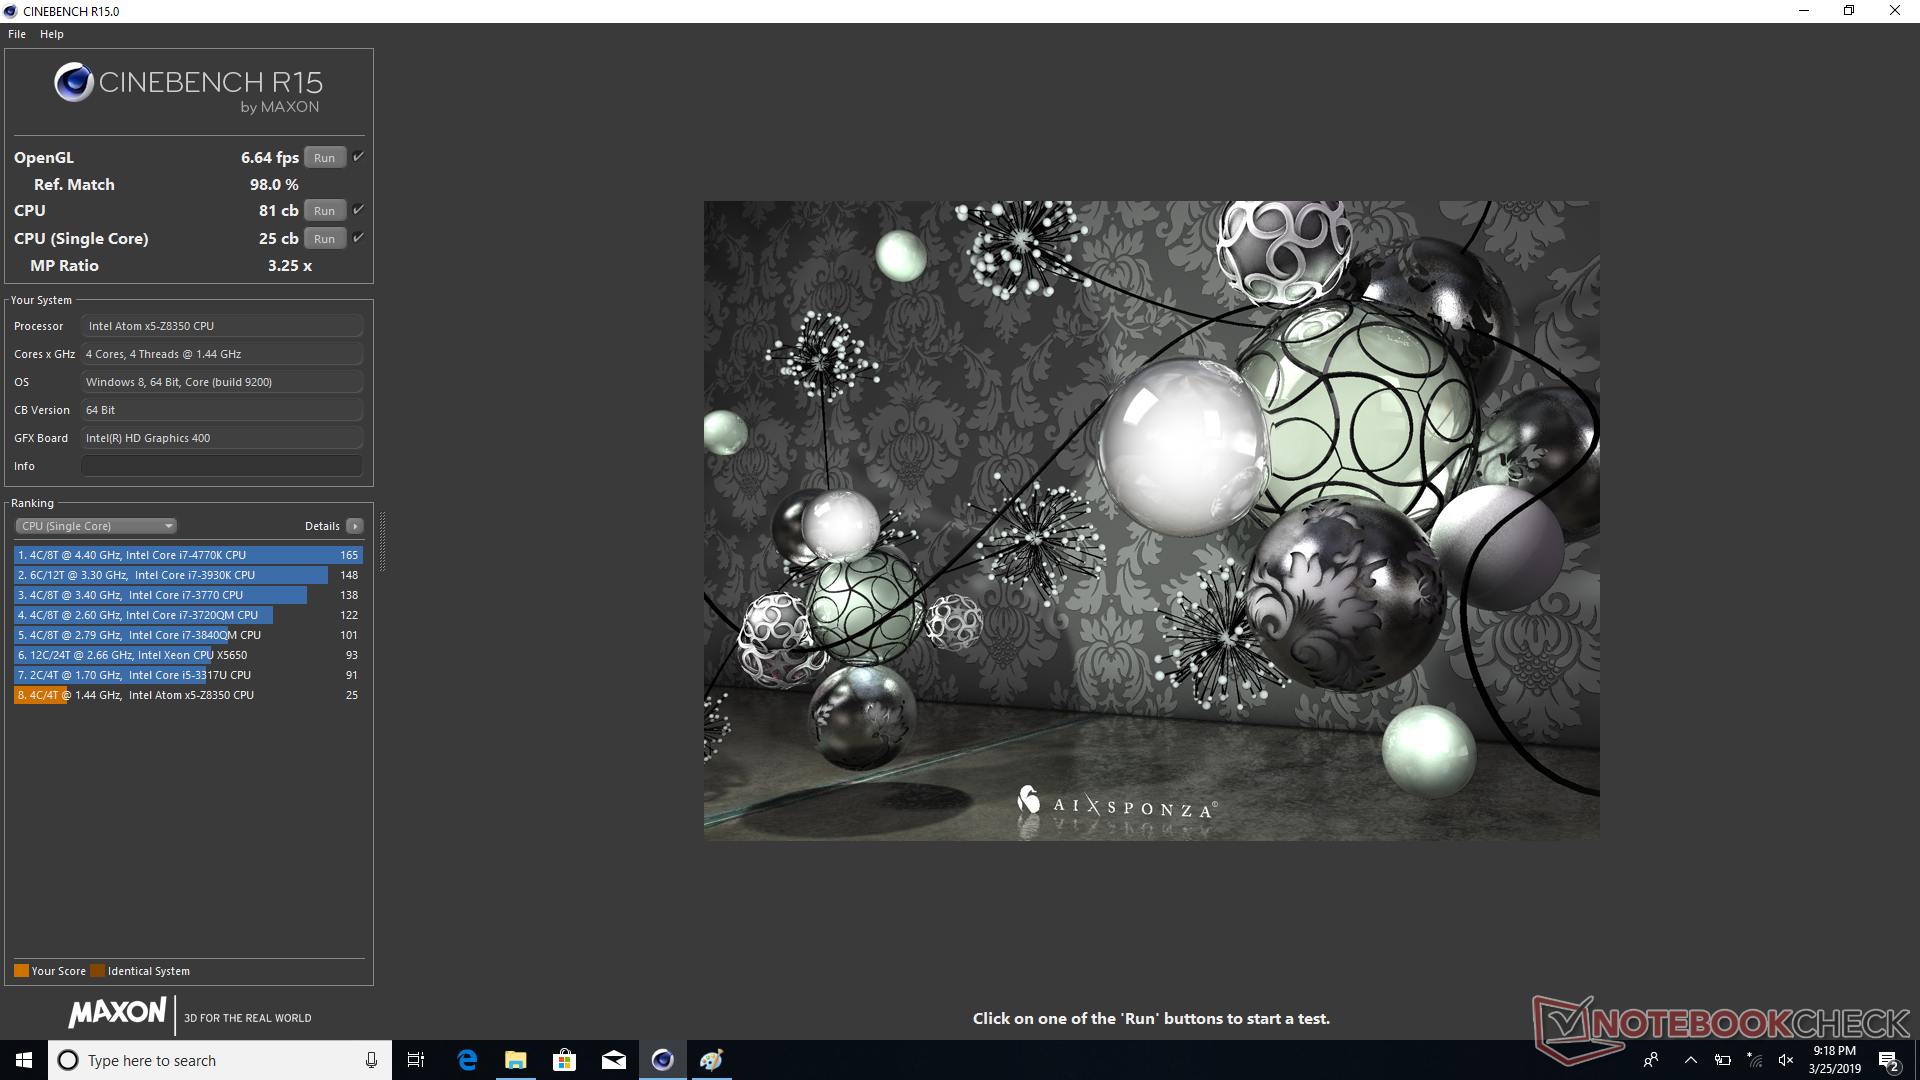
| Cinebench R15 | |
| CPU Single 64Bit | |
| Lenovo IdeaPad 330-15ARR-81D2005JGE | |
| Dell Latitude 13 7370 | |
| Apple MacBook 12 (Early 2015) 1.1 GHz | |
| Asus Zenbook UX360CA-FC060T | |
| Lenovo Yoga 330-11IGM | |
| Dell Latitude 3189 | |
| Lenovo Ideapad 120s-11IAP | |
| Dell Venue 8 Pro 5855 | |
| Average Intel Atom x5-Z8350 (25 - 31, n=9) | |
| Ematic EWT117 | |
| CPU Multi 64Bit | |
| Lenovo IdeaPad 330-15ARR-81D2005JGE | |
| Lenovo Yoga 330-11IGM | |
| Apple MacBook 12 (Early 2015) 1.1 GHz | |
| Asus Zenbook UX360CA-FC060T | |
| Dell Latitude 13 7370 | |
| Dell Latitude 3189 | |
| Average Intel Atom x5-Z8350 (88 - 101, n=10) | |
| Ematic EWT117 | |
| Lenovo Ideapad 120s-11IAP | |
| Dell Venue 8 Pro 5855 | |
System Performance
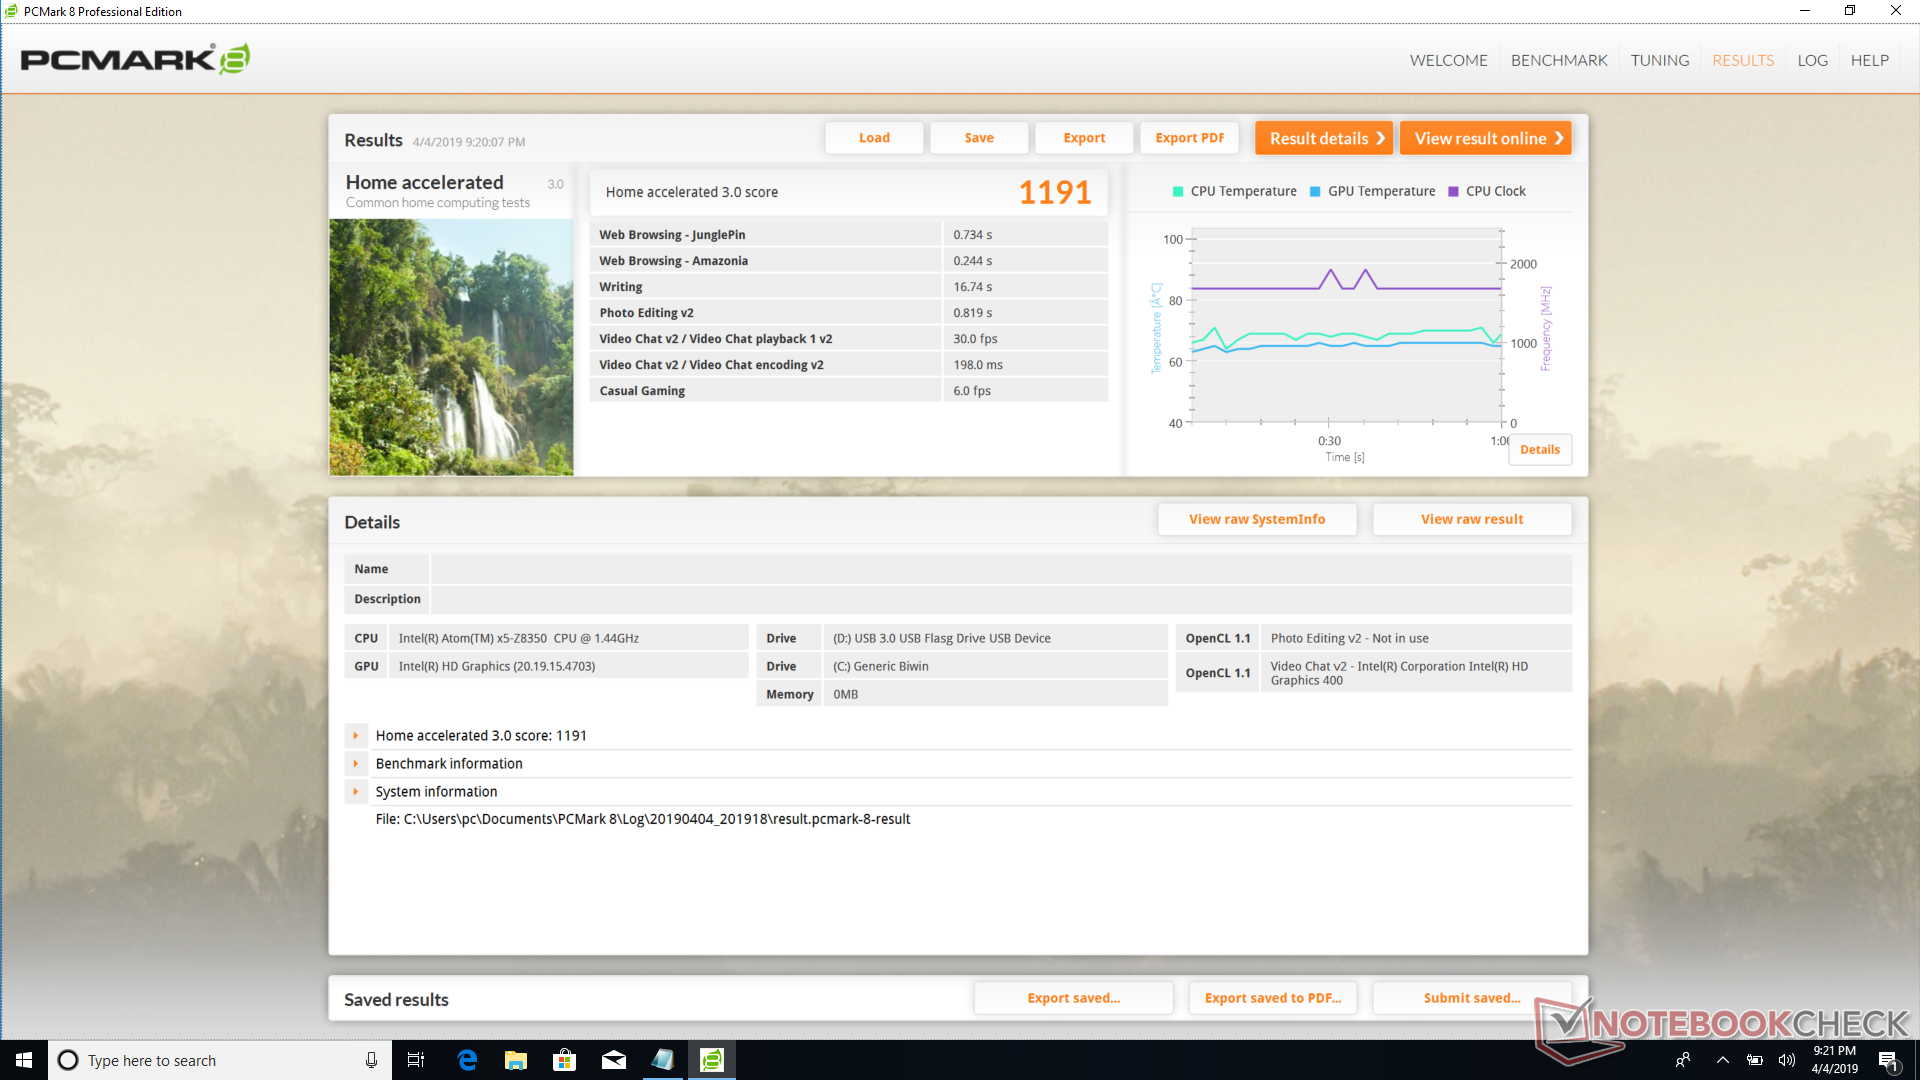
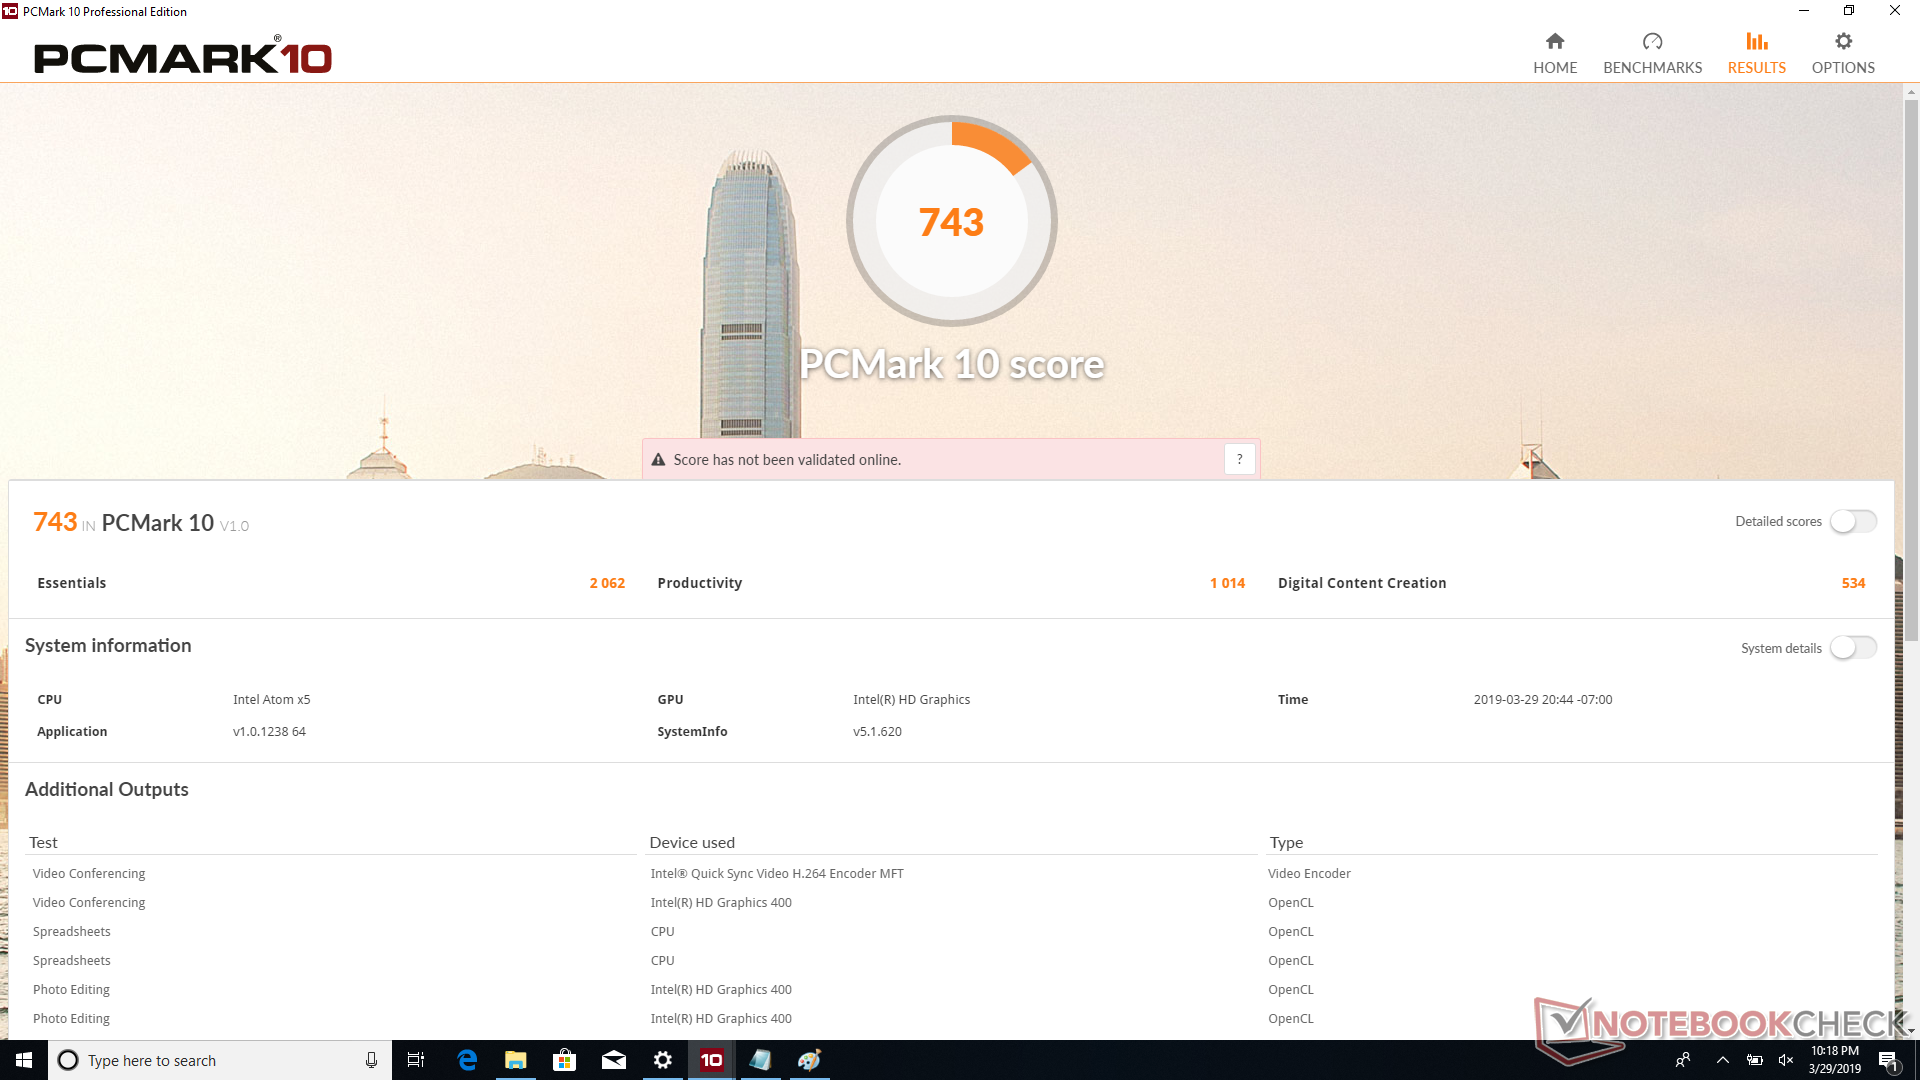
| PCMark 8 Home Score Accelerated v2 | 1191 points | |
| PCMark 10 Score | 743 points | |
Help | ||
Storage Devices
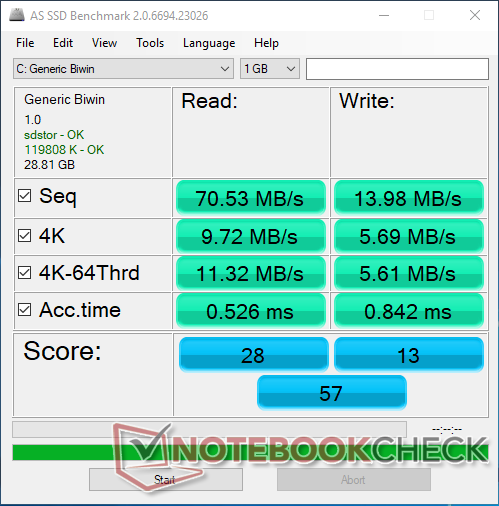
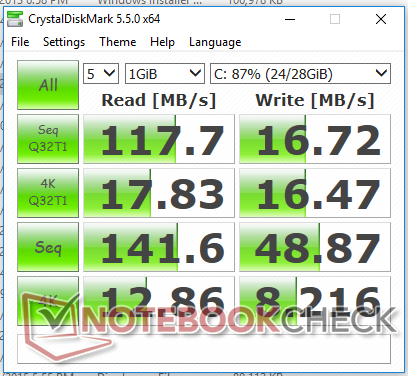
| Ematic EWT117 32 GB eMMC Flash | Asus E203MA-FD825TS SanDisk DA4064 | Trekstor Yourbook C11B 64 GB eMMC Flash | Lenovo Yoga 330-11IGM 128 GB eMMC Flash | Lenovo Ideapad 120s-11IAP 64 GB eMMC Flash | |
|---|---|---|---|---|---|
| CrystalDiskMark 5.2 / 6 | 274% | 105% | 131% | 87% | |
| Write 4K (MB/s) | 8.216 | 38.28 366% | 9.498 16% | 14.55 77% | 12.19 48% |
| Read 4K (MB/s) | 12.86 | 12.14 -6% | 4.941 -62% | 13.4 4% | 6.61 -49% |
| Write Seq (MB/s) | 48.87 | 220.2 351% | 114.3 134% | 110.1 125% | 108.2 121% |
| Read Seq (MB/s) | 141.6 | 262 85% | 262.8 86% | 294.9 108% | 167.1 18% |
| Write 4K Q32T1 (MB/s) | 16.47 | 45.72 178% | 15.3 -7% | 14.17 -14% | 15.38 -7% |
| Read 4K Q32T1 (MB/s) | 17.83 | 61 242% | 31.59 77% | 36.92 107% | 31.28 75% |
| Write Seq Q32T1 (MB/s) | 16.72 | 167.1 899% | 111.8 569% | 106.4 536% | 96.2 475% |
| Read Seq Q32T1 (MB/s) | 117.7 | 211.5 80% | 151.5 29% | 238.2 102% | 134.1 14% |

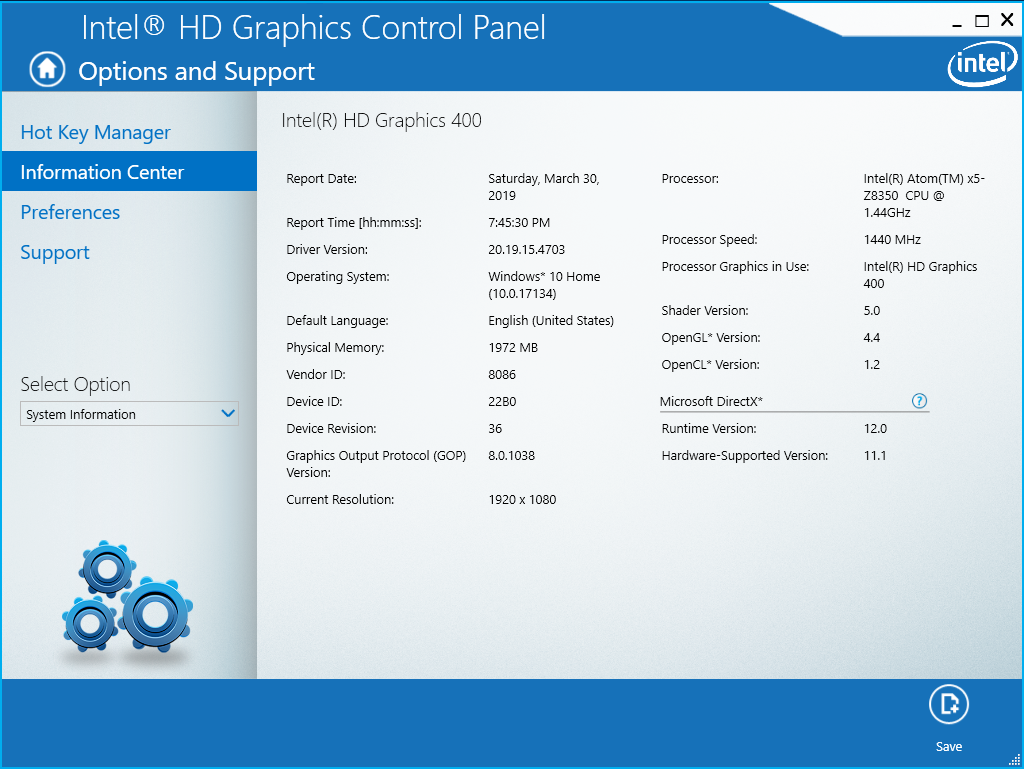
GPU Performance
| 3DMark | |
| 1280x720 Cloud Gate Standard Graphics | |
| Apple MacBook 12 (Early 2016) 1.1 GHz | |
| Asus Zenbook UX360CA-FC060T | |
| Dell Latitude 3189 | |
| Dell Latitude 13 7370 | |
| Lenovo Yoga 330-11IGM | |
| Lenovo Ideapad 120s-11IAP | |
| Average Intel HD Graphics (Cherry Trail) (1537 - 2272, n=8) | |
| Dell Venue 8 Pro 5855 | |
| 1920x1080 Fire Strike Graphics | |
| Apple MacBook 12 (Early 2016) 1.1 GHz | |
| Dell Latitude 3189 | |
| Dell Latitude 13 7370 | |
| Lenovo Yoga 330-11IGM | |
| Lenovo Ideapad 120s-11IAP | |
| Average Intel HD Graphics (Cherry Trail) (193 - 281, n=3) | |
| 1920x1080 Ice Storm Extreme Graphics | |
| Dell Latitude 13 7370 | |
| Dell Latitude 3189 | |
| 2560x1440 Time Spy Graphics | |
| Dell Latitude 3189 | |
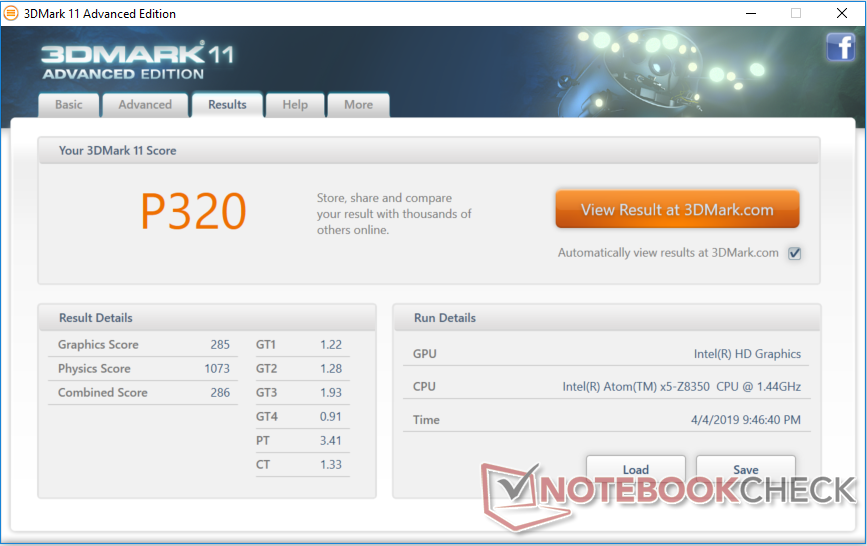
| 3DMark 11 Performance | 320 points | |
Help | ||
Emissions
Temperature
Stress Test
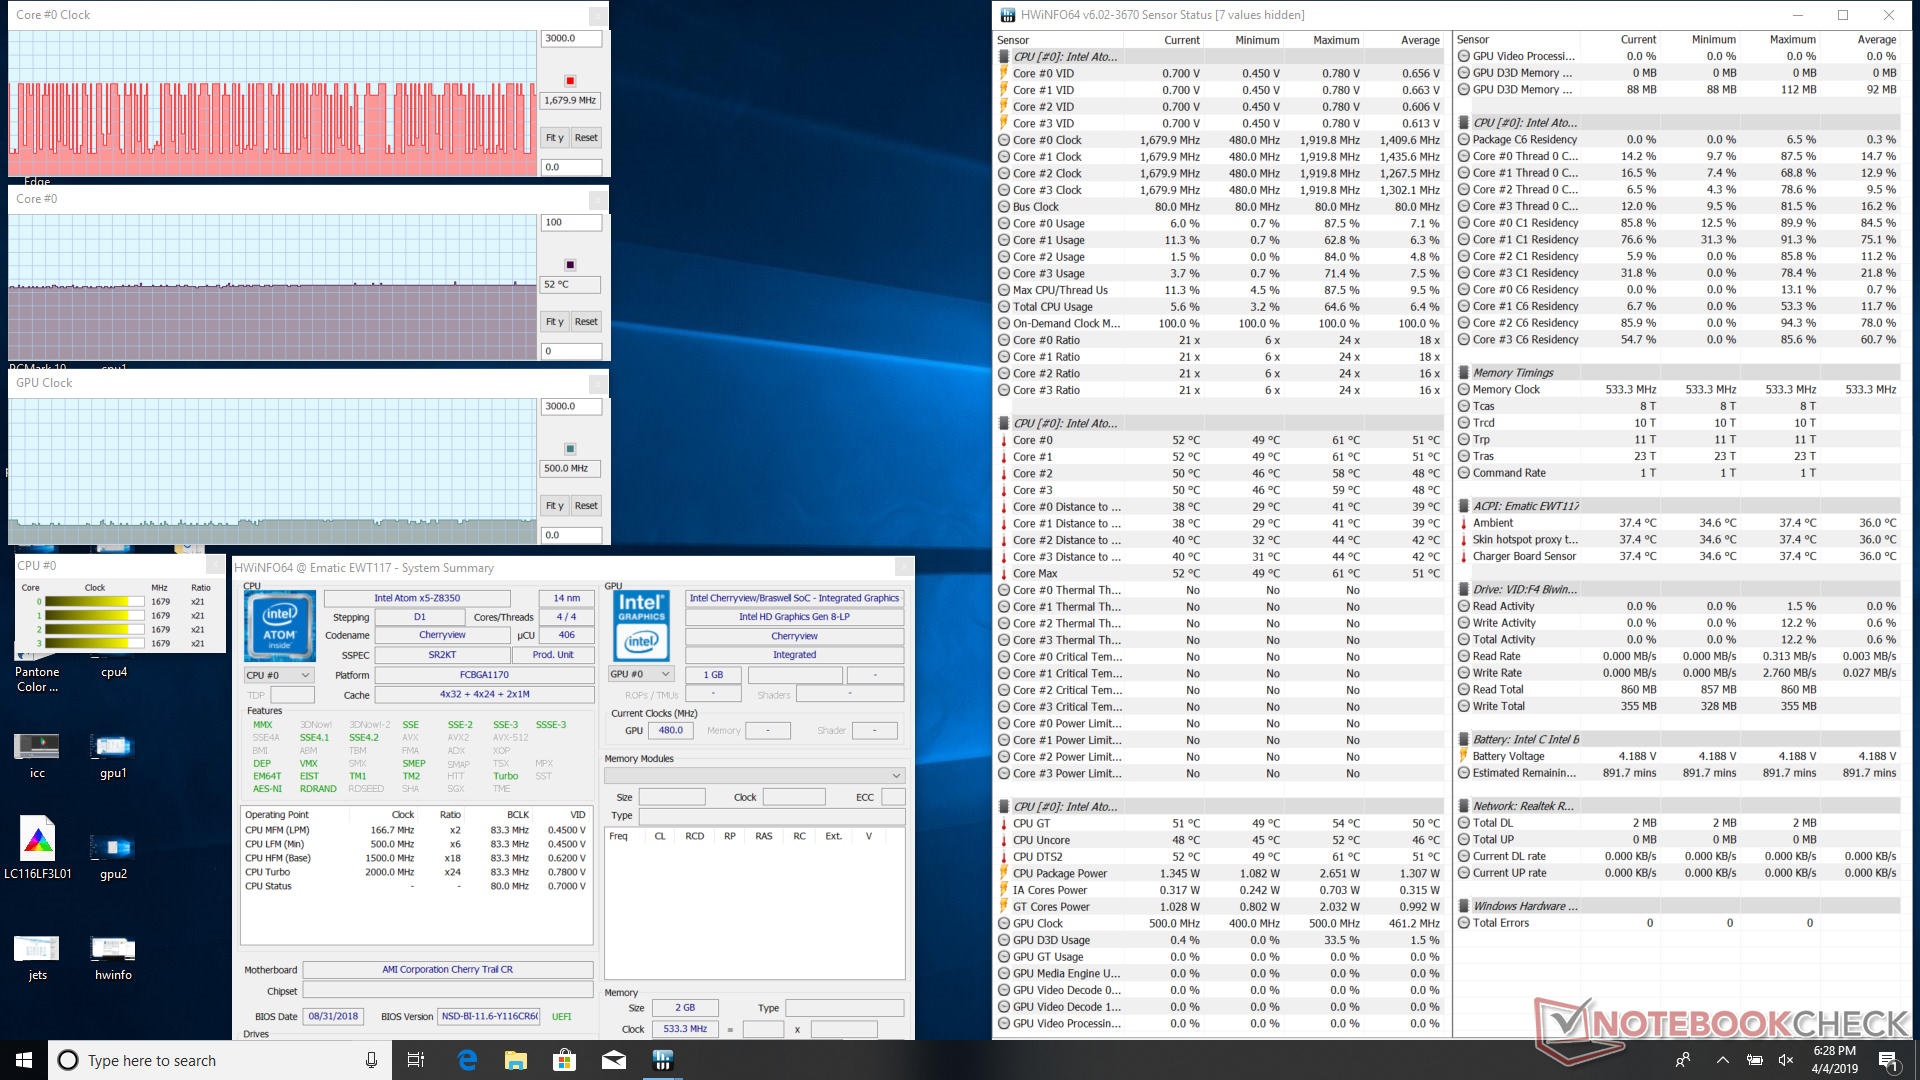
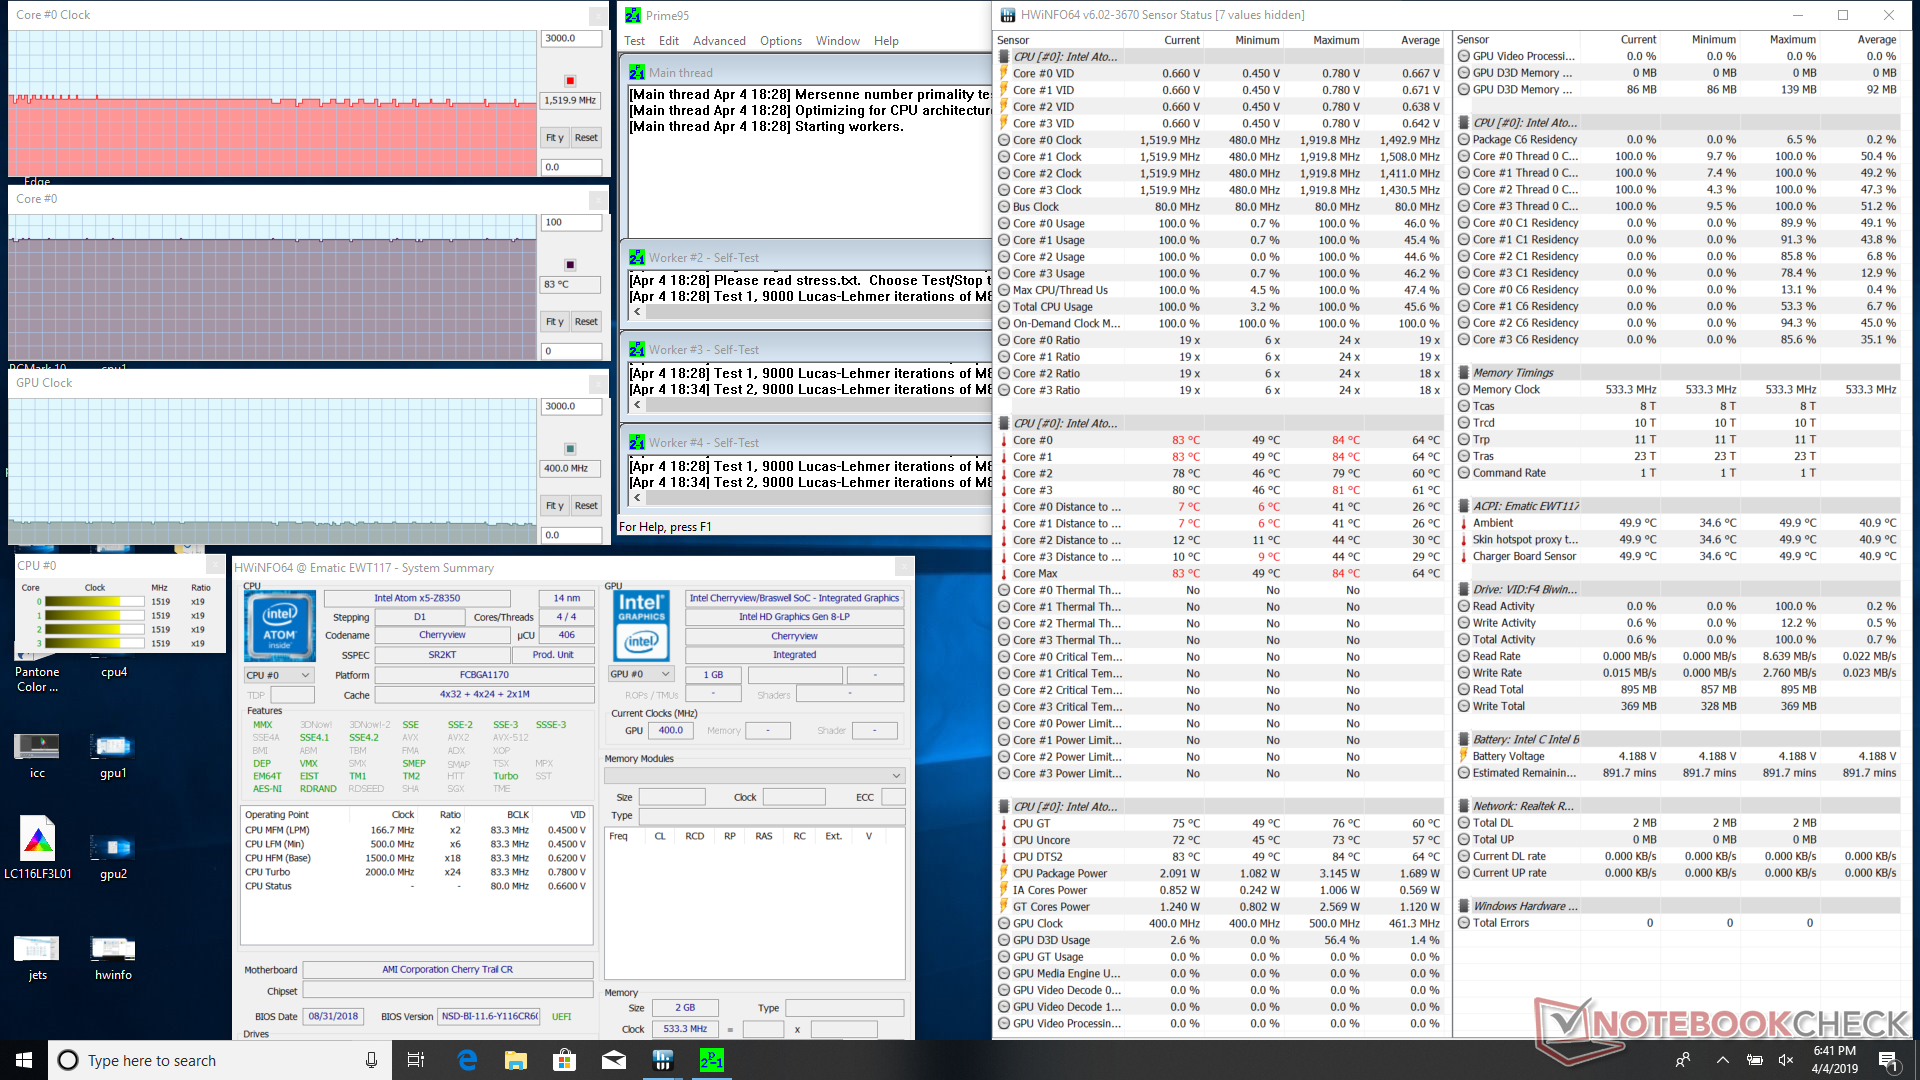
| CPU Clock (GHz) | GPU Clock (MHz) | Average CPU Temperature (°C) | |
| System Idle | -- | -- | 52 |
| Prime95 Stress | 1.5 | -- | 83 |
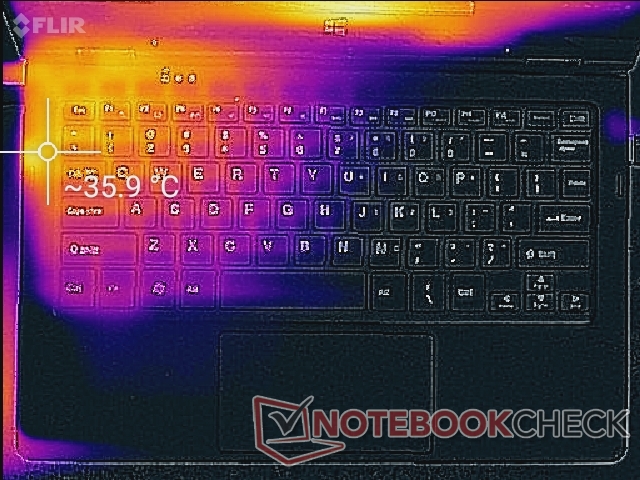
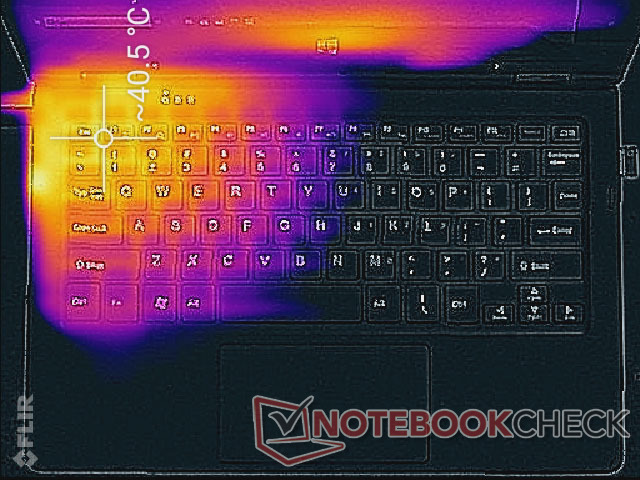
(±) The maximum temperature on the upper side is 42 °C / 108 F, compared to the average of 35.9 °C / 97 F, ranging from 21.4 to 59 °C for the class Subnotebook.
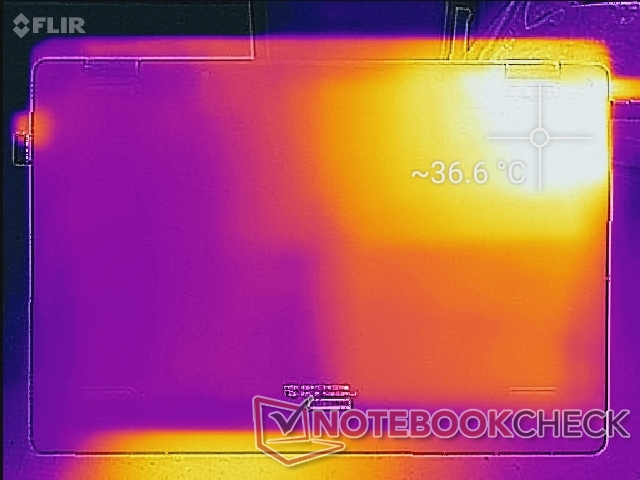
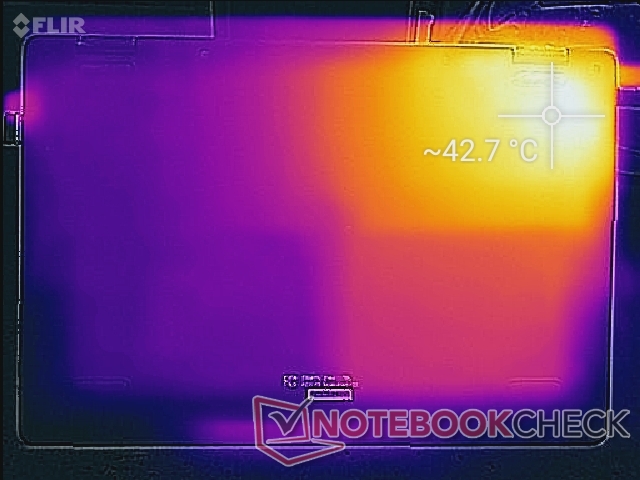
(±) The bottom heats up to a maximum of 42.8 °C / 109 F, compared to the average of 39.2 °C / 103 F
(+) In idle usage, the average temperature for the upper side is 25.9 °C / 79 F, compared to the device average of 30.8 °C / 87 F.
(+) The palmrests and touchpad are cooler than skin temperature with a maximum of 26.2 °C / 79.2 F and are therefore cool to the touch.
(±) The average temperature of the palmrest area of similar devices was 28.2 °C / 82.8 F (+2 °C / 3.6 F).
Speakers

Ematic EWT117 audio analysis
(±) | speaker loudness is average but good (78.4 dB)
Bass 100 - 315 Hz
(-) | nearly no bass - on average 20.6% lower than median
(+) | bass is linear (2.4% delta to prev. frequency)
Mids 400 - 2000 Hz
(±) | reduced mids - on average 7.1% lower than median
(±) | linearity of mids is average (10% delta to prev. frequency)
Highs 2 - 16 kHz
(±) | higher highs - on average 6.4% higher than median
(±) | linearity of highs is average (10.4% delta to prev. frequency)
Overall 100 - 16.000 Hz
(±) | linearity of overall sound is average (28.1% difference to median)
Compared to same class
» 89% of all tested devices in this class were better, 3% similar, 8% worse
» The best had a delta of 5%, average was 18%, worst was 53%
Compared to all devices tested
» 85% of all tested devices were better, 3% similar, 12% worse
» The best had a delta of 4%, average was 23%, worst was 134%
Apple MacBook 12 (Early 2016) 1.1 GHz audio analysis
(+) | speakers can play relatively loud (83.6 dB)
Bass 100 - 315 Hz
(±) | reduced bass - on average 11.3% lower than median
(±) | linearity of bass is average (14.2% delta to prev. frequency)
Mids 400 - 2000 Hz
(+) | balanced mids - only 2.4% away from median
(+) | mids are linear (5.5% delta to prev. frequency)
Highs 2 - 16 kHz
(+) | balanced highs - only 2% away from median
(+) | highs are linear (4.5% delta to prev. frequency)
Overall 100 - 16.000 Hz
(+) | overall sound is linear (10.2% difference to median)
Compared to same class
» 7% of all tested devices in this class were better, 2% similar, 90% worse
» The best had a delta of 5%, average was 18%, worst was 53%
Compared to all devices tested
» 5% of all tested devices were better, 1% similar, 94% worse
» The best had a delta of 4%, average was 23%, worst was 134%
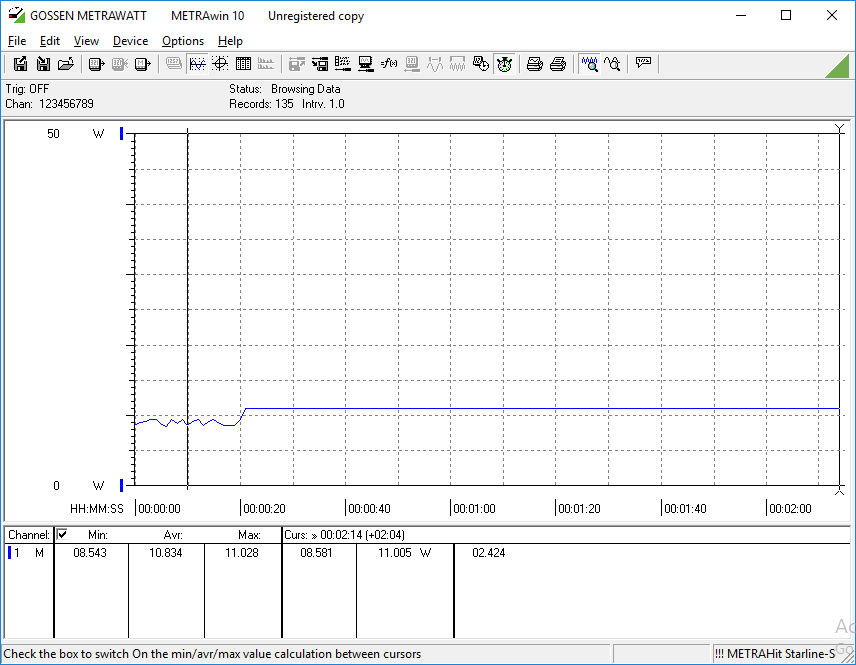
Energy Management
Power Consumption
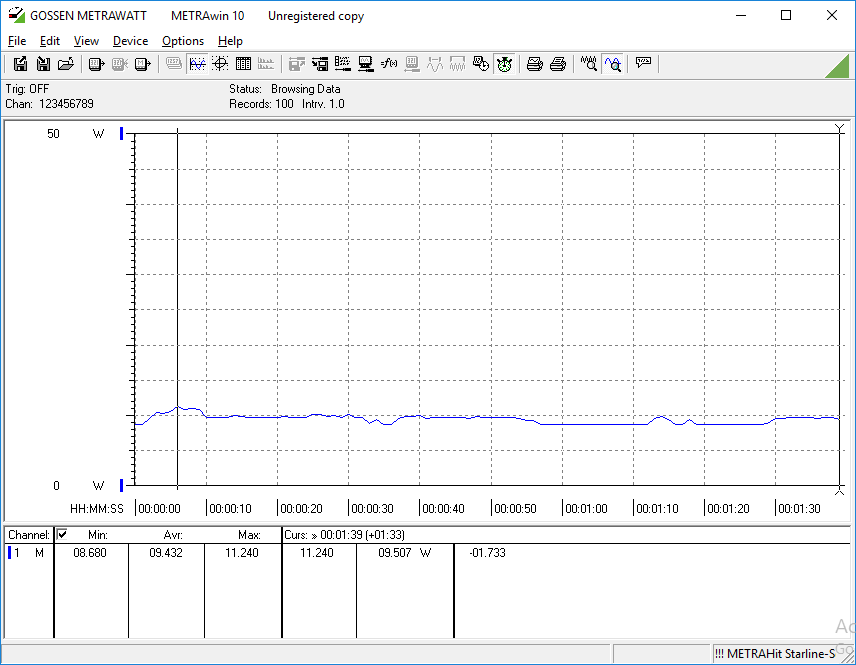
| Off / Standby | |
| Idle | |
| Load |
|
Key:
min: | |
| Ematic EWT117 Z8350, HD Graphics (Cherry Trail), 32 GB eMMC Flash, IPS, 1920x1080, 11.6" | Asus E203MA-FD825TS Pentium N5000, UHD Graphics 605, SanDisk DA4064, TN LED, 1366x768, 11.6" | Trekstor Yourbook C11B Celeron N3350, HD Graphics 500, 64 GB eMMC Flash, IPS, 1920x1080, 11.6" | Lenovo Yoga 330-11IGM Pentium N5000, UHD Graphics 605, 128 GB eMMC Flash, TN LED, 1366x768, 11.6" | Lenovo Ideapad 120s-11IAP Celeron N3350, HD Graphics 500, 64 GB eMMC Flash, TN LED, 1366x768, 11.6" | Apple MacBook 12 (Early 2016) 1.1 GHz 6Y30, HD Graphics 515, Apple SSD AP0256, IPS, 2304x1440, 12" | |
|---|---|---|---|---|---|---|
| Power Consumption | 10% | -18% | -8% | 15% | -22% | |
| Idle Minimum * (Watt) | 4.2 | 1.9 55% | 3.2 24% | 2.3 45% | 2.8 33% | 2.7 36% |
| Idle Average * (Watt) | 7 | 3.5 50% | 6.1 13% | 4.2 40% | 4.2 40% | 2.7 61% |
| Idle Maximum * (Watt) | 8.5 | 3.9 54% | 7 18% | 5.4 36% | 5.1 40% | 7.2 15% |
| Load Average * (Watt) | 9.4 | 12.7 -35% | 15.4 -64% | 11.8 -26% | 22 -134% | |
| Load Maximum * (Watt) | 11 | 19 -73% | 24.7 -125% | 21.4 -95% | 12.1 -10% | 20.5 -86% |
* ... smaller is better
Battery Life
| Ematic EWT117 Z8350, HD Graphics (Cherry Trail), 30.4 Wh | Asus E203MA-FD825TS Pentium N5000, UHD Graphics 605, 38 Wh | Trekstor Yourbook C11B Celeron N3350, HD Graphics 500, 36.48 Wh | Lenovo Yoga 330-11IGM Pentium N5000, UHD Graphics 605, 36 Wh | Lenovo Ideapad 120s-11IAP Celeron N3350, HD Graphics 500, 32 Wh | Apple MacBook 12 (Early 2016) 1.1 GHz 6Y30, HD Graphics 515, 41.4 Wh | |
|---|---|---|---|---|---|---|
| Battery runtime | 108% | 110% | 135% | 80% | 110% | |
| WiFi v1.3 (h) | 4 | 8.3 108% | 8.4 110% | 9.4 135% | 7.2 80% | 8.4 110% |
| Reader / Idle (h) | 15.3 | |||||
| Load (h) | 3.8 | 3.9 |
Pros
Cons
Verdict
The Ematic EWT117 is a classic example of promising too much for too little money. A fully functional Windows 10 convertible laptop with a MicroSD reader, HDMI port, and 1080p IPS touchscreen for under $180 USD is still too good to be true without heavy drawbacks. In this case, the system is extraordinarily slow due to both its Atom CPU and very poor SSD performance. Even simple actions like word processing or video playback - which the Ematic is supposed to excel at - move at a snail's pace.
Our unit exhibited some hardware issues as well. The trackpad would frequently cause the mouse cursor to jump unexpectedly and our MicroSD card would sometimes become stuck in the spring-loaded MicroSD reader.
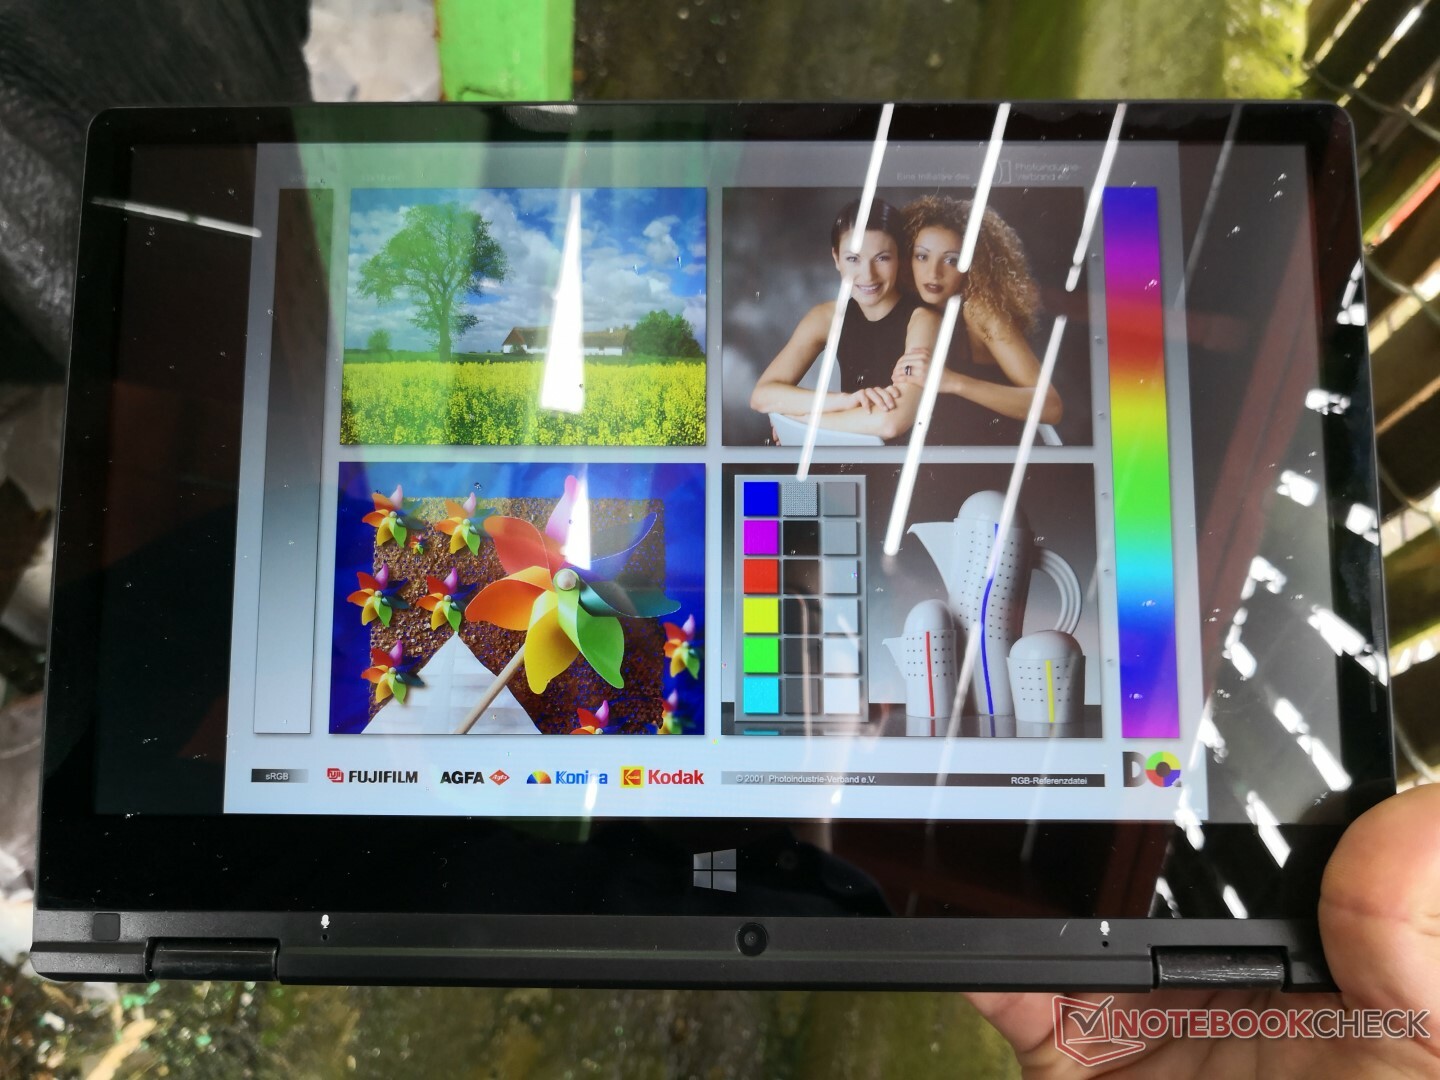
The best aspect of the Ematic is its 1080p IPS touchscreen which covers a surprisingly wide range of colors (95 percent sRGB) considering the price. Unfortunately, this means little since the rest of the system is subpar.
We're not asking for very much from a $200 touchscreen netbook. However, when even a budget $200 Android tablet can browse, type, and play videos faster than the Ematic, then it becomes difficult to recommend the EWT117 to most home users.
Ematic EWT117
- 04/06/2019 v6 (old)
Allen Ngo
Price comparison
