NVIDIA GeForce GTX 1050 Ti (Desktop) vs NVIDIA GeForce RTX 2070 Super Max-Q
NVIDIA GeForce GTX 1050 Ti (Desktop) ► remove from comparison
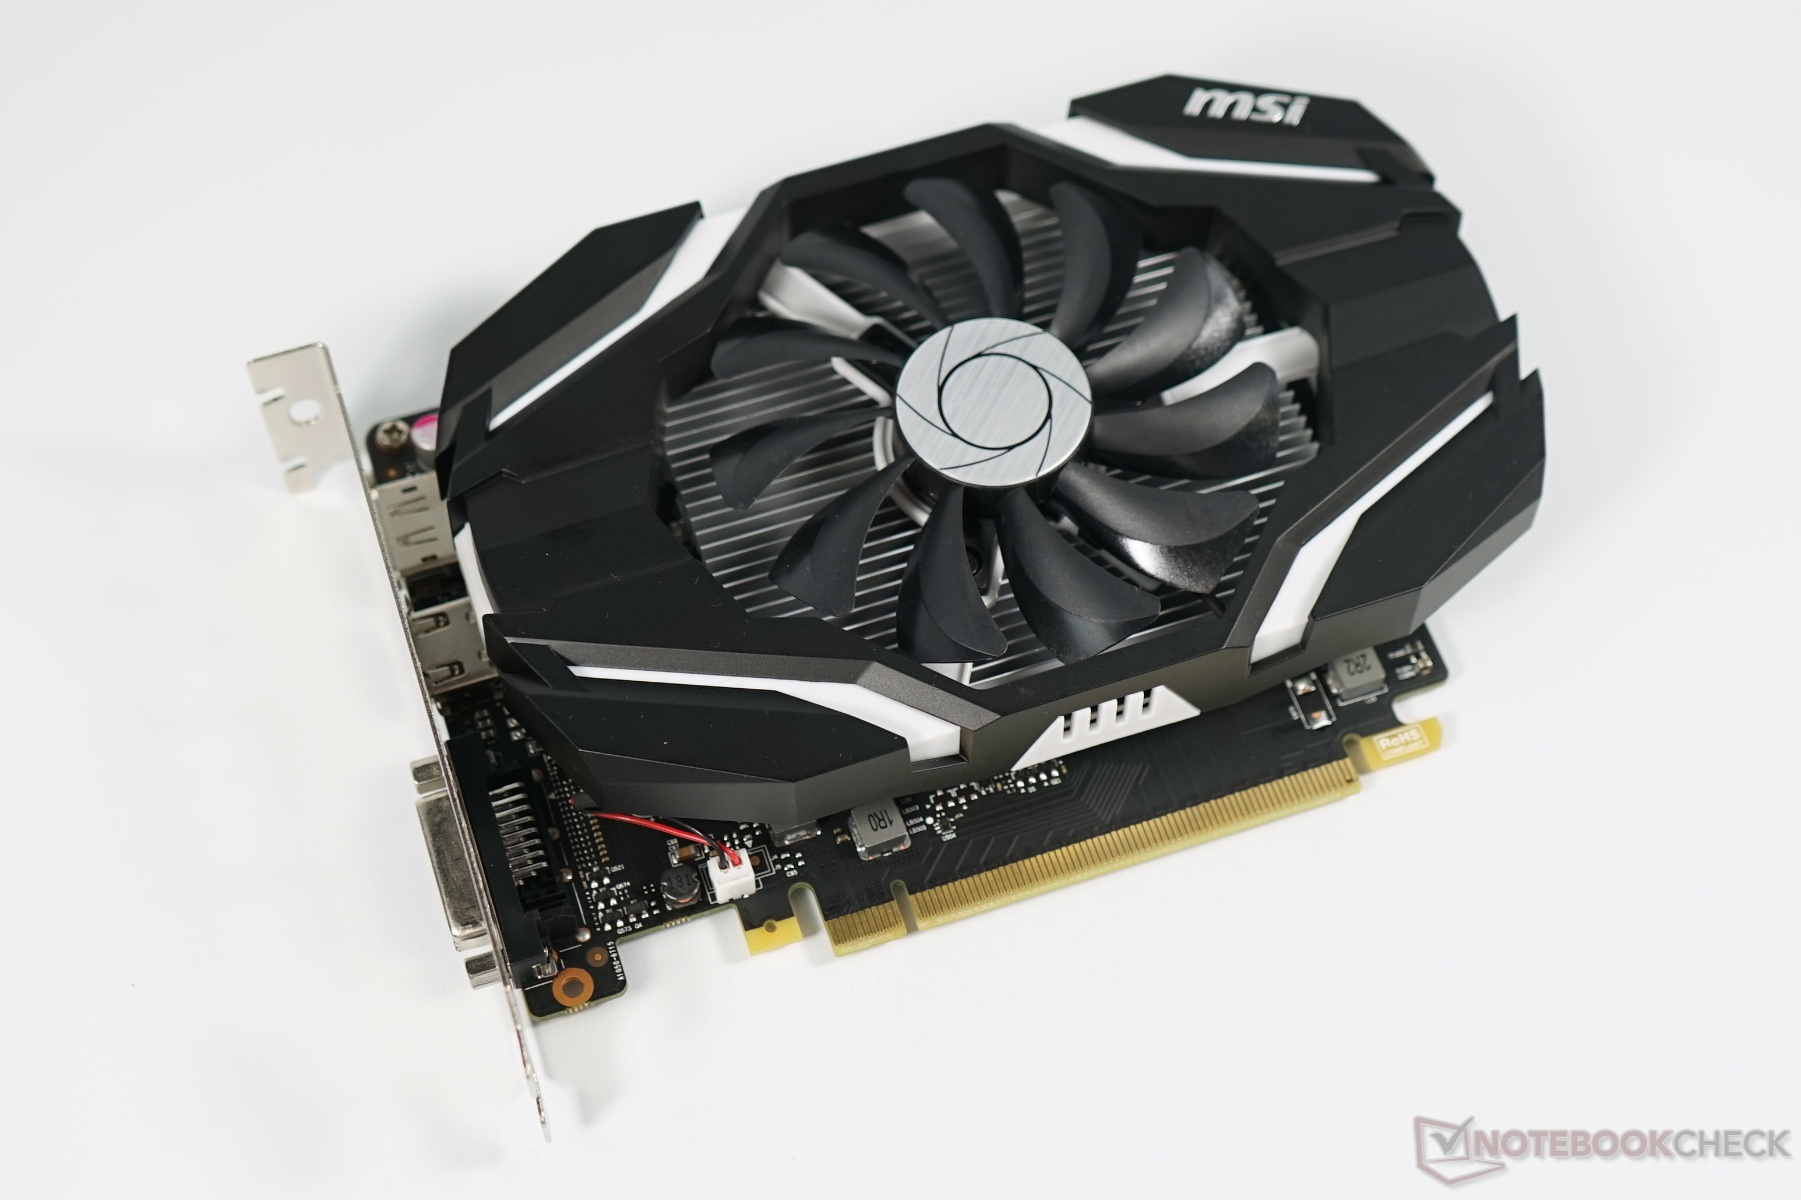
The Nvidia GeForce GTX 1050 Ti (N17P-G1) for desktops is an entry level gaming graphics card that was announced late 2016. It is based on the GP107 chip using the Pascal architecture and manufactured in 14nm FinFET at Samsung (the bigger Pascal chips are manufactured in 16nm at TSMC). Usually it is equipped with 4 GB GDDR5 memory with a 7 Gbps data rate. The mobile GTX 1050 Ti version should be announced later (beginning of 2017) and feature similar specs.
The performance of the GTX 1050 lies between the Radeon RX 460 and the RX 470 on a similar level of the old GeForce GTX 960 (or 970M ). Therefore, the card is most suited for 1080p gaming at high detail settings (but not maximum settings).
See our extensive review of the MSI GeForce GTX 1050 Ti for more information on power consumption, benchmarks and noise level.
NVIDIA GeForce RTX 2070 Super Max-Q ► remove from comparison
The NVIDIA GeForce RTX 2070 Super with Max-Q design is the power saving variant of the mobile GeForce RTX 2070 Super with reduced clock speeds, performance and of course power consumption. It is intended for thin gaming laptops. It is based on the same TU104-725-A1 chip with 2,560 shaders, 8 GB GDDR6 memory and a 256 Bit memory bus. Currently we know of three variants with a TGP of 80, 85 and 90 Watt, base clock speeds of 930, 1005, and 1080 MHz, and turbo clock speeds of 1155, 1230 and 1290 MHz. The mobile variant for comparison is rated at 115 W and 1140 - 1380 MHz.
With the refresh, Nvidia also reworked the Max-Q technologies for more efficiency. Low Voltage GDDR6 (lower clocked but more headroom for the GPU) and improved regulator efficiency should improve the performance per Watt. Two new optional features can also be implemented by the OEM. Max-Q Dynamic Boost is able to shift power from the CPU to the GPU on a per frame basis to increase overall performance. Furthermore, the laptop manufacturer can also implement Advanced Optimus with a dynamic display switch (hardware) to enable Optimus, G-SYNC and high refresh rate displays (up to 4K 120 Hz).
NVIDIA manufacturers the TU104 chip on a 12 nm FinFET process and includes features like Deep Learning Super Sampling (DLSS) and Real-Time Ray Tracing (RTRT), which should combine to create more realistic lighting effects than older GPUs based on the company's Pascal architecture (if the games supports it). The RTX 2070 Super Max-Q is also DisplayPort 1.4 ready, while there is also support for HDMI 2.0b, HDR, Simultaneous Multi-Projection (SMP) and H.265 video en/decoding (PlayReady 3.0).
Performance
Due to the lower clock rates, the Max-Q variant is clearly slower than the mobile RTX 2070 Super. The difference depends on the used variant, where the 90 W version is only slightly slower. Therefore, the performance should be sufficient for maximum detail settings at a QHD resolution. With raytracing enabled, you may have to reduce settings or resolution. Less demanding games can be easily played in 4k.
The power consumption of the card is between 80 - 90 Watt TGP and therefore clearly lower than the RTX 2070 Super Mobile (115 Watt).
NVIDIA GeForce GTX 1050 Ti (Desktop) NVIDIA GeForce RTX 2070 Super Max-Q GeForce RTX 2000 Series Codename N17P-G1 N18E-G2R Architecture Pascal Turing Pipelines 768 - unified 2560 - unified Core Speed 1290 - 1392 (Boost) MHz 930 - 1155 (Boost) MHz Memory Speed 7008 MHz 11000 MHz Memory Bus Width 128 Bit 256 Bit Memory Type GDDR5 GDDR6 Max. Amount of Memory 4 GB 8 GB Shared Memory no no API DirectX 12_1, OpenGL 4.5 DirectX 12_1, OpenGL 4.6 technology 16 nm 12 nm Features Multi-Projection, VR Ready, G-SYNC, Vulkan, Multi Monitor DLSS, Raytraycing, VR Ready, G-SYNC, Vulkan, Multi Monitor, 550 Watt system power recommended Date of Announcement 25.10.2016 02.04.2020 Power Consumption 80 Watt Notebook Size large
Benchmarks Performance Rating - 3DMark 11 + Fire Strike + Time Spy - GeForce RTX 2070 Super Max-Q
9.5 pt (29%)
...
NVIDIA GeForce RTX 2070 Super Max-Q
...
3DMark - 3DMark Time Spy Score
min: 2474 avg: 2568 median: 2568 (7%) max: 2662 Points
min: 7199 avg: 7605 median: 7611.5 (22%) max: 8066 Points
GPU TDP ? TDP 80 W TDP 115 W 86% 93% 100%
3DMark - 3DMark Time Spy Graphics
min: 2277 avg: 2309 median: 2308.5 (6%) max: 2340 Points
min: 7084 avg: 7445 median: 7373.5 (20%) max: 7891 Points
GPU TDP ? TDP 80 W TDP 115 W 82% 91% 100%
3DMark - 3DMark Ice Storm Unlimited Graphics
352876 Points (40%)
min: 461097 avg: 461649 median: 461648 (52%) max: 462200 Points
GPU TDP ? TDP 115 W 88% 100%
3DMark - 3DMark Cloud Gate Score
24195 Points (26%)
min: 38593 avg: 45672 median: 47119 (50%) max: 49917 Points
GPU TDP ? TDP 115 W 100% 93%
3DMark - 3DMark Cloud Gate Graphics
50939 Points (13%)
min: 65295 avg: 117307 median: 126747 (33%) max: 134954 Points
GPU TDP ? TDP 115 W 84% 100%
3DMark - 3DMark Fire Strike Standard Score
min: 6644 avg: 6783 median: 6816 (12%) max: 6888 Points
min: 16736 avg: 18097 median: 18395 (32%) max: 18947 Points
GPU TDP ? TDP 80 W TDP 115 W 81% 91% 100%
3DMark - 3DMark Fire Strike Standard Graphics
min: 7293 avg: 7491 median: 7485 (8%) max: 7696 Points
min: 18559 avg: 20277 median: 20872.5 (24%) max: 21446 Points
GPU TDP ? TDP 80 W TDP 115 W 78% 87% 100%
3DMark - 3DMark Ice Storm Graphics
66977 Points (8%)
3DMark - 3DMark Wild Life Unlimited
48041 Points (24%)
3DMark 11 - 3DM11 Performance Score
min: 9151 avg: 9481 median: 9480.5 (13%) max: 9810 Points
min: 20666 avg: 23000 median: 23755.5 (33%) max: 24383 Points
GPU TDP ? TDP 80 W TDP 115 W 95% 95% 100%
3DMark 11 - 3DM11 Performance GPU
min: 9212 avg: 9453 median: 9453 (8%) max: 9694 Points
min: 24244 avg: 27104 median: 27724 (24%) max: 28900 Points
GPU TDP ? TDP 80 W TDP 115 W 88% 89% 100%
3DMark Vantage + NVIDIA GeForce RTX 2070 Super Max-Q 3DMark Vantage - 3DM Vant. Perf. total
65101 Points (19%)
3DM Vant. Perf. GPU no PhysX + NVIDIA GeForce RTX 2070 Super Max-Q 3DMark Vantage - 3DM Vant. Perf. GPU no PhysX
69136 Points (39%)
3DMark 06 3DMark 06 - Standard 1280x1024 + NVIDIA GeForce GTX 1050 Ti (Desktop)
min: 36277 avg: 38484 median: 38483.5 (50%) max: 40690 Points
3DMark 06 - Standard 1280x1024 + NVIDIA GeForce RTX 2070 Super Max-Q
43406 Points (57%)
Unigine Valley 1.0 - Unigine Valley 1.0 DX
40.7 fps (13%)
SPECviewperf 13 specvp13 sw-04 + NVIDIA GeForce RTX 2070 Super Max-Q SPECviewperf 13 - specvp13 sw-04
min: 80.2 avg: 85.8 median: 85.8 (23%) max: 91.3 fps
GPU TDP ? TDP 80 W 100% 88%
specvp13 snx-03 + NVIDIA GeForce RTX 2070 Super Max-Q SPECviewperf 13 - specvp13 snx-03
min: 19.65 avg: 19.9 median: 19.9 (2%) max: 20.06 fps
GPU TDP ? TDP 80 W 100% 98%
specvp13 showcase-02 + NVIDIA GeForce RTX 2070 Super Max-Q SPECviewperf 13 - specvp13 showcase-02
min: 94.1 avg: 95.6 median: 95.6 (21%) max: 97 fps
GPU TDP ? TDP 80 W 97% 100%
specvp13 medical-02 + NVIDIA GeForce RTX 2070 Super Max-Q SPECviewperf 13 - specvp13 medical-02
min: 48.6 avg: 50.6 median: 50.6 (11%) max: 52.6 fps
GPU TDP ? TDP 80 W 100% 92%
specvp13 maya-05 + NVIDIA GeForce RTX 2070 Super Max-Q SPECviewperf 13 - specvp13 maya-05
min: 199.7 avg: 210.6 median: 210.6 (24%) max: 221.5 fps
GPU TDP ? TDP 80 W 100% 90%
specvp13 energy-02 + NVIDIA GeForce RTX 2070 Super Max-Q SPECviewperf 13 - specvp13 energy-02
min: 18.47 avg: 18.7 median: 18.7 (6%) max: 18.95 fps
GPU TDP ? TDP 80 W 97% 100%
specvp13 creo-02 + NVIDIA GeForce RTX 2070 Super Max-Q SPECviewperf 13 - specvp13 creo-02
min: 160.4 avg: 166.2 median: 166.2 (24%) max: 172 fps
GPU TDP ? TDP 80 W 100% 93%
specvp13 catia-05 + NVIDIA GeForce RTX 2070 Super Max-Q SPECviewperf 13 - specvp13 catia-05
min: 124.3 avg: 126.6 median: 126.6 (14%) max: 128.9 fps
GPU TDP ? TDP 80 W 100% 96%
specvp13 3dsmax-06 + NVIDIA GeForce RTX 2070 Super Max-Q SPECviewperf 13 - specvp13 3dsmax-06
min: 171.5 avg: 176.4 median: 176.4 (31%) max: 181.2 fps
GPU TDP ? TDP 80 W 100% 95%
SPECviewperf 2020 specvp2020 solidworks-05 1080p + NVIDIA GeForce RTX 2070 Super Max-Q SPECviewperf 2020 - specvp2020 solidworks-05 1080p
152.8 fps (30%)
specvp2020 snx-04 1080p + NVIDIA GeForce RTX 2070 Super Max-Q SPECviewperf 2020 - specvp2020 snx-04 1080p
19.5 fps (3%)
specvp2020 medical-03 1080p + NVIDIA GeForce RTX 2070 Super Max-Q SPECviewperf 2020 - specvp2020 medical-03 1080p
24 fps (17%)
specvp2020 maya-06 1080p + NVIDIA GeForce RTX 2070 Super Max-Q SPECviewperf 2020 - specvp2020 maya-06 1080p
221.6 fps (32%)
specvp2020 energy-03 1080p + NVIDIA GeForce RTX 2070 Super Max-Q SPECviewperf 2020 - specvp2020 energy-03 1080p
19.2 fps (15%)
specvp2020 creo-03 1080p + NVIDIA GeForce RTX 2070 Super Max-Q SPECviewperf 2020 - specvp2020 creo-03 1080p
76.8 fps (38%)
specvp2020 catia-06 1080p + NVIDIA GeForce RTX 2070 Super Max-Q SPECviewperf 2020 - specvp2020 catia-06 1080p
49 fps (32%)
specvp2020 3dsmax-07 1080p + NVIDIA GeForce RTX 2070 Super Max-Q SPECviewperf 2020 - specvp2020 3dsmax-07 1080p
86.4 fps (39%)
Cinebench R10 Cinebench R10 Shading (32bit) + NVIDIA GeForce RTX 2070 Super Max-Q Cinebench R10 - Cinebench R10 Shading (32bit)
6835 Points (5%)
Cinebench R11.5 Cinebench R11.5 OpenGL 64 Bit + NVIDIA GeForce RTX 2070 Super Max-Q Cinebench R11.5 - Cinebench R11.5 OpenGL 64 Bit
88.5 fps (31%)
Cinebench R15 + NVIDIA GeForce GTX 1050 Ti (Desktop) Cinebench R15 - Cinebench R15 OpenGL 64 Bit
min: 134.7 avg: 150.4 median: 150.4 (9%) max: 166 fps
Cinebench R15 OpenGL 64 Bit + NVIDIA GeForce RTX 2070 Super Max-Q
min: 129 avg: 139.5 median: 138 (8%) max: 157 fps
GPU TDP ? TDP 80 W TDP 115 W 98% 100% 92%
Cinebench R15 OpenGL Ref. Match 64 Bit + NVIDIA GeForce GTX 1050 Ti (Desktop) Cinebench R15 - Cinebench R15 OpenGL Ref. Match 64 Bit
min: 99.6 avg: 99.8 median: 99.8 (100%) max: 100 %
Cinebench R15 OpenGL Ref. Match 64 Bit + NVIDIA GeForce RTX 2070 Super Max-Q
99.6 % (100%)
GPU TDP ? TDP 80 W TDP 115 W 100% 100% 100%
GFXBench - GFXBench Car Chase Offscreen
349 fps (39%)
LuxMark v2.0 64Bit - LuxMark v2.0 Room GPU
1175 Samples/s (5%)
LuxMark v2.0 64Bit - LuxMark v2.0 Sala GPU
2156 Samples/s (4%)
ComputeMark v2.1 - ComputeMark v2.1 Result
5493 Points (6%)
14015 Points (15%)
Power Consumption - Furmark Stress Test Power Consumption - external Monitor *
164 Watt (23%)
Power Consumption - The Witcher 3 Power Consumption - external Monitor *
155 Watt (22%)
153 Watt (21%)
Power Consumption - Witcher 3 Power Consumption *
99.5 Watt (22%)
min: 144 avg: 156 median: 155 (34%) max: 176 Watt
GPU TDP ? TDP 80 W TDP 115 W 110% 111% 100%
Power Consumption - Witcher 3 ultra Power Efficiency
0.2 fps per Watt (24%)
min: 0.4324 avg: 0.5 median: 0.5 (48%) max: 0.531 fps per Watt
GPU TDP ? TDP 80 W TDP 115 W 86% 82% 100%
Power Consumption - Witcher 3 ultra Power Efficiency - external Monitor
0.2 fps per Watt (15%)
0.5 fps per Watt (43%)
Emissions Witcher 3 Fan Noise + NVIDIA GeForce GTX 1050 Ti (Desktop) Emissions - Witcher 3 Fan Noise
42 dB(A) (67%)
Witcher 3 Fan Noise + NVIDIA GeForce RTX 2070 Super Max-Q
min: 46 avg: 48.9 median: 48 (77%) max: 53 dB(A)
GPU TDP ? TDP 80 W TDP 115 W 90% 87% 100%
Clock Speed - GPU Clock Witcher 3 ultra
min: 1320 avg: 1363 median: 1350 (53%) max: 1440 MHz
GPU TDP ? TDP 115 W 99% 100%
Average Benchmarks NVIDIA GeForce GTX 1050 Ti (Desktop) → 100% n=13 Average Benchmarks NVIDIA GeForce RTX 2070 Super Max-Q → 219% n=13
- Range of benchmark values for this graphics card
- Average benchmark values for this graphics card
* Smaller numbers mean a higher performance
1 This benchmark is not used for the average calculation
Game Benchmarks The following benchmarks stem from our benchmarks of review laptops. The performance depends on the used graphics memory, clock rate, processor, system settings, drivers, and operating systems. So the results don't have to be representative for all laptops with this GPU. For detailed information on the benchmark results, click on the fps number.
100%
GeForce GTX 1050 Ti (Desktop):
31 [X] Asus Maximum XIII Hero Desktop MSI GTX 1050 Ti Intel Core i9-11900K 3.5GHz
GeForce GTX 1050 Ti (Desktop)
min:
19 fps
fps
100%
GeForce GTX 1050 Ti (Desktop):
18 [X] Asus Maximum XIII Hero Desktop MSI GTX 1050 Ti Intel Core i9-11900K 3.5GHz
GeForce GTX 1050 Ti (Desktop)
min:
8 fps
fps
100%
GeForce GTX 1050 Ti (Desktop):
11 [X] Asus Maximum XIII Hero Desktop MSI GTX 1050 Ti Intel Core i9-11900K 3.5GHz
GeForce GTX 1050 Ti (Desktop)
min:
5 fps
fps
100%
GeForce GTX 1050 Ti (Desktop):
7 [X] Asus Maximum XIII Hero Desktop MSI GTX 1050 Ti Intel Core i9-11900K 3.5GHz
GeForce GTX 1050 Ti (Desktop)
min:
2 fps
fps
100%
GeForce GTX 1050 Ti (Desktop):
86.5 [X] Asus Maximum XIII Hero Desktop MSI GTX 1050 Ti 918016
Intel Core i9-11900K 3.5GHz
GeForce GTX 1050 Ti (Desktop)
min:
74 fps, P1:
72 fps, max:
101 fps
fps
100%
GeForce GTX 1050 Ti (Desktop):
75.3 [X] Asus Maximum XIII Hero Desktop MSI GTX 1050 Ti 918016
Intel Core i9-11900K 3.5GHz
GeForce GTX 1050 Ti (Desktop)
min:
64 fps, P1:
63 fps, max:
86 fps
fps
100%
GeForce GTX 1050 Ti (Desktop):
52.5 [X] Asus Maximum XIII Hero Desktop MSI GTX 1050 Ti 918016
Intel Core i9-11900K 3.5GHz
GeForce GTX 1050 Ti (Desktop)
min:
46 fps, P1:
45 fps, max:
60 fps
fps
100%
GeForce GTX 1050 Ti (Desktop):
65 [X] Asus Maximum XIII Hero Desktop MSI GTX 1050 Ti Intel Core i9-11900K 3.5GHz
GeForce GTX 1050 Ti (Desktop)
min:
40.3 fps, P0.1:
49.9 fps, P1:
53.2 fps, max:
202 fps
fps
100%
GeForce GTX 1050 Ti (Desktop):
23.3 [X] Asus Maximum XIII Hero Desktop MSI GTX 1050 Ti Intel Core i9-11900K 3.5GHz
GeForce GTX 1050 Ti (Desktop)
min:
17.1 fps, P0.1:
17.5 fps, P1:
18.8 fps, max:
33 fps
fps
100%
GeForce GTX 1050 Ti (Desktop):
15.8 [X] Asus Maximum XIII Hero Desktop MSI GTX 1050 Ti Intel Core i9-11900K 3.5GHz
GeForce GTX 1050 Ti (Desktop)
min:
12 fps, P0.1:
12.1 fps, P1:
13 fps, max:
20.3 fps
fps
100%
GeForce GTX 1050 Ti (Desktop):
7.7 [X] Asus Maximum XIII Hero Desktop MSI GTX 1050 Ti Intel Core i9-11900K 3.5GHz
GeForce GTX 1050 Ti (Desktop)
min:
6.08 fps, P0.1:
6.1 fps, P1:
6.17 fps, max:
9.98 fps
fps
100%
GeForce GTX 1050 Ti (Desktop):
55 [X] Asus Maximum XIII Hero Desktop MSI GTX 1050 Ti Intel Core i9-11900K 3.5GHz
GeForce GTX 1050 Ti (Desktop)
min:
14 fps, max:
73 fps
fps
100%
GeForce GTX 1050 Ti (Desktop):
37 [X] Asus Maximum XIII Hero Desktop MSI GTX 1050 Ti Intel Core i9-11900K 3.5GHz
GeForce GTX 1050 Ti (Desktop)
min:
25 fps, max:
46 fps
fps
100%
GeForce GTX 1050 Ti (Desktop):
36 [X] Asus Maximum XIII Hero Desktop MSI GTX 1050 Ti Intel Core i9-11900K 3.5GHz
GeForce GTX 1050 Ti (Desktop)
min:
25 fps, max:
46 fps
fps
100%
GeForce GTX 1050 Ti (Desktop):
35 [X] Asus Maximum XIII Hero Desktop MSI GTX 1050 Ti Intel Core i9-11900K 3.5GHz
GeForce GTX 1050 Ti (Desktop)
min:
24 fps, max:
45 fps
fps
100%
GeForce GTX 1050 Ti (Desktop):
24 [X] Asus Maximum XIII Hero Desktop MSI GTX 1050 Ti Intel Core i9-11900K 3.5GHz
GeForce GTX 1050 Ti (Desktop)
min:
14 fps, max:
29 fps
fps
100%
GeForce GTX 1050 Ti (Desktop):
11 [X] Asus Maximum XIII Hero Desktop MSI GTX 1050 Ti Intel Core i9-11900K 3.5GHz
GeForce GTX 1050 Ti (Desktop)
min:
8 fps, max:
13 fps
fps
100%
GeForce GTX 1050 Ti (Desktop):
185 [X] Aorus Z370 Ultra Gaming Desktop MSI GTX 1050 Ti 797778
Intel Core i7-8086K 3.7GHz
GeForce GTX 1050 Ti (Desktop)
min:
152 fps, P1:
142 fps, max:
230 fps
fps
100%
GeForce GTX 1050 Ti (Desktop):
88.8 [X] Aorus Z370 Ultra Gaming Desktop MSI GTX 1050 Ti 797778
Intel Core i7-8086K 3.7GHz
GeForce GTX 1050 Ti (Desktop)
min:
74 fps, P1:
71 fps, max:
104 fps
fps
100%
GeForce GTX 1050 Ti (Desktop):
71.7 [X] Aorus Z370 Ultra Gaming Desktop MSI GTX 1050 Ti 797778
Intel Core i7-8086K 3.7GHz
GeForce GTX 1050 Ti (Desktop)
min:
59 fps, P1:
56 fps, max:
83 fps
fps
100%
GeForce GTX 1050 Ti (Desktop):
41.3 [X] Aorus Z370 Ultra Gaming Desktop MSI GTX 1050 Ti Intel Core i7-8086K 3.7GHz
GeForce GTX 1050 Ti (Desktop)
min:
17.7 fps, P0.1:
28.4 fps, P1:
32.5 fps, max:
81.3 fps
fps
285%
GeForce RTX 2070 Super Max-Q:
117.8 fps
100%
GeForce GTX 1050 Ti (Desktop):
21.3 [X] Aorus Z370 Ultra Gaming Desktop MSI GTX 1050 Ti Intel Core i7-8086K 3.7GHz
GeForce GTX 1050 Ti (Desktop)
min:
14.9 fps, P0.1:
15.3 fps, P1:
18.1 fps, max:
35.3 fps
fps
318%
GeForce RTX 2070 Super Max-Q:
67.7 fps
100%
GeForce GTX 1050 Ti (Desktop):
17 [X] Aorus Z370 Ultra Gaming Desktop MSI GTX 1050 Ti Intel Core i7-8086K 3.7GHz
GeForce GTX 1050 Ti (Desktop)
min:
12.5 fps, P0.1:
12.6 fps, P1:
13.3 fps, max:
19.3 fps
fps
334%
GeForce RTX 2070 Super Max-Q:
56.7 fps
GeForce RTX 2070 Super Max-Q:
48.5 fps
GeForce RTX 2070 Super Max-Q:
135.7 fps
GeForce RTX 2070 Super Max-Q:
102.6 fps
GeForce RTX 2070 Super Max-Q:
101.6 fps
GeForce RTX 2070 Super Max-Q:
86.1 fps
GeForce RTX 2070 Super Max-Q:
163.7 fps
GeForce RTX 2070 Super Max-Q:
93.6 fps
GeForce RTX 2070 Super Max-Q:
86.2 fps
GeForce RTX 2070 Super Max-Q:
77.4 fps
GeForce RTX 2070 Super Max-Q:
118 fps
GeForce RTX 2070 Super Max-Q:
81 fps
GeForce RTX 2070 Super Max-Q:
70 fps
GeForce RTX 2070 Super Max-Q:
60 fps
GeForce RTX 2070 Super Max-Q:
160 fps
GeForce RTX 2070 Super Max-Q:
95.6 fps
GeForce RTX 2070 Super Max-Q:
78.2 fps
GeForce RTX 2070 Super Max-Q:
65.1 fps
GeForce RTX 2070 Super Max-Q:
100 fps
GeForce RTX 2070 Super Max-Q:
96 fps
GeForce RTX 2070 Super Max-Q:
84 fps
GeForce RTX 2070 Super Max-Q:
59 fps
GeForce RTX 2070 Super Max-Q:
127 fps
GeForce RTX 2070 Super Max-Q:
87.7 fps
GeForce RTX 2070 Super Max-Q:
81.9 fps
GeForce RTX 2070 Super Max-Q:
67.7 fps
100%
GeForce GTX 1050 Ti (Desktop):
56.1 [X] Aorus Z370 Ultra Gaming Desktop MSI GTX 1050 Ti Intel Core i7-8086K 3.7GHz
GeForce GTX 1050 Ti (Desktop)
min:
7 fps, P1:
41.5 fps, max:
81 fps
fps
100%
GeForce GTX 1050 Ti (Desktop):
25.6 [X] Aorus Z370 Ultra Gaming Desktop MSI GTX 1050 Ti Intel Core i7-8086K 3.7GHz
GeForce GTX 1050 Ti (Desktop)
min:
8 fps, P1:
21.2 fps, max:
55 fps
fps
100%
GeForce GTX 1050 Ti (Desktop):
18.1 [X] Aorus Z370 Ultra Gaming Desktop MSI GTX 1050 Ti Intel Core i7-8086K 3.7GHz
GeForce GTX 1050 Ti (Desktop)
min:
10 fps, P1:
12.3 fps, max:
47 fps
fps
100%
GeForce GTX 1050 Ti (Desktop):
12.1 [X] Aorus Z370 Ultra Gaming Desktop MSI GTX 1050 Ti Intel Core i7-8086K 3.7GHz
GeForce GTX 1050 Ti (Desktop)
min:
7 fps, P1:
8.3 fps, max:
26 fps
fps
100%
GeForce GTX 1050 Ti (Desktop):
8.6 [X] Aorus Z370 Ultra Gaming Desktop MSI GTX 1050 Ti Intel Core i7-8086K 3.7GHz
GeForce GTX 1050 Ti (Desktop)
min:
6 fps, P1:
6.4 fps, max:
12 fps
fps
GeForce RTX 2070 Super Max-Q:
145 fps
GeForce RTX 2070 Super Max-Q:
120 fps
GeForce RTX 2070 Super Max-Q:
107 fps
GeForce RTX 2070 Super Max-Q:
93 fps
GeForce RTX 2070 Super Max-Q:
164.3 fps
GeForce RTX 2070 Super Max-Q:
114.5 fps
GeForce RTX 2070 Super Max-Q:
104.3 fps
GeForce RTX 2070 Super Max-Q:
101.8 fps
GeForce RTX 2070 Super Max-Q:
258 [X] Aorus 15G XB Intel Core i7-10875H 2.3GHz
GeForce RTX 2070 Super Max-Q
min:
213 fps, max:
280 fps
fps
GeForce RTX 2070 Super Max-Q:
163 [X] Aorus 15G XB Intel Core i7-10875H 2.3GHz
GeForce RTX 2070 Super Max-Q
min:
153 fps, max:
178 fps
fps
GeForce RTX 2070 Super Max-Q:
145 [X] Aorus 15G XB Intel Core i7-10875H 2.3GHz
GeForce RTX 2070 Super Max-Q
min:
131 fps, max:
158 fps
fps
100%
GeForce GTX 1050 Ti (Desktop):
44.7 [X] Aorus Z370 Ultra Gaming Desktop MSI GTX 1050 Ti 670054
Intel Core i7-8086K 3.7GHz
GeForce GTX 1050 Ti (Desktop)
min:
34 fps, max:
54 fps
fps
233%
GeForce RTX 2070 Super Max-Q:
104 [X] Aorus 15G XB Intel Core i7-10875H 2.3GHz
GeForce RTX 2070 Super Max-Q
min:
88 fps, max:
122 fps
fps
100%
GeForce GTX 1050 Ti (Desktop):
32.3 [X] Aorus Z370 Ultra Gaming Desktop MSI GTX 1050 Ti 670054
Intel Core i7-8086K 3.7GHz
GeForce GTX 1050 Ti (Desktop)
min:
25 fps, max:
38 fps
fps
100%
GeForce GTX 1050 Ti (Desktop):
17.6 [X] Aorus Z370 Ultra Gaming Desktop MSI GTX 1050 Ti 670054
Intel Core i7-8086K 3.7GHz
GeForce GTX 1050 Ti (Desktop)
min:
14 fps, max:
20 fps
fps
100%
GeForce GTX 1050 Ti (Desktop):
200 [X] Aorus Z370 Ultra Gaming Desktop MSI GTX 1050 Ti Intel Core i7-8086K 3.7GHz
GeForce GTX 1050 Ti (Desktop)
fps
136%
GeForce RTX 2070 Super Max-Q:
272.4 fps
100%
GeForce GTX 1050 Ti (Desktop):
71.7 [X] Aorus Z370 Ultra Gaming Desktop MSI GTX 1050 Ti Intel Core i7-8086K 3.7GHz
GeForce GTX 1050 Ti (Desktop)
fps
231%
GeForce RTX 2070 Super Max-Q:
165.8 fps
100%
GeForce GTX 1050 Ti (Desktop):
44.3 □ [X] Aorus Z370 Ultra Gaming Desktop MSI GTX 1050 Ti Intel Core i7-8086K 3.7GHz
GeForce GTX 1050 Ti (Desktop)
fps
251%
GeForce RTX 2070 Super Max-Q:
109 109.2 116 ~ 111 fps
100%
GeForce GTX 1050 Ti (Desktop):
32.6 [X] Aorus Z370 Ultra Gaming Desktop MSI GTX 1050 Ti Intel Core i7-8086K 3.7GHz
GeForce GTX 1050 Ti (Desktop)
fps
258%
GeForce RTX 2070 Super Max-Q:
79 82.2 90.6 ~ 84 fps
100%
GeForce GTX 1050 Ti (Desktop):
20.6 [X] Aorus Z370 Ultra Gaming Desktop MSI GTX 1050 Ti Intel Core i7-8086K 3.7GHz
GeForce GTX 1050 Ti (Desktop)
fps
100%
GeForce GTX 1050 Ti (Desktop):
101 [X] Aorus Z370 Ultra Gaming Desktop MSI GTX 1050 Ti Intel Core i7-8086K 3.7GHz
GeForce GTX 1050 Ti (Desktop)
P1:
69 fps
fps
229%
GeForce RTX 2070 Super Max-Q:
229.6 232.3 ~ 231 fps
100%
GeForce GTX 1050 Ti (Desktop):
62.9 [X] Aorus Z370 Ultra Gaming Desktop MSI GTX 1050 Ti Intel Core i7-8086K 3.7GHz
GeForce GTX 1050 Ti (Desktop)
P1:
55.2 fps
fps
251%
GeForce RTX 2070 Super Max-Q:
152 157 164.1 ~ 158 fps
100%
GeForce GTX 1050 Ti (Desktop):
55.5 [X] Aorus Z370 Ultra Gaming Desktop MSI GTX 1050 Ti Intel Core i7-8086K 3.7GHz
GeForce GTX 1050 Ti (Desktop)
P1:
36.4 fps
fps
100%
GeForce GTX 1050 Ti (Desktop):
52.9 [X] Aorus Z370 Ultra Gaming Desktop MSI GTX 1050 Ti Intel Core i7-8086K 3.7GHz
GeForce GTX 1050 Ti (Desktop)
P1:
33.1 fps
fps
100%
GeForce GTX 1050 Ti (Desktop):
39.3 [X] Aorus Z370 Ultra Gaming Desktop MSI GTX 1050 Ti Intel Core i7-8086K 3.7GHz
GeForce GTX 1050 Ti (Desktop)
P1:
25.4 fps
fps
253%
GeForce RTX 2070 Super Max-Q:
99.6 fps
GeForce RTX 2070 Super Max-Q:
51.2 fps
100%
GeForce GTX 1050 Ti (Desktop):
109 [X] Aorus Z370 Ultra Gaming Desktop MSI GTX 1050 Ti Intel Core i7-8086K 3.7GHz
GeForce GTX 1050 Ti (Desktop)
min:
97 fps, max:
124 fps
fps
100%
GeForce GTX 1050 Ti (Desktop):
41.6 [X] Aorus Z370 Ultra Gaming Desktop MSI GTX 1050 Ti Intel Core i7-8086K 3.7GHz
GeForce GTX 1050 Ti (Desktop)
min:
39 fps, max:
45 fps
fps
262%
GeForce RTX 2070 Super Max-Q:
109 fps
100%
GeForce GTX 1050 Ti (Desktop):
33.5 [X] Aorus Z370 Ultra Gaming Desktop MSI GTX 1050 Ti Intel Core i7-8086K 3.7GHz
GeForce GTX 1050 Ti (Desktop)
min:
30 fps, max:
36 fps
fps
281%
GeForce RTX 2070 Super Max-Q:
91.6 96.8 ~ 94 fps
GeForce RTX 2070 Super Max-Q:
56.8 fps
GeForce RTX 2070 Super Max-Q:
27.4 fps
GeForce RTX 2070 Super Max-Q:
121 fps
100%
GeForce GTX 1050 Ti (Desktop):
50.9 [X] Aorus Z370 Ultra Gaming Desktop MSI GTX 1050 Ti Intel Core i7-8086K 3.7GHz
GeForce GTX 1050 Ti (Desktop)
min:
41 fps, max:
56 fps
fps
234%
GeForce RTX 2070 Super Max-Q:
116 121 ~ 119 fps
100%
GeForce GTX 1050 Ti (Desktop):
40.2 [X] Aorus Z370 Ultra Gaming Desktop MSI GTX 1050 Ti Intel Core i7-8086K 3.7GHz
GeForce GTX 1050 Ti (Desktop)
min:
28 fps, max:
55 fps
fps
281%
GeForce RTX 2070 Super Max-Q:
107 119 ~ 113 fps
100%
GeForce GTX 1050 Ti (Desktop):
32.4 [X] Aorus Z370 Ultra Gaming Desktop MSI GTX 1050 Ti Intel Core i7-8086K 3.7GHz
GeForce GTX 1050 Ti (Desktop)
min:
24 fps, max:
39 fps
fps
246%
GeForce RTX 2070 Super Max-Q:
79.8 fps
GeForce RTX 2070 Super Max-Q:
36.8 fps
100%
GeForce GTX 1050 Ti (Desktop):
75 [X] MSI GeForce GTX 1050 Ti Intel Core i7-7740X 4.3GHz
GeForce GTX 1050 Ti (Desktop)
min:
13 fps, P1:
66.7 fps, max:
140 fps
fps
177%
GeForce RTX 2070 Super Max-Q:
132.8 fps
100%
GeForce GTX 1050 Ti (Desktop):
34.8 [X] MSI GeForce GTX 1050 Ti Intel Core i7-7740X 4.3GHz
GeForce GTX 1050 Ti (Desktop)
min:
24 fps, P1:
30.3 fps, max:
135 fps
fps
256%
GeForce RTX 2070 Super Max-Q:
86.6 91.3 ~ 89 fps
100%
GeForce GTX 1050 Ti (Desktop):
22.3 [X] MSI GeForce GTX 1050 Ti Intel Core i7-7740X 4.3GHz
GeForce GTX 1050 Ti (Desktop)
min:
16.7 fps, P1:
17.5 fps, max:
128 fps
fps
100%
GeForce GTX 1050 Ti (Desktop):
14.3 [X] MSI GeForce GTX 1050 Ti Intel Core i7-7740X 4.3GHz
GeForce GTX 1050 Ti (Desktop)
min:
5.82 fps, P1:
10 fps, max:
128 fps
fps
GeForce RTX 2070 Super Max-Q:
32 34.3 ~ 33 fps
GeForce RTX 2070 Super Max-Q:
20.5 22 ~ 21 fps
GeForce RTX 2070 Super Max-Q:
108 109 ~ 109 fps
GeForce RTX 2070 Super Max-Q:
95 98.2 104 ~ 99 fps
GeForce RTX 2070 Super Max-Q:
71.3 fps
GeForce RTX 2070 Super Max-Q:
35.9 fps
GeForce RTX 2070 Super Max-Q:
103 fps
GeForce RTX 2070 Super Max-Q:
88.2 94 ~ 91 fps
GeForce RTX 2070 Super Max-Q:
80.7 82.6 ~ 82 fps
GeForce RTX 2070 Super Max-Q:
60.5 fps
GeForce RTX 2070 Super Max-Q:
33.4 fps
GeForce RTX 2070 Super Max-Q:
160.9 fps
GeForce RTX 2070 Super Max-Q:
116.2 134 ~ 125 fps
100%
GeForce GTX 1050 Ti (Desktop):
43.2 [X] MSI GeForce GTX 1050 Ti Intel Core i7-7740X 4.3GHz
GeForce GTX 1050 Ti (Desktop)
P1:
31.4 fps
fps
264%
GeForce RTX 2070 Super Max-Q:
97.8 117 126 ~ 114 fps
100%
GeForce GTX 1050 Ti (Desktop):
33.9 [X] MSI GeForce GTX 1050 Ti Intel Core i7-7740X 4.3GHz
GeForce GTX 1050 Ti (Desktop)
P1:
24.8 fps
fps
283%
GeForce RTX 2070 Super Max-Q:
84.2 99.6 104 ~ 96 fps
100%
GeForce GTX 1050 Ti (Desktop):
24 [X] MSI GeForce GTX 1050 Ti Intel Core i7-7740X 4.3GHz
GeForce GTX 1050 Ti (Desktop)
P1:
16.6 fps
fps
301%
GeForce RTX 2070 Super Max-Q:
72.3 fps
GeForce RTX 2070 Super Max-Q:
41 fps
GeForce RTX 2070 Super Max-Q:
131 fps
GeForce RTX 2070 Super Max-Q:
103 104 ~ 104 fps
GeForce RTX 2070 Super Max-Q:
69.7 71.1 ~ 70 fps
GeForce RTX 2070 Super Max-Q:
60.6 fps
GeForce RTX 2070 Super Max-Q:
39.7 fps
GeForce RTX 2070 Super Max-Q:
101 fps
GeForce RTX 2070 Super Max-Q:
89 92 ~ 91 fps
GeForce RTX 2070 Super Max-Q:
66 69 ~ 68 fps
GeForce RTX 2070 Super Max-Q:
49 50 ~ 50 fps
GeForce RTX 2070 Super Max-Q:
28 29 ~ 29 fps
GeForce RTX 2070 Super Max-Q:
271 fps
GeForce RTX 2070 Super Max-Q:
196 259 ~ 228 fps
100%
GeForce GTX 1050 Ti (Desktop):
141 [X] MSI GeForce GTX 1050 Ti Intel Core i7-7740X 4.3GHz
GeForce GTX 1050 Ti (Desktop)
P1:
103.1 fps
fps
159%
GeForce RTX 2070 Super Max-Q:
190 257 ~ 224 fps
100%
GeForce GTX 1050 Ti (Desktop):
107 [X] MSI GeForce GTX 1050 Ti Intel Core i7-7740X 4.3GHz
GeForce GTX 1050 Ti (Desktop)
P1:
84.7 fps
fps
236%
GeForce RTX 2070 Super Max-Q:
253 fps
100%
GeForce GTX 1050 Ti (Desktop):
62 [X] MSI GeForce GTX 1050 Ti Intel Core i7-7740X 4.3GHz
GeForce GTX 1050 Ti (Desktop)
P1:
51.5 fps
fps
300%
GeForce RTX 2070 Super Max-Q:
186 fps
100%
GeForce GTX 1050 Ti (Desktop):
115 [X] MSI GeForce GTX 1050 Ti Intel Core i7-7740X 4.3GHz
GeForce GTX 1050 Ti (Desktop)
fps
100%
GeForce GTX 1050 Ti (Desktop):
47.5 [X] MSI GeForce GTX 1050 Ti Intel Core i7-7740X 4.3GHz
GeForce GTX 1050 Ti (Desktop)
fps
236%
GeForce RTX 2070 Super Max-Q:
112 fps
100%
GeForce GTX 1050 Ti (Desktop):
29.6 [X] MSI GeForce GTX 1050 Ti Intel Core i7-7740X 4.3GHz
GeForce GTX 1050 Ti (Desktop)
fps
100%
GeForce GTX 1050 Ti (Desktop):
21.8 [X] MSI GeForce GTX 1050 Ti Intel Core i7-7740X 4.3GHz
GeForce GTX 1050 Ti (Desktop)
fps
100%
GeForce GTX 1050 Ti (Desktop):
15 [X] MSI GeForce GTX 1050 Ti Intel Core i7-7740X 4.3GHz
GeForce GTX 1050 Ti (Desktop)
fps
293%
GeForce RTX 2070 Super Max-Q:
41.7 45.6 ~ 44 fps
GeForce RTX 2070 Super Max-Q:
22.2 24.5 ~ 23 fps
100%
GeForce GTX 1050 Ti (Desktop):
94 [X] MSI GeForce GTX 1050 Ti Intel Core i7-7740X 4.3GHz
GeForce GTX 1050 Ti (Desktop)
min:
81 fps, max:
107 fps
fps
100%
GeForce GTX 1050 Ti (Desktop):
29.9 [X] MSI GeForce GTX 1050 Ti Intel Core i7-7740X 4.3GHz
GeForce GTX 1050 Ti (Desktop)
min:
26 fps, max:
34 fps
fps
310%
GeForce RTX 2070 Super Max-Q:
92.6 fps
100%
GeForce GTX 1050 Ti (Desktop):
21.3 [X] MSI GeForce GTX 1050 Ti Intel Core i7-7740X 4.3GHz
GeForce GTX 1050 Ti (Desktop)
min:
18 fps, max:
24 fps
fps
300%
GeForce RTX 2070 Super Max-Q:
60.2 68.4 ~ 64 fps
GeForce RTX 2070 Super Max-Q:
40.6 43.9 ~ 42 fps
GeForce RTX 2070 Super Max-Q:
21.1 23.8 ~ 22 fps
100%
GeForce GTX 1050 Ti (Desktop):
164 [X] MSI GeForce GTX 1050 Ti Intel Core i7-7740X 4.3GHz
GeForce GTX 1050 Ti (Desktop)
min:
143 fps, max:
181 fps
fps
100%
GeForce GTX 1050 Ti (Desktop):
73 [X] MSI GeForce GTX 1050 Ti Intel Core i7-7740X 4.3GHz
GeForce GTX 1050 Ti (Desktop)
min:
65 fps, max:
77 fps
fps
262%
GeForce RTX 2070 Super Max-Q:
191 fps
100%
GeForce GTX 1050 Ti (Desktop):
52.8 [X] MSI GeForce GTX 1050 Ti Intel Core i7-7740X 4.3GHz
GeForce GTX 1050 Ti (Desktop)
min:
49 fps, max:
55 fps
fps
295%
GeForce RTX 2070 Super Max-Q:
152 [X] Aorus 17G XB Intel Core i7-10875H 2.3GHz
GeForce RTX 2070 Super Max-Q
min:
131 fps
159 ~ 156 fps
100%
GeForce GTX 1050 Ti (Desktop):
37.4 [X] MSI GeForce GTX 1050 Ti Intel Core i7-7740X 4.3GHz
GeForce GTX 1050 Ti (Desktop)
min:
34 fps, max:
39 fps
fps
380%
GeForce RTX 2070 Super Max-Q:
141 [X] Aorus 17G XB Intel Core i7-10875H 2.3GHz
GeForce RTX 2070 Super Max-Q
min:
123 fps
143 ~ 142 fps
100%
GeForce GTX 1050 Ti (Desktop):
29.3 [X] MSI GeForce GTX 1050 Ti Intel Core i7-7740X 4.3GHz
GeForce GTX 1050 Ti (Desktop)
min:
27 fps, max:
30 fps
fps
365%
GeForce RTX 2070 Super Max-Q:
107 fps
100%
GeForce GTX 1050 Ti (Desktop):
18 [X] MSI GeForce GTX 1050 Ti Intel Core i7-7740X 4.3GHz
GeForce GTX 1050 Ti (Desktop)
min:
15 fps, max:
18 fps
fps
339%
GeForce RTX 2070 Super Max-Q:
61 fps
100%
GeForce GTX 1050 Ti (Desktop):
153 [X] MSI GeForce GTX 1050 Ti Intel Core i7-7740X 4.3GHz
GeForce GTX 1050 Ti (Desktop)
min:
128 fps, max:
183 fps
fps
169%
GeForce RTX 2070 Super Max-Q:
255.2 [X] Aorus 15G XB Intel Core i7-10875H 2.3GHz
GeForce RTX 2070 Super Max-Q
min:
186 fps, max:
332 fps
260.9 ~ 258 fps
100%
GeForce GTX 1050 Ti (Desktop):
51.4 [X] MSI GeForce GTX 1050 Ti Intel Core i7-7740X 4.3GHz
GeForce GTX 1050 Ti (Desktop)
min:
43 fps, max:
59 fps
fps
257%
GeForce RTX 2070 Super Max-Q:
122.8 [X] Aorus 15G XB Intel Core i7-10875H 2.3GHz
GeForce RTX 2070 Super Max-Q
min:
99 fps, max:
149 fps
141.2 ~ 132 fps
100%
GeForce GTX 1050 Ti (Desktop):
31.5 [X] MSI GeForce GTX 1050 Ti Intel Core i7-7740X 4.3GHz
GeForce GTX 1050 Ti (Desktop)
min:
27 fps, max:
36 fps
fps
279%
GeForce RTX 2070 Super Max-Q:
77.6 [X] Aorus 15G XB Intel Core i7-10875H 2.3GHz
GeForce RTX 2070 Super Max-Q
min:
59 fps, max:
95 fps
97.5 ~ 88 fps
100%
GeForce GTX 1050 Ti (Desktop):
21.4 [X] MSI GeForce GTX 1050 Ti Intel Core i7-7740X 4.3GHz
GeForce GTX 1050 Ti (Desktop)
min:
18 fps, max:
26 fps
fps
290%
GeForce RTX 2070 Super Max-Q:
54.8 [X] Aorus 15G XB Intel Core i7-10875H 2.3GHz
GeForce RTX 2070 Super Max-Q
min:
43 fps, max:
67 fps
68.7 ~ 62 fps
100%
GeForce GTX 1050 Ti (Desktop):
12.8 [X] MSI GeForce GTX 1050 Ti Intel Core i7-7740X 4.3GHz
GeForce GTX 1050 Ti (Desktop)
min:
11 fps, max:
15 fps
fps
GeForce RTX 2070 Super Max-Q:
119 fps
GeForce RTX 2070 Super Max-Q:
97.5 99.5 ~ 99 fps
GeForce RTX 2070 Super Max-Q:
94.9 97.1 ~ 96 fps
GeForce RTX 2070 Super Max-Q:
62.8 fps
GeForce RTX 2070 Super Max-Q:
30.1 fps
GeForce RTX 2070 Super Max-Q:
112 fps
GeForce RTX 2070 Super Max-Q:
84.2 85.5 ~ 85 fps
GeForce RTX 2070 Super Max-Q:
46.8 47.4 ~ 47 fps
GeForce RTX 2070 Super Max-Q:
36.6 37 ~ 37 fps
GeForce RTX 2070 Super Max-Q:
21.1 21.5 ~ 21 fps
100%
GeForce GTX 1050 Ti (Desktop):
156 [X] MSI GeForce GTX 1050 Ti Intel Core i7-7740X 4.3GHz
GeForce GTX 1050 Ti (Desktop)
min:
64.9351 fps, P1:
104.167 fps, max:
322.581 fps
fps
100%
GeForce GTX 1050 Ti (Desktop):
53.6 [X] MSI GeForce GTX 1050 Ti Intel Core i7-7740X 4.3GHz
GeForce GTX 1050 Ti (Desktop)
min:
20.3666 fps, P1:
36.6596 fps, max:
86.9565 fps
fps
229%
GeForce RTX 2070 Super Max-Q:
123 fps
100%
GeForce GTX 1050 Ti (Desktop):
41.4 [X] MSI GeForce GTX 1050 Ti Intel Core i7-7740X 4.3GHz
GeForce GTX 1050 Ti (Desktop)
min:
16.8634 fps, P1:
25.3165 fps, max:
83.3333 fps
fps
263%
GeForce RTX 2070 Super Max-Q:
105 113 ~ 109 fps
100%
GeForce GTX 1050 Ti (Desktop):
31.5 [X] MSI GeForce GTX 1050 Ti Intel Core i7-7740X 4.3GHz
GeForce GTX 1050 Ti (Desktop)
min:
15.9744 fps, P1:
20.6612 fps, max:
59.8802 fps
fps
251%
GeForce RTX 2070 Super Max-Q:
77 81 ~ 79 fps
100%
GeForce GTX 1050 Ti (Desktop):
21.5 [X] MSI GeForce GTX 1050 Ti Intel Core i7-7740X 4.3GHz
GeForce GTX 1050 Ti (Desktop)
min:
12.3609 fps, P1:
16.3319 fps, max:
45.6621 fps
fps
265%
GeForce RTX 2070 Super Max-Q:
54 60 ~ 57 fps
100%
GeForce GTX 1050 Ti (Desktop):
10.2 [X] MSI GeForce GTX 1050 Ti Intel Core i7-7740X 4.3GHz
GeForce GTX 1050 Ti (Desktop)
min:
3.60881 fps, P1:
7.28385 fps, max:
16.7785 fps
fps
284%
GeForce RTX 2070 Super Max-Q:
29 29 ~ 29 fps
100%
GeForce GTX 1050 Ti (Desktop):
149 [X] MSI GeForce GTX 1050 Ti Intel Core i7-7740X 4.3GHz
GeForce GTX 1050 Ti (Desktop)
min:
135 fps, max:
177 fps
fps
100%
GeForce GTX 1050 Ti (Desktop):
67 [X] MSI GeForce GTX 1050 Ti Intel Core i7-7740X 4.3GHz
GeForce GTX 1050 Ti (Desktop)
min:
59 fps, max:
81 fps
fps
273%
GeForce RTX 2070 Super Max-Q:
183 fps
100%
GeForce GTX 1050 Ti (Desktop):
52.3 [X] MSI GeForce GTX 1050 Ti Intel Core i7-7740X 4.3GHz
GeForce GTX 1050 Ti (Desktop)
min:
46 fps, max:
63 fps
fps
293%
GeForce RTX 2070 Super Max-Q:
151 [X] Aorus 17G XB Intel Core i7-10875H 2.3GHz
GeForce RTX 2070 Super Max-Q
min:
132 fps
155 ~ 153 fps
100%
GeForce GTX 1050 Ti (Desktop):
32.3 [X] MSI GeForce GTX 1050 Ti Intel Core i7-7740X 4.3GHz
GeForce GTX 1050 Ti (Desktop)
min:
29 fps, max:
39 fps
fps
266%
GeForce RTX 2070 Super Max-Q:
85.8 86.9 [X] Aorus 17G XB Intel Core i7-10875H 2.3GHz
GeForce RTX 2070 Super Max-Q
min:
72 fps
~ 86 fps
100%
GeForce GTX 1050 Ti (Desktop):
23.5 [X] MSI GeForce GTX 1050 Ti Intel Core i7-7740X 4.3GHz
GeForce GTX 1050 Ti (Desktop)
min:
21 fps, max:
27 fps
fps
281%
GeForce RTX 2070 Super Max-Q:
66 fps
100%
GeForce GTX 1050 Ti (Desktop):
13.4 [X] MSI GeForce GTX 1050 Ti Intel Core i7-7740X 4.3GHz
GeForce GTX 1050 Ti (Desktop)
min:
12 fps, max:
15 fps
fps
100%
GeForce GTX 1050 Ti (Desktop):
87 [X] MSI GeForce GTX 1050 Ti Intel Core i7-7740X 4.3GHz
GeForce GTX 1050 Ti (Desktop)
min:
65 fps, max:
111 fps
fps
100%
GeForce GTX 1050 Ti (Desktop):
48 [X] MSI GeForce GTX 1050 Ti Intel Core i7-7740X 4.3GHz
GeForce GTX 1050 Ti (Desktop)
min:
38 fps, max:
58 fps
fps
204%
GeForce RTX 2070 Super Max-Q:
98 fps
100%
GeForce GTX 1050 Ti (Desktop):
45 [X] MSI GeForce GTX 1050 Ti Intel Core i7-7740X 4.3GHz
GeForce GTX 1050 Ti (Desktop)
min:
36 fps, max:
54 fps
fps
224%
GeForce RTX 2070 Super Max-Q:
92 110 ~ 101 fps
100%
GeForce GTX 1050 Ti (Desktop):
41 [X] MSI GeForce GTX 1050 Ti Intel Core i7-7740X 4.3GHz
GeForce GTX 1050 Ti (Desktop)
min:
31 fps, max:
51 fps
fps
222%
GeForce RTX 2070 Super Max-Q:
83 98 ~ 91 fps
100%
GeForce GTX 1050 Ti (Desktop):
29 [X] MSI GeForce GTX 1050 Ti Intel Core i7-7740X 4.3GHz
GeForce GTX 1050 Ti (Desktop)
min:
23 fps, max:
36 fps
fps
259%
GeForce RTX 2070 Super Max-Q:
70 80 ~ 75 fps
100%
GeForce GTX 1050 Ti (Desktop):
14 [X] MSI GeForce GTX 1050 Ti Intel Core i7-7740X 4.3GHz
GeForce GTX 1050 Ti (Desktop)
min:
11 fps, max:
18 fps
fps
314%
GeForce RTX 2070 Super Max-Q:
43 45 ~ 44 fps
100%
GeForce GTX 1050 Ti (Desktop):
64.7 [X] MSI GeForce GTX 1050 Ti Intel Core i7-7740X 4.3GHz
GeForce GTX 1050 Ti (Desktop)
min:
34 fps, max:
116 fps
fps
100%
GeForce GTX 1050 Ti (Desktop):
32.8 [X] MSI GeForce GTX 1050 Ti Intel Core i7-7740X 4.3GHz
GeForce GTX 1050 Ti (Desktop)
min:
17 fps, max:
53 fps
fps
280%
GeForce RTX 2070 Super Max-Q:
92 fps
100%
GeForce GTX 1050 Ti (Desktop):
24 [X] MSI GeForce GTX 1050 Ti Intel Core i7-7740X 4.3GHz
GeForce GTX 1050 Ti (Desktop)
min:
13 fps, max:
40 fps
fps
308%
GeForce RTX 2070 Super Max-Q:
72 75.4 ~ 74 fps
100%
GeForce GTX 1050 Ti (Desktop):
19.8 [X] MSI GeForce GTX 1050 Ti Intel Core i7-7740X 4.3GHz
GeForce GTX 1050 Ti (Desktop)
min:
11 fps, max:
32 fps
fps
298%
GeForce RTX 2070 Super Max-Q:
57.7 60.4 ~ 59 fps
GeForce RTX 2070 Super Max-Q:
46.7 49.1 ~ 48 fps
100%
GeForce GTX 1050 Ti (Desktop):
9.2 [X] MSI GeForce GTX 1050 Ti Intel Core i7-7740X 4.3GHz
GeForce GTX 1050 Ti (Desktop)
min:
6 fps, max:
14 fps
fps
304%
GeForce RTX 2070 Super Max-Q:
26.5 29.1 ~ 28 fps
100%
GeForce GTX 1050 Ti (Desktop):
128 [X] MSI GeForce GTX 1050 Ti Intel Core i7-7740X 4.3GHz
GeForce GTX 1050 Ti (Desktop)
min:
115 fps, max:
144 fps
fps
100%
GeForce GTX 1050 Ti (Desktop):
55.6 [X] MSI GeForce GTX 1050 Ti Intel Core i7-7740X 4.3GHz
GeForce GTX 1050 Ti (Desktop)
min:
46 fps, max:
69 fps
fps
259%
GeForce RTX 2070 Super Max-Q:
144 fps
100%
GeForce GTX 1050 Ti (Desktop):
46.7 [X] MSI GeForce GTX 1050 Ti Intel Core i7-7740X 4.3GHz
GeForce GTX 1050 Ti (Desktop)
min:
41 fps, max:
57 fps
fps
304%
GeForce RTX 2070 Super Max-Q:
140 144 ~ 142 fps
100%
GeForce GTX 1050 Ti (Desktop):
45 [X] MSI GeForce GTX 1050 Ti Intel Core i7-7740X 4.3GHz
GeForce GTX 1050 Ti (Desktop)
min:
33 fps, max:
57 fps
fps
313%
GeForce RTX 2070 Super Max-Q:
139 143 ~ 141 fps
100%
GeForce GTX 1050 Ti (Desktop):
28.8 [X] MSI GeForce GTX 1050 Ti Intel Core i7-7740X 4.3GHz
GeForce GTX 1050 Ti (Desktop)
min:
25 fps, max:
37 fps
fps
378%
GeForce RTX 2070 Super Max-Q:
109 fps
100%
GeForce GTX 1050 Ti (Desktop):
14.1 [X] MSI GeForce GTX 1050 Ti Intel Core i7-7740X 4.3GHz
GeForce GTX 1050 Ti (Desktop)
min:
11 fps, max:
18 fps
fps
433%
GeForce RTX 2070 Super Max-Q:
61.1 fps
GeForce RTX 2070 Super Max-Q:
137 fps
100%
GeForce GTX 1050 Ti (Desktop):
41.9 [X] MSI GeForce GTX 1050 Ti Intel Core i7-7740X 4.3GHz
GeForce GTX 1050 Ti (Desktop)
min:
38 fps, max:
45 fps
fps
241%
GeForce RTX 2070 Super Max-Q:
101 fps
100%
GeForce GTX 1050 Ti (Desktop):
40.1 [X] MSI GeForce GTX 1050 Ti Intel Core i7-7740X 4.3GHz
GeForce GTX 1050 Ti (Desktop)
min:
37 fps, max:
44 fps
fps
233%
GeForce RTX 2070 Super Max-Q:
93.4 fps
GeForce RTX 2070 Super Max-Q:
63.6 fps
GeForce RTX 2070 Super Max-Q:
34.5 fps
GeForce RTX 2070 Super Max-Q:
135 fps
100%
GeForce GTX 1050 Ti (Desktop):
50.9 [X] MSI GeForce GTX 1050 Ti Intel Core i7-7740X 4.3GHz
GeForce GTX 1050 Ti (Desktop)
min:
45 fps, max:
58 fps
fps
232%
GeForce RTX 2070 Super Max-Q:
118 fps
100%
GeForce GTX 1050 Ti (Desktop):
43.3 [X] MSI GeForce GTX 1050 Ti Intel Core i7-7740X 4.3GHz
GeForce GTX 1050 Ti (Desktop)
min:
39 fps, max:
49 fps
fps
247%
GeForce RTX 2070 Super Max-Q:
107 fps
GeForce RTX 2070 Super Max-Q:
71.6 fps
GeForce RTX 2070 Super Max-Q:
36.4 fps
100%
GeForce GTX 1050 Ti (Desktop):
140 [X] MSI GeForce GTX 1050 Ti Intel Core i7-7740X 4.3GHz
GeForce GTX 1050 Ti (Desktop)
min:
107 fps, max:
186 fps
fps
100%
GeForce GTX 1050 Ti (Desktop):
63 [X] MSI GeForce GTX 1050 Ti Intel Core i7-7740X 4.3GHz
GeForce GTX 1050 Ti (Desktop)
min:
52 fps, max:
92 fps
fps
229%
GeForce RTX 2070 Super Max-Q:
144 fps
100%
GeForce GTX 1050 Ti (Desktop):
51.9 [X] MSI GeForce GTX 1050 Ti Intel Core i7-7740X 4.3GHz
GeForce GTX 1050 Ti (Desktop)
min:
42 fps, max:
79 fps
fps
256%
GeForce RTX 2070 Super Max-Q:
121 135 136 [X] Aorus 17G XB Intel Core i7-10875H 2.3GHz
GeForce RTX 2070 Super Max-Q
min:
110 fps
139 ~ 133 fps
100%
GeForce GTX 1050 Ti (Desktop):
50.9 [X] MSI GeForce GTX 1050 Ti Intel Core i7-7740X 4.3GHz
GeForce GTX 1050 Ti (Desktop)
min:
41 fps, max:
78 fps
fps
244%
GeForce RTX 2070 Super Max-Q:
113 125 126 [X] Aorus 17G XB Intel Core i7-10875H 2.3GHz
GeForce RTX 2070 Super Max-Q
min:
94 fps
130 ~ 124 fps
100%
GeForce GTX 1050 Ti (Desktop):
35.6 [X] MSI GeForce GTX 1050 Ti Intel Core i7-7740X 4.3GHz
GeForce GTX 1050 Ti (Desktop)
min:
29 fps, max:
55 fps
fps
281%
GeForce RTX 2070 Super Max-Q:
99.4 100 ~ 100 fps
100%
GeForce GTX 1050 Ti (Desktop):
17.5 [X] MSI GeForce GTX 1050 Ti Intel Core i7-7740X 4.3GHz
GeForce GTX 1050 Ti (Desktop)
min:
13 fps, max:
29 fps
fps
331%
GeForce RTX 2070 Super Max-Q:
56.8 58.2 ~ 58 fps
100%
GeForce GTX 1050 Ti (Desktop):
60 [X] MSI GeForce GTX 1050 Ti Intel Core i7-7740X 4.3GHz
GeForce GTX 1050 Ti (Desktop)
min:
48 fps, max:
93 fps
fps
100%
GeForce GTX 1050 Ti (Desktop):
20.3 [X] MSI GeForce GTX 1050 Ti Intel Core i7-7740X 4.3GHz
GeForce GTX 1050 Ti (Desktop)
min:
16 fps, max:
36 fps
fps
100%
GeForce GTX 1050 Ti (Desktop):
46.4 [X] MSI GeForce GTX 1050 Ti Intel Core i7-7740X 4.3GHz
GeForce GTX 1050 Ti (Desktop)
min:
37 fps, max:
57 fps
fps
100%
GeForce GTX 1050 Ti (Desktop):
30.7 [X] MSI GeForce GTX 1050 Ti Intel Core i7-7740X 4.3GHz
GeForce GTX 1050 Ti (Desktop)
min:
23 fps, max:
36 fps
fps
GeForce RTX 2070 Super Max-Q:
89.2 fps
GeForce RTX 2070 Super Max-Q:
83.2 fps
100%
GeForce GTX 1050 Ti (Desktop):
39.1 [X] MSI GeForce GTX 1050 Ti Intel Core i7-7740X 4.3GHz
GeForce GTX 1050 Ti (Desktop)
min:
32 fps, max:
47 fps
fps
204%
GeForce RTX 2070 Super Max-Q:
79.7 fps
GeForce RTX 2070 Super Max-Q:
76.1 fps
GeForce RTX 2070 Super Max-Q:
41.5 fps
100%
GeForce GTX 1050 Ti (Desktop):
53 [X] MSI GeForce GTX 1050 Ti Intel Core i7-7740X 4.3GHz
GeForce GTX 1050 Ti (Desktop)
min:
34 fps, max:
73 fps
fps
100%
GeForce GTX 1050 Ti (Desktop):
47.3 [X] MSI GeForce GTX 1050 Ti Intel Core i7-7740X 4.3GHz
GeForce GTX 1050 Ti (Desktop)
min:
34 fps, max:
63 fps
fps
100%
GeForce GTX 1050 Ti (Desktop):
41.6 [X] MSI GeForce GTX 1050 Ti Intel Core i7-7740X 4.3GHz
GeForce GTX 1050 Ti (Desktop)
min:
30 fps, max:
57 fps
fps
100%
GeForce GTX 1050 Ti (Desktop):
48 [X] MSI GeForce GTX 1050 Ti Intel Core i7-7740X 4.3GHz
GeForce GTX 1050 Ti (Desktop)
min:
18 fps, max:
101 fps
fps
206%
GeForce RTX 2070 Super Max-Q:
99 fps
100%
GeForce GTX 1050 Ti (Desktop):
40 [X] MSI GeForce GTX 1050 Ti Intel Core i7-7740X 4.3GHz
GeForce GTX 1050 Ti (Desktop)
min:
17 fps, max:
86 fps
fps
203%
GeForce RTX 2070 Super Max-Q:
81 fps
100%
GeForce GTX 1050 Ti (Desktop):
24 [X] MSI GeForce GTX 1050 Ti Intel Core i7-7740X 4.3GHz
GeForce GTX 1050 Ti (Desktop)
min:
12 fps, max:
54 fps
fps
258%
GeForce RTX 2070 Super Max-Q:
62 fps
GeForce RTX 2070 Super Max-Q:
47 fps
GeForce RTX 2070 Super Max-Q:
32 fps
100%
GeForce GTX 1050 Ti (Desktop):
133 [X] MSI GeForce GTX 1050 Ti Intel Core i7-7740X 4.3GHz
GeForce GTX 1050 Ti (Desktop)
min:
115 fps, max:
174 fps
fps
100%
GeForce GTX 1050 Ti (Desktop):
69 [X] MSI GeForce GTX 1050 Ti Intel Core i7-7740X 4.3GHz
GeForce GTX 1050 Ti (Desktop)
min:
60 fps, max:
87 fps
fps
100%
GeForce GTX 1050 Ti (Desktop):
64 [X] MSI GeForce GTX 1050 Ti Intel Core i7-7740X 4.3GHz
GeForce GTX 1050 Ti (Desktop)
min:
56 fps, max:
80 fps
fps
100%
GeForce GTX 1050 Ti (Desktop):
45 [X] MSI GeForce GTX 1050 Ti Intel Core i7-7740X 4.3GHz
GeForce GTX 1050 Ti (Desktop)
min:
37 fps, max:
58 fps
fps
100%
GeForce GTX 1050 Ti (Desktop):
20 [X] MSI GeForce GTX 1050 Ti Intel Core i7-7740X 4.3GHz
GeForce GTX 1050 Ti (Desktop)
min:
13.5 fps, max:
25.2 fps
fps
100%
GeForce GTX 1050 Ti (Desktop):
105 [X] MSI GeForce GTX 1050 Ti Intel Core i7-7740X 4.3GHz
GeForce GTX 1050 Ti (Desktop)
min:
86 fps, max:
113 fps
fps
100%
GeForce GTX 1050 Ti (Desktop):
75 [X] MSI GeForce GTX 1050 Ti Intel Core i7-7740X 4.3GHz
GeForce GTX 1050 Ti (Desktop)
min:
60 fps, max:
80 fps
fps
100%
GeForce GTX 1050 Ti (Desktop):
40.1 [X] MSI GeForce GTX 1050 Ti Intel Core i7-7740X 4.3GHz
GeForce GTX 1050 Ti (Desktop)
min:
33 fps, max:
43 fps
fps
GeForce RTX 2070 Super Max-Q:
133 fps
100%
GeForce GTX 1050 Ti (Desktop):
31 [X] MSI GeForce GTX 1050 Ti Intel Core i7-7740X 4.3GHz
GeForce GTX 1050 Ti (Desktop)
min:
23 fps, max:
61 fps
fps
371%
GeForce RTX 2070 Super Max-Q:
112 118 ~ 115 fps
100%
GeForce GTX 1050 Ti (Desktop):
29 [X] MSI GeForce GTX 1050 Ti Intel Core i7-7740X 4.3GHz
GeForce GTX 1050 Ti (Desktop)
min:
23 fps, max:
55 fps
fps
100%
GeForce GTX 1050 Ti (Desktop):
25 [X] MSI GeForce GTX 1050 Ti Intel Core i7-7740X 4.3GHz
GeForce GTX 1050 Ti (Desktop)
min:
17 fps, max:
47 fps
fps
388%
GeForce RTX 2070 Super Max-Q:
91 96 99 99 [X] Aorus 17G XB Intel Core i7-10875H 2.3GHz
GeForce RTX 2070 Super Max-Q
min:
77 fps
100 ~ 97 fps
GeForce RTX 2070 Super Max-Q:
68 68 ~ 68 fps
GeForce RTX 2070 Super Max-Q:
35 36 ~ 36 fps
100%
GeForce GTX 1050 Ti (Desktop):
169 [X] Aorus Z370 Ultra Gaming Desktop MSI GTX 1050 Ti 1.47.22.14 D3D12
Intel Core i7-8086K 3.7GHz
GeForce GTX 1050 Ti (Desktop)
min:
133 fps, P1:
138 fps, max:
237 fps
fps
100%
GeForce GTX 1050 Ti (Desktop):
66.6 [X] Aorus Z370 Ultra Gaming Desktop MSI GTX 1050 Ti 1.47.22.14 D3D12
Intel Core i7-8086K 3.7GHz
GeForce GTX 1050 Ti (Desktop)
min:
56.2 fps, P1:
57.3 fps, max:
82.7 fps
fps
100%
GeForce GTX 1050 Ti (Desktop):
49.8 [X] Aorus Z370 Ultra Gaming Desktop MSI GTX 1050 Ti 1.47.22.14 D3D12
Intel Core i7-8086K 3.7GHz
GeForce GTX 1050 Ti (Desktop)
min:
39.1 fps, P1:
39.7 fps, max:
71.6 fps
fps
100%
GeForce GTX 1050 Ti (Desktop):
42.5 [X] Aorus Z370 Ultra Gaming Desktop MSI GTX 1050 Ti 1.47.22.14 D3D12
Intel Core i7-8086K 3.7GHz
GeForce GTX 1050 Ti (Desktop)
min:
33.5 fps, P1:
34.4 fps, max:
60 fps
fps
100%
GeForce GTX 1050 Ti (Desktop):
30.2 [X] Aorus Z370 Ultra Gaming Desktop MSI GTX 1050 Ti 1.47.22.14 D3D12
Intel Core i7-8086K 3.7GHz
GeForce GTX 1050 Ti (Desktop)
min:
25.3 fps, P1:
25.6 fps, max:
40.6 fps
fps
100%
GeForce GTX 1050 Ti (Desktop):
17 [X] Aorus Z370 Ultra Gaming Desktop MSI GTX 1050 Ti 1.47.22.14 D3D12
Intel Core i7-8086K 3.7GHz
GeForce GTX 1050 Ti (Desktop)
min:
14.3 fps, P1:
14.7 fps, max:
22.8 fps
fps
100%
GeForce GTX 1050 Ti (Desktop):
136 [X] MSI GeForce GTX 1050 Ti Intel Core i7-7740X 4.3GHz
GeForce GTX 1050 Ti (Desktop)
min:
105 fps, max:
159 fps
fps
100%
GeForce GTX 1050 Ti (Desktop):
80 [X] MSI GeForce GTX 1050 Ti Intel Core i7-7740X 4.3GHz
GeForce GTX 1050 Ti (Desktop)
min:
67 fps, max:
90 fps
fps
100%
GeForce GTX 1050 Ti (Desktop):
63 [X] MSI GeForce GTX 1050 Ti Intel Core i7-7740X 4.3GHz
GeForce GTX 1050 Ti (Desktop)
min:
55 fps, max:
67 fps
fps
100%
GeForce GTX 1050 Ti (Desktop):
42.4 [X] MSI GeForce GTX 1050 Ti Intel Core i7-7740X 4.3GHz
GeForce GTX 1050 Ti (Desktop)
min:
36 fps, max:
46 fps
fps
100%
GeForce GTX 1050 Ti (Desktop):
29.5 [X] MSI GeForce GTX 1050 Ti Intel Core i7-7740X 4.3GHz
GeForce GTX 1050 Ti (Desktop)
min:
26 fps, max:
31 fps
fps
100%
GeForce GTX 1050 Ti (Desktop):
18.3 [X] MSI GeForce GTX 1050 Ti Intel Core i7-7740X 4.3GHz
GeForce GTX 1050 Ti (Desktop)
min:
16 fps, max:
19 fps
fps
GeForce RTX 2070 Super Max-Q:
113 fps
GeForce RTX 2070 Super Max-Q:
102 fps
GeForce RTX 2070 Super Max-Q:
84.2 fps
GeForce RTX 2070 Super Max-Q:
55.7 fps
GeForce RTX 2070 Super Max-Q:
27.5 fps
GeForce RTX 2070 Super Max-Q:
149 fps
GeForce RTX 2070 Super Max-Q:
118 fps
GeForce RTX 2070 Super Max-Q:
111 fps
100%
GeForce GTX 1050 Ti (Desktop):
36 [X] MSI GeForce GTX 1050 Ti Intel Core i7-7740X 4.3GHz
GeForce GTX 1050 Ti (Desktop)
min:
32 fps, max:
42 fps
fps
289%
GeForce RTX 2070 Super Max-Q:
104 fps
100%
GeForce GTX 1050 Ti (Desktop):
94 [X] Asus Prime X299 Deluxe XMP OC Intel Core i9-9980XE @4.4GHz
GeForce GTX 1050 Ti (Desktop)
102 [X] MSI GeForce GTX 1050 Ti Intel Core i7-7740X 4.3GHz
GeForce GTX 1050 Ti (Desktop)
~ 98 fps
100%
GeForce GTX 1050 Ti (Desktop):
86 [X] Asus Prime X299 Deluxe XMP OC Intel Core i9-9980XE @4.4GHz
GeForce GTX 1050 Ti (Desktop)
92 [X] MSI GeForce GTX 1050 Ti Intel Core i7-7740X 4.3GHz
GeForce GTX 1050 Ti (Desktop)
~ 89 fps
100%
GeForce GTX 1050 Ti (Desktop):
74 [X] Asus Prime X299 Deluxe XMP OC Intel Core i9-9980XE @4.4GHz
GeForce GTX 1050 Ti (Desktop)
79 [X] MSI GeForce GTX 1050 Ti Intel Core i7-7740X 4.3GHz
GeForce GTX 1050 Ti (Desktop)
~ 77 fps
100%
GeForce GTX 1050 Ti (Desktop):
41.7 [X] MSI GeForce GTX 1050 Ti Intel Core i7-7740X 4.3GHz
GeForce GTX 1050 Ti (Desktop)
fps
173%
GeForce RTX 2070 Super Max-Q:
67.8 75.4 ~ 72 fps
GeForce RTX 2070 Super Max-Q:
127 fps
100%
GeForce GTX 1050 Ti (Desktop):
35.2 [X] Intel Core i7-4790K 4GHz
GeForce GTX 1050 Ti (Desktop)
min:
28 fps, max:
41 fps
fps
307%
GeForce RTX 2070 Super Max-Q:
108 fps
100%
GeForce GTX 1050 Ti (Desktop):
26.6 [X] Intel Core i7-4790K 4GHz
GeForce GTX 1050 Ti (Desktop)
min:
20 fps, max:
32 fps
fps
285%
GeForce RTX 2070 Super Max-Q:
75.9 fps
GeForce RTX 2070 Super Max-Q:
54.4 fps
GeForce RTX 2070 Super Max-Q:
27.9 fps
100%
GeForce GTX 1050 Ti (Desktop):
62 [X] Intel Core i7-4790K 4GHz
GeForce GTX 1050 Ti (Desktop)
min:
41 fps, max:
78 fps
fps
261%
GeForce RTX 2070 Super Max-Q:
162 fps
100%
GeForce GTX 1050 Ti (Desktop):
33.3 [X] Intel Core i7-4790K 4GHz
GeForce GTX 1050 Ti (Desktop)
min:
26 fps, max:
45 fps
fps
321%
GeForce RTX 2070 Super Max-Q:
104 110 ~ 107 fps
100%
GeForce GTX 1050 Ti (Desktop):
22.7 [X] Intel Core i7-4790K 4GHz
GeForce GTX 1050 Ti (Desktop)
max:
36 fps
fps
361%
GeForce RTX 2070 Super Max-Q:
80 83.7 ~ 82 fps
GeForce RTX 2070 Super Max-Q:
33 fps
GeForce RTX 2070 Super Max-Q:
133 fps
100%
GeForce GTX 1050 Ti (Desktop):
65 [X] Intel Core i7-4790K 4GHz
GeForce GTX 1050 Ti (Desktop)
min:
53 fps, max:
78 fps
fps
203%
GeForce RTX 2070 Super Max-Q:
132 fps
100%
GeForce GTX 1050 Ti (Desktop):
44.8 [X] Intel Core i7-4790K 4GHz
GeForce GTX 1050 Ti (Desktop)
min:
36 fps, max:
55 fps
fps
241%
GeForce RTX 2070 Super Max-Q:
108 fps
GeForce RTX 2070 Super Max-Q:
86.2 fps
100%
GeForce GTX 1050 Ti (Desktop):
12.5 [X] Intel Core i7-4790K 4GHz
GeForce GTX 1050 Ti (Desktop)
min:
9 fps, max:
15 fps
fps
344%
GeForce RTX 2070 Super Max-Q:
43 fps
100%
GeForce GTX 1050 Ti (Desktop):
127 [X] Intel Core i7-4790K 4GHz
GeForce GTX 1050 Ti (Desktop)
min:
85 fps, max:
144 fps
fps
100%
GeForce GTX 1050 Ti (Desktop):
55.1 [X] Intel Core i7-4790K 4GHz
GeForce GTX 1050 Ti (Desktop)
min:
43 fps, max:
64 fps
fps
100%
GeForce GTX 1050 Ti (Desktop):
49.5 [X] Intel Core i7-4790K 4GHz
GeForce GTX 1050 Ti (Desktop)
min:
38 fps, max:
57 fps
fps
100%
GeForce GTX 1050 Ti (Desktop):
35.5 [X] Intel Core i7-4790K 4GHz
GeForce GTX 1050 Ti (Desktop)
min:
25 fps, max:
40 fps
fps
100%
GeForce GTX 1050 Ti (Desktop):
11.4 [X] Intel Core i7-4790K 4GHz
GeForce GTX 1050 Ti (Desktop)
min:
8 fps, max:
13 fps
fps
100%
GeForce GTX 1050 Ti (Desktop):
52.2 [X] MSI GeForce GTX 1050 Ti Intel Core i7-7740X 4.3GHz
GeForce GTX 1050 Ti (Desktop)
min:
38 fps, max:
74 fps
fps
100%
GeForce GTX 1050 Ti (Desktop):
30.7 [X] MSI GeForce GTX 1050 Ti Intel Core i7-7740X 4.3GHz
GeForce GTX 1050 Ti (Desktop)
min:
24 fps, max:
43 fps
fps
100%
GeForce GTX 1050 Ti (Desktop):
143 [X] Intel Core i7-4790K 4GHz
GeForce GTX 1050 Ti (Desktop)
fps
100%
GeForce GTX 1050 Ti (Desktop):
82 [X] Intel Core i7-4790K 4GHz
GeForce GTX 1050 Ti (Desktop)
min:
66 fps, max:
105 fps
fps
100%
GeForce GTX 1050 Ti (Desktop):
66.6 [X] Intel Core i7-4790K 4GHz
GeForce GTX 1050 Ti (Desktop)
min:
56 fps, max:
84 fps
fps
100%
GeForce GTX 1050 Ti (Desktop):
23 [X] Intel Core i7-4790K 4GHz
GeForce GTX 1050 Ti (Desktop)
min:
19 fps, max:
29 fps
fps
100%
GeForce GTX 1050 Ti (Desktop):
30 [X] Intel Core i7-4790K 4GHz
GeForce GTX 1050 Ti (Desktop)
min:
23 fps, max:
43 fps
fps
100%
GeForce GTX 1050 Ti (Desktop):
25.9 [X] Intel Core i7-4790K 4GHz
GeForce GTX 1050 Ti (Desktop)
min:
20 fps, max:
37 fps
fps
100%
GeForce GTX 1050 Ti (Desktop):
52.7 [X] Intel Core i7-4790K 4GHz
GeForce GTX 1050 Ti (Desktop)
min:
40 fps, max:
71 fps
fps
100%
GeForce GTX 1050 Ti (Desktop):
34.8 [X] Intel Core i7-4790K 4GHz
GeForce GTX 1050 Ti (Desktop)
min:
30 fps, max:
46 fps
fps
100%
GeForce GTX 1050 Ti (Desktop):
31.4 [X] Intel Core i7-4790K 4GHz
GeForce GTX 1050 Ti (Desktop)
min:
28 fps, max:
40 fps
fps
100%
GeForce GTX 1050 Ti (Desktop):
13.2 [X] Intel Core i7-4790K 4GHz
GeForce GTX 1050 Ti (Desktop)
min:
12 fps, max:
16 fps
fps
100%
GeForce GTX 1050 Ti (Desktop):
198 [X] Intel Core i7-4790K 4GHz
GeForce GTX 1050 Ti (Desktop)
min:
152 fps, max:
257 fps
fps
100%
GeForce GTX 1050 Ti (Desktop):
71.4 [X] Intel Core i7-4790K 4GHz
GeForce GTX 1050 Ti (Desktop)
min:
58 fps, max:
83 fps
fps
100%
GeForce GTX 1050 Ti (Desktop):
68 [X] Intel Core i7-4790K 4GHz
GeForce GTX 1050 Ti (Desktop)
min:
54 fps, max:
81 fps
fps
100%
GeForce GTX 1050 Ti (Desktop):
48.9 [X] Intel Core i7-4790K 4GHz
GeForce GTX 1050 Ti (Desktop)
min:
35 fps, max:
67 fps
fps
100%
GeForce GTX 1050 Ti (Desktop):
19.7 [X] Intel Core i7-4790K 4GHz
GeForce GTX 1050 Ti (Desktop)
min:
15 fps, max:
43 fps
fps
100%
GeForce GTX 1050 Ti (Desktop):
70 [X] Intel Core i7-4790K 4GHz
GeForce GTX 1050 Ti (Desktop)
min:
56 fps, max:
81 fps
fps
100%
GeForce GTX 1050 Ti (Desktop):
58.4 [X] Intel Core i7-4790K 4GHz
GeForce GTX 1050 Ti (Desktop)
min:
48 fps, max:
68 fps
fps
100%
GeForce GTX 1050 Ti (Desktop):
18.6 [X] Intel Core i7-4790K 4GHz
GeForce GTX 1050 Ti (Desktop)
min:
15 fps, max:
23 fps
fps
100%
GeForce GTX 1050 Ti (Desktop):
45.4 [X] Intel Core i7-4790K 4GHz
GeForce GTX 1050 Ti (Desktop)
min:
40 fps, max:
51 fps
fps
100%
GeForce GTX 1050 Ti (Desktop):
28.5 [X] Intel Core i7-4790K 4GHz
GeForce GTX 1050 Ti (Desktop)
min:
22 fps, max:
34 fps
fps
100%
GeForce GTX 1050 Ti (Desktop):
15.2 [X] Intel Core i7-4790K 4GHz
GeForce GTX 1050 Ti (Desktop)
min:
13 fps, max:
19 fps
fps
100%
GeForce GTX 1050 Ti (Desktop):
82 [X] Intel Core i7-4790K 4GHz
GeForce GTX 1050 Ti (Desktop)
min:
70 fps, max:
99 fps
fps
100%
GeForce GTX 1050 Ti (Desktop):
73 [X] Intel Core i7-4790K 4GHz
GeForce GTX 1050 Ti (Desktop)
min:
64 fps, max:
88 fps
fps
100%
GeForce GTX 1050 Ti (Desktop):
41.1 [X] Intel Core i7-4790K 4GHz
GeForce GTX 1050 Ti (Desktop)
min:
32 fps, max:
50 fps
fps
100%
GeForce GTX 1050 Ti (Desktop):
38.7 [X] Intel Core i7-4790K 4GHz
GeForce GTX 1050 Ti (Desktop)
min:
32 fps, max:
48 fps
fps
100%
GeForce GTX 1050 Ti (Desktop):
21.9 [X] Intel Core i7-4790K 4GHz
GeForce GTX 1050 Ti (Desktop)
min:
17 fps, max:
27 fps
fps
100%
GeForce GTX 1050 Ti (Desktop):
60.5 [X] Intel Core i7-4790K 4GHz
GeForce GTX 1050 Ti (Desktop)
min:
43 fps, max:
98 fps
fps
100%
GeForce GTX 1050 Ti (Desktop):
26.1 [X] Intel Core i7-4790K 4GHz
GeForce GTX 1050 Ti (Desktop)
min:
19 fps, max:
40 fps
fps
100%
GeForce GTX 1050 Ti (Desktop):
62 [X] Intel Core i7-4790K 4GHz
GeForce GTX 1050 Ti (Desktop)
min:
51 fps, max:
80 fps
fps
100%
GeForce GTX 1050 Ti (Desktop):
56.6 [X] Intel Core i7-4790K 4GHz
GeForce GTX 1050 Ti (Desktop)
min:
46 fps, max:
72 fps
fps
100%
GeForce GTX 1050 Ti (Desktop):
18.5 [X] Intel Core i7-4790K 4GHz
GeForce GTX 1050 Ti (Desktop)
min:
15 fps, max:
23 fps
fps
100%
GeForce GTX 1050 Ti (Desktop):
113 [X] Intel Core i7-4790K 4GHz
GeForce GTX 1050 Ti (Desktop)
min:
105 fps, max:
141 fps
fps
100%
GeForce GTX 1050 Ti (Desktop):
51.1 [X] Intel Core i7-4790K 4GHz
GeForce GTX 1050 Ti (Desktop)
min:
47 fps, max:
63 fps
fps
100%
GeForce GTX 1050 Ti (Desktop):
199 [X] Intel Core i7-4790K 4GHz
GeForce GTX 1050 Ti (Desktop)
min:
195 fps, max:
201 fps
fps
100%
GeForce GTX 1050 Ti (Desktop):
144 [X] Intel Core i7-4790K 4GHz
GeForce GTX 1050 Ti (Desktop)
min:
137 fps, max:
159 fps
fps
100%
GeForce GTX 1050 Ti (Desktop):
69 [X] Intel Core i7-4790K 4GHz
GeForce GTX 1050 Ti (Desktop)
min:
62 fps, max:
73 fps
fps
100%
GeForce GTX 1050 Ti (Desktop):
62.4 [X] Intel Core i7-4790K 4GHz
GeForce GTX 1050 Ti (Desktop)
min:
53 fps, max:
68 fps
fps
100%
GeForce GTX 1050 Ti (Desktop):
25.2 [X] Intel Core i7-4790K 4GHz
GeForce GTX 1050 Ti (Desktop)
min:
21 fps, max:
27 fps
fps
100%
GeForce GTX 1050 Ti (Desktop):
57.5 [X] Intel Core i7-4790K 4GHz
GeForce GTX 1050 Ti (Desktop)
min:
42 fps, max:
86 fps
fps
100%
GeForce GTX 1050 Ti (Desktop):
47.3 [X] Intel Core i7-4790K 4GHz
GeForce GTX 1050 Ti (Desktop)
min:
36 fps, max:
71 fps
fps
100%
GeForce GTX 1050 Ti (Desktop):
36.3 [X] Intel Core i7-4790K 4GHz
GeForce GTX 1050 Ti (Desktop)
min:
29 fps, max:
53 fps
fps
100%
GeForce GTX 1050 Ti (Desktop):
68.2 [X] Intel Core i7-4790K 4GHz
GeForce GTX 1050 Ti (Desktop)
min:
61 fps, max:
79 fps
fps
100%
GeForce GTX 1050 Ti (Desktop):
41.8 [X] Intel Core i7-4790K 4GHz
GeForce GTX 1050 Ti (Desktop)
min:
37 fps, max:
49 fps
fps
100%
GeForce GTX 1050 Ti (Desktop):
22.1 [X] Intel Core i7-4790K 4GHz
GeForce GTX 1050 Ti (Desktop)
min:
19 fps, max:
25 fps
fps
100%
GeForce GTX 1050 Ti (Desktop):
187 [X] Intel Core i7-4790K 4GHz
GeForce GTX 1050 Ti (Desktop)
min:
135 fps, max:
215 fps
fps
100%
GeForce GTX 1050 Ti (Desktop):
72 [X] Intel Core i7-4790K 4GHz
GeForce GTX 1050 Ti (Desktop)
min:
55 fps, max:
78 fps
fps
100%
GeForce GTX 1050 Ti (Desktop):
61.4 [X] Intel Core i7-4790K 4GHz
GeForce GTX 1050 Ti (Desktop)
min:
49 fps, max:
78 fps
fps
100%
GeForce GTX 1050 Ti (Desktop):
32.7 [X] Intel Core i7-4790K 4GHz
GeForce GTX 1050 Ti (Desktop)
min:
27 fps, max:
39 fps
fps
100%
GeForce GTX 1050 Ti (Desktop):
22.8 [X] Intel Core i7-4790K 4GHz
GeForce GTX 1050 Ti (Desktop)
min:
18 fps, max:
28 fps
fps
100%
GeForce GTX 1050 Ti (Desktop):
79 [X] Intel Core i7-4790K 4GHz
GeForce GTX 1050 Ti (Desktop)
min:
51 fps, max:
104 fps
fps
100%
GeForce GTX 1050 Ti (Desktop):
44.6 [X] Intel Core i7-4790K 4GHz
GeForce GTX 1050 Ti (Desktop)
min:
36 fps, max:
53 fps
fps
100%
GeForce GTX 1050 Ti (Desktop):
20.7 [X] Intel Core i7-4790K 4GHz
GeForce GTX 1050 Ti (Desktop)
min:
15 fps, max:
25 fps
fps
100%
GeForce GTX 1050 Ti (Desktop):
46.5 [X] Intel Core i7-4790K 4GHz
GeForce GTX 1050 Ti (Desktop)
min:
43 fps, max:
50 fps
fps
100%
GeForce GTX 1050 Ti (Desktop):
114 [X] Intel Core i7-4790K 4GHz
GeForce GTX 1050 Ti (Desktop)
min:
94 fps, max:
132 fps
fps
100%
GeForce GTX 1050 Ti (Desktop):
68 [X] Intel Core i7-4790K 4GHz
GeForce GTX 1050 Ti (Desktop)
min:
58 fps, max:
82 fps
fps
100%
GeForce GTX 1050 Ti (Desktop):
35.6 [X] Intel Core i7-4790K 4GHz
GeForce GTX 1050 Ti (Desktop)
min:
31 fps, max:
42 fps
fps
100%
GeForce GTX 1050 Ti (Desktop):
69 [X] Intel Core i7-4790K 4GHz
GeForce GTX 1050 Ti (Desktop)
min:
58 fps, max:
94 fps
fps
100%
GeForce GTX 1050 Ti (Desktop):
23.3 [X] OGL
Intel Core i7-4790K 4GHz
GeForce GTX 1050 Ti (Desktop)
min:
19 fps, max:
31 fps
fps
100%
GeForce GTX 1050 Ti (Desktop):
40.4 [X] DX12
Intel Core i7-4790K 4GHz
GeForce GTX 1050 Ti (Desktop)
42.9 [X] DX11
Intel Core i7-4790K 4GHz
GeForce GTX 1050 Ti (Desktop)
43.9 ~ 42 fps
100%
GeForce GTX 1050 Ti (Desktop):
37.9 [X] DX11
Intel Core i7-4790K 4GHz
GeForce GTX 1050 Ti (Desktop)
39.1 ~ 39 fps
100%
GeForce GTX 1050 Ti (Desktop):
12.8 [X] DX12
Intel Core i7-4790K 4GHz
GeForce GTX 1050 Ti (Desktop)
fps
100%
GeForce GTX 1050 Ti (Desktop):
88 [X] Intel Core i7-4790K 4GHz
GeForce GTX 1050 Ti (Desktop)
min:
61 fps, max:
107 fps
fps
100%
GeForce GTX 1050 Ti (Desktop):
34.5 [X] DX11
Intel Core i7-4790K 4GHz
GeForce GTX 1050 Ti (Desktop)
min:
25 fps, max:
44 fps
fps
100%
GeForce GTX 1050 Ti (Desktop):
32.7 [X] DX11
Intel Core i7-4790K 4GHz
GeForce GTX 1050 Ti (Desktop)
min:
23 fps, max:
42 fps
fps
100%
GeForce GTX 1050 Ti (Desktop):
135 [X] Intel Core i7-4790K 4GHz
GeForce GTX 1050 Ti (Desktop)
min:
118 fps, max:
151 fps
fps
100%
GeForce GTX 1050 Ti (Desktop):
61 [X] Intel Core i7-4790K 4GHz
GeForce GTX 1050 Ti (Desktop)
min:
56 fps, max:
68 fps
fps
100%
GeForce GTX 1050 Ti (Desktop):
54 [X] Intel Core i7-4790K 4GHz
GeForce GTX 1050 Ti (Desktop)
min:
49 fps, max:
60 fps
fps
100%
GeForce GTX 1050 Ti (Desktop):
41 [X] Intel Core i7-4790K 4GHz
GeForce GTX 1050 Ti (Desktop)
min:
32 fps, max:
49 fps
fps
100%
GeForce GTX 1050 Ti (Desktop):
48.9 [X] Intel Core i7-4790K 4GHz
GeForce GTX 1050 Ti (Desktop)
min:
45 fps, max:
53 fps
fps
100%
GeForce GTX 1050 Ti (Desktop):
40.7 [X] Intel Core i7-4790K 4GHz
GeForce GTX 1050 Ti (Desktop)
min:
37 fps, max:
45 fps
fps
100%
GeForce GTX 1050 Ti (Desktop):
272 [X] Intel Core i7-4790K 4GHz
GeForce GTX 1050 Ti (Desktop)
fps
100%
GeForce GTX 1050 Ti (Desktop):
181 [X] Intel Core i7-4790K 4GHz
GeForce GTX 1050 Ti (Desktop)
min:
103 fps, max:
275 fps
fps
100%
GeForce GTX 1050 Ti (Desktop):
95 [X] Intel Core i7-4790K 4GHz
GeForce GTX 1050 Ti (Desktop)
min:
63 fps, max:
148 fps
fps
100%
GeForce GTX 1050 Ti (Desktop):
79 [X] Intel Core i7-4790K 4GHz
GeForce GTX 1050 Ti (Desktop)
min:
56 fps, max:
104 fps
fps
100%
GeForce GTX 1050 Ti (Desktop):
61 [X] Intel Core i7-4790K 4GHz
GeForce GTX 1050 Ti (Desktop)
min:
52 fps, max:
74 fps
fps
100%
GeForce GTX 1050 Ti (Desktop):
21.6 [X] Intel Core i7-4790K 4GHz
GeForce GTX 1050 Ti (Desktop)
min:
18 fps, max:
26 fps
fps
100%
GeForce GTX 1050 Ti (Desktop):
52.6 [X] Intel Core i7-4790K 4GHz
GeForce GTX 1050 Ti (Desktop)
min:
48 fps, max:
58 fps
fps
100%
GeForce GTX 1050 Ti (Desktop):
22.9 [X] Intel Core i7-4790K 4GHz
GeForce GTX 1050 Ti (Desktop)
min:
18 fps, max:
27 fps
fps
100%
GeForce GTX 1050 Ti (Desktop):
46.4 [X] Intel Core i7-4790K 4GHz
GeForce GTX 1050 Ti (Desktop)
min:
38 fps, max:
58 fps
fps
100%
GeForce GTX 1050 Ti (Desktop):
61.8 [X] Intel Core i7-4790K 4GHz
GeForce GTX 1050 Ti (Desktop)
min:
56 fps, max:
66 fps
fps
100%
GeForce GTX 1050 Ti (Desktop):
20.7 [X] Intel Core i7-4790K 4GHz
GeForce GTX 1050 Ti (Desktop)
min:
17 fps, max:
23 fps
fps
100%
GeForce GTX 1050 Ti (Desktop):
113 [X] Intel Core i7-4790K 4GHz
GeForce GTX 1050 Ti (Desktop)
min:
86 fps, max:
152 fps
fps
100%
GeForce GTX 1050 Ti (Desktop):
35.7 [X] Intel Core i7-4790K 4GHz
GeForce GTX 1050 Ti (Desktop)
min:
22 fps, max:
54 fps
fps
100%
GeForce GTX 1050 Ti (Desktop):
79 [X] Intel Core i7-4790K 4GHz
GeForce GTX 1050 Ti (Desktop)
min:
72 fps, max:
87 fps
fps
100%
GeForce GTX 1050 Ti (Desktop):
26.9 [X] Intel Core i7-4790K 4GHz
GeForce GTX 1050 Ti (Desktop)
min:
24 fps, max:
30 fps
fps
100%
GeForce GTX 1050 Ti (Desktop):
178 [X] Asus Prime X299 Deluxe XMP OC Intel Core i9-9980XE @4.4GHz
GeForce GTX 1050 Ti (Desktop)
min:
153.9 fps
fps
100%
GeForce GTX 1050 Ti (Desktop):
161 [X] Asus Prime X299 Deluxe XMP OC Intel Core i9-9980XE @4.4GHz
GeForce GTX 1050 Ti (Desktop)
min:
141.3 fps
fps
100%
GeForce GTX 1050 Ti (Desktop):
141 [X] Asus Prime X299 Deluxe XMP OC Intel Core i9-9980XE @4.4GHz
GeForce GTX 1050 Ti (Desktop)
min:
123.3 fps
fps
100%
GeForce GTX 1050 Ti (Desktop):
125 [X] Asus Prime X299 Deluxe XMP OC Intel Core i9-9980XE @4.4GHz
GeForce GTX 1050 Ti (Desktop)
min:
107.3 fps
fps
100%
GeForce GTX 1050 Ti (Desktop):
63 [X] Intel Core i7-4790K 4GHz
GeForce GTX 1050 Ti (Desktop)
min:
58 fps
fps
163%
GeForce RTX 2070 Super Max-Q:
103 fps
100%
GeForce GTX 1050 Ti (Desktop):
49.4 [X] Intel Core i7-4790K 4GHz
GeForce GTX 1050 Ti (Desktop)
min:
41 fps, max:
54 fps
fps
100%
GeForce GTX 1050 Ti (Desktop):
24 27.5 [X] Intel Core i7-4790K 4GHz
GeForce GTX 1050 Ti (Desktop)
min:
22 fps, max:
32 fps
~ 26 fps
288%
GeForce RTX 2070 Super Max-Q:
62.7 70.5 71.9 [X] MSI GS66 Stealth 10SFS BIOS-Update Intel Core i9-10980HK 2.4GHz
GeForce RTX 2070 Super Max-Q
min:
60 fps
73.6 [X] Aorus 17G XB Intel Core i7-10875H 2.3GHz
GeForce RTX 2070 Super Max-Q
min:
62 fps
74 75.3 75.5 [X] Aorus 15G XB Intel Core i7-10875H 2.3GHz
GeForce RTX 2070 Super Max-Q
min:
63 fps
76.2 [X] Gigabyte Aero 15 OLED XB Dynamic Boost Off Intel Core i7-10875H 2.3GHz
GeForce RTX 2070 Super Max-Q
min:
64 fps
79.1 92.5 ~ 75 fps
GeForce RTX 2070 Super Max-Q:
49.7 50.5 [X] Gigabyte Aero 15 OLED XB Dynamic Boost Off Intel Core i7-10875H 2.3GHz
GeForce RTX 2070 Super Max-Q
min:
43 fps
52.9 ~ 51 fps
100%
GeForce GTX 1050 Ti (Desktop):
62.1 [X] Intel Core i7-4790K 4GHz
GeForce GTX 1050 Ti (Desktop)
min:
51 fps, max:
75 fps
fps
100%
GeForce GTX 1050 Ti (Desktop):
52.7 [X] Intel Core i7-4790K 4GHz
GeForce GTX 1050 Ti (Desktop)
min:
46 fps, max:
67 fps
fps
100%
GeForce GTX 1050 Ti (Desktop):
176 [X] Aorus Z370 Ultra Gaming Desktop MSI GTX 1050 Ti Intel Core i7-8086K 3.7GHz
GeForce GTX 1050 Ti (Desktop)
min:
3.93 fps, P1:
125 fps, max:
337 fps
fps
103%
GeForce RTX 2070 Super Max-Q:
182 182 182 182 [X] Aorus 17G XB Intel Core i7-10875H 2.3GHz
GeForce RTX 2070 Super Max-Q
min:
3.97 fps, P1:
143 fps, max:
340 fps
~ 182 fps
100%
GeForce GTX 1050 Ti (Desktop):
169 [X] Aorus Z370 Ultra Gaming Desktop MSI GTX 1050 Ti Intel Core i7-8086K 3.7GHz
GeForce GTX 1050 Ti (Desktop)
min:
20.6 fps, P1:
125 fps, max:
258 fps
fps
104%
GeForce RTX 2070 Super Max-Q:
174 175 176 177 [X] Aorus 17G XB Intel Core i7-10875H 2.3GHz
GeForce RTX 2070 Super Max-Q
min:
4.1 fps, P1:
125 fps, max:
374 fps
~ 176 fps
100%
GeForce GTX 1050 Ti (Desktop):
88.8 [X] Aorus Z370 Ultra Gaming Desktop MSI GTX 1050 Ti Intel Core i7-8086K 3.7GHz
GeForce GTX 1050 Ti (Desktop)
min:
10.1 fps, P1:
62.5 fps, max:
163 fps
fps
178%
GeForce RTX 2070 Super Max-Q:
153 159 [X] Aorus 17G XB Intel Core i7-10875H 2.3GHz
GeForce RTX 2070 Super Max-Q
min:
4.33 fps, P1:
111 fps, max:
391 fps
160 161 ~ 158 fps
100%
GeForce GTX 1050 Ti (Desktop):
36.4 [X] Intel Core i7-4790K 4GHz
GeForce GTX 1050 Ti (Desktop)
min:
22.1 fps, max:
102 fps
41.2 [X] Aorus Z370 Ultra Gaming Desktop MSI GTX 1050 Ti Intel Core i7-8086K 3.7GHz
GeForce GTX 1050 Ti (Desktop)
min:
6.32 fps, P1:
27.8 fps, max:
110 fps
~ 39 fps
228%
GeForce RTX 2070 Super Max-Q:
83.4 89.9 91.1 [X] Aorus 17G XB Intel Core i7-10875H 2.3GHz
GeForce RTX 2070 Super Max-Q
min:
9.54 fps, P1:
58.8 fps, max:
197 fps
91.3 ~ 89 fps
100%
GeForce GTX 1050 Ti (Desktop):
29.4 [X] Aorus Z370 Ultra Gaming Desktop MSI GTX 1050 Ti Intel Core i7-8086K 3.7GHz
GeForce GTX 1050 Ti (Desktop)
min:
5.25 fps, P1:
20.8 fps, max:
79.5 fps
fps
100%
GeForce GTX 1050 Ti (Desktop):
27.8 [X] Aorus Z370 Ultra Gaming Desktop MSI GTX 1050 Ti Intel Core i7-8086K 3.7GHz
GeForce GTX 1050 Ti (Desktop)
min:
6.34 fps, P1:
20.8 fps, max:
126 fps
fps
263%
GeForce RTX 2070 Super Max-Q:
73.1 fps
100%
GeForce GTX 1050 Ti (Desktop):
39.9 [X] Intel Core i7-4790K 4GHz
GeForce GTX 1050 Ti (Desktop)
min:
29 fps
fps
100%
GeForce GTX 1050 Ti (Desktop):
84 [X] Intel Core i7-4790K 4GHz
GeForce GTX 1050 Ti (Desktop)
fps
100%
GeForce GTX 1050 Ti (Desktop):
58.2 [X] Intel Core i7-4790K 4GHz
GeForce GTX 1050 Ti (Desktop)
min:
25 fps, max:
165 fps
fps
100%
GeForce GTX 1050 Ti (Desktop):
66 [X] Intel Core i7-4790K 4GHz
GeForce GTX 1050 Ti (Desktop)
min:
58 fps, max:
81 fps
fps
100%
GeForce GTX 1050 Ti (Desktop):
30.2 [X] Intel Core i7-4790K 4GHz
GeForce GTX 1050 Ti (Desktop)
min:
27 fps, max:
36 fps
fps
100%
GeForce GTX 1050 Ti (Desktop):
303.5 fps
138%
GeForce RTX 2070 Super Max-Q:
420.2 fps
GeForce RTX 2070 Super Max-Q:
359.5 fps
100%
GeForce GTX 1050 Ti (Desktop):
208 [X] Intel Core i7-4790K 4GHz
GeForce GTX 1050 Ti (Desktop)
min:
58 fps, max:
311 fps
fps
159%
GeForce RTX 2070 Super Max-Q:
329.8 fps
100%
GeForce GTX 1050 Ti (Desktop):
77.2 79 [X] Intel Core i7-4790K 4GHz
GeForce GTX 1050 Ti (Desktop)
min:
45 fps, max:
130 fps
~ 78 fps
213%
GeForce RTX 2070 Super Max-Q:
166.5 fps
100%
GeForce GTX 1050 Ti (Desktop):
35.8 [X] Intel Core i7-4790K 4GHz
GeForce GTX 1050 Ti (Desktop)
min:
29 fps, max:
54 fps
fps
100%
GeForce GTX 1050 Ti (Desktop):
55.1 [X] Intel Core i7-4790K 4GHz
GeForce GTX 1050 Ti (Desktop)
min:
22 fps, max:
93 fps
fps
Average Gaming NVIDIA GeForce GTX 1050 Ti (Desktop) → 100% Average Gaming 30-70 fps → 100%
Average Gaming NVIDIA GeForce RTX 2070 Super Max-Q → 254% Average Gaming 30-70 fps → 309%
 Deutsch
 English
 Español
 Français
 Italiano
 Nederlands
 Polski
 Português
 Русский
 Türkçe
 Svenska
 Chinese
 Magyar