Notebookcheck Logo

Intel Core i7-7500U vs AMD Ryzen 5 4500U vs Intel Core i7-7820HK

Intel Core i7-7500U

► remove from comparison Intel i7-7500U

The Intel Core i7-7500U is a dual-core processor of the Kaby Lake architecture. It offers two CPU cores clocked at 2.7 - 3.5 GHz and integrates HyperThreading to work with up to 4 threads at once. The architectural differences are rather small compared to the Skylake generation, therefore the performance per MHz is very similar. The SoC includes a dual channel DDR4 memory controller and Intel HD Graphics 620 graphics card (clocked at 300 - 1050 MHz). It is manufactured in an improved 14nm FinFET process (14nm+) at Intel. Compared to the old Skylake Core i7-6500U (2.5 - 3.1 GHz), the i7-7500U clock speed is up to 400 MHz higher.

AMD Ryzen 5 4500U

► remove from comparison AMD R5 4500U

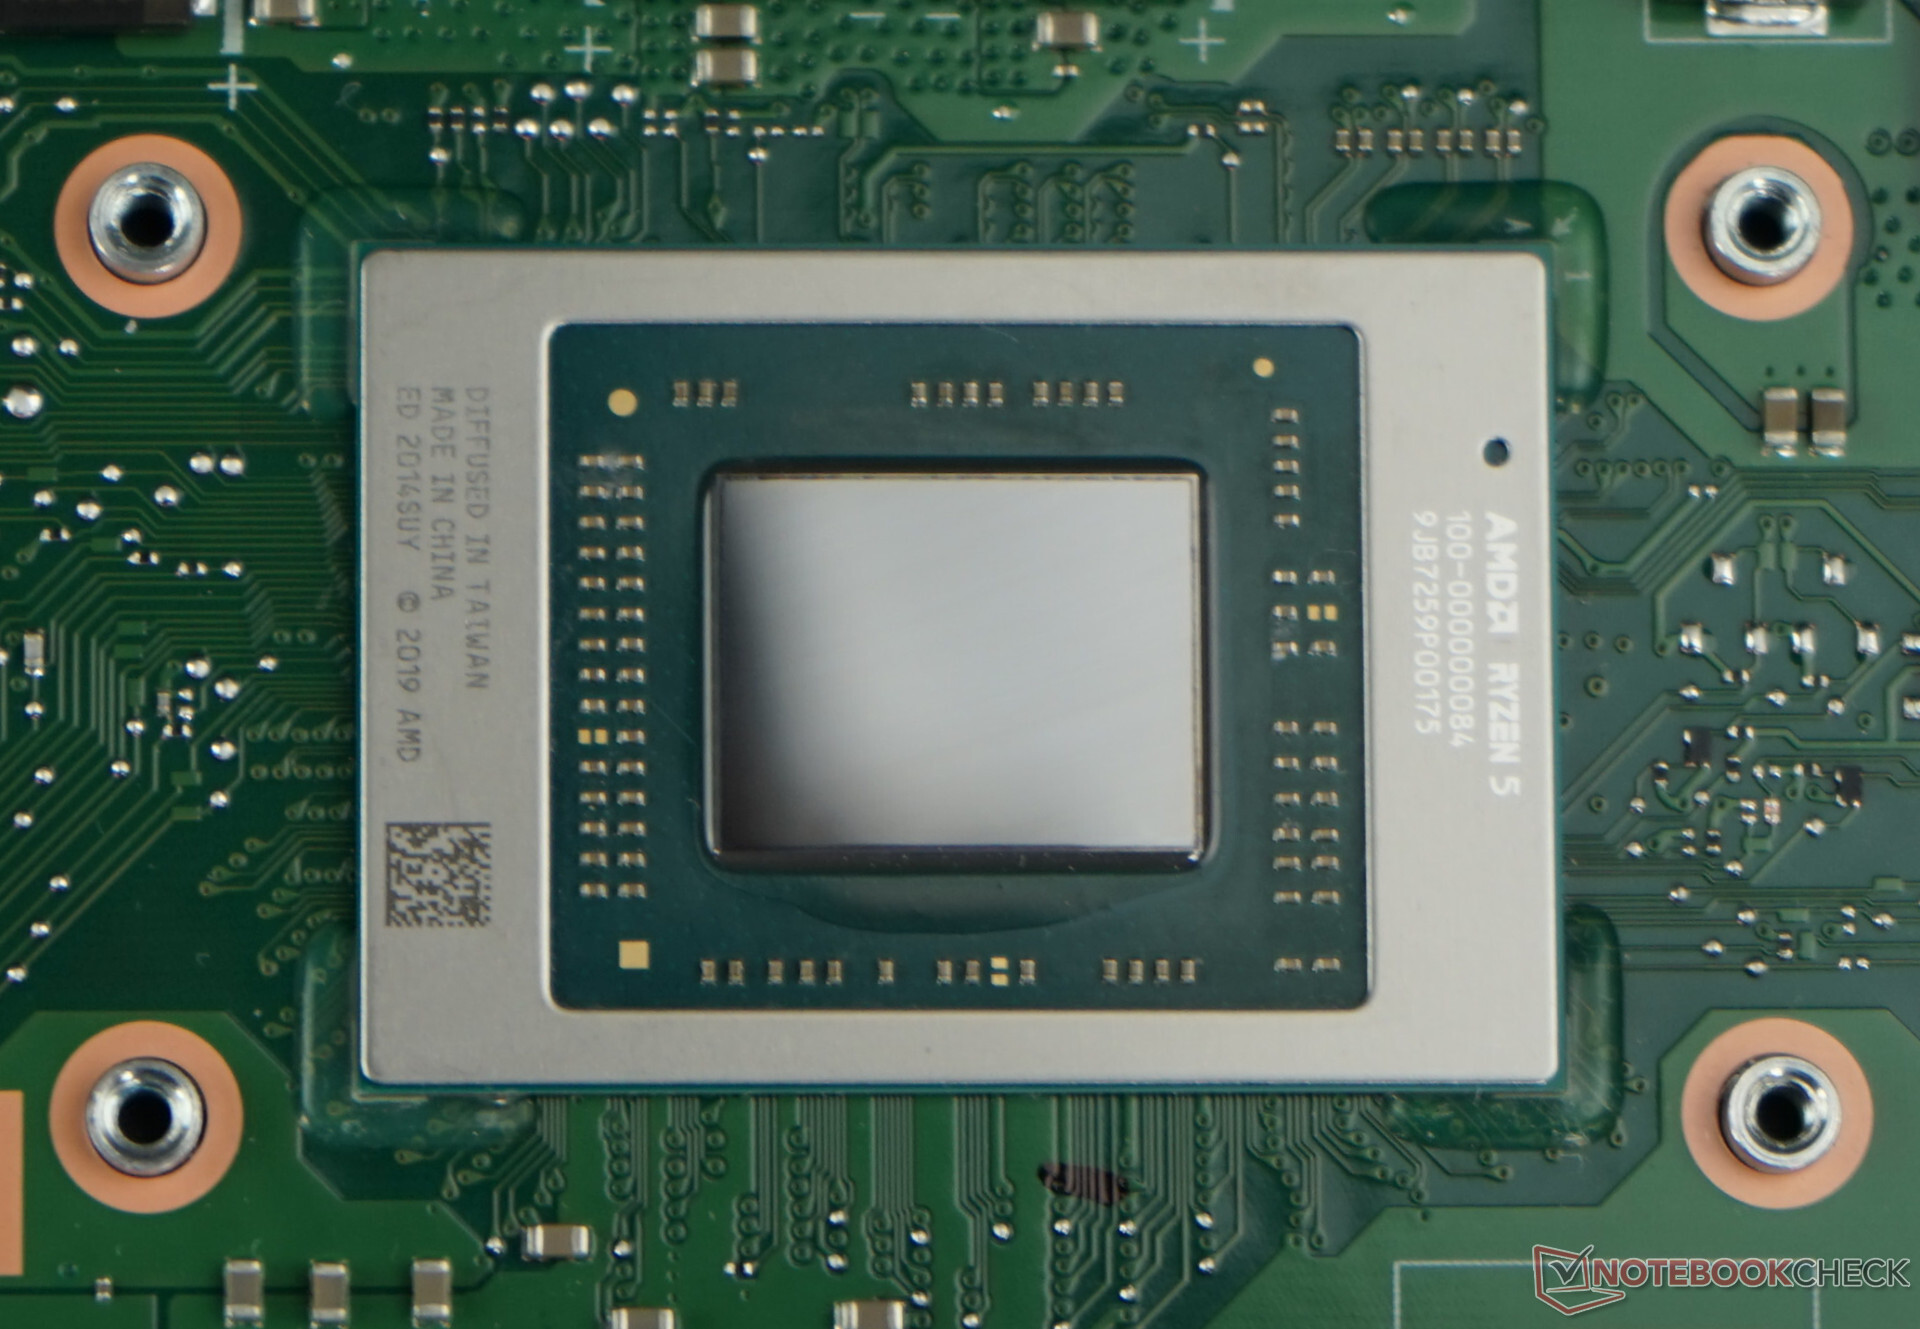
The AMD Ryzen 5 4500U is an upper mid-range, hexa-core processor of the Renoir product family. The APU was unveiled in H1 2020; it is designed for use in thinner, lighter laptops. Its six Zen 2 CPU cores run at 2.3 GHz (base clock speed) to 4.0 GHz (highest Boost frequency possible). Ryzen 5 4500U features the Vega 6 iGPU.

The sole advantage of Ryzen 5 4600U over Ryzen 5 4500U is the thread-doubling SMT technology support. The former has SMT while the latter does not.

Architecture

Zen 2 is a resounding success, delivering massive improvements over outgoing Zen Plus-based processors. Ryzen 5 4500U is manufactured on the cutting-edge 7 nm TSMC process; it is compatible with dual-channel DDR4-3200 or quad-channel LPDDR4-4266 memory. This processor has 8 MB of Level 3 cache.

While the APU uses Zen 2 cores just like the desktop-grade Ryzen 3000-series processors do, Ryzen 7 3800XT included, it does does not have PCI-Express 4.0 support. It does feature several PCI-Express 3.0 lanes for connecting discrete graphics cards, SSDs and other devices. Four PCI-Express 3.0 lanes allow for read/write rates of up to 3.9 GB/s provided a suitably fast NVMe SSD is used.

Ryzen 5 4500U gets soldered permanently on to the motherboard (FP6 socket interface) and is anything but user-replaceable.

Performance

The average Ryzen 5 4500U in our database nearly matches the Core i5-11300H, the Core i5-11320H and also the AMD Ryzen 3 5300U as far as multi-thread benchmark scores are concerned - thus delivering an undeniably impressive performance jump over the outgoing Ryzen 5 3500U.

Thanks to its decent cooling solution and a long-term power limit of 38 W, the Xiaomi RedmiBook 16 R5 is among the fastest systems powered by the R5 4500U that we know of. It can be about 20% faster in CPU-bound workloads than the slowest system built around the same chip in our database, as of August 2023.

Graphics

Just like its name suggests, the Radeon RX Vega 6 graphics adapter has 6 Compute Units (6 x 64 = 384 unified shaders). In the case of Ryzen 5 4500U, this graphics adapter runs at up to 1,500 MHz. The iGPU definitely supports UHD 2160p monitors at 60 Hz; it will have no trouble HW-decoding HEVC, AVC, VP9, MPEG-2 and other widespread video codecs. AV1 is not supported though; such a video will have to be software-decoded for much lower energy efficiency.

Vega 6 will let you play many titles of 2020 and 2021 as long as you stick to low settings and low resolutions. F1 2021 (720p, Low) runs at 32 fps; Outriders (720p, Low) runs at 27 fps, to give you an example or two. As the iGPU has no VRAM of its own, it is paramount that fast system RAM is used.

Power consumption

This Ryzen chip is very energy efficient, as of mid 2022, thanks to the cutting-edge 7 nm TSMC manufacturing process and the mature Zen 2 architecture.

The Ryzen 5 4500U has a default TDP (also known as the long-term Power Limit) of 15 W that can be changed to anything between 10 W and 25 W by laptop makers if required, a right they use more often than not. Clock speeds and performance will change accordingly as a result. By going for the lowest value, it will be possible to use the APU as the heart of a passively cooled tablet, laptop, mini-PC.

Intel Core i7-7820HK

► remove from comparison Intel i7-7820HK

The Intel Core i7-7820HK is a fast quad-core processor for notebooks based on the Kaby Lake architecture and was announced in January 2017. It is the second fastest model of the consumer series at the time of the announcement. Only the i7-7920HQ and Xeon E3-1535M v6 are faster. Besides four cores including Hyper-Threading support running at 2.9 - 3.9 GHz (4 cores up to 3.5 GHz, 2 cores up to 3.7 GHz), the processor is also equipped with the HD Graphics 630 GPU as well as a dual-channel memory controller (DDR3L-1600/DDR4-2400). It is manufactured in a 14nm process with FinFET transistors.

Compared to the Core i7-7820HQ, the 7820HK lacks business features like vPro or TXT support.

Architecture

Intel basically uses the same micro architecture compared to Skylake, so the per-MHz performance does not differ. The manufacturer only reworked the Speed Shift technology for faster dynamic adjustments of voltages and clocks, and the improved 14nm process allows much higher frequencies combined with better efficiency than before.

Performance

Due to the higher clock speeds, the performance of the i7-7820HK is slightly faster than the old Skylake top model Core i7-6920HQ (2.9 - 3.8 GHz). The performance is sufficient even for very demanding tasks and on par with powerful desktop quad-core processors.

Graphics

The integrated Intel HD Graphics 630 has 24 Execution Units (similar to previous HD Graphics 530) running at 350 - 1100 MHz. The performance depends a lot on the memory configuration; it should be comparable to a dedicated Nvidia GeForce 920M in combination with fast DDR4-2133 dual-channel memory.

Contrary to Skylake, Kaby Lake now supports hardware decoding for H.265/HEVC Main 10 with a 10-bit color depth as well as Google's VP9 codec. The dual-core Kaby Lake processors, which were announced in January, should also support HDCP 2.2.

Power Consumption

The chip is manufactured in an improved 14nm process with FinFET transistors, which improves the efficiency even further. Intel still specifies the TDP with 45 Watts, but it can also be reduced to 35 Watts by the notebook manufacturers (cTDP down). This will obviously affect the performance, because the Turbo Boost cannot be maintained for longer periods.

ModelIntel Core i7-7500UAMD Ryzen 5 4500UIntel Core i7-7820HK
SeriesIntel Kaby LakeAMD Renoir (Ryzen 4000 APU)Intel Kaby Lake
CodenameKaby LakeRenoir-U (Zen 2)Kaby Lake
Series: Kaby Lake Kaby Lake
Intel Core i7-7700K4.2 - 4.5 GHz4 / 8 cores8 MB L3
Intel Core i7-77003.6 - 4.2 GHz4 / 8 cores8 MB L3
Intel Xeon E3-1535M v63.1 - 4.2 GHz4 / 8 cores8 MB L3
Intel Core i7-7920HQ3.1 - 4.1 GHz4 / 8 cores8 MB L3
Intel Core i7-7700T2.9 - 3.8 GHz4 / 8 cores8 MB L3
Intel Core i5-7600K3.8 - 4.2 GHz4 / 4 cores8 MB L3
Intel Xeon E3-1505M v63 - 4 GHz4 / 8 cores8 MB L3
Intel Core i7-7820HQ2.9 - 3.9 GHz4 / 8 cores8 MB L3
Intel Core i7-7820HK2.9 - 3.9 GHz4 / 8 cores8 MB L3
Intel Core i7-7700HQ2.8 - 3.8 GHz4 / 8 cores6 MB L3
Intel Core i5-75003.4 - 3.8 GHz4 / 4 cores6 MB L3
Intel Core i5-7440HQ2.8 - 3.8 GHz4 / 4 cores6 MB L3
Intel Core i7-7567U3.5 - 4 GHz2 / 4 cores4 MB L3
Intel Core i7-7660U2.5 - 4 GHz2 / 4 cores4 MB L3
Intel Core i7-7600U2.8 - 3.9 GHz2 / 4 cores4 MB L3
Intel Core i5-7300HQ2.5 - 3.5 GHz4 / 4 cores6 MB L3
Intel Core i5-7500T2.7 - 3.3 GHz4 / 4 cores6 MB L3
Intel Core i5-7287U3.3 - 3.7 GHz2 / 4 cores4 MB L3
Intel Core i7-7560U2.4 - 3.8 GHz2 / 4 cores4 MB L3
Intel Core i5-7267U3.1 - 3.5 GHz2 / 4 cores4 MB L3
Intel Core i5-7360U2.3 - 3.6 GHz2 / 4 cores4 MB L3
Intel Core i7-7500U « 2.7 - 3.5 GHz2 / 4 cores4 MB L3
Intel Core i5-7300U2.6 - 3.5 GHz2 / 4 cores3 MB L3
Intel Core i5-7260U2.2 - 3.4 GHz2 / 4 cores4 MB L3
Intel Core i5-7200U2.5 - 3.1 GHz2 / 4 cores3 MB L3
Intel Core i3-7100H3 GHz2 / 4 cores3 MB L3
Intel Core i3-7167U2.8 GHz2 / 4 cores3 MB L3
Intel Core i7-7Y751.3 - 3.6 GHz2 / 4 cores4 MB L3
Intel Core i5-7Y571.2 - 3.3 GHz2 / 4 cores4 MB L3
Intel Core i5-7Y541.2 - 3.2 GHz2 / 4 cores4 MB L3
Intel Core i3-7100U2.4 GHz2 / 4 cores3 MB L3
Intel Core m3-7Y321 - 3 GHz2 / 4 cores4 MB L3
Intel Pentium Gold 4415U2.3 GHz2 / 4 cores2 MB L3
Intel Core m3-7Y301 - 2.6 GHz2 / 4 cores4 MB L3
Intel Celeron 3965U2.2 GHz2 / 2 cores2 MB L3
Intel Core i3-7020U2.3 GHz2 / 4 cores3 MB L3
Intel Celeron 3867U1.8 GHz2 / 2 cores2 MB L3
Intel Celeron 3865U1.8 GHz2 / 2 cores2 MB L3
Intel Pentium Gold 4425Y1.7 GHz2 / 4 cores2 MB L3
Intel Pentium Gold 4415Y1.6 GHz2 / 4 cores2 MB L3
Intel Pentium Gold 4410Y1.5 GHz2 / 4 cores2 MB L3
Intel Celeron 3965Y1.5 GHz2 / 2 cores2 MB L3
AMD Ryzen 7 4980U2 - 4.4 GHz8 / 16 cores8 MB L3
AMD Ryzen 7 4800U1.8 - 4.2 GHz8 / 16 cores8 MB L3
AMD Ryzen 7 4700U2 - 4.1 GHz8 / 8 cores8 MB L3
AMD Ryzen 5 4680U2.2 - 4 GHz6 / 12 cores8 MB L3
AMD Ryzen 5 4600U2.1 - 4 GHz6 / 12 cores8 MB L3
AMD Ryzen 5 4500U « 2.3 - 4 GHz6 / 6 cores8 MB L3
AMD Ryzen 3 4300U2.7 - 3.7 GHz4 / 4 cores4 MB L3
Intel Core i7-7700K4.2 - 4.5 GHz4 / 8 cores8 MB L3
Intel Core i7-77003.6 - 4.2 GHz4 / 8 cores8 MB L3
Intel Xeon E3-1535M v63.1 - 4.2 GHz4 / 8 cores8 MB L3
Intel Core i7-7920HQ3.1 - 4.1 GHz4 / 8 cores8 MB L3
Intel Core i7-7700T2.9 - 3.8 GHz4 / 8 cores8 MB L3
Intel Core i5-7600K3.8 - 4.2 GHz4 / 4 cores8 MB L3
Intel Xeon E3-1505M v63 - 4 GHz4 / 8 cores8 MB L3
Intel Core i7-7820HQ2.9 - 3.9 GHz4 / 8 cores8 MB L3
Intel Core i7-7820HK « 2.9 - 3.9 GHz4 / 8 cores8 MB L3
Intel Core i7-7700HQ2.8 - 3.8 GHz4 / 8 cores6 MB L3
Intel Core i5-75003.4 - 3.8 GHz4 / 4 cores6 MB L3
Intel Core i5-7440HQ2.8 - 3.8 GHz4 / 4 cores6 MB L3
Intel Core i7-7567U3.5 - 4 GHz2 / 4 cores4 MB L3
Intel Core i7-7660U2.5 - 4 GHz2 / 4 cores4 MB L3
Intel Core i7-7600U2.8 - 3.9 GHz2 / 4 cores4 MB L3
Intel Core i5-7300HQ2.5 - 3.5 GHz4 / 4 cores6 MB L3
Intel Core i5-7500T2.7 - 3.3 GHz4 / 4 cores6 MB L3
Intel Core i5-7287U3.3 - 3.7 GHz2 / 4 cores4 MB L3
Intel Core i7-7560U2.4 - 3.8 GHz2 / 4 cores4 MB L3
Intel Core i5-7267U3.1 - 3.5 GHz2 / 4 cores4 MB L3
Intel Core i5-7360U2.3 - 3.6 GHz2 / 4 cores4 MB L3
Intel Core i7-7500U2.7 - 3.5 GHz2 / 4 cores4 MB L3
Intel Core i5-7300U2.6 - 3.5 GHz2 / 4 cores3 MB L3
Intel Core i5-7260U2.2 - 3.4 GHz2 / 4 cores4 MB L3
Intel Core i5-7200U2.5 - 3.1 GHz2 / 4 cores3 MB L3
Intel Core i3-7100H3 GHz2 / 4 cores3 MB L3
Intel Core i3-7167U2.8 GHz2 / 4 cores3 MB L3
Intel Core i7-7Y751.3 - 3.6 GHz2 / 4 cores4 MB L3
Intel Core i5-7Y571.2 - 3.3 GHz2 / 4 cores4 MB L3
Intel Core i5-7Y541.2 - 3.2 GHz2 / 4 cores4 MB L3
Intel Core i3-7100U2.4 GHz2 / 4 cores3 MB L3
Intel Core m3-7Y321 - 3 GHz2 / 4 cores4 MB L3
Intel Pentium Gold 4415U2.3 GHz2 / 4 cores2 MB L3
Intel Core m3-7Y301 - 2.6 GHz2 / 4 cores4 MB L3
Intel Celeron 3965U2.2 GHz2 / 2 cores2 MB L3
Intel Core i3-7020U2.3 GHz2 / 4 cores3 MB L3
Intel Celeron 3867U1.8 GHz2 / 2 cores2 MB L3
Intel Celeron 3865U1.8 GHz2 / 2 cores2 MB L3
Intel Pentium Gold 4425Y1.7 GHz2 / 4 cores2 MB L3
Intel Pentium Gold 4415Y1.6 GHz2 / 4 cores2 MB L3
Intel Pentium Gold 4410Y1.5 GHz2 / 4 cores2 MB L3
Intel Celeron 3965Y1.5 GHz2 / 2 cores2 MB L3
Clock2700 - 3500 MHz2300 - 4000 MHz2900 - 3900 MHz
L1 Cache128 KB384 KB256 KB
L2 Cache512 KB3 MB1 MB
L3 Cache4 MB8 MB8 MB
Cores / Threads2 / 46 / 64 / 8
TDP15 Watt15 Watt45 Watt
Technology14 nm7 nm14 nm
max. Temp.100 °C105 °C100 °C
SocketBGA1356FP6
FeaturesDual-Channel DDR4 Memory Controller, HyperThreading, AVX, AVX2, Quick Sync, Virtualization, AES-NIDDR4-3200/LPDDR4-4266 RAM, PCIe 3, MMX, SSE, SSE2, SSE3, SSSE3, SSE4A, SSE4.1, SSE4.2, AVX, AVX2, BMI2, ABM, FMA, ADX, SMEP, SMAP, CPB, AES-NI, RDRAND, RDSEED, SHA, SMEDual-Channel DDR4 Memory Controller, HyperThreading, AVX, AVX2, Quick Sync, Virtualization, AES-NI
iGPUIntel HD Graphics 620 (300 - 1050 MHz)AMD Radeon RX Vega 6 (Ryzen 4000/5000) ( - 1500 MHz)Intel HD Graphics 630 (300 - 1150 MHz)
Architecturex86x86x86
$393 U.S.$378 U.S.
Announced
Manufacturerark.intel.com

Benchmarks

Performance Rating - CB R15 + R20 + 7-Zip + X265 + Blender + 3DM11 CPU - R5 4500U
30.5 pt (42%)
Cinebench R23 - Cinebench R23 Multi Core
5920 Points (5%)
Cinebench R23 - Cinebench R23 Single Core
1152 Points (49%)
Cinebench R20 - Cinebench R20 CPU (Single Core)
min: 424     avg: 445.8     median: 447.5 (50%)     max: 453 Points
Cinebench R20 - Cinebench R20 CPU (Multi Core)
min: 1843     avg: 2236     median: 2219 (5%)     max: 2530 Points
Cinebench R15 - Cinebench R15 CPU Multi 64 Bit
min: 265     avg: 338.4     median: 340 (2%)     max: 376 Points
min: 715     avg: 896     median: 892 (6%)     max: 1007 Points
min: 689     avg: 773     median: 770 (5%)     max: 867 Points
Cinebench R15 - Cinebench R15 CPU Single 64 Bit
min: 110     avg: 141.8     median: 144 (43%)     max: 149 Points
min: 156     avg: 172.8     median: 174 (52%)     max: 177 Points
min: 156     avg: 162.7     median: 162 (49%)     max: 171 Points
Cinebench R11.5 - Cinebench R11.5 CPU Multi 64 Bit
min: 3.4     avg: 3.7     median: 3.8 (5%)     max: 4.05 Points
min: 10.22     avg: 10.9     median: 10.9 (14%)     max: 11.6 Points
min: 8.34     avg: 8.6     median: 8.4 (11%)     max: 9.53 Points
Cinebench R11.5 - Cinebench R11.5 CPU Single 64 Bit
min: 1.35     avg: 1.6     median: 1.7 (41%)     max: 1.69 Points
min: 2.02     avg: 2     median: 2 (50%)     max: 2.04 Points
min: 1.69     avg: 1.8     median: 1.8 (46%)     max: 1.85 Points
Cinebench R10 - Cinebench R10 Rend. Single (32bit)
min: 4835     avg: 5605     median: 5647 (34%)     max: 5722 Points
min: 5319     avg: 5337     median: 5337 (32%)     max: 5355 Points
min: 6062     avg: 6231     median: 6182 (37%)     max: 6566 Points
Cinebench R10 - Cinebench R10 Rend. Multi (32bit)
min: 9726     avg: 11831     median: 11745.5 (9%)     max: 12981 Points
min: 22934     avg: 24156     median: 24155.5 (18%)     max: 25377 Points
min: 22793     avg: 23622     median: 23046.5 (17%)     max: 26081 Points
Cinebench R10 - Cinebench R10 Rend. Multi (64bit)
min: 14099     avg: 15061     median: 15362 (11%)     max: 15817 Points
38477 Points (27%)
min: 32769     avg: 34129.5     median: 34129.5 (24%)     max: 35490 Points
Cinebench R10 - Cinebench R10 Rend. Single (64bit)
min: 6047     avg: 7000     median: 7265 (9%)     max: 7305 Points
9139 Points (11%)
min: 8465     avg: 8558.5     median: 8558.5 (10%)     max: 8652 Points
wPrime 2.10 - wPrime 2.0 1024m *
min: 423.8     avg: 492.6     median: 485.8 (6%)     max: 602 s
min: 170.4     avg: 171.9     median: 171.9 (2%)     max: 173.4 s
min: 179.4     avg: 234.7     median: 214.3 (3%)     max: 330.9 s
wPrime 2.10 - wPrime 2.0 32m *
min: 13.11     avg: 14.3     median: 14 (3%)     max: 16.8 s
min: 5.7     avg: 7.8     median: 8.3 (2%)     max: 9.48 s
min: 6.668     avg: 10.4     median: 8.6 (2%)     max: 17.8 s
wPrime 1.55 - wPrime 1.55 1024m *
215.4 s (1%)
wPrime 1.55 - wPrime 1.55 32m *
17.8 s (9%)
WinRAR - WinRAR 4.0
min: 1983     avg: 2542     median: 2561 (4%)     max: 3011 Points
min: 3420     avg: 3493     median: 3493 (6%)     max: 3566 Points
min: 5114     avg: 5135     median: 5134.5 (8%)     max: 5155 Points
7-Zip 18.03 - 7-Zip 18.03 Multli Thread 4 runs
min: 22466     avg: 24384     median: 24101 (14%)     max: 25891 MIPS
7-Zip 18.03 - 7-Zip 18.03 Single Thread 4 runs
min: 4235     avg: 4290     median: 4288 (51%)     max: 4338 MIPS
X264 HD Benchmark 4.0 - x264 Pass 2
min: 20     avg: 22     median: 21.7 (8%)     max: 23.95 fps
59.3 fps (21%)
min: 46     avg: 46.9     median: 46.9 (16%)     max: 47.8 fps
X264 HD Benchmark 4.0 - x264 Pass 1
min: 109     avg: 118.7     median: 117 (27%)     max: 133.2 fps
210 fps (48%)
min: 177     avg: 178.8     median: 178.8 (41%)     max: 180.6 fps
HWBOT x265 Benchmark v2.2 - HWBOT x265 4k Preset
min: 5.86     avg: 6.8     median: 6.9 (12%)     max: 7.33 fps
TrueCrypt - TrueCrypt Serpent
min: 0.204     avg: 0.2     median: 0.2 (0%)     max: 0.222 GB/s
min: 0.511     avg: 0.5     median: 0.5 (0%)     max: 0.541 GB/s
min: 0.416     avg: 0.5     median: 0.4 (0%)     max: 0.609 GB/s
TrueCrypt - TrueCrypt Twofish
min: 0.323     avg: 0.4     median: 0.4 (6%)     max: 0.375 GB/s
min: 0.865     avg: 0.9     median: 0.9 (15%)     max: 0.922 GB/s
min: 0.71     avg: 0.7     median: 0.7 (13%)     max: 0.831 GB/s
TrueCrypt - TrueCrypt AES
min: 1.9     avg: 2.1     median: 2.1 (5%)     max: 2.2 GB/s
4.9 GB/s (13%)
min: 3.9     avg: 4.2     median: 4.2 (11%)     max: 4.3 GB/s
Blender - Blender 2.79 BMW27 CPU *
min: 533     avg: 603     median: 584 (4%)     max: 748 Seconds
R Benchmark 2.5 - R Benchmark 2.5 *
min: 0.614     avg: 0.6     median: 0.6 (14%)     max: 0.654 sec
3DMark 06 - CPU - 3DMark 06 - CPU
min: 3690     avg: 4423     median: 4579 (10%)     max: 4921 Points
min: 8933     avg: 8934     median: 8933.5 (19%)     max: 8934 Points
min: 7957     avg: 8098     median: 8038 (17%)     max: 8360 Points
Super Pi mod 1.5 XS 1M - Super Pi mod 1.5 XS 1M *
min: 10     avg: 10.8     median: 10.8 (2%)     max: 11.52 s
min: 10     avg: 10.3     median: 10.3 (2%)     max: 10.5 s
min: 9     avg: 9.6     median: 9.6 (2%)     max: 10.5 s
Super Pi mod 1.5 XS 2M - Super Pi mod 1.5 XS 2M *
min: 24.2     avg: 24.8     median: 24.8 (1%)     max: 25.3 s
24 s (1%)
min: 20.67     avg: 21.7     median: 21.5 (1%)     max: 23.5 s
Super Pi Mod 1.5 XS 32M - Super Pi mod 1.5 XS 32M *
min: 543     avg: 577     median: 575 (3%)     max: 615 s
min: 620     avg: 622     median: 622 (3%)     max: 624 s
min: 490.5     avg: 529     median: 535 (2%)     max: 550 s
3DMark Vantage - 3DM Vant. Perf. CPU no Physx
min: 11456     avg: 12603     median: 12732 (11%)     max: 13682 Points
30280 Points (27%)
3DMark 11 - 3DM11 Performance Physics
min: 2983     avg: 4494     median: 4538 (12%)     max: 5246 Points
min: 7061     avg: 8121     median: 8095 (22%)     max: 8704 Points
min: 9542     avg: 10034     median: 10019 (27%)     max: 10523 Points
3DMark - 3DMark Ice Storm Physics
min: 28860     avg: 39597     median: 40263 (33%)     max: 47877 Points
min: 61260     avg: 63475     median: 63892 (52%)     max: 65272 Points
min: 51307     avg: 53563     median: 52699.5 (43%)     max: 59600 Points
3DMark - 3DMark Ice Storm Extreme Physics
min: 28817     avg: 40062     median: 40419 (33%)     max: 46962 Points
min: 57910     avg: 62775     median: 63587.5 (52%)     max: 66013 Points
min: 50796     avg: 53623     median: 52515.5 (43%)     max: 59482 Points
3DMark - 3DMark Ice Storm Unlimited Physics
min: 41855     avg: 46680     median: 47434 (40%)     max: 49751 Points
min: 68588     avg: 69178     median: 69062 (58%)     max: 69884 Points
min: 51327     avg: 54058     median: 52784.5 (44%)     max: 60127 Points
3DMark - 3DMark Cloud Gate Physics
min: 296     avg: 3628     median: 3748 (9%)     max: 4143 Points
min: 6900     avg: 7494     median: 7616 (19%)     max: 7925 Points
min: 7905     avg: 8141     median: 8001.5 (20%)     max: 9050 Points
3DMark - 3DMark Fire Strike Standard Physics
min: 4005     avg: 5389     median: 5453 (10%)     max: 5882 Points
min: 9800     avg: 11318     median: 11477 (20%)     max: 12259 Points
min: 11041     avg: 11381     median: 11174 (20%)     max: 12592 Points
3DMark - 3DMark Time Spy CPU
min: 1508     avg: 1810     median: 1852 (8%)     max: 2060 Points
min: 3316     avg: 3759     median: 3734 (16%)     max: 4187 Points
min: 4259     avg: 4439     median: 4447 (19%)     max: 4568 Points
Geekbench 5.5 - Geekbench 5.1 - 5.4 64 Bit Single-Core
min: 1082     avg: 1109     median: 1097 (46%)     max: 1220 Points
Geekbench 5.5 - Geekbench 5.1 - 5.4 64 Bit Multi-Core
min: 4352     avg: 4774     median: 4632 (8%)     max: 6234 Points
Geekbench 5.0 - Geekbench 5.0 64 Bit Single-Core
1074 Points (5%)
Geekbench 5.0 - Geekbench 5.0 64 Bit Multi-Core
4282 Points (14%)
Geekbench 4.4 - Geekbench 4.1 - 4.4 64 Bit Single-Core
min: 4415     avg: 4440     median: 4440 (44%)     max: 4465 Points
min: 4486     avg: 4624     median: 4624 (46%)     max: 4762 Points
min: 4841     avg: 4897     median: 4896.5 (49%)     max: 4952 Points
Geekbench 4.4 - Geekbench 4.1 - 4.4 64 Bit Multi-Core
min: 8740     avg: 8762     median: 8762 (10%)     max: 8784 Points
min: 17798     avg: 18561     median: 18561 (20%)     max: 19324 Points
min: 15838     avg: 16002     median: 16001.5 (18%)     max: 16165 Points
Geekbench 4.0 - Geekbench 4.0 64 Bit Single-Core
min: 4033     avg: 4191     median: 4151 (56%)     max: 4375 Points
min: 4867     avg: 4905     median: 4904.5 (67%)     max: 4942 Points
Geekbench 4.0 - Geekbench 4.0 64 Bit Multi-Core
min: 7282     avg: 7983     median: 8070 (20%)     max: 8449 Points
min: 15042     avg: 15309     median: 15308.5 (37%)     max: 15575 Points
Geekbench 3 - Geekbench 3 32 Bit Multi-Core
min: 6872     avg: 7442     median: 7635 (14%)     max: 7835 Points
18690 Points (33%)
min: 14323     avg: 15088     median: 14476 (26%)     max: 16465 Points
Geekbench 3 - Geekbench 3 32 Bit Single-Core
min: 3211     avg: 3462     median: 3526 (69%)     max: 3706 Points
3960 Points (77%)
min: 3718     avg: 4002     median: 3926 (77%)     max: 4361 Points
Geekbench 3 - Geekbench 3 64 Bit Multi-Core
min: 7645     avg: 7946     median: 7945.5 (12%)     max: 8246 Points
19029 Points (30%)
14990 Points (23%)
Geekbench 3 - Geekbench 3 64 Bit Single-Core
min: 3587     avg: 3731     median: 3731 (56%)     max: 3875 Points
4162 Points (62%)
3885 Points (58%)
Geekbench 2 - 32 Bit - Geekbench Stream
6630 Points (53%)
Geekbench 2 - 32 Bit - Geekbench Memory
5771 Points (52%)
Geekbench 2 - 32 Bit - Geekbench Floating Point
20968 Points (41%)
Geekbench 2 - 32 Bit - Geekbench Integer
16596 Points (33%)
Geekbench 2 - 32 Bit - Geekbench Total Score
14964 Points (39%)
Mozilla Kraken 1.1 - Kraken 1.1 Total Score *
min: 960     avg: 1044     median: 1041.5 (1%)     max: 1283 ms
min: 819     avg: 851     median: 853 (1%)     max: 871 ms
min: 901     avg: 2277     median: 984 (1%)     max: 7545 ms
Sunspider - Sunspider 1.0 Total Score *
min: 69.7     avg: 82.7     median: 78 (1%)     max: 141.7 ms
99 ms (1%)
min: 68.3     avg: 138.2     median: 71.1 (1%)     max: 400.9 ms
Sunspider - Sunspider 0.9.1 Total Score *
90.9 ms (1%)
Octane V2 - Octane V2 Total Score
min: 28609     avg: 34302     median: 35028 (31%)     max: 37473 Points
min: 33759     avg: 43608     median: 48506 (44%)     max: 48558 Points
min: 35189     avg: 38766     median: 39000 (35%)     max: 40652 Points
WebXPRT 3 - WebXPRT 3 Score
min: 191     avg: 196.5     median: 197 (41%)     max: 202 Points
PCMark for Android - PCM f. Android Work Score
242 Points (1%)
CrossMark - CrossMark Overall
816 Points (31%)
Power Consumption - Prime95 Power Consumption - external Monitor *
min: 28.8     avg: 42     median: 43 (7%)     max: 53 Watt
Power Consumption - Cinebench R15 Multi Power Consumption - external Monitor *
min: 26.8     avg: 37.8     median: 30.7 (6%)     max: 53 Watt
Power Consumption - Cinebench R15 Multi Power Efficiency - external Monitor
min: 16.5     avg: 24.7     median: 25.3 (19%)     max: 31.7 Points per Watt

Average Benchmarks Intel Core i7-7500U → 100% n=36

Average Benchmarks AMD Ryzen 5 4500U → 170% n=36

Average Benchmarks Intel Core i7-7820HK → 156% n=36

- Range of benchmark values for this graphics card
- Average benchmark values for this graphics card
* Smaller numbers mean a higher performance
1 This benchmark is not used for the average calculation

v1.26
log 02. 07:57:46

#0 checking url part for id 8149 +0s ... 0s

#1 checking url part for id 11687 +0s ... 0s

#2 checking url part for id 8415 +0s ... 0s

#3 not redirecting to Ajax server +0s ... 0s

#4 did not recreate cache, as it is less than 5 days old! Created at Sat, 01 Jun 2024 05:37:57 +0200 +0.001s ... 0.001s

#5 composed specs +0.064s ... 0.065s

#6 did output specs +0s ... 0.065s

#7 getting avg benchmarks for device 8149 +0.004s ... 0.069s

#8 got single benchmarks 8149 +0.259s ... 0.328s

#9 getting avg benchmarks for device 11687 +0.018s ... 0.347s

#10 got single benchmarks 11687 +0.068s ... 0.414s

#11 getting avg benchmarks for device 8415 +0.003s ... 0.418s

#12 got single benchmarks 8415 +0.076s ... 0.494s

#13 got avg benchmarks for devices +0s ... 0.494s

#14 No cached benchmark found, getting uncached values +0.12s ... 0.614s

#15 No cached benchmark found, getting uncached values +0.011s ... 0.625s

#16 No cached benchmark found, getting uncached values +0.169s ... 0.795s

#17 min, max, avg, median took s +0.304s ... 1.099s

#18 return log +0s ... 1.099s

Please share our article, every link counts!
> Expert Reviews and News on Laptops, Smartphones and Tech Innovations > Benchmarks / Tech > Processor Comparison - Head 2 Head
Redaktion, 2017-09- 8 (Update: 2023-07- 1)