

NVIDIA GeForce RTX 4070 SUPER vs AMD Radeon 660M vs NVIDIA GeForce RTX 4070 Ti SUPER
NVIDIA GeForce RTX 4070 SUPER
► remove from comparison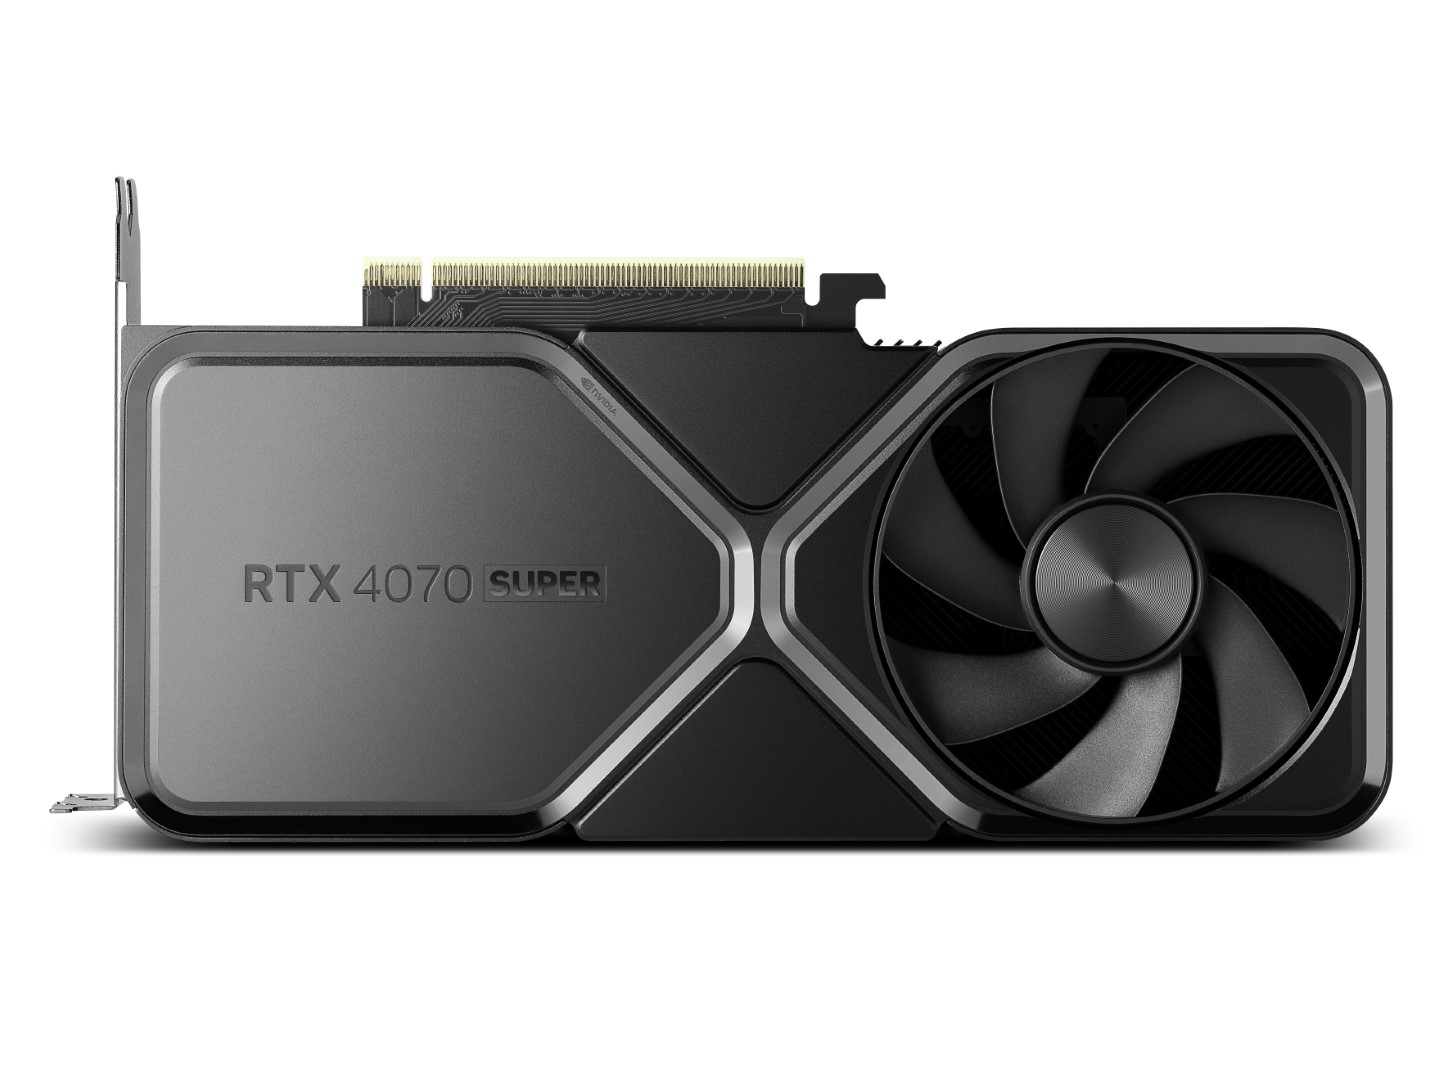
The Nvidia GeForce RTX 4070 SUPER is a high-end desktop graphics card based on the Ada Lovelace architecture. It uses the AD104 chip and offers 7,168 cores and 12 GB GDDR6X graphics memory (192-bit bus with 21 Gbits).
The performance of the RTX 4070S lies between the older RTX 4070 and RTX 4070 Ti in the top class of high-end GPUs in 2024. Compared to AMD GPUs, the 4070 Super is similar fast as the AMD Radeon RX 7800 XT. This makes the GPU best suited for QHD and maximum details of demanding games (such as Avatar Frontiers of Pandora, Allan Wake 2, Cyberpunk 2033 or F1 23). Less demanding games can also be played smoothly in 4K (AC Mirage, Cod MW 3, ...).
The AD104 chip is produced at TSMC in 5 nm (4N with EUV) and is specified with a TGP (Total Graphics Power) of 200 watts.
AMD Radeon 660M
► remove from comparison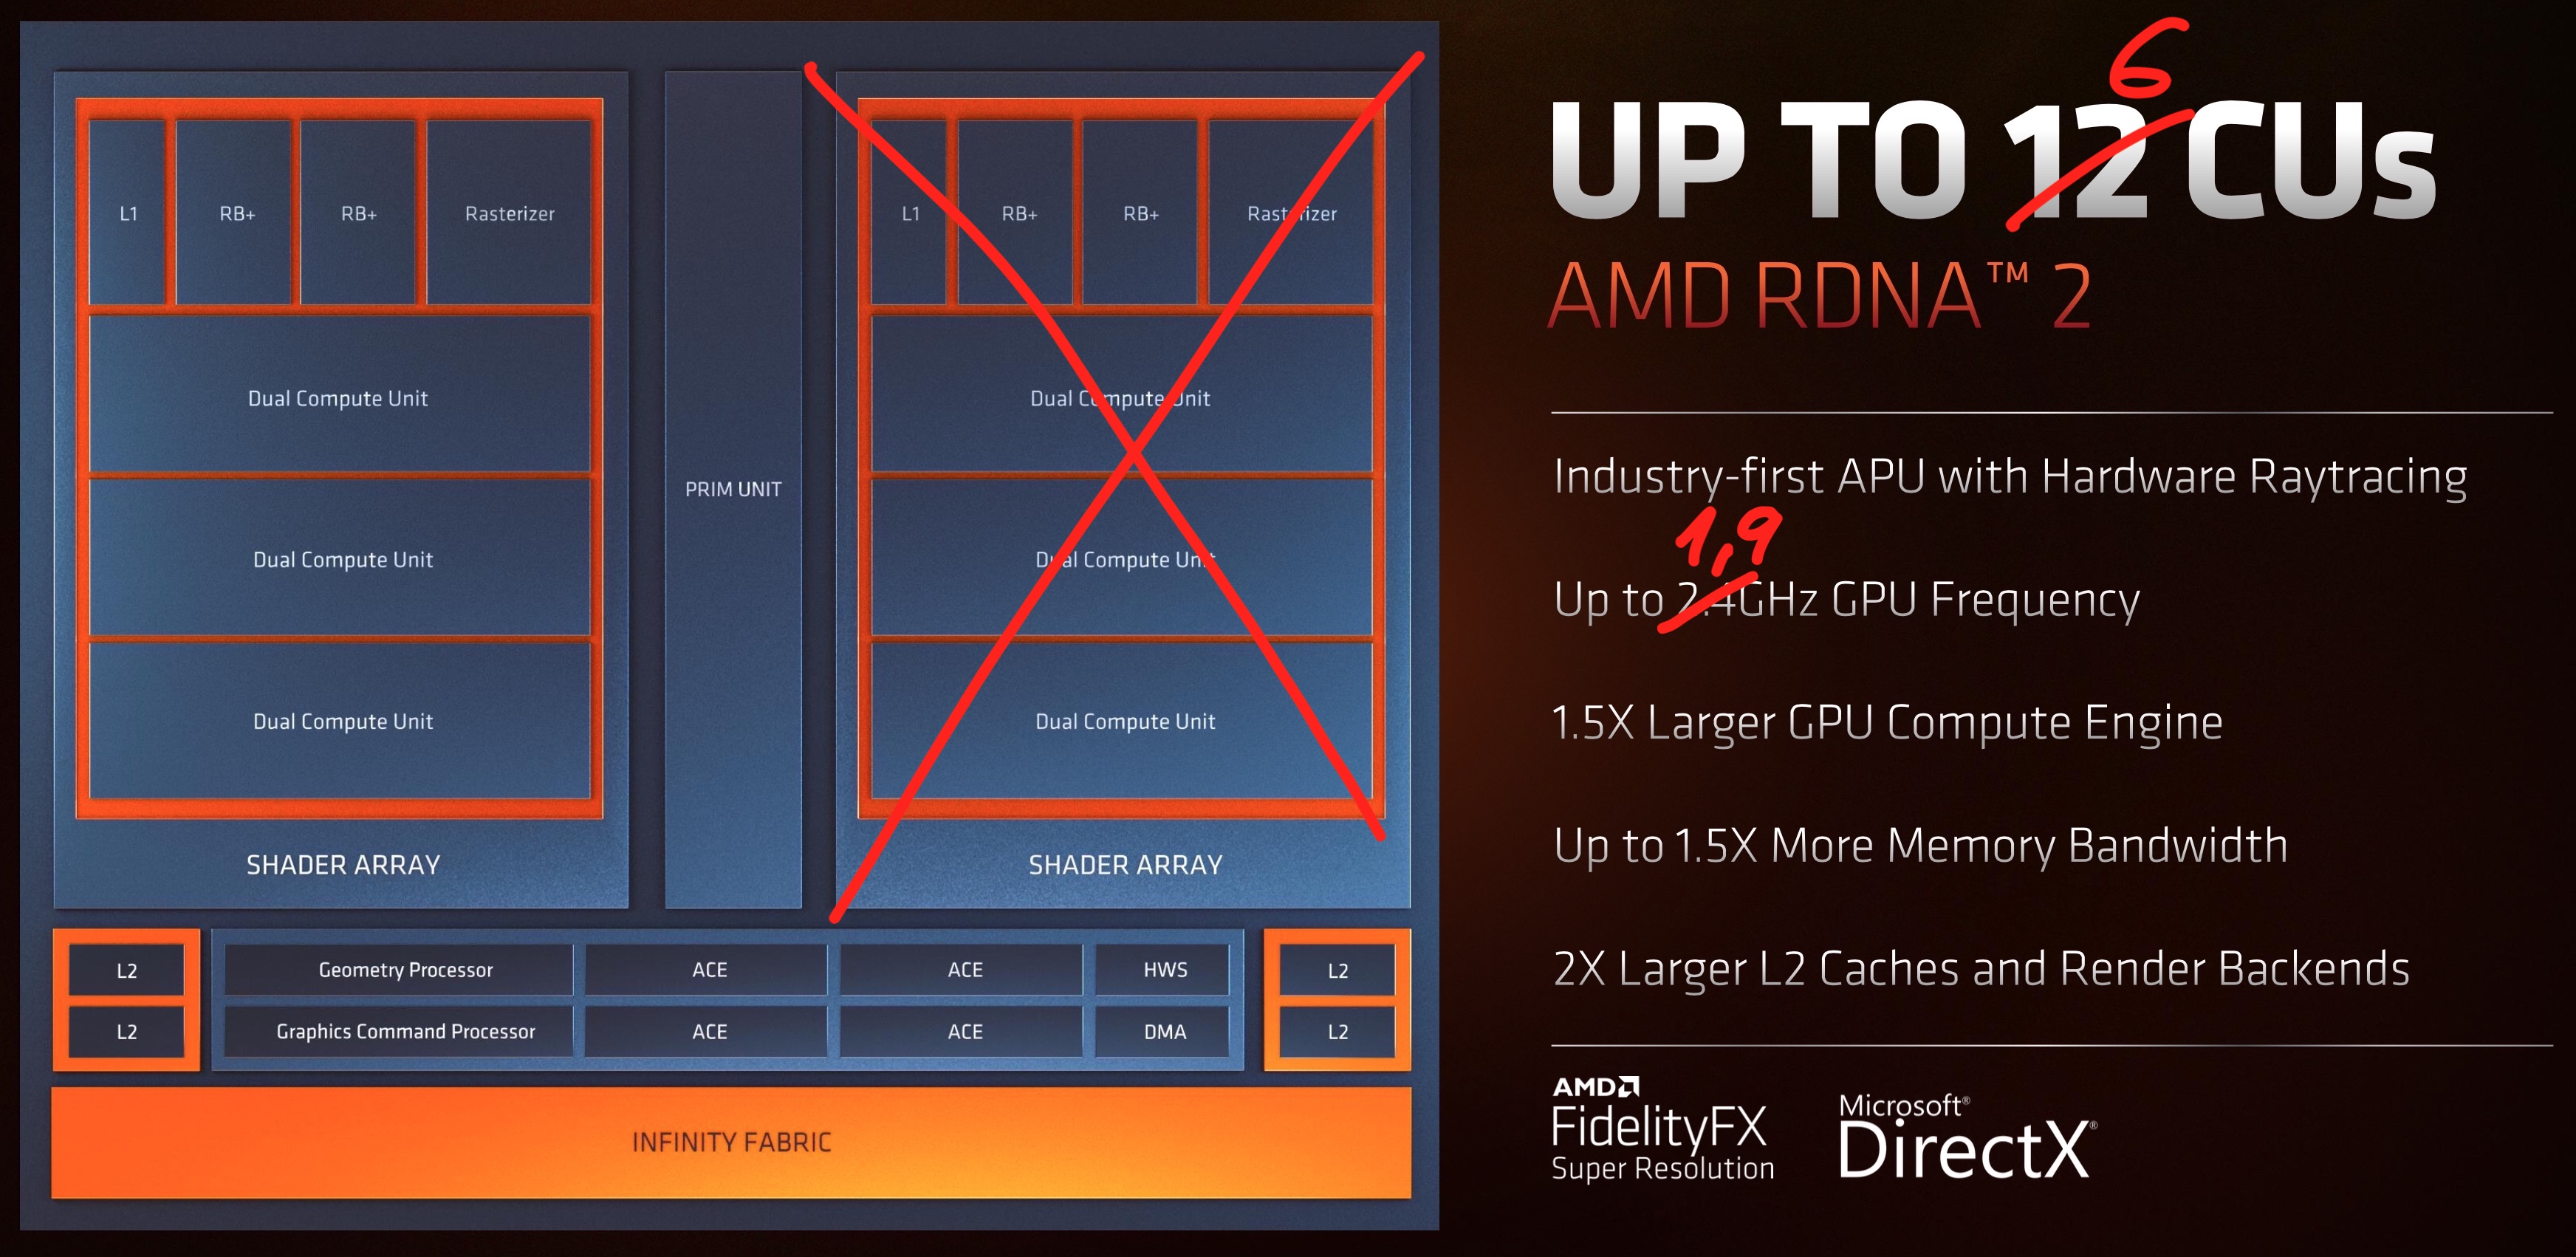
The AMD Radeon 660M is an integrated GPU in the entry level Ryzen 6000 series for laptops (Rembrandt, e.g. Ryzen 5 6600U). The GPU is based on the RDNA2 architecture and has 6 of the 12 CUs (= 384 shaders) clocked at up to 1,900 MHz (depending on the CPU model). The 680M and 660M iGPUs are the first integrated graphics card with hardware raytracing support, although the performance is too slow to use it in current games.
Due to the halved CU count and lower core clock, the Radeon 660M is clearly slower than the Radeon 680M and most likely only on par with the old Radeon Vega 8 iGPUs.
Thanks to the modern 6nm process and clever power-saving features, the power consumption is comparatively low (according to AMD), so the graphics card can also be used for slim and light notebooks (depending on the CPU model).
NVIDIA GeForce RTX 4070 Ti SUPER
► remove from comparison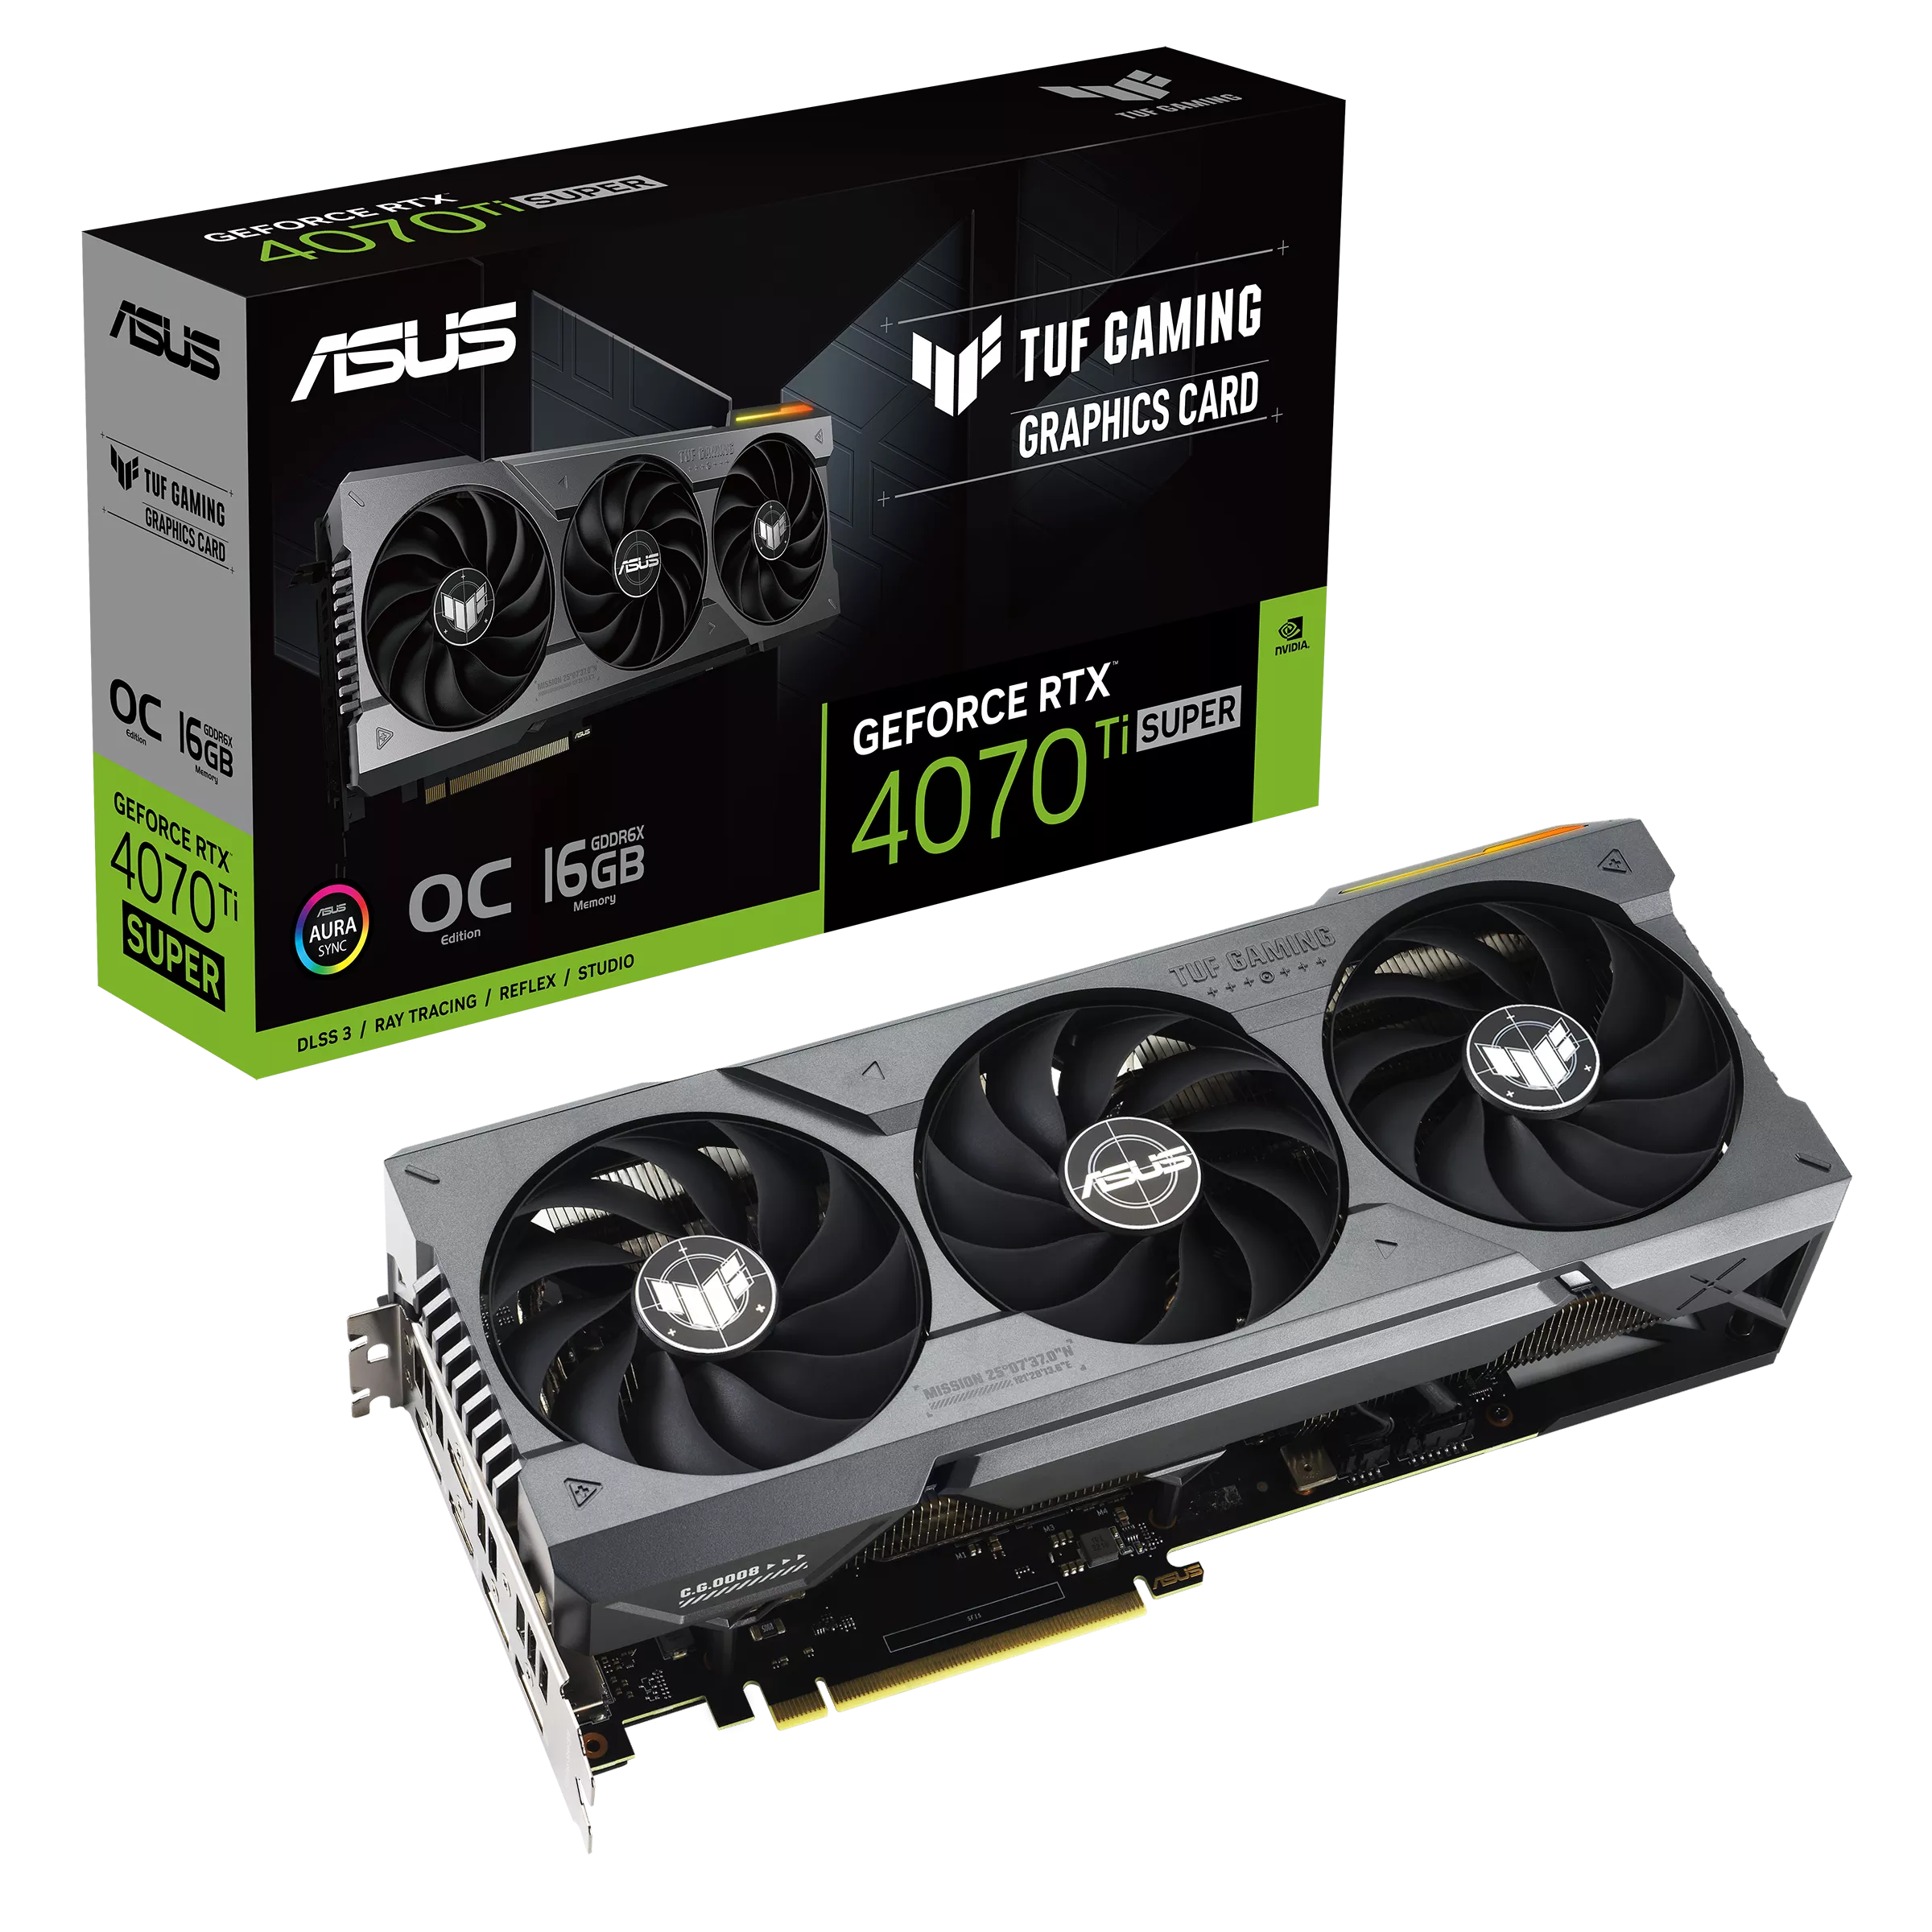
The Nvidia GeForce RTX 4070 Ti SUPER is a high-end desktop graphics card based on the Ada Lovelace architecture. It uses the AD103 chip and offers 8.448 cores and 16 GB GDDR6X graphics memory (256-bit bus with 22.4 Gbits).
Performance
The gaming performance is still sufficient for 4k with ultra settings, even in demanding games such as Cyberpunk, but 60 fps is no longer always achieved. With ray tracing, the use of DLSS and possibly reducing the resolution is recommended. In a competitive comparison, the SUPER variant ranks, as expected, between the RTX 4080 and the old 4070 Ti in a competitive comparison.
Power consumption
The AD103 chip is produced at TSMC in 5nm (4N with EUV) and is specified with a TGP (Total Graphics Power) of 285 watts.
| NVIDIA GeForce RTX 4070 SUPER | AMD Radeon 660M | NVIDIA GeForce RTX 4070 Ti SUPER | |||||||||||||||||||||||||||||||||||||||||||||||||||||||||||||||||||||||||
| GeForce RTX 4000 Series |
|
|
| ||||||||||||||||||||||||||||||||||||||||||||||||||||||||||||||||||||||||
| Codename | AD104 | RDNA 2 Rembrandt | AD103-275 | ||||||||||||||||||||||||||||||||||||||||||||||||||||||||||||||||||||||||
| Architecture | Ada Lovelace | RDNA 2 | Ada Lovelace | ||||||||||||||||||||||||||||||||||||||||||||||||||||||||||||||||||||||||
| Pipelines | 7168 - unified | 384 - unified | 8448 - unified | ||||||||||||||||||||||||||||||||||||||||||||||||||||||||||||||||||||||||
| TMUs | 224 | 264 | |||||||||||||||||||||||||||||||||||||||||||||||||||||||||||||||||||||||||
| ROPs | 80 | 96 | |||||||||||||||||||||||||||||||||||||||||||||||||||||||||||||||||||||||||
| Raytracing Cores | 56 | 66 | |||||||||||||||||||||||||||||||||||||||||||||||||||||||||||||||||||||||||
| Tensor / AI Cores | 224 | 264 | |||||||||||||||||||||||||||||||||||||||||||||||||||||||||||||||||||||||||
| Core Speed | 1980 - 2475 (Boost) MHz | 1900 (Boost) MHz | 2340 - 2610 (Boost) MHz | ||||||||||||||||||||||||||||||||||||||||||||||||||||||||||||||||||||||||
| Theoretical Performance | 35.5 TFLOPS FP16, 35.5 TFLOPS FP32, 0.55 TFLOPS FP64 | 40.1 TFLOPS FP16, 40.1 TFLOPS FP32, 0.63 TFLOPS FP64 | |||||||||||||||||||||||||||||||||||||||||||||||||||||||||||||||||||||||||
| Cache | L2: 48 MB | L2: 48 MB | |||||||||||||||||||||||||||||||||||||||||||||||||||||||||||||||||||||||||
| Memory Speed | 21000 effective = 1313 MHz | 21000 effective = 1400 MHz | |||||||||||||||||||||||||||||||||||||||||||||||||||||||||||||||||||||||||
| Memory Bus Width | 192 Bit | 256 Bit | |||||||||||||||||||||||||||||||||||||||||||||||||||||||||||||||||||||||||
| Memory Type | GDDR6X | GDDR6X | |||||||||||||||||||||||||||||||||||||||||||||||||||||||||||||||||||||||||
| Max. Amount of Memory | 12 GB | 16 GB | |||||||||||||||||||||||||||||||||||||||||||||||||||||||||||||||||||||||||
| Shared Memory | no | no | no | ||||||||||||||||||||||||||||||||||||||||||||||||||||||||||||||||||||||||
| Memory Bandwidth | 504.2 GB/s | ||||||||||||||||||||||||||||||||||||||||||||||||||||||||||||||||||||||||||
| API | DirectX 12 Ultimate, Shader 6.7, OpenGL 4.6, OpenCL 3.0, Vulkan 1.3 | DirectX 12_1 | DirectX 12 Ultimate, Shader 6.7, OpenGL 4.6, OpenCL 3.0, Vulkan 1.3 | ||||||||||||||||||||||||||||||||||||||||||||||||||||||||||||||||||||||||
| Power Consumption | 220 Watt | 45 Watt | 285 Watt | ||||||||||||||||||||||||||||||||||||||||||||||||||||||||||||||||||||||||
| Transistors | 35.8 Billion | 45.9 Billion | |||||||||||||||||||||||||||||||||||||||||||||||||||||||||||||||||||||||||
| Die Size | 295 mm² | 379 mm² | |||||||||||||||||||||||||||||||||||||||||||||||||||||||||||||||||||||||||
| technology | 5 nm | 6 nm | 5 nm | ||||||||||||||||||||||||||||||||||||||||||||||||||||||||||||||||||||||||
| PCIe | 4.0 x16 | 4.0 x16 | |||||||||||||||||||||||||||||||||||||||||||||||||||||||||||||||||||||||||
| Displays | 4 Displays (max.), HDMI 2.1, DisplayPort 1.4a | 4 Displays (max.), HDMI 2.1, DisplayPort 1.4a | |||||||||||||||||||||||||||||||||||||||||||||||||||||||||||||||||||||||||
| Date of Announcement | 17.01.2024 | 04.01.2022 | 24.01.2024 | ||||||||||||||||||||||||||||||||||||||||||||||||||||||||||||||||||||||||
| Predecessor | NVIDIA GeForce RTX 4070 | NVIDIA GeForce RTX 4070 Ti | |||||||||||||||||||||||||||||||||||||||||||||||||||||||||||||||||||||||||
| Features | Tiled Rasterization, Shared Memory (up to Dual-Channel DDR4-3200) |
| ||||||||||||||||||||||||||
Benchmarks
3DM Vant. Perf. total + AMD Radeon 660M
specvp12 sw-03 + AMD Radeon 660M
Cinebench R15 OpenGL 64 Bit + AMD Radeon 660M
GFXBench T-Rex HD Offscreen C24Z16 + AMD Radeon 660M
Average Benchmarks NVIDIA GeForce RTX 4070 SUPER → 100% n=16
Average Benchmarks AMD Radeon 660M → 14% n=16
Average Benchmarks NVIDIA GeForce RTX 4070 Ti SUPER → 106% n=16
* Smaller numbers mean a higher performance
1 This benchmark is not used for the average calculation
Game Benchmarks
The following benchmarks stem from our benchmarks of review laptops. The performance depends on the used graphics memory, clock rate, processor, system settings, drivers, and operating systems. So the results don't have to be representative for all laptops with this GPU. For detailed information on the benchmark results, click on the fps number.

Black Myth: Wukong
2024
F1 24
2024


Alan Wake 2
2023


Baldur's Gate 3
2023
F1 23
2023
Diablo 4
2023

Dead Island 2
2023
The Last of Us
2023

Company of Heroes 3
2023
Sons of the Forest
2023
Atomic Heart
2023
Returnal
2023
Hogwarts Legacy
2023
The Witcher 3 v4
2023
High On Life
2023


The Quarry
2022
F1 22
2022
Vampire Bloodhunt
2022
Ghostwire Tokyo
2022

Cyberpunk 2077 1.6
2022
Elex 2
2022
GRID Legends
2022
Elden Ring
2022
Dying Light 2
2022

God of War
2022
Halo Infinite
2021
Farming Simulator 22
2021
Forza Horizon 5
2021
Riders Republic
2021

Back 4 Blood
2021
Far Cry 6
2021
Alan Wake Remastered
2021
Deathloop
2021
F1 2021
2021
Days Gone
2021


Outriders
2021
Hitman 3
2021
Yakuza Like a Dragon
2020

Dirt 5
2020
Watch Dogs Legion
2020
Star Wars Squadrons
2020

Serious Sam 4
2020
Crysis Remastered
2020

Death Stranding
2020
F1 2020
2020
Gears Tactics
2020
Doom Eternal
2020
Hunt Showdown
2020
Borderlands 3
2019
Control
2019
Far Cry New Dawn
2019
Metro Exodus
2019

Strange Brigade
2018
Far Cry 5
2018
X-Plane 11.11
2018
Dota 2 Reborn
2015
The Witcher 3
2015
GTA V
2015Average Gaming NVIDIA GeForce RTX 4070 SUPER → 100%
Average Gaming 30-70 fps → 100%
Average Gaming AMD Radeon 660M → 13%
Average Gaming 30-70 fps → 15%
Average Gaming NVIDIA GeForce RTX 4070 Ti SUPER → 107%
Average Gaming 30-70 fps → 119%
| NVIDIA GeForce RTX 4070 SUPER | AMD Radeon 660M | NVIDIA GeForce RTX 4070 Ti SUPER | |||||||||||||||||||
|---|---|---|---|---|---|---|---|---|---|---|---|---|---|---|---|---|---|---|---|---|---|
| low | med. | high | ultra | QHD | 4K | low | med. | high | ultra | QHD | 4K | low | med. | high | ultra | QHD | 4K | ||||
| Black Myth: Wukong | 26 | ||||||||||||||||||||
| Avatar Frontiers of Pandora | 137.4 | 126 | 99 | 65 | 34 | 163 | 141.8 | 113.2 | 76.6 | 39.8 | |||||||||||
| Call of Duty Modern Warfare 3 2023 | 226 | 182 | 166 | 119 | 71 | 227 | 184 | 179 | 133 | 84 | |||||||||||
| Alan Wake 2 | 112.8 | 110 | 77 | 41 | 124.7 | 114.4 | 82.5 | 44.7 | |||||||||||||
| Assassin's Creed Mirage | 205 | 199 | 163 | 126 | 75 | 221 | 206 | 170 | 136 | 84 | |||||||||||
| Cyberpunk 2077 2.2 Phantom Liberty | 186 | 181.8 | 159 | 139 | 87 | 39 | 20 | 15 | 11 | 9 | 188.5 | 188.5 | 170.8 | 150.3 | 94.9 | 43 | |||||
| Baldur's Gate 3 | 228 | 201 | 199 | 142 | 72 | 20 | 14 | 12 | 12 | 246 | 223 | 218 | 157.8 | 117.2 | |||||||
| F1 23 | 381 | 402 | 351 | 124 | 80 | 40 | 49.6 | 42.7 | 29.2 | 385 | 402 | 363 | 138.2 | 90 | 45.1 | ||||||
| The Callisto Protocol | 207.97 | 209 | 153 | 121 | 76 | 26.7 | 18.5 | 17.9 | 10.3 | 210.62 | 202.94 | 149.39 | 114.82 | 70.04 | |||||||
| F1 22 | 372 | 395 | 331 | 133 | 86 | 43 | 48 | 43 | 30 | 6 | 371 | 384 | 336 | 144.9 | 95.1 | 48.9 | |||||
| Ghostwire Tokyo | 285 | 282 | 285 | 192 | 90 | 21 | 24 | 23.9 | 278 | 282 | 283 | 217 | 99.2 | ||||||||
| Cyberpunk 2077 1.6 | 195.7 | 184.1 | 159 | 144 | 92 | 44 | 24 | 20 | 14 | 196.9 | 195.9 | 172.3 | 157.5 | 103.6 | 49.7 | ||||||
| Dying Light 2 | 201 | 154 | 109 | 54 | 19.7 | 15.4 | 12.4 | 213 | 162.2 | 121.5 | 63.7 | ||||||||||
| Far Cry 6 | 206 | 188 | 159 | 143 | 81 | 54 | 23 | 20 | 18.3 | 209 | 191 | 169 | 154 | 91 | |||||||
| Watch Dogs Legion | 169.2 | 159.1 | 139 | 108 | 62 | 49 | 26 | 22 | 171.2 | 159.3 | 144.2 | 115.9 | 68.6 | ||||||||
| Mafia Definitive Edition | 233 | 221 | 159 | 82 | 48.2 | 20.7 | 19.1 | 239 | 231 | 181 | 96.6 | ||||||||||
| Borderlands 3 | 193.6 | 182 | 165 | 128 | 68 | 49 | 20.5 | 13.6 | 10.7 | 192.1 | 176.8 | 169.6 | 143.6 | 79.4 | |||||||
| Control | 224 | 176 | 114 | 58 | 226 | 196.9 | 130.3 | 66.4 | |||||||||||||
| Metro Exodus | 267 | 224 | 182 | 148 | 118 | 74 | 48 | 18.8 | 14.4 | 11.2 | 236 | 193.5 | 158.3 | 130.9 | 84.4 | ||||||
| Shadow of the Tomb Raider | 265 | 259 | 250 | 177 | 94 | 73 | 26 | 22 | 18 | 273 | 269 | 256 | 205 | 109.5 | |||||||
| Strange Brigade | 586 | 434 | 428 | 381 | 265 | 132 | 106 | 39 | 31 | 26 | 568 | 467 | 442 | 407 | 306 | 161.9 | |||||
| Far Cry 5 | 203 | 200 | 190 | 183 | 103 | 58 | 28 | 25 | 23 | 203 | 197 | 188 | 187 | 119 | |||||||
| X-Plane 11.11 | 230 | 196 | 152 | 130 | 44 | 32 | 28 | 224 | 196.7 | 150 | 127.8 | ||||||||||
| Final Fantasy XV Benchmark | 240 | 235 | 196 | 149 | 85 | 43 | 21 | 15 | 235 | 235 | 209 | 168.8 | 98.9 | ||||||||
| Dota 2 Reborn | 247 | 229 | 222 | 209 | 197 | 115 | 91 | 57 | 49 | 245 | 228 | 226 | 202 | 203 | |||||||
| The Witcher 3 | 566 | 412 | 201 | 154 | 133 | 78 | 49 | 24 | 15 | 558 | 430 | 210 | 159.3 | ||||||||
| GTA V | 188 | 188 | 187 | 159 | 148 | 166 | 120 | 105 | 34 | 15 | 187.6 | 187.6 | 187.4 | 160.1 | 155.3 | 182.1 | |||||
| NVIDIA GeForce RTX 4070 SUPER | AMD Radeon 660M | NVIDIA GeForce RTX 4070 Ti SUPER | |||||||||||||||||||
| low | med. | high | ultra | QHD | 4K | low | med. | high | ultra | QHD | 4K | low | med. | high | ultra | QHD | 4K | < 30 fps < 60 fps < 120 fps ≥ 120 fps | 10 | 1 25 | 1 25 | 1 19 | 11 13 | 8 13 5 | < 30 fps < 60 fps < 120 fps ≥ 120 fps | 6 10 4 1 | 14 5 2 | 17 4 | 12 1 | | | < 30 fps < 60 fps < 120 fps ≥ 120 fps | 9 | 26 | 1 25 | 1 19 | 8 16 | 1 6 15 4 |
For more games that might be playable and a list of all games and graphics cards visit our Gaming List