NVIDIA GeForce GTX 1650 (Desktop) vs AMD Radeon RX Vega M GL / 870 vs NVIDIA GeForce GTX 1650 Ti Max-Q
NVIDIA GeForce GTX 1650 (Desktop) ► remove from comparison
The Nvidia GeForce GTX 1650 for desktop PCs is a graphics card that is based on the Turing architecture (TU117 chip). Compared to the faster RTX 2000 GPUs (e.g. RTX 2060 ), the 1650 integrates no Raytracing or Tensor cores. The performance should be slightly faster than the old GeForce GTX 1050 Ti . Although, the mobile variant of the GTX1650 uses the same name, it is a bit slower due to lower clock rates.
The Turing generation did not only introduce raytracing for the RTX cards, but also optimized the architecture of the cores and caches. According to Nvidia the CUDA cores offer now a concurrent execution of floating point and integer operations for increased performance in compute-heavy workloads of modern games. Furthermore, the caches were reworked (new unified memory architecture with twice the cache compared to Pascal). This leads to 50% more instructions per clock and a 40% more power efficient usage compared to Pascal.
Compared to the bigger Turing chips (like the TU116 of the GTX 1660 Ti and the RTX lineup), the TU117 does not include the new NVENC encoder but an older one similar to the one used in Pascal and Volta.
The power consumption of the 1650 is specified at 75 Watt TGP (Total Graphics Power) by Nvidia. The TU117 chip is manufactured in 12nm FFN at TSMC.
AMD Radeon RX Vega M GL / 870 ► remove from comparison
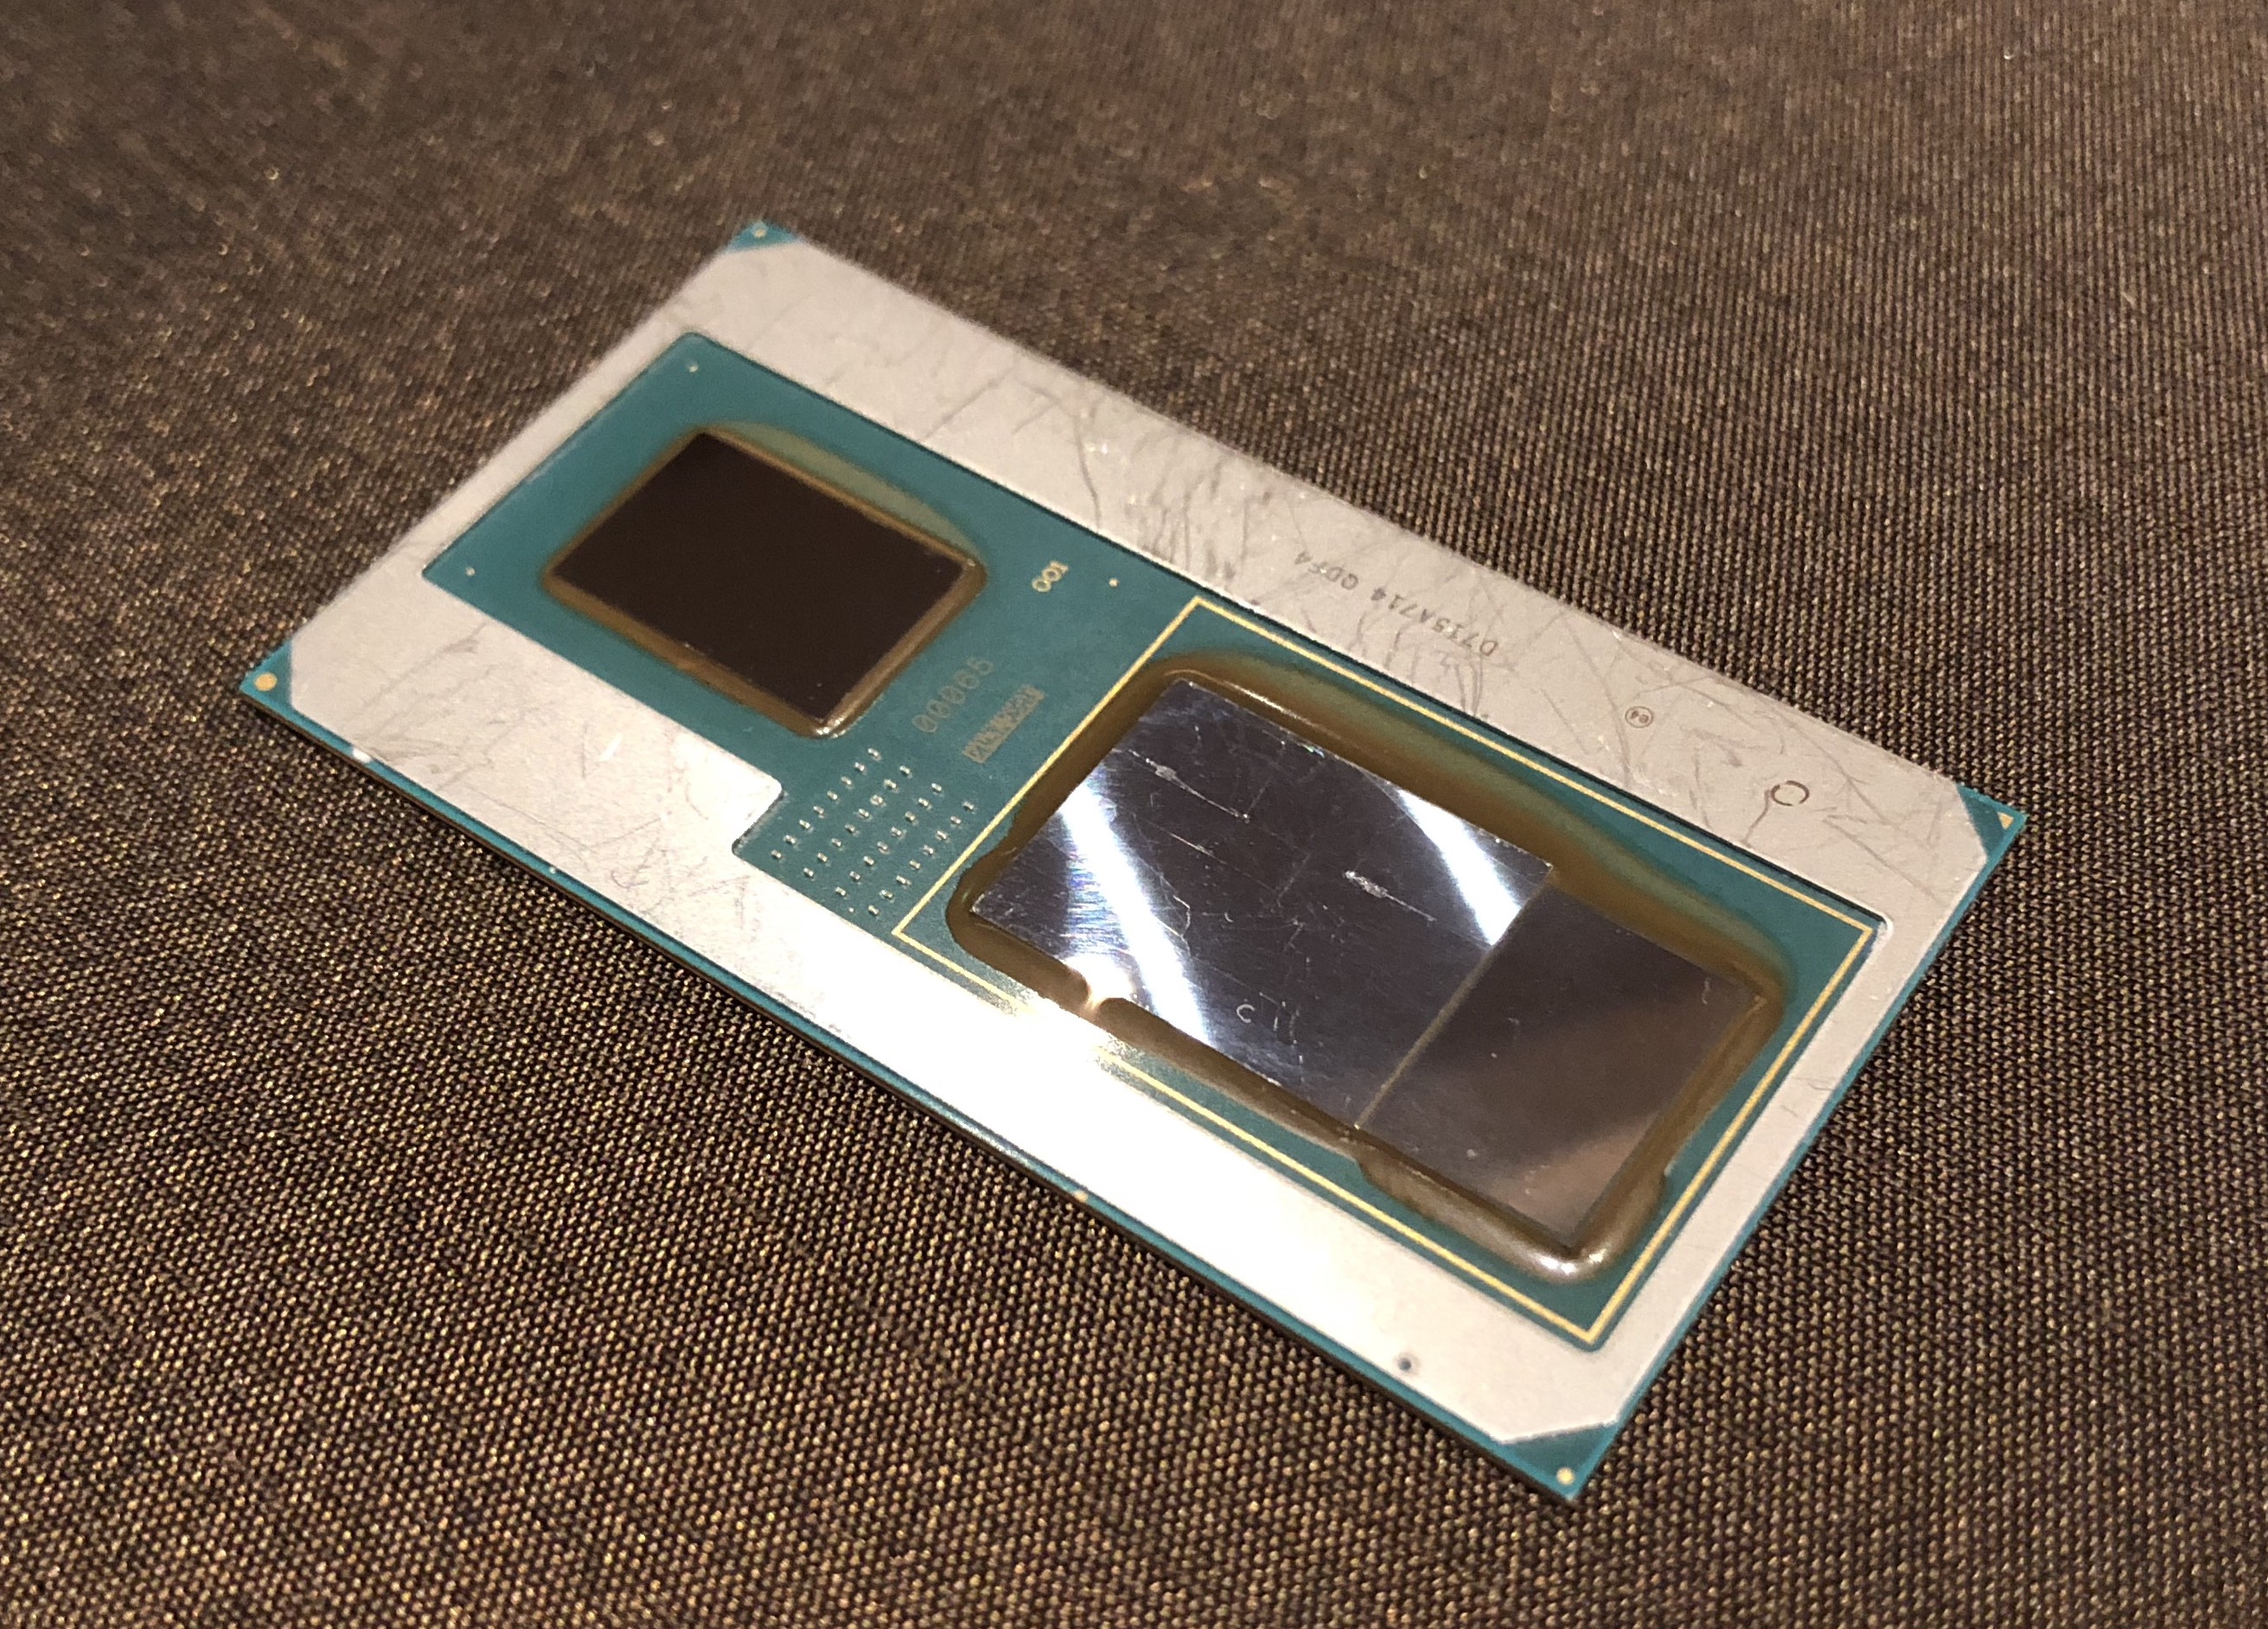
The AMD Radeon RX Vega M GL or Radeon RX Vega 870 (according to Dell) is an integrated GPU in the slower Intel Kaby-Lake-G SoC. It combines a Kaby-Lake processor, a Vega graphics card and 4 GB HBM2 memory on a single package. The graphics card offers 20 CUs (1280 shaders) and is clocked from 931 - 1011 MHz.
Currently it looks like the GPU is a mixture of Polaris (Shaders?) and Vega (HBM memory controller at least). E.g. the graphics card is called Polaris 22 internally. Detailed information on the Vega architecture can be found in our dedicated article about the Raven Ridge architecture .
The performance of the Vega M GL should be between the Nvidia GeForce GTX 1050 and 1050 Ti according to benchmarks from Intel. Therefore, it should be well suited for 1080p and high resolution gaming.
The power consumption should be quite similar to a dedicated Vega Mobile GPU, but due to the small form factor, smaller laptops can be built with the Kaby-Lake-G SoC. The TDP is specified at 65 Watt for the whole package including GPU, CPU and HBM2 memory.
NVIDIA GeForce GTX 1650 Ti Max-Q ► remove from comparison
The Nvidia GeForce GTX 1650 Ti Max-Q (N18P-G62) is a dedicated mid range graphics card for laptops based on the Turing architecture. The Max-Q variant is the power saving version of the mobile GTX 1650Ti with reduced clock speeds, performance and of course power consumption. It is using the same TU117 chip with 1,024 shaders. Therefore, it is intended for thin and light gaming laptops. Compared to the faster RTX 2000 GPUs (e.g. RTX 2060 ), the 1650 Ti integrates no Raytracing or Tensor cores.
There are two variants of the 1650Ti Max-Q, one with 35 Watt and 1035 - 1200 MHz and a faster 40 Watt version with a clock speed of 1200 - 1365 MHz. Both however are significantly lower clocked than the normal Max-P version with 50 / 55 Watt and 1350-1385 MHz. The memory is most likely clocked at 1250 MHz = 10,000 MHz effective (Gbps) in most laptops, although there might be versions with 1500 MHz = 12,000 Gbps.
The Turing generation did not only introduce raytracing for the RTX cards, but also optimized the architecture of the cores and caches. According to Nvidia the CUDA cores offer now a concurrent execution of floating point and integer operations for increased performance in compute-heavy workloads of modern games. Furthermore, the caches were reworked (new unified memory architecture with twice the cache compared to Pascal). This leads to 50% more instructions per clock and a 40% more power efficient usage compared to Pascal.
Compared to the bigger Turing chips (like the TU116 of the GTX 1660 Ti and the RTX lineup), the TU117 does not include the new NVENC encoder but an older one similar to the one used in Pascal and Volta.
The power consumption of the 1650 Ti Max-Q laptops is specified at 35 Watt TGP (Total Graphics Power) by Nvidia and therefore 25 Watt lower than the mobile GTX 1650 Ti in the same package (other variants can reach up to 80 Watt).
NVIDIA GeForce GTX 1650 (Desktop) AMD Radeon RX Vega M GL / 870 NVIDIA GeForce GTX 1650 Ti Max-Q GeForce GTX 1600 Series Architecture Turing Vega Turing Pipelines 896 - unified 1280 - unified 1024 - unified Core Speed 1485 - 1665 (Boost) MHz 931 - 1011 (Boost) MHz 1035 - 1200 (Boost) MHz Memory Speed 8000 MHz 10000 MHz Memory Bus Width 128 Bit 128 Bit Memory Type GDDR5 HBM2 GDDR6 Max. Amount of Memory 4 GB 4 GB 4 GB Shared Memory no no no API DirectX 12_1, Shader 6.4, OpenGL 4.6 DirectX 12_1 DirectX 12_1, OpenGL 4.6 Power Consumption 75 Watt 65 Watt 35 Watt technology 12 nm 14 nm 12 nm Date of Announcement 23.04.2019 07.01.2018 02.04.2020 Link to Manufacturer Page www.nvidia.com www.nvidia.com Codename Vega Kaby Lake-G N18P-G62 Max-Q Features Tiled Rasterization, Shared Memory (up to Dual-Channel DDR4-2400) Notebook Size medium sized medium sized
Benchmarks Performance Rating - 3DMark 11 + Fire Strike + Time Spy - GeForce GTX 1650 (Desktop)
4.2 pt (13%)
...
NVIDIA GeForce GTX 1650 (Desktop)
Intel Arc A380
...
Performance Rating - 3DMark 11 + Fire Strike + Time Spy - Vega M GL / 870
3.3 pt (10%)
...
AMD Radeon RX Vega M GL / 870
...
3DMark - 3DMark Time Spy Score
min: 3839 avg: 3882 median: 3879 (11%) max: 3927 Points
min: 2121 avg: 2199 median: 2225 (6%) max: 2252 Points
min: 3015 avg: 3309 median: 3235.5 (9%) max: 3709 Points
GPU TDP ? TDP 21 W TDP 35 W 92% 92% 100%
3DMark - 3DMark Time Spy Graphics
min: 3492 avg: 3514 median: 3512 (9%) max: 3538 Points
min: 2031 avg: 2070 median: 2072 (5%) max: 2108 Points
min: 2886 avg: 3139 median: 3098 (8%) max: 3526 Points
GPU TDP ? TDP 21 W TDP 35 W 91% 92% 100%
3DMark - 3DMark Ice Storm Unlimited Graphics
min: 356457 avg: 388636 median: 373333 (42%) max: 436117 Points
min: 261434 avg: 290539 median: 299071 (34%) max: 311111 Points
421834 Points (48%)
GPU TDP ? TDP 35 W 81% 100%
3DMark - 3DMark Ice Storm Extreme Graphics
min: 161038 avg: 174430 median: 170403 (22%) max: 191849 Points
min: 46963 avg: 106261 median: 106261 (14%) max: 165559 Points
34142 Points (4%)
3DMark - 3DMark Cloud Gate Score
min: 33812 avg: 36095 median: 35325 (38%) max: 39148 Points
min: 15911 avg: 19226 median: 19473 (21%) max: 21322 Points
min: 18333 avg: 22116 median: 22895 (24%) max: 26161 Points
GPU TDP ? TDP 21 W TDP 35 W 95% 95% 100%
3DMark - 3DMark Cloud Gate Graphics
min: 49810 avg: 52826 median: 50549 (13%) max: 58120 Points
min: 37915 avg: 40459 median: 38812 (10%) max: 44796 Points
min: 29035 avg: 42978 median: 47657 (13%) max: 53539 Points
GPU TDP ? TDP 21 W TDP 35 W 81% 98% 100%
3DMark - 3DMark Fire Strike Standard Score
min: 8362 avg: 8789 median: 8795 (16%) max: 9209 Points
min: 5879 avg: 6114 median: 6225 (11%) max: 6280 Points
min: 7292 avg: 7764 median: 7700 (14%) max: 8659 Points
GPU TDP ? TDP 21 W TDP 35 W 92% 92% 100%
3DMark - 3DMark Fire Strike Standard Graphics
min: 9195 avg: 9372 median: 9203 (10%) max: 9718 Points
min: 7059 avg: 7254 median: 7329 (8%) max: 7355 Points
min: 8024 avg: 8542 median: 8564 (10%) max: 9573 Points
GPU TDP ? TDP 21 W TDP 35 W 94% 92% 100%
3DMark - 3DMark Ice Storm Graphics
min: 200932 avg: 222320 median: 218255 (26%) max: 247773 Points
min: 74196 avg: 127123 median: 127123 (15%) max: 180050 Points
3DMark - 3DMark Wild Life Unlimited
24510 Points (12%)
21348 Points (11%)
GPU TDP ? TDP 35 W 100% 87%
3DMark - 3DMark Night Raid
min: 33394 avg: 33740 median: 33740 (32%) max: 34086 Points
3DMark - 3DMark Night Raid Graphics Score
min: 43375 avg: 44052 median: 44051.5 (17%) max: 44728 Points
3DMark 11 - 3DM11 Performance Score
min: 13719 avg: 13894 median: 13894 (19%) max: 14069 Points
min: 9104 avg: 9465 median: 9380 (13%) max: 9890 Points
min: 10610 avg: 11524 median: 11398 (16%) max: 13121 Points
GPU TDP ? TDP 21 W TDP 35 W 94% 93% 100%
3DMark 11 - 3DM11 Performance GPU
min: 13531 avg: 13645 median: 13645 (12%) max: 13759 Points
min: 9632 avg: 9910 median: 9862 (8%) max: 10118 Points
min: 11055 avg: 11796 median: 11538 (10%) max: 13343 Points
GPU TDP ? TDP 21 W TDP 35 W 94% 91% 100%
3DMark Vantage + NVIDIA GeForce GTX 1650 (Desktop) 3DMark Vantage - 3DM Vant. Perf. total
min: 42025 avg: 44694 median: 44694 (13%) max: 47363 Points
3DM Vant. Perf. total + NVIDIA GeForce GTX 1650 Ti Max-Q
31116 Points (9%)
3DM Vant. Perf. GPU no PhysX + NVIDIA GeForce GTX 1650 (Desktop) 3DMark Vantage - 3DM Vant. Perf. GPU no PhysX
min: 38335 avg: 40628 median: 40627.5 (23%) max: 42920 Points
3DM Vant. Perf. GPU no PhysX + NVIDIA GeForce GTX 1650 Ti Max-Q
33179 Points (19%)
3DMark 05 - 3DMark 05 - Standard
35596 Points (39%)
3DMark 06 3DMark 06 - Standard 1280x1024 + NVIDIA GeForce GTX 1650 (Desktop)
min: 34249 avg: 39546 median: 39545.5 (52%) max: 44842 Points
3DMark 06 - Standard 1280x1024 + AMD Radeon RX Vega M GL / 870
16707 Points (22%)
3DMark 06 - Standard 1280x1024 + NVIDIA GeForce GTX 1650 Ti Max-Q
30266 Points (40%)
Unigine Valley 1.0 - Unigine Valley 1.0 DX
min: 42.1 avg: 44.4 median: 44.4 (15%) max: 46.6 fps
SPECviewperf 12 + NVIDIA GeForce GTX 1650 (Desktop) SPECviewperf 12 - specvp12 sw-03
min: 43.33 avg: 45.5 median: 45.4 (11%) max: 47.78 fps
specvp12 sw-03 + AMD Radeon RX Vega M GL / 870
53 fps (13%)
specvp12 snx-02 + NVIDIA GeForce GTX 1650 (Desktop) SPECviewperf 12 - specvp12 snx-02
min: 6.4 avg: 6.4 median: 6.4 (1%) max: 6.48 fps
specvp12 snx-02 + AMD Radeon RX Vega M GL / 870
16.5 fps (2%)
specvp12 showcase-01 + NVIDIA GeForce GTX 1650 (Desktop) SPECviewperf 12 - specvp12 showcase-01
min: 50.5 avg: 51.2 median: 51.2 (11%) max: 51.8 fps
specvp12 showcase-01 + AMD Radeon RX Vega M GL / 870
30.6 fps (7%)
specvp12 mediacal-01 + NVIDIA GeForce GTX 1650 (Desktop) SPECviewperf 12 - specvp12 mediacal-01
min: 20.66 avg: 21.8 median: 21.4 (5%) max: 23.29 fps
specvp12 mediacal-01 + AMD Radeon RX Vega M GL / 870
15.6 fps (4%)
specvp12 maya-04 + NVIDIA GeForce GTX 1650 (Desktop) SPECviewperf 12 - specvp12 maya-04
min: 85.3 avg: 90.2 median: 91.4 (25%) max: 93.9 fps
specvp12 maya-04 + AMD Radeon RX Vega M GL / 870
39.9 fps (11%)
specvp12 energy-01 + NVIDIA GeForce GTX 1650 (Desktop) SPECviewperf 12 - specvp12 energy-01
min: 2.2 avg: 4 median: 4.7 (4%) max: 5.03 fps
specvp12 energy-01 + AMD Radeon RX Vega M GL / 870
2.7 fps (2%)
specvp12 creo-01 + NVIDIA GeForce GTX 1650 (Desktop) SPECviewperf 12 - specvp12 creo-01
min: 27.36 avg: 33.1 median: 34.8 (14%) max: 37.04 fps
specvp12 creo-01 + AMD Radeon RX Vega M GL / 870
37 fps (15%)
specvp12 catia-04 + NVIDIA GeForce GTX 1650 (Desktop) SPECviewperf 12 - specvp12 catia-04
min: 42.85 avg: 43.5 median: 43.6 (7%) max: 43.9 fps
specvp12 catia-04 + AMD Radeon RX Vega M GL / 870
55.5 fps (9%)
specvp12 3dsmax-05 + NVIDIA GeForce GTX 1650 (Desktop) SPECviewperf 12 - specvp12 3dsmax-05
min: 105 avg: 107.2 median: 106.4 (19%) max: 110.1 fps
SPECviewperf 13 specvp13 sw-04 + NVIDIA GeForce GTX 1650 (Desktop) SPECviewperf 13 - specvp13 sw-04
min: 60.8 avg: 64.1 median: 62.6 (17%) max: 68.9 fps
specvp13 snx-03 + NVIDIA GeForce GTX 1650 (Desktop) SPECviewperf 13 - specvp13 snx-03
min: 11.49 avg: 11.5 median: 11.5 (1%) max: 11.6 fps
specvp13 showcase-02 + NVIDIA GeForce GTX 1650 (Desktop) SPECviewperf 13 - specvp13 showcase-02
min: 49.94 avg: 50.8 median: 50.8 (11%) max: 51.6 fps
specvp13 medical-02 + NVIDIA GeForce GTX 1650 (Desktop) SPECviewperf 13 - specvp13 medical-02
min: 25.58 avg: 26.4 median: 26 (5%) max: 27.66 fps
specvp13 maya-05 + NVIDIA GeForce GTX 1650 (Desktop) SPECviewperf 13 - specvp13 maya-05
min: 129.2 avg: 136.5 median: 140 (16%) max: 140.3 fps
specvp13 energy-02 + NVIDIA GeForce GTX 1650 (Desktop) SPECviewperf 13 - specvp13 energy-02
min: 2.88 avg: 5.7 median: 7 (2%) max: 7.11 fps
specvp13 creo-02 + NVIDIA GeForce GTX 1650 (Desktop) SPECviewperf 13 - specvp13 creo-02
min: 87.5 avg: 99.5 median: 105 (15%) max: 106 fps
specvp13 catia-05 + NVIDIA GeForce GTX 1650 (Desktop) SPECviewperf 13 - specvp13 catia-05
min: 60.4 avg: 61.2 median: 61.3 (7%) max: 61.8 fps
specvp13 3dsmax-06 + NVIDIA GeForce GTX 1650 (Desktop) SPECviewperf 13 - specvp13 3dsmax-06
min: 103 avg: 106.2 median: 105.5 (18%) max: 110.1 fps
SPECviewperf 2020 specvp2020 solidworks-05 4k + NVIDIA GeForce GTX 1650 (Desktop) SPECviewperf 2020 - specvp2020 solidworks-05 4k
21.3 fps (6%)
specvp2020 snx-04 4k + NVIDIA GeForce GTX 1650 (Desktop) SPECviewperf 2020 - specvp2020 snx-04 4k
8.2 fps (1%)
specvp2020 medical-03 4k + NVIDIA GeForce GTX 1650 (Desktop) SPECviewperf 2020 - specvp2020 medical-03 4k
3.7 fps (4%)
specvp2020 maya-06 4k + NVIDIA GeForce GTX 1650 (Desktop) SPECviewperf 2020 - specvp2020 maya-06 4k
74 fps (12%)
specvp2020 energy-03 4k + NVIDIA GeForce GTX 1650 (Desktop) SPECviewperf 2020 - specvp2020 energy-03 4k
9 fps (2%)
specvp2020 creo-03 4k + NVIDIA GeForce GTX 1650 (Desktop) SPECviewperf 2020 - specvp2020 creo-03 4k
39.4 fps (19%)
specvp2020 catia-06 4k + NVIDIA GeForce GTX 1650 (Desktop) SPECviewperf 2020 - specvp2020 catia-06 4k
11.5 fps (8%)
specvp2020 3dsmax-07 4k + NVIDIA GeForce GTX 1650 (Desktop) SPECviewperf 2020 - specvp2020 3dsmax-07 4k
24.6 fps (10%)
Cinebench R10 Cinebench R10 Shading (32bit) + AMD Radeon RX Vega M GL / 870 Cinebench R10 - Cinebench R10 Shading (32bit)
min: 9486 avg: 9791 median: 9791 (7%) max: 10096 Points
Cinebench R11.5 Cinebench R11.5 OpenGL 64 Bit + AMD Radeon RX Vega M GL / 870 Cinebench R11.5 - Cinebench R11.5 OpenGL 64 Bit
min: 96.2 avg: 102.6 median: 104.3 (36%) max: 107.4 fps
Cinebench R11.5 OpenGL 64 Bit + NVIDIA GeForce GTX 1650 Ti Max-Q
64.9 fps (22%)
Cinebench R15 + NVIDIA GeForce GTX 1650 (Desktop) Cinebench R15 - Cinebench R15 OpenGL 64 Bit
174.5 fps (10%)
Cinebench R15 OpenGL 64 Bit + AMD Radeon RX Vega M GL / 870
min: 98.6 avg: 116.4 median: 120.7 (7%) max: 125.5 fps
Cinebench R15 OpenGL 64 Bit + NVIDIA GeForce GTX 1650 Ti Max-Q
min: 83.9 avg: 132.8 median: 140 (8%) max: 145 fps
GPU TDP ? TDP 21 W TDP 35 W 97% 94% 100%
Cinebench R15 OpenGL Ref. Match 64 Bit + NVIDIA GeForce GTX 1650 (Desktop) Cinebench R15 - Cinebench R15 OpenGL Ref. Match 64 Bit
99.6 % (100%)
Cinebench R15 OpenGL Ref. Match 64 Bit + AMD Radeon RX Vega M GL / 870
98 % (98%)
Cinebench R15 OpenGL Ref. Match 64 Bit + NVIDIA GeForce GTX 1650 Ti Max-Q
99.6 % (100%)
GPU TDP ? TDP 21 W TDP 35 W 99% 100% 100%
GFXBench - GFXBench 5.0 Aztec Ruins High Tier Offscreen
63.8 fps (12%)
GFXBench - GFXBench 5.0 Aztec Ruins Normal Tier Offscreen
158.2 fps (12%)
GFXBench - GFXBench Car Chase Offscreen
110 fps (12%)
GFXBench 3.1 - GFXBench Manhattan ES 3.1 Offscreen
132.5 fps (3%)
GFXBench 3.0 - GFXBench 3.0 Manhattan Offscreen
182.5 fps (11%)
GFXBench (DX / GLBenchmark) 2.7 + AMD Radeon RX Vega M GL / 870 GFXBench (DX / GLBenchmark) 2.7 - GFXBench T-Rex HD Offscreen C24Z16
502 fps (4%)
LuxMark v2.0 64Bit - LuxMark v2.0 Room GPU
min: 1273 avg: 1321 median: 1320.5 (6%) max: 1368 Samples/s
min: 1096 avg: 1131 median: 1130.5 (5%) max: 1165 Samples/s
9546 Samples/s (43%)
LuxMark v2.0 64Bit - LuxMark v2.0 Sala GPU
min: 2577 avg: 2580 median: 2579.5 (5%) max: 2582 Samples/s
min: 2205 avg: 2253 median: 2253 (4%) max: 2301 Samples/s
10809 Samples/s (19%)
ComputeMark v2.1 - ComputeMark v2.1 Result
min: 7011 avg: 7085 median: 7085 (8%) max: 7159 Points
min: 862 avg: 2179 median: 956 (1%) max: 4719 Points
6297 Points (7%)
Power Consumption - Furmark Stress Test Power Consumption - external Monitor *
min: 183 avg: 195.3 median: 200.4 (28%) max: 202.5 Watt
min: 61.5 avg: 66.7 median: 65.2 (9%) max: 75 Watt
Power Consumption - The Witcher 3 Power Consumption - external Monitor *
min: 178.9 avg: 195.2 median: 202.9 (28%) max: 203.9 Watt
min: 59.8 avg: 63.3 median: 63 (9%) max: 67.3 Watt
Power Consumption - Witcher 3 Power Consumption *
min: 84.3 avg: 85.8 median: 85.8 (19%) max: 87.2 Watt
min: 60.6 avg: 72 median: 68.6 (15%) max: 94 Watt
GPU TDP ? TDP 21 W TDP 35 W 101% 105% 100%
Power Consumption - Witcher 3 ultra Power Efficiency
0.2 fps per Watt (22%)
min: 0.3568 avg: 0.4 median: 0.4 (40%) max: 0.522 fps per Watt
GPU TDP ? TDP 21 W TDP 35 W 78% 100% 86%
Power Consumption - Witcher 3 ultra Power Efficiency - external Monitor
min: 0.1991 avg: 0.2 median: 0.2 (18%) max: 0.2404 fps per Watt
min: 0.4161 avg: 0.4 median: 0.4 (37%) max: 0.4716 fps per Watt
Emissions Witcher 3 Fan Noise + AMD Radeon RX Vega M GL / 870 Emissions - Witcher 3 Fan Noise
min: 44.2 avg: 45.7 median: 44.7 (72%) max: 48.1 dB(A)
Witcher 3 Fan Noise + NVIDIA GeForce GTX 1650 Ti Max-Q
min: 34.5 avg: 40.9 median: 42 (67%) max: 47 dB(A)
GPU TDP ? TDP 21 W TDP 35 W 100% 79% 88%
Clock Speed - GPU Clock Witcher 3 ultra
1011 MHz (40%)
min: 1340 avg: 1405 median: 1405 (55%) max: 1470 MHz
GPU TDP ? TDP 35 W 80% 100%
Clock Speed - GPU Clock Speed Furmark
1457 MHz (58%)
838 MHz (33%)
998 MHz (40%)
Average Benchmarks NVIDIA GeForce GTX 1650 (Desktop) → 100% n=17 Average Benchmarks AMD Radeon RX Vega M GL / 870 → 67% n=17 Average Benchmarks NVIDIA GeForce GTX 1650 Ti Max-Q → 139% n=17
- Range of benchmark values for this graphics card
- Average benchmark values for this graphics card
* Smaller numbers mean a higher performance
1 This benchmark is not used for the average calculation
Game Benchmarks The following benchmarks stem from our benchmarks of review laptops. The performance depends on the used graphics memory, clock rate, processor, system settings, drivers, and operating systems. So the results don't have to be representative for all laptops with this GPU. For detailed information on the benchmark results, click on the fps number.
100%
GeForce GTX 1650 (Desktop):
143 [X] KFA2 GeForce GTX 1650 EX One Click Plus AMD Ryzen 9 5900X 3.7GHz
GeForce GTX 1650 (Desktop)
fps
100%
GeForce GTX 1650 (Desktop):
73 [X] KFA2 GeForce GTX 1650 EX One Click Plus AMD Ryzen 9 5900X 3.7GHz
GeForce GTX 1650 (Desktop)
fps
100%
GeForce GTX 1650 (Desktop):
62 [X] KFA2 GeForce GTX 1650 EX One Click Plus AMD Ryzen 9 5900X 3.7GHz
GeForce GTX 1650 (Desktop)
fps
100%
GeForce GTX 1650 (Desktop):
26 [X] KFA2 GeForce GTX 1650 EX One Click Plus AMD Ryzen 9 5900X 3.7GHz
GeForce GTX 1650 (Desktop)
fps
100%
GeForce GTX 1650 (Desktop):
22 [X] KFA2 GeForce GTX 1650 EX One Click Plus AMD Ryzen 9 5900X 3.7GHz
GeForce GTX 1650 (Desktop)
fps
100%
GeForce GTX 1650 (Desktop):
15 [X] KFA2 GeForce GTX 1650 EX One Click Plus AMD Ryzen 9 5900X 3.7GHz
GeForce GTX 1650 (Desktop)
fps
100%
GeForce GTX 1650 (Desktop):
120 [X] KFA2 GeForce GTX 1650 EX One Click Plus AMD Ryzen 9 5900X 3.7GHz
GeForce GTX 1650 (Desktop)
fps
100%
GeForce GTX 1650 (Desktop):
60 [X] KFA2 GeForce GTX 1650 EX One Click Plus AMD Ryzen 9 5900X 3.7GHz
GeForce GTX 1650 (Desktop)
fps
100%
GeForce GTX 1650 (Desktop):
46 [X] KFA2 GeForce GTX 1650 EX One Click Plus AMD Ryzen 9 5900X 3.7GHz
GeForce GTX 1650 (Desktop)
fps
100%
GeForce GTX 1650 (Desktop):
41 [X] KFA2 GeForce GTX 1650 EX One Click Plus AMD Ryzen 9 5900X 3.7GHz
GeForce GTX 1650 (Desktop)
fps
100%
GeForce GTX 1650 (Desktop):
27 [X] KFA2 GeForce GTX 1650 EX One Click Plus AMD Ryzen 9 5900X 3.7GHz
GeForce GTX 1650 (Desktop)
fps
100%
GeForce GTX 1650 (Desktop):
80 [X] KFA2 GeForce GTX 1650 EX One Click Plus AMD Ryzen 9 5900X 3.7GHz
GeForce GTX 1650 (Desktop)
fps
100%
GeForce GTX 1650 (Desktop):
53 [X] KFA2 GeForce GTX 1650 EX One Click Plus AMD Ryzen 9 5900X 3.7GHz
GeForce GTX 1650 (Desktop)
fps
100%
GeForce GTX 1650 (Desktop):
51 [X] KFA2 GeForce GTX 1650 EX One Click Plus AMD Ryzen 9 5900X 3.7GHz
GeForce GTX 1650 (Desktop)
fps
100%
GeForce GTX 1650 (Desktop):
50 [X] KFA2 GeForce GTX 1650 EX One Click Plus AMD Ryzen 9 5900X 3.7GHz
GeForce GTX 1650 (Desktop)
fps
100%
GeForce GTX 1650 (Desktop):
32 [X] KFA2 GeForce GTX 1650 EX One Click Plus AMD Ryzen 9 5900X 3.7GHz
GeForce GTX 1650 (Desktop)
fps
100%
GeForce GTX 1650 (Desktop):
13 [X] KFA2 GeForce GTX 1650 EX One Click Plus AMD Ryzen 9 5900X 3.7GHz
GeForce GTX 1650 (Desktop)
fps
100%
GeForce GTX 1650 (Desktop):
96.5 [X] KFA2 GeForce GTX 1650 EX One Click Plus AMD Ryzen 9 5900X 3.7GHz
GeForce GTX 1650 (Desktop)
min:
20.7 fps, P0.1:
39.6 fps, P1:
51.8 fps, max:
409 fps
fps
100%
GeForce GTX 1650 (Desktop):
84.9 [X] KFA2 GeForce GTX 1650 EX One Click Plus AMD Ryzen 9 5900X 3.7GHz
GeForce GTX 1650 (Desktop)
min:
38.3 fps, P0.1:
42.7 fps, P1:
45.1 fps, max:
362 fps
fps
100%
GeForce GTX 1650 (Desktop):
77.8 [X] KFA2 GeForce GTX 1650 EX One Click Plus AMD Ryzen 9 5900X 3.7GHz
GeForce GTX 1650 (Desktop)
min:
33.5 fps, P0.1:
35.4 fps, P1:
42 fps, max:
367 fps
fps
100%
GeForce GTX 1650 (Desktop):
48.4 [X] KFA2 GeForce GTX 1650 EX One Click Plus AMD Ryzen 9 5900X 3.7GHz
GeForce GTX 1650 (Desktop)
min:
21.8 fps, P0.1:
23.2 fps, P1:
24.8 fps, max:
297 fps
fps
100%
GeForce GTX 1650 (Desktop):
23.2 [X] KFA2 GeForce GTX 1650 EX One Click Plus AMD Ryzen 9 5900X 3.7GHz
GeForce GTX 1650 (Desktop)
min:
10.2 fps, P0.1:
10.8 fps, P1:
11.5 fps, max:
367 fps
fps
100%
GeForce GTX 1650 (Desktop):
104 [X] KFA2 GeForce GTX 1650 EX One Click Plus AMD Ryzen 9 5900X 3.7GHz
GeForce GTX 1650 (Desktop)
min:
74 fps, max:
124 fps
fps
100%
GeForce GTX 1650 (Desktop):
40 [X] KFA2 GeForce GTX 1650 EX One Click Plus AMD Ryzen 9 5900X 3.7GHz
GeForce GTX 1650 (Desktop)
min:
71 fps
fps
100%
GeForce GTX 1650 (Desktop):
54 [X] KFA2 GeForce GTX 1650 EX One Click Plus AMD Ryzen 9 5900X 3.7GHz
GeForce GTX 1650 (Desktop)
min:
33 fps, max:
61 fps
fps
100%
GeForce GTX 1650 (Desktop):
45 [X] KFA2 GeForce GTX 1650 EX One Click Plus AMD Ryzen 9 5900X 3.7GHz
GeForce GTX 1650 (Desktop)
min:
41 fps, max:
53 fps
fps
100%
GeForce GTX 1650 (Desktop):
6 [X] KFA2 GeForce GTX 1650 EX One Click Plus AMD Ryzen 9 5900X 3.7GHz
GeForce GTX 1650 (Desktop)
min:
3 fps, max:
25 fps
fps
100%
GeForce GTX 1650 (Desktop):
90.1 [X] KFA2 GeForce GTX 1650 EX One Click Plus AMD Ryzen 9 5900X 3.7GHz
GeForce GTX 1650 (Desktop)
min:
31.8 fps, P0.1:
43.1 fps, P1:
70.3 fps, max:
171 fps
fps
100%
GeForce GTX 1650 (Desktop):
84.4 [X] KFA2 GeForce GTX 1650 EX One Click Plus AMD Ryzen 9 5900X 3.7GHz
GeForce GTX 1650 (Desktop)
min:
30 fps, P0.1:
42.2 fps, P1:
71.2 fps, max:
145 fps
fps
100%
GeForce GTX 1650 (Desktop):
74.6 [X] KFA2 GeForce GTX 1650 EX One Click Plus AMD Ryzen 9 5900X 3.7GHz
GeForce GTX 1650 (Desktop)
min:
25.2 fps, P0.1:
41.2 fps, P1:
60.4 fps, max:
95.4 fps
fps
100%
GeForce GTX 1650 (Desktop):
42.6 [X] KFA2 GeForce GTX 1650 EX One Click Plus AMD Ryzen 9 5900X 3.7GHz
GeForce GTX 1650 (Desktop)
min:
23.4 fps, P0.1:
32.7 fps, P1:
36.4 fps, max:
72.6 fps
fps
100%
GeForce GTX 1650 (Desktop):
106 [X] KFA2 GeForce GTX 1650 EX One Click Plus AMD Ryzen 9 5900X 3.7GHz
GeForce GTX 1650 (Desktop)
min:
14.9 fps, P0.1:
52.6 fps, P1:
77.1 fps, max:
309 fps
fps
100%
GeForce GTX 1650 (Desktop):
50.7 [X] KFA2 GeForce GTX 1650 EX One Click Plus AMD Ryzen 9 5900X 3.7GHz
GeForce GTX 1650 (Desktop)
min:
34.6 fps, P0.1:
35.3 fps, P1:
39.2 fps, max:
75.1 fps
fps
100%
GeForce GTX 1650 (Desktop):
45.9 [X] KFA2 GeForce GTX 1650 EX One Click Plus AMD Ryzen 9 5900X 3.7GHz
GeForce GTX 1650 (Desktop)
min:
31.5 fps, P0.1:
33.1 fps, P1:
35.6 fps, max:
76.1 fps
fps
100%
GeForce GTX 1650 (Desktop):
35.7 [X] KFA2 GeForce GTX 1650 EX One Click Plus AMD Ryzen 9 5900X 3.7GHz
GeForce GTX 1650 (Desktop)
min:
19.4 fps, P0.1:
20.8 fps, P1:
25.6 fps, max:
58.4 fps
fps
100%
GeForce GTX 1650 (Desktop):
28.8 [X] KFA2 GeForce GTX 1650 EX One Click Plus AMD Ryzen 9 5900X 3.7GHz
GeForce GTX 1650 (Desktop)
min:
18.4 fps, P0.1:
18.9 fps, P1:
21.4 fps, max:
43.5 fps
fps
100%
GeForce GTX 1650 (Desktop):
16.1 [X] KFA2 GeForce GTX 1650 EX One Click Plus AMD Ryzen 9 5900X 3.7GHz
GeForce GTX 1650 (Desktop)
min:
10.8 fps, P0.1:
11.7 fps, P1:
12.8 fps, max:
25.1 fps
fps
100%
GeForce GTX 1650 (Desktop):
98.4 [X] KFA2 GeForce GTX 1650 EX One Click Plus AMD Ryzen 9 5900X 3.7GHz
GeForce GTX 1650 (Desktop)
min:
22.3 fps, P0.1:
66.6 fps, P1:
73.4 fps, max:
154 fps
fps
100%
GeForce GTX 1650 (Desktop):
51.4 [X] KFA2 GeForce GTX 1650 EX One Click Plus AMD Ryzen 9 5900X 3.7GHz
GeForce GTX 1650 (Desktop)
min:
18.9 fps, P0.1:
38.5 fps, P1:
43.3 fps, max:
67.2 fps
fps
100%
GeForce GTX 1650 (Desktop):
40 [X] KFA2 GeForce GTX 1650 EX One Click Plus AMD Ryzen 9 5900X 3.7GHz
GeForce GTX 1650 (Desktop)
min:
16.2 fps, P0.1:
27.7 fps, P1:
31.9 fps, max:
52.2 fps
fps
100%
GeForce GTX 1650 (Desktop):
31.4 [X] KFA2 GeForce GTX 1650 EX One Click Plus AMD Ryzen 9 5900X 3.7GHz
GeForce GTX 1650 (Desktop)
min:
14.1 fps, P0.1:
23.5 fps, P1:
24.9 fps, max:
41.2 fps
fps
100%
GeForce GTX 1650 (Desktop):
20 [X] KFA2 GeForce GTX 1650 EX One Click Plus AMD Ryzen 9 5900X 3.7GHz
GeForce GTX 1650 (Desktop)
min:
11.4 fps, P0.1:
14.3 fps, P1:
16.9 fps, max:
24.9 fps
fps
100%
GeForce GTX 1650 (Desktop):
3.1 [X] KFA2 GeForce GTX 1650 EX One Click Plus AMD Ryzen 9 5900X 3.7GHz
GeForce GTX 1650 (Desktop)
min:
2.73 fps, P0.1:
2.73 fps, P1:
2.74 fps, max:
3.32 fps
fps
100%
GeForce GTX 1650 (Desktop):
248 [X] KFA2 GeForce GTX 1650 EX One Click Plus 815237
AMD Ryzen 9 5900X 3.7GHz
GeForce GTX 1650 (Desktop)
min:
195 fps, P1:
202 fps, max:
293 fps
fps
100%
GeForce GTX 1650 (Desktop):
118 [X] KFA2 GeForce GTX 1650 EX One Click Plus 815237
AMD Ryzen 9 5900X 3.7GHz
GeForce GTX 1650 (Desktop)
min:
103 fps, P1:
101 fps, max:
137 fps
fps
100%
GeForce GTX 1650 (Desktop):
96.8 [X] KFA2 GeForce GTX 1650 EX One Click Plus 815237
AMD Ryzen 9 5900X 3.7GHz
GeForce GTX 1650 (Desktop)
min:
83 fps, P1:
83 fps, max:
105 fps
fps
100%
GeForce GTX 1650 (Desktop):
61 [X] KFA2 GeForce GTX 1650 EX One Click Plus 815237
AMD Ryzen 9 5900X 3.7GHz
GeForce GTX 1650 (Desktop)
min:
48 fps, P1:
50 fps, max:
70 fps
fps
100%
GeForce GTX 1650 (Desktop):
44.3 [X] KFA2 GeForce GTX 1650 EX One Click Plus 815237
AMD Ryzen 9 5900X 3.7GHz
GeForce GTX 1650 (Desktop)
min:
36 fps, P1:
36 fps, max:
51 fps
fps
100%
GeForce GTX 1650 (Desktop):
25.1 [X] KFA2 GeForce GTX 1650 EX One Click Plus 815237
AMD Ryzen 9 5900X 3.7GHz
GeForce GTX 1650 (Desktop)
min:
21 fps, P1:
21 fps, max:
28 fps
fps
100%
GeForce GTX 1650 (Desktop):
144 [X] KFA2 GeForce GTX 1650 EX One Click Plus AMD Ryzen 9 5900X 3.7GHz
GeForce GTX 1650 (Desktop)
min:
49.5 fps, P0.1:
103 fps, P1:
113 fps, max:
232 fps
fps
100%
GeForce GTX 1650 (Desktop):
128 [X] KFA2 GeForce GTX 1650 EX One Click Plus AMD Ryzen 9 5900X 3.7GHz
GeForce GTX 1650 (Desktop)
min:
72.8 fps, P0.1:
88.5 fps, P1:
101 fps, max:
155 fps
fps
100%
GeForce GTX 1650 (Desktop):
94.3 [X] KFA2 GeForce GTX 1650 EX One Click Plus AMD Ryzen 9 5900X 3.7GHz
GeForce GTX 1650 (Desktop)
min:
58.9 fps, P0.1:
68.2 fps, P1:
75.9 fps, max:
113 fps
fps
100%
GeForce GTX 1650 (Desktop):
54.4 [X] KFA2 GeForce GTX 1650 EX One Click Plus AMD Ryzen 9 5900X 3.7GHz
GeForce GTX 1650 (Desktop)
min:
41.6 fps, P0.1:
43.4 fps, P1:
46.4 fps, max:
63.1 fps
fps
100%
GeForce GTX 1650 (Desktop):
111 [X] KFA2 GeForce GTX 1650 EX One Click Plus AMD Ryzen 9 5900X 3.7GHz
GeForce GTX 1650 (Desktop)
min:
41.7 fps, P0.1:
48.5 fps, P1:
68.9 fps, max:
327 fps
fps
100%
GeForce GTX 1650 (Desktop):
63.1 [X] KFA2 GeForce GTX 1650 EX One Click Plus AMD Ryzen 9 5900X 3.7GHz
GeForce GTX 1650 (Desktop)
min:
28.7 fps, P0.1:
35 fps, P1:
47.9 fps, max:
151 fps
fps
100%
GeForce GTX 1650 (Desktop):
55.2 [X] KFA2 GeForce GTX 1650 EX One Click Plus AMD Ryzen 9 5900X 3.7GHz
GeForce GTX 1650 (Desktop)
min:
27 fps, P0.1:
35.6 fps, P1:
42.5 fps, max:
152 fps
fps
100%
GeForce GTX 1650 (Desktop):
39.7 [X] KFA2 GeForce GTX 1650 EX One Click Plus AMD Ryzen 9 5900X 3.7GHz
GeForce GTX 1650 (Desktop)
min:
25.2 fps, P0.1:
26.6 fps, P1:
32.4 fps, max:
77.3 fps
fps
100%
GeForce GTX 1650 (Desktop):
28.2 [X] KFA2 GeForce GTX 1650 EX One Click Plus AMD Ryzen 9 5900X 3.7GHz
GeForce GTX 1650 (Desktop)
min:
18.9 fps, P0.1:
21.3 fps, P1:
23.7 fps, max:
42.6 fps
fps
100%
GeForce GTX 1650 (Desktop):
15.5 [X] KFA2 GeForce GTX 1650 EX One Click Plus AMD Ryzen 9 5900X 3.7GHz
GeForce GTX 1650 (Desktop)
min:
13 fps, P0.1:
13.1 fps, P1:
14.1 fps, max:
20.6 fps
fps
100%
GeForce GTX 1650 (Desktop):
116 [X] KFA2 GeForce GTX 1650 EX One Click Plus AMD Ryzen 9 5900X 3.7GHz
GeForce GTX 1650 (Desktop)
min:
25 fps, P0.1:
52.2 fps, P1:
66.9 fps, max:
309 fps
fps
100%
GeForce GTX 1650 (Desktop):
101 [X] KFA2 GeForce GTX 1650 EX One Click Plus AMD Ryzen 9 5900X 3.7GHz
GeForce GTX 1650 (Desktop)
min:
24.8 fps, P0.1:
41.7 fps, P1:
65 fps, max:
251 fps
fps
100%
GeForce GTX 1650 (Desktop):
69 [X] KFA2 GeForce GTX 1650 EX One Click Plus AMD Ryzen 9 5900X 3.7GHz
GeForce GTX 1650 (Desktop)
min:
24.5 fps, P0.1:
34.7 fps, P1:
53.1 fps, max:
191 fps
fps
100%
GeForce GTX 1650 (Desktop):
33.9 [X] KFA2 GeForce GTX 1650 EX One Click Plus AMD Ryzen 9 5900X 3.7GHz
GeForce GTX 1650 (Desktop)
min:
24.3 fps, P0.1:
25.5 fps, P1:
29.3 fps, max:
43.9 fps
fps
100%
GeForce GTX 1650 (Desktop):
177 [X] KFA2 GeForce GTX 1650 EX One Click Plus AMD Ryzen 9 5900X 3.7GHz
GeForce GTX 1650 (Desktop)
min:
75.7 fps, P0.1:
134 fps, P1:
139 fps, max:
223 fps
fps
100%
GeForce GTX 1650 (Desktop):
71.8 [X] KFA2 GeForce GTX 1650 EX One Click Plus AMD Ryzen 9 5900X 3.7GHz
GeForce GTX 1650 (Desktop)
min:
56.6 fps, P0.1:
57.3 fps, P1:
58.3 fps, max:
93.5 fps
fps
100%
GeForce GTX 1650 (Desktop):
63.4 [X] KFA2 GeForce GTX 1650 EX One Click Plus AMD Ryzen 9 5900X 3.7GHz
GeForce GTX 1650 (Desktop)
min:
50.5 fps, P0.1:
51.8 fps, P1:
53 fps, max:
87.3 fps
fps
100%
GeForce GTX 1650 (Desktop):
50.6 [X] KFA2 GeForce GTX 1650 EX One Click Plus AMD Ryzen 9 5900X 3.7GHz
GeForce GTX 1650 (Desktop)
min:
29.4 fps, P0.1:
40.4 fps, P1:
41.5 fps, max:
72.3 fps
fps
100%
GeForce GTX 1650 (Desktop):
34.2 [X] KFA2 GeForce GTX 1650 EX One Click Plus AMD Ryzen 9 5900X 3.7GHz
GeForce GTX 1650 (Desktop)
min:
24.5 fps, P0.1:
28 fps, P1:
28.9 fps, max:
47.6 fps
fps
100%
GeForce GTX 1650 (Desktop):
15.5 [X] KFA2 GeForce GTX 1650 EX One Click Plus AMD Ryzen 9 5900X 3.7GHz
GeForce GTX 1650 (Desktop)
min:
13.2 fps, P0.1:
13.3 fps, P1:
13.5 fps, max:
18 fps
fps
100%
GeForce GTX 1650 (Desktop):
142 [X] KFA2 GeForce GTX 1650 EX One Click Plus AMD Ryzen 9 5900X 3.7GHz
GeForce GTX 1650 (Desktop)
min:
12.6 fps, P0.1:
19.2 fps, P1:
79 fps, max:
306 fps
fps
100%
GeForce GTX 1650 (Desktop):
69.5 [X] KFA2 GeForce GTX 1650 EX One Click Plus AMD Ryzen 9 5900X 3.7GHz
GeForce GTX 1650 (Desktop)
min:
14.3 fps, P0.1:
15.5 fps, P1:
37.9 fps, max:
262 fps
fps
100%
GeForce GTX 1650 (Desktop):
54.6 [X] KFA2 GeForce GTX 1650 EX One Click Plus AMD Ryzen 9 5900X 3.7GHz
GeForce GTX 1650 (Desktop)
min:
7.32 fps, P0.1:
11.6 fps, P1:
25.3 fps, max:
240 fps
fps
100%
GeForce GTX 1650 (Desktop):
42.2 [X] KFA2 GeForce GTX 1650 EX One Click Plus AMD Ryzen 9 5900X 3.7GHz
GeForce GTX 1650 (Desktop)
min:
10.7 fps, P0.1:
11 fps, P1:
16.6 fps, max:
222 fps
fps
100%
GeForce GTX 1650 (Desktop):
32.4 [X] KFA2 GeForce GTX 1650 EX One Click Plus AMD Ryzen 9 5900X 3.7GHz
GeForce GTX 1650 (Desktop)
min:
7.74 fps, P0.1:
7.87 fps, P1:
11.4 fps, max:
179 fps
fps
100%
GeForce GTX 1650 (Desktop):
27.7 [X] KFA2 GeForce GTX 1650 EX One Click Plus AMD Ryzen 9 5900X 3.7GHz
GeForce GTX 1650 (Desktop)
min:
6.06 fps, P0.1:
7.05 fps, P1:
10.7 fps, max:
177 fps
fps
100%
GeForce GTX 1650 (Desktop):
173 [X] KFA2 GeForce GTX 1650 EX One Click Plus AMD Ryzen 9 5900X 3.7GHz
GeForce GTX 1650 (Desktop)
fps
100%
GeForce GTX 1650 (Desktop):
76 [X] KFA2 GeForce GTX 1650 EX One Click Plus AMD Ryzen 9 5900X 3.7GHz
GeForce GTX 1650 (Desktop)
fps
100%
GeForce GTX 1650 (Desktop):
65 [X] KFA2 GeForce GTX 1650 EX One Click Plus AMD Ryzen 9 5900X 3.7GHz
GeForce GTX 1650 (Desktop)
fps
100%
GeForce GTX 1650 (Desktop):
59 [X] KFA2 GeForce GTX 1650 EX One Click Plus AMD Ryzen 9 5900X 3.7GHz
GeForce GTX 1650 (Desktop)
fps
100%
GeForce GTX 1650 (Desktop):
37 [X] KFA2 GeForce GTX 1650 EX One Click Plus AMD Ryzen 9 5900X 3.7GHz
GeForce GTX 1650 (Desktop)
fps
100%
GeForce GTX 1650 (Desktop):
19 [X] KFA2 GeForce GTX 1650 EX One Click Plus AMD Ryzen 9 5900X 3.7GHz
GeForce GTX 1650 (Desktop)
fps
100%
GeForce GTX 1650 (Desktop):
66 [X] KFA2 GeForce GTX 1650 EX One Click Plus AMD Ryzen 9 5900X 3.7GHz
GeForce GTX 1650 (Desktop)
min:
21.1 fps, P0.1:
39.4 fps, P1:
51.3 fps, max:
172 fps
fps
97%
GeForce GTX 1650 Ti Max-Q:
63.7 fps
100%
GeForce GTX 1650 (Desktop):
34.4 [X] KFA2 GeForce GTX 1650 EX One Click Plus AMD Ryzen 9 5900X 3.7GHz
GeForce GTX 1650 (Desktop)
min:
6.3 fps, P0.1:
22.6 fps, P1:
27.2 fps, max:
157 fps
fps
96%
GeForce GTX 1650 Ti Max-Q:
33 fps
100%
GeForce GTX 1650 (Desktop):
28.3 [X] KFA2 GeForce GTX 1650 EX One Click Plus AMD Ryzen 9 5900X 3.7GHz
GeForce GTX 1650 (Desktop)
min:
6.5 fps, P0.1:
21 fps, P1:
24 fps, max:
78.1 fps
fps
95%
GeForce GTX 1650 Ti Max-Q:
26.8 fps
100%
GeForce GTX 1650 (Desktop):
23.7 [X] KFA2 GeForce GTX 1650 EX One Click Plus AMD Ryzen 9 5900X 3.7GHz
GeForce GTX 1650 (Desktop)
min:
6.33 fps, P0.1:
11.5 fps, P1:
19.6 fps, max:
58.8 fps
fps
94%
GeForce GTX 1650 Ti Max-Q:
22.2 fps
100%
GeForce GTX 1650 (Desktop):
14.5 [X] KFA2 GeForce GTX 1650 EX One Click Plus AMD Ryzen 9 5900X 3.7GHz
GeForce GTX 1650 (Desktop)
min:
6.38 fps, P0.1:
11.3 fps, P1:
13 fps, max:
51.9 fps
fps
100%
GeForce GTX 1650 (Desktop):
6 [X] KFA2 GeForce GTX 1650 EX One Click Plus AMD Ryzen 9 5900X 3.7GHz
GeForce GTX 1650 (Desktop)
min:
4.7 fps, P0.1:
4.77 fps, P1:
5.37 fps, max:
9.37 fps
fps
100%
GeForce GTX 1650 (Desktop):
80 [X] KFA2 GeForce GTX 1650 EX One Click Plus AMD Ryzen 9 5900X 3.7GHz
GeForce GTX 1650 (Desktop)
min:
32 fps, max:
171 fps
fps
93%
GeForce GTX 1650 Ti Max-Q:
70 77 ~ 74 fps
100%
GeForce GTX 1650 (Desktop):
46 [X] KFA2 GeForce GTX 1650 EX One Click Plus AMD Ryzen 9 5900X 3.7GHz
GeForce GTX 1650 (Desktop)
min:
24 fps, max:
92 fps
fps
102%
GeForce GTX 1650 Ti Max-Q:
45 48 ~ 47 fps
100%
GeForce GTX 1650 (Desktop):
37 [X] KFA2 GeForce GTX 1650 EX One Click Plus AMD Ryzen 9 5900X 3.7GHz
GeForce GTX 1650 (Desktop)
min:
13 fps, max:
124 fps
fps
95%
GeForce GTX 1650 Ti Max-Q:
32 36 [X] MSI Summit E15 A11SCST High Performance
Intel Core i7-1185G7 3GHz
GeForce GTX 1650 Ti Max-Q
min:
9 fps, max:
78 fps
37 ~ 35 fps
100%
GeForce GTX 1650 (Desktop):
30 [X] KFA2 GeForce GTX 1650 EX One Click Plus AMD Ryzen 9 5900X 3.7GHz
GeForce GTX 1650 (Desktop)
min:
8 fps, max:
81 fps
fps
97%
GeForce GTX 1650 Ti Max-Q:
28 29 ~ 29 fps
100%
GeForce GTX 1650 (Desktop):
24 [X] KFA2 GeForce GTX 1650 EX One Click Plus AMD Ryzen 9 5900X 3.7GHz
GeForce GTX 1650 (Desktop)
min:
6 fps, max:
62 fps
fps
100%
GeForce GTX 1650 Ti Max-Q:
24 fps
100%
GeForce GTX 1650 (Desktop):
13 [X] KFA2 GeForce GTX 1650 EX One Click Plus AMD Ryzen 9 5900X 3.7GHz
GeForce GTX 1650 (Desktop)
min:
5 fps, max:
20 fps
fps
108%
GeForce GTX 1650 Ti Max-Q:
14 fps
100%
GeForce GTX 1650 (Desktop):
109 [X] KFA2 GeForce GTX 1650 EX One Click Plus AMD Ryzen 9 5900X 3.7GHz
GeForce GTX 1650 (Desktop)
min:
38.7 fps, P0.1:
62.3 fps, P1:
75 fps, max:
150 fps
fps
93%
GeForce GTX 1650 Ti Max-Q:
97.5 105.1 ~ 101 fps
100%
GeForce GTX 1650 (Desktop):
48.6 [X] KFA2 GeForce GTX 1650 EX One Click Plus AMD Ryzen 9 5900X 3.7GHz
GeForce GTX 1650 (Desktop)
min:
27.6 fps, P0.1:
32.7 fps, P1:
34.4 fps, max:
85.5 fps
fps
93%
GeForce GTX 1650 Ti Max-Q:
42.5 46.9 ~ 45 fps
100%
GeForce GTX 1650 (Desktop):
46.8 [X] KFA2 GeForce GTX 1650 EX One Click Plus AMD Ryzen 9 5900X 3.7GHz
GeForce GTX 1650 (Desktop)
min:
18.1 fps, P0.1:
31.7 fps, P1:
32.7 fps, max:
83.8 fps
fps
92%
GeForce GTX 1650 Ti Max-Q:
40.5 44.8 ~ 43 fps
100%
GeForce GTX 1650 (Desktop):
40.6 [X] KFA2 GeForce GTX 1650 EX One Click Plus AMD Ryzen 9 5900X 3.7GHz
GeForce GTX 1650 (Desktop)
min:
24 fps, P0.1:
24.2 fps, P1:
25.6 fps, max:
83.3 fps
fps
94%
GeForce GTX 1650 Ti Max-Q:
35.7 39.6 ~ 38 fps
100%
GeForce GTX 1650 (Desktop):
26.7 [X] KFA2 GeForce GTX 1650 EX One Click Plus AMD Ryzen 9 5900X 3.7GHz
GeForce GTX 1650 (Desktop)
min:
14.7 fps, P0.1:
14.9 fps, P1:
15.6 fps, max:
83.4 fps
fps
95%
GeForce GTX 1650 Ti Max-Q:
25.4 fps
100%
GeForce GTX 1650 (Desktop):
13.1 [X] KFA2 GeForce GTX 1650 EX One Click Plus AMD Ryzen 9 5900X 3.7GHz
GeForce GTX 1650 (Desktop)
min:
7.12 fps, P0.1:
7.16 fps, P1:
7.67 fps, max:
38.3 fps
fps
95%
GeForce GTX 1650 Ti Max-Q:
12.4 fps
100%
GeForce GTX 1650 (Desktop):
114 [X] KFA2 GeForce GTX 1650 EX One Click Plus AMD Ryzen 9 5900X 3.7GHz
GeForce GTX 1650 (Desktop)
min:
20.5 fps, P0.1:
68.5 fps, P1:
87.1 fps, max:
374 fps
fps
88%
GeForce GTX 1650 Ti Max-Q:
100 fps
100%
GeForce GTX 1650 (Desktop):
63.2 [X] KFA2 GeForce GTX 1650 EX One Click Plus AMD Ryzen 9 5900X 3.7GHz
GeForce GTX 1650 (Desktop)
min:
38.4 fps, P0.1:
45.4 fps, P1:
48.7 fps, max:
160 fps
fps
88%
GeForce GTX 1650 Ti Max-Q:
55.6 fps
100%
GeForce GTX 1650 (Desktop):
47 [X] KFA2 GeForce GTX 1650 EX One Click Plus AMD Ryzen 9 5900X 3.7GHz
GeForce GTX 1650 (Desktop)
min:
32.4 fps, P0.1:
34.1 fps, P1:
36.3 fps, max:
105 fps
fps
94%
GeForce GTX 1650 Ti Max-Q:
44.1 fps
100%
GeForce GTX 1650 (Desktop):
35.6 [X] KFA2 GeForce GTX 1650 EX One Click Plus AMD Ryzen 9 5900X 3.7GHz
GeForce GTX 1650 (Desktop)
min:
26.2 fps, P0.1:
26.6 fps, P1:
27.9 fps, max:
62.8 fps
fps
113%
GeForce GTX 1650 Ti Max-Q:
40.2 fps
100%
GeForce GTX 1650 (Desktop):
23.2 [X] KFA2 GeForce GTX 1650 EX One Click Plus AMD Ryzen 9 5900X 3.7GHz
GeForce GTX 1650 (Desktop)
min:
16.9 fps, P0.1:
17.1 fps, P1:
17.7 fps, max:
37.1 fps
fps
111%
GeForce GTX 1650 Ti Max-Q:
25.8 fps
100%
GeForce GTX 1650 (Desktop):
10.6 [X] KFA2 GeForce GTX 1650 EX One Click Plus AMD Ryzen 9 5900X 3.7GHz
GeForce GTX 1650 (Desktop)
min:
8.39 fps, P0.1:
8.41 fps, P1:
8.54 fps, max:
13.3 fps
fps
100%
GeForce GTX 1650 Ti Max-Q:
10.6 fps
100%
GeForce GTX 1650 (Desktop):
76 [X] KFA2 GeForce GTX 1650 EX One Click Plus AMD Ryzen 9 5900X 3.7GHz
GeForce GTX 1650 (Desktop)
min:
19 fps, max:
157 fps
fps
80%
GeForce GTX 1650 Ti Max-Q:
47 63 [X] MSI Summit E15 A11SCST Intel Core i7-1185G7 3GHz
GeForce GTX 1650 Ti Max-Q
min:
14 fps, P0.1:
28 fps, P1:
44 fps, max:
115 fps
74 ~ 61 fps
100%
GeForce GTX 1650 (Desktop):
47 [X] KFA2 GeForce GTX 1650 EX One Click Plus AMD Ryzen 9 5900X 3.7GHz
GeForce GTX 1650 (Desktop)
min:
10 fps, max:
127 fps
fps
81%
GeForce GTX 1650 Ti Max-Q:
30 38 [X] MSI Summit E15 A11SCST Intel Core i7-1185G7 3GHz
GeForce GTX 1650 Ti Max-Q
min:
18 fps, P0.1:
22 fps, P1:
26 fps, max:
92 fps
45 ~ 38 fps
100%
GeForce GTX 1650 (Desktop):
35 [X] KFA2 GeForce GTX 1650 EX One Click Plus AMD Ryzen 9 5900X 3.7GHz
GeForce GTX 1650 (Desktop)
min:
23 fps, max:
88 fps
fps
71%
GeForce GTX 1650 Ti Max-Q:
19 24 [X] MSI Summit E15 A11SCST Intel Core i7-1185G7 3GHz
GeForce GTX 1650 Ti Max-Q
min:
10 fps, P0.1:
12 fps, P1:
16 fps, max:
88 fps
32 ~ 25 fps
100%
GeForce GTX 1650 (Desktop):
13 [X] KFA2 GeForce GTX 1650 EX One Click Plus AMD Ryzen 9 5900X 3.7GHz
GeForce GTX 1650 (Desktop)
min:
10 fps, max:
19 fps
fps
77%
GeForce GTX 1650 Ti Max-Q:
5 12 14 ~ 10 fps
100%
GeForce GTX 1650 (Desktop):
13 [X] KFA2 GeForce GTX 1650 EX One Click Plus AMD Ryzen 9 5900X 3.7GHz
GeForce GTX 1650 (Desktop)
min:
8 fps, max:
19 fps
fps
92%
GeForce GTX 1650 Ti Max-Q:
12 fps
100%
GeForce GTX 1650 (Desktop):
5 [X] KFA2 GeForce GTX 1650 EX One Click Plus AMD Ryzen 9 5900X 3.7GHz
GeForce GTX 1650 (Desktop)
min:
4 fps, max:
8 fps
fps
100%
GeForce GTX 1650 Ti Max-Q:
5 fps
100%
GeForce GTX 1650 (Desktop):
114 [X] KFA2 GeForce GTX 1650 EX One Click Plus AMD Ryzen 9 5900X 3.7GHz
GeForce GTX 1650 (Desktop)
min:
9.9 fps, P0.1:
85.2 fps, P1:
98.5 fps, max:
139.5 fps
fps
100%
GeForce GTX 1650 (Desktop):
51.4 [X] KFA2 GeForce GTX 1650 EX One Click Plus AMD Ryzen 9 5900X 3.7GHz
GeForce GTX 1650 (Desktop)
min:
31.8 fps, P0.1:
33.4 fps, P1:
44.4 fps, max:
60.5 fps
fps
100%
GeForce GTX 1650 (Desktop):
41.7 [X] KFA2 GeForce GTX 1650 EX One Click Plus AMD Ryzen 9 5900X 3.7GHz
GeForce GTX 1650 (Desktop)
min:
30.2 fps, P0.1:
32.1 fps, P1:
36.3 fps, max:
49.8 fps
fps
100%
GeForce GTX 1650 (Desktop):
34.2 [X] KFA2 GeForce GTX 1650 EX One Click Plus AMD Ryzen 9 5900X 3.7GHz
GeForce GTX 1650 (Desktop)
min:
25.1 fps, P0.1:
25.9 fps, P1:
29 fps, max:
41.2 fps
fps
100%
GeForce GTX 1650 (Desktop):
26.8 [X] KFA2 GeForce GTX 1650 EX One Click Plus AMD Ryzen 9 5900X 3.7GHz
GeForce GTX 1650 (Desktop)
min:
18.8 fps, P0.1:
19.2 fps, P1:
23.2 fps, max:
32 fps
fps
100%
GeForce GTX 1650 (Desktop):
15.5 [X] KFA2 GeForce GTX 1650 EX One Click Plus AMD Ryzen 9 5900X 3.7GHz
GeForce GTX 1650 (Desktop)
min:
11.6 fps, P0.1:
11.7 fps, P1:
13.5 fps, max:
18.3 fps
fps
100%
GeForce GTX 1650 (Desktop):
92.9 [X] AMD Ryzen 9 3900X 3.8GHz
GeForce GTX 1650 (Desktop)
min:
44.65 fps, P1:
69.3 fps, max:
142.78 fps
fps
86%
GeForce GTX 1650 Ti Max-Q:
70 [X] MSI Summit E15 A11SCST Intel Core i7-1185G7 3GHz
GeForce GTX 1650 Ti Max-Q
min:
31 fps, P0.1:
43 fps, P1:
51 fps, max:
108 fps
89 ~ 80 fps
100%
GeForce GTX 1650 (Desktop):
56 [X] AMD Ryzen 9 3900X 3.8GHz
GeForce GTX 1650 (Desktop)
min:
27.12 fps, P1:
43.78 fps, max:
96.31 fps
fps
88%
GeForce GTX 1650 Ti Max-Q:
43 [X] MSI Summit E15 A11SCST Intel Core i7-1185G7 3GHz
GeForce GTX 1650 Ti Max-Q
min:
19 fps, P0.1:
25 fps, P1:
33 fps, max:
59 fps
54 ~ 49 fps
100%
GeForce GTX 1650 (Desktop):
47.6 [X] AMD Ryzen 9 3900X 3.8GHz
GeForce GTX 1650 (Desktop)
min:
23.41 fps, P1:
38.66 fps, max:
90.19 fps
fps
86%
GeForce GTX 1650 Ti Max-Q:
37 [X] MSI Summit E15 A11SCST Intel Core i7-1185G7 3GHz
GeForce GTX 1650 Ti Max-Q
min:
19 fps, P0.1:
22 fps, P1:
29 fps, max:
54 fps
39 [X] MSI Summit E15 A11SCST High Performance
Intel Core i7-1185G7 3GHz
GeForce GTX 1650 Ti Max-Q
min:
14 fps, P0.1:
17 fps, P1:
30 fps, max:
39 fps
47 ~ 41 fps
100%
GeForce GTX 1650 (Desktop):
21.2 [X] AMD Ryzen 9 3900X 3.8GHz
GeForce GTX 1650 (Desktop)
min:
11.04 fps, P1:
15.31 fps, max:
67.16 fps
fps
75%
GeForce GTX 1650 Ti Max-Q:
11 21 ~ 16 fps
100%
GeForce GTX 1650 (Desktop):
14.3 [X] AMD Ryzen 9 3900X 3.8GHz
GeForce GTX 1650 (Desktop)
min:
6.94 fps, P1:
10.67 fps, max:
74.03 fps
fps
98%
GeForce GTX 1650 Ti Max-Q:
14 fps
100%
GeForce GTX 1650 (Desktop):
8 [X] AMD Ryzen 9 3900X 3.8GHz
GeForce GTX 1650 (Desktop)
min:
4.35 fps, P1:
6.21 fps, max:
64.42 fps
fps
100%
GeForce GTX 1650 (Desktop):
231 [X] AMD Ryzen 9 3900X 3.8GHz
GeForce GTX 1650 (Desktop)
min:
10.2 fps, P1:
163 fps, max:
305 fps
fps
91%
GeForce GTX 1650 Ti Max-Q:
210 fps
100%
GeForce GTX 1650 (Desktop):
224 [X] AMD Ryzen 9 3900X 3.8GHz
GeForce GTX 1650 (Desktop)
min:
17.8 fps, P1:
158 fps, max:
310 fps
fps
90%
GeForce GTX 1650 Ti Max-Q:
202 fps
100%
GeForce GTX 1650 (Desktop):
206 [X] AMD Ryzen 9 3900X 3.8GHz
GeForce GTX 1650 (Desktop)
min:
14.5 fps, P1:
146 fps, max:
282 fps
fps
94%
GeForce GTX 1650 Ti Max-Q:
192.9 fps
100%
GeForce GTX 1650 (Desktop):
184 [X] AMD Ryzen 9 3900X 3.8GHz
GeForce GTX 1650 (Desktop)
min:
50.1 fps, P1:
130 fps, max:
260 fps
fps
90%
GeForce GTX 1650 Ti Max-Q:
165.2 fps
100%
GeForce GTX 1650 (Desktop):
145 [X] AMD Ryzen 9 3900X 3.8GHz
GeForce GTX 1650 (Desktop)
min:
12.5 fps, P1:
110 fps, max:
240 fps
fps
89%
GeForce GTX 1650 Ti Max-Q:
129.6 fps
100%
GeForce GTX 1650 (Desktop):
86.3 [X] AMD Ryzen 9 3900X 3.8GHz
GeForce GTX 1650 (Desktop)
min:
33.9 fps, P1:
72 fps, max:
227 fps
fps
92%
GeForce GTX 1650 Ti Max-Q:
79.6 fps
100%
GeForce GTX 1650 (Desktop):
312 [X] AMD Ryzen 9 3900X 3.8GHz
GeForce GTX 1650 (Desktop)
min:
29.3 fps, P1:
234 fps, max:
458 fps
fps
71%
GeForce GTX 1650 Ti Max-Q:
222 fps
100%
GeForce GTX 1650 (Desktop):
146 [X] AMD Ryzen 9 3900X 3.8GHz
GeForce GTX 1650 (Desktop)
min:
54.5 fps, P1:
116 fps, max:
450 fps
fps
85%
GeForce GTX 1650 Ti Max-Q:
124 fps
100%
GeForce GTX 1650 (Desktop):
123 [X] AMD Ryzen 9 3900X 3.8GHz
GeForce GTX 1650 (Desktop)
min:
58.2 fps, P1:
97.8 fps, max:
375 fps
fps
92%
GeForce GTX 1650 Ti Max-Q:
112.9 fps
100%
GeForce GTX 1650 (Desktop):
114 [X] AMD Ryzen 9 3900X 3.8GHz
GeForce GTX 1650 (Desktop)
min:
35.2 fps, P1:
92.9 fps, max:
379 fps
fps
91%
GeForce GTX 1650 Ti Max-Q:
103.4 fps
100%
GeForce GTX 1650 (Desktop):
72.9 [X] AMD Ryzen 9 3900X 3.8GHz
GeForce GTX 1650 (Desktop)
min:
42.7 fps, P1:
61.2 fps, max:
197 fps
fps
96%
GeForce GTX 1650 Ti Max-Q:
70 fps
100%
GeForce GTX 1650 (Desktop):
39.6 [X] AMD Ryzen 9 3900X 3.8GHz
GeForce GTX 1650 (Desktop)
min:
30 fps, P1:
34.9 fps, max:
58.7 fps
fps
78%
GeForce GTX 1650 Ti Max-Q:
30.7 fps
100%
GeForce GTX 1650 (Desktop):
103.8 [X] AMD Ryzen 9 3900X 3.8GHz
GeForce GTX 1650 (Desktop)
fps
90%
GeForce GTX 1650 Ti Max-Q:
93.9 fps
100%
GeForce GTX 1650 (Desktop):
49.7 [X] AMD Ryzen 9 3900X 3.8GHz
GeForce GTX 1650 (Desktop)
fps
93%
GeForce GTX 1650 Ti Max-Q:
46.2 fps
100%
GeForce GTX 1650 (Desktop):
45.2 [X] AMD Ryzen 9 3900X 3.8GHz
GeForce GTX 1650 (Desktop)
fps
95%
GeForce GTX 1650 Ti Max-Q:
43 fps
100%
GeForce GTX 1650 (Desktop):
29 [X] AMD Ryzen 9 3900X 3.8GHz
GeForce GTX 1650 (Desktop)
fps
96%
GeForce GTX 1650 Ti Max-Q:
27.9 fps
100%
GeForce GTX 1650 (Desktop):
14.5 [X] AMD Ryzen 9 3900X 3.8GHz
GeForce GTX 1650 (Desktop)
fps
97%
GeForce GTX 1650 Ti Max-Q:
14.1 fps
100%
GeForce GTX 1650 (Desktop):
138.7 [X] AMD Ryzen 9 3900X 3.8GHz
GeForce GTX 1650 (Desktop)
fps
76%
GeForce GTX 1650 Ti Max-Q:
94.8 [X] MSI Summit E15 A11SCST Intel Core i7-1185G7 3GHz
GeForce GTX 1650 Ti Max-Q
min:
6.8 fps, P0.1:
19 fps, P1:
48.4 fps, max:
187 fps
115.7 ~ 105 fps
100%
GeForce GTX 1650 (Desktop):
57.5 [X] AMD Ryzen 9 3900X 3.8GHz
GeForce GTX 1650 (Desktop)
fps
87%
GeForce GTX 1650 Ti Max-Q:
47.5 [X] MSI Summit E15 A11SCST Intel Core i7-1185G7 3GHz
GeForce GTX 1650 Ti Max-Q
min:
7.4 fps, P0.1:
10.4 fps, P1:
23.4 fps, max:
86.8 fps
51.9 ~ 50 fps
100%
GeForce GTX 1650 (Desktop):
43.3 [X] AMD Ryzen 9 3900X 3.8GHz
GeForce GTX 1650 (Desktop)
fps
90%
GeForce GTX 1650 Ti Max-Q:
36.8 [X] MSI Summit E15 A11SCST Intel Core i7-1185G7 3GHz
GeForce GTX 1650 Ti Max-Q
min:
12.2 fps, P0.1:
12.7 fps, P1:
19.3 fps, max:
92.5 fps
40.8 ~ 39 fps
100%
GeForce GTX 1650 (Desktop):
17.8 [X] AMD Ryzen 9 3900X 3.8GHz
GeForce GTX 1650 (Desktop)
fps
146%
GeForce GTX 1650 Ti Max-Q:
20.9 [X] MSI Summit E15 A11SCST Intel Core i7-1185G7 3GHz
GeForce GTX 1650 Ti Max-Q
min:
6.91 fps, P0.1:
8.01 fps, P1:
9.96 fps, max:
62.5 fps
30.5 ~ 26 fps
100%
GeForce GTX 1650 (Desktop):
13.7 [X] AMD Ryzen 9 3900X 3.8GHz
GeForce GTX 1650 (Desktop)
fps
163%
GeForce GTX 1650 Ti Max-Q:
22.3 fps
100%
GeForce GTX 1650 (Desktop):
9.9 [X] AMD Ryzen 9 3900X 3.8GHz
GeForce GTX 1650 (Desktop)
fps
100%
GeForce GTX 1650 (Desktop):
170 [X] KFA2 GeForce GTX 1650 EX One Click Plus AMD Ryzen 9 5900X 3.7GHz
GeForce GTX 1650 (Desktop)
min:
32.7 fps, P0.1:
35.5 fps, P1:
39.9 fps, max:
467 fps
fps
91%
GeForce GTX 1650 Ti Max-Q:
154.1 fps
100%
GeForce GTX 1650 (Desktop):
65.2 [X] KFA2 GeForce GTX 1650 EX One Click Plus AMD Ryzen 9 5900X 3.7GHz
GeForce GTX 1650 (Desktop)
min:
14.6 fps, P0.1:
14.8 fps, P1:
15.6 fps, max:
403 fps
fps
92%
GeForce GTX 1650 Ti Max-Q:
59.8 fps
100%
GeForce GTX 1650 (Desktop):
35.5 [X] KFA2 GeForce GTX 1650 EX One Click Plus AMD Ryzen 9 5900X 3.7GHz
GeForce GTX 1650 (Desktop)
min:
20.4 fps, P0.1:
20.6 fps, P1:
27.6 fps, max:
52.7 fps
fps
90%
GeForce GTX 1650 Ti Max-Q:
31.9 fps
100%
GeForce GTX 1650 (Desktop):
27.6 [X] KFA2 GeForce GTX 1650 EX One Click Plus AMD Ryzen 9 5900X 3.7GHz
GeForce GTX 1650 (Desktop)
min:
22.5 fps, P0.1:
22.7 fps, P1:
23.3 fps, max:
41.4 fps
fps
86%
GeForce GTX 1650 Ti Max-Q:
23.6 fps
100%
GeForce GTX 1650 (Desktop):
19.6 [X] KFA2 GeForce GTX 1650 EX One Click Plus AMD Ryzen 9 5900X 3.7GHz
GeForce GTX 1650 (Desktop)
min:
16.2 fps, P0.1:
16.3 fps, P1:
16.8 fps, max:
38.9 fps
fps
100%
GeForce GTX 1650 (Desktop):
10.8 [X] KFA2 GeForce GTX 1650 EX One Click Plus AMD Ryzen 9 5900X 3.7GHz
GeForce GTX 1650 (Desktop)
min:
5.94 fps, P0.1:
6.65 fps, P1:
9.41 fps, max:
13.4 fps
fps
100%
GeForce GTX 1650 (Desktop):
76.7 [X] AMD Ryzen 9 3900X 3.8GHz
GeForce GTX 1650 (Desktop)
fps
100%
GeForce GTX 1650 (Desktop):
35.6 [X] AMD Ryzen 9 3900X 3.8GHz
GeForce GTX 1650 (Desktop)
fps
100%
GeForce GTX 1650 (Desktop):
25.3 [X] AMD Ryzen 9 3900X 3.8GHz
GeForce GTX 1650 (Desktop)
fps
100%
GeForce GTX 1650 (Desktop):
17 [X] AMD Ryzen 9 3900X 3.8GHz
GeForce GTX 1650 (Desktop)
fps
100%
GeForce GTX 1650 (Desktop):
12.3 [X] AMD Ryzen 9 3900X 3.8GHz
GeForce GTX 1650 (Desktop)
fps
100%
GeForce GTX 1650 (Desktop):
5 [X] AMD Ryzen 9 3900X 3.8GHz
GeForce GTX 1650 (Desktop)
fps
100%
GeForce GTX 1650 (Desktop):
99 [X] AMD Ryzen 9 3900X 3.8GHz
GeForce GTX 1650 (Desktop)
min:
32 fps, max:
175 fps
fps
91%
GeForce GTX 1650 Ti Max-Q:
80 99 ~ 90 fps
100%
GeForce GTX 1650 (Desktop):
55 [X] AMD Ryzen 9 3900X 3.8GHz
GeForce GTX 1650 (Desktop)
min:
21 fps, max:
83 fps
fps
91%
GeForce GTX 1650 Ti Max-Q:
42 58 ~ 50 fps
100%
GeForce GTX 1650 (Desktop):
46 [X] AMD Ryzen 9 3900X 3.8GHz
GeForce GTX 1650 (Desktop)
min:
19 fps, max:
92 fps
fps
87%
GeForce GTX 1650 Ti Max-Q:
35 36 [X] MSI Summit E15 A11SCST High Performance
Intel Core i7-1185G7 3GHz
GeForce GTX 1650 Ti Max-Q
min:
24 fps, max:
57 fps
48 ~ 40 fps
100%
GeForce GTX 1650 (Desktop):
36 [X] AMD Ryzen 9 3900X 3.8GHz
GeForce GTX 1650 (Desktop)
min:
23 fps, max:
62 fps
fps
100%
GeForce GTX 1650 Ti Max-Q:
32 40 ~ 36 fps
100%
GeForce GTX 1650 (Desktop):
26 [X] AMD Ryzen 9 3900X 3.8GHz
GeForce GTX 1650 (Desktop)
min:
16 fps, max:
43 fps
fps
115%
GeForce GTX 1650 Ti Max-Q:
30 fps
100%
GeForce GTX 1650 (Desktop):
15 [X] AMD Ryzen 9 3900X 3.8GHz
GeForce GTX 1650 (Desktop)
min:
7 fps, max:
40 fps
fps
53%
GeForce GTX 1650 Ti Max-Q:
8 fps
100%
GeForce GTX 1650 (Desktop):
98.2 [X] AMD Ryzen 9 3900X 3.8GHz
GeForce GTX 1650 (Desktop)
P1:
82.6 fps
fps
95%
GeForce GTX 1650 Ti Max-Q:
85.6 99.6 ~ 93 fps
100%
GeForce GTX 1650 (Desktop):
58.7 [X] AMD Ryzen 9 3900X 3.8GHz
GeForce GTX 1650 (Desktop)
P1:
48.3 fps
fps
97%
GeForce GTX 1650 Ti Max-Q:
53.6 60.9 ~ 57 fps
100%
GeForce GTX 1650 (Desktop):
54.4 [X] AMD Ryzen 9 3900X 3.8GHz
GeForce GTX 1650 (Desktop)
P1:
42.2 fps
fps
99%
GeForce GTX 1650 Ti Max-Q:
50.7 56.4 ~ 54 fps
100%
GeForce GTX 1650 (Desktop):
52.7 [X] AMD Ryzen 9 3900X 3.8GHz
GeForce GTX 1650 (Desktop)
P1:
25.1 fps
fps
99%
GeForce GTX 1650 Ti Max-Q:
49.5 54.4 ~ 52 fps
100%
GeForce GTX 1650 (Desktop):
35.6 [X] AMD Ryzen 9 3900X 3.8GHz
GeForce GTX 1650 (Desktop)
P1:
25.3 fps
fps
101%
GeForce GTX 1650 Ti Max-Q:
35.9 fps
100%
GeForce GTX 1650 (Desktop):
17.3 [X] AMD Ryzen 9 3900X 3.8GHz
GeForce GTX 1650 (Desktop)
P1:
14.8 fps
fps
97%
GeForce GTX 1650 Ti Max-Q:
16.8 fps
100%
GeForce GTX 1650 (Desktop):
219 [X] 675864
AMD Ryzen 9 3900X 3.8GHz
GeForce GTX 1650 (Desktop)
min:
202 fps, max:
239 fps
fps
96%
GeForce GTX 1650 Ti Max-Q:
211 fps
100%
GeForce GTX 1650 (Desktop):
115 [X] 675864
AMD Ryzen 9 3900X 3.8GHz
GeForce GTX 1650 (Desktop)
min:
100 fps, max:
129 fps
fps
93%
GeForce GTX 1650 Ti Max-Q:
107 fps
100%
GeForce GTX 1650 (Desktop):
88.1 [X] 675864
AMD Ryzen 9 3900X 3.8GHz
GeForce GTX 1650 (Desktop)
min:
75 fps, max:
98 fps
fps
93%
GeForce GTX 1650 Ti Max-Q:
82 fps
100%
GeForce GTX 1650 (Desktop):
60.3 [X] 675864
AMD Ryzen 9 3900X 3.8GHz
GeForce GTX 1650 (Desktop)
min:
49 fps, max:
72 fps
fps
95%
GeForce GTX 1650 Ti Max-Q:
57 fps
100%
GeForce GTX 1650 (Desktop):
42.9 [X] 675864
AMD Ryzen 9 3900X 3.8GHz
GeForce GTX 1650 (Desktop)
min:
36 fps, max:
50 fps
fps
96%
GeForce GTX 1650 Ti Max-Q:
41 fps
100%
GeForce GTX 1650 (Desktop):
23.4 [X] 675864
AMD Ryzen 9 3900X 3.8GHz
GeForce GTX 1650 (Desktop)
min:
19 fps, max:
27 fps
fps
94%
GeForce GTX 1650 Ti Max-Q:
22 fps
100%
GeForce GTX 1650 (Desktop):
341.7 [X] AMD Ryzen 9 3900X 3.8GHz
GeForce GTX 1650 (Desktop)
fps
100%
GeForce GTX 1650 (Desktop):
291.8 [X] AMD Ryzen 9 3900X 3.8GHz
GeForce GTX 1650 (Desktop)
fps
100%
GeForce GTX 1650 (Desktop):
260.1 [X] AMD Ryzen 9 3900X 3.8GHz
GeForce GTX 1650 (Desktop)
fps
100%
GeForce GTX 1650 (Desktop):
176.6 [X] AMD Ryzen 9 3900X 3.8GHz
GeForce GTX 1650 (Desktop)
fps
100%
GeForce GTX 1650 (Desktop):
82.8 [X] AMD Ryzen 9 3900X 3.8GHz
GeForce GTX 1650 (Desktop)
fps
100%
GeForce GTX 1650 (Desktop):
252.9 [X] AMD Ryzen 9 3900X 3.8GHz
GeForce GTX 1650 (Desktop)
259.1 [X] Gainward GeForce GTX 1650 4 GB AMD Ryzen 9 3900X 3.8GHz
GeForce GTX 1650 (Desktop)
~ 256 fps
67%
Vega M GL / 870:
172.7 [X] Dell XPS 15 9575 FY00N Intel Core i7-8705G 3.1GHz
Vega M GL / 870
fps
64%
GeForce GTX 1650 Ti Max-Q:
162.9 fps
100%
GeForce GTX 1650 (Desktop):
86.7 [X] AMD Ryzen 9 3900X 3.8GHz
GeForce GTX 1650 (Desktop)
95.8 [X] Gainward GeForce GTX 1650 4 GB AMD Ryzen 9 3900X 3.8GHz
GeForce GTX 1650 (Desktop)
~ 91 fps
63%
Vega M GL / 870:
57.7 [X] Dell XPS 15 9575 FY00N Intel Core i7-8705G 3.1GHz
Vega M GL / 870
fps
81%
GeForce GTX 1650 Ti Max-Q:
73.7 fps
100%
GeForce GTX 1650 (Desktop):
56 [X] AMD Ryzen 9 3900X 3.8GHz
GeForce GTX 1650 (Desktop)
62.2 [X] Gainward GeForce GTX 1650 4 GB AMD Ryzen 9 3900X 3.8GHz
GeForce GTX 1650 (Desktop)
~ 59 fps
67%
Vega M GL / 870:
39.4 [X] Dell XPS 15 9575 FY00N Intel Core i7-8705G 3.1GHz
Vega M GL / 870
fps
75%
GeForce GTX 1650 Ti Max-Q:
44.4 fps
100%
GeForce GTX 1650 (Desktop):
39.4 [X] Gainward GeForce GTX 1650 4 GB AMD Ryzen 9 3900X 3.8GHz
GeForce GTX 1650 (Desktop)
40.1 [X] AMD Ryzen 9 3900X 3.8GHz
GeForce GTX 1650 (Desktop)
~ 40 fps
69%
Vega M GL / 870:
27.4 [X] Dell XPS 15 9575 FY00N Intel Core i7-8705G 3.1GHz
Vega M GL / 870
fps
84%
GeForce GTX 1650 Ti Max-Q:
33.4 fps
100%
GeForce GTX 1650 (Desktop):
26 [X] Gainward GeForce GTX 1650 4 GB AMD Ryzen 9 3900X 3.8GHz
GeForce GTX 1650 (Desktop)
27.8 [X] AMD Ryzen 9 3900X 3.8GHz
GeForce GTX 1650 (Desktop)
~ 27 fps
68%
Vega M GL / 870:
18.4 [X] Dell XPS 15 9575 FY00N Intel Core i7-8705G 3.1GHz
Vega M GL / 870
fps
87%
GeForce GTX 1650 Ti Max-Q:
23.5 fps
100%
GeForce GTX 1650 (Desktop):
14.4 [X] Gainward GeForce GTX 1650 4 GB AMD Ryzen 9 3900X 3.8GHz
GeForce GTX 1650 (Desktop)
15 [X] AMD Ryzen 9 3900X 3.8GHz
GeForce GTX 1650 (Desktop)
~ 15 fps
59%
Vega M GL / 870:
8.8 [X] Dell XPS 15 9575 FY00N Intel Core i7-8705G 3.1GHz
Vega M GL / 870
fps
90%
GeForce GTX 1650 Ti Max-Q:
13.5 fps
100%
GeForce GTX 1650 (Desktop):
116 [X] AMD Ryzen 9 3900X 3.8GHz
GeForce GTX 1650 (Desktop)
P1:
97.1 fps
163 [X] Gainward GeForce GTX 1650 4 GB AMD Ryzen 9 3900X 3.8GHz
GeForce GTX 1650 (Desktop)
P1:
109.9 fps
~ 140 fps
60%
Vega M GL / 870:
83.4 [X] Dell XPS 15 9575 FY00N Intel Core i7-8705G 3.1GHz
Vega M GL / 870
fps
104%
GeForce GTX 1650 Ti Max-Q:
145.1 fps
100%
GeForce GTX 1650 (Desktop):
80.4 [X] AMD Ryzen 9 3900X 3.8GHz
GeForce GTX 1650 (Desktop)
P1:
67.6 fps
90.2 [X] Gainward GeForce GTX 1650 4 GB AMD Ryzen 9 3900X 3.8GHz
GeForce GTX 1650 (Desktop)
P1:
68 fps
~ 85 fps
55%
Vega M GL / 870:
46.7 [X] Dell XPS 15 9575 FY00N Intel Core i7-8705G 3.1GHz
Vega M GL / 870
fps
107%
GeForce GTX 1650 Ti Max-Q:
91.2 fps
100%
GeForce GTX 1650 (Desktop):
61.4 [X] AMD Ryzen 9 3900X 3.8GHz
GeForce GTX 1650 (Desktop)
P1:
49 fps
77.2 [X] Gainward GeForce GTX 1650 4 GB AMD Ryzen 9 3900X 3.8GHz
GeForce GTX 1650 (Desktop)
P1:
58.8 fps
~ 69 fps
39%
Vega M GL / 870:
27 [X] Dell XPS 15 9575 FY00N Intel Core i7-8705G 3.1GHz
Vega M GL / 870
fps
76%
GeForce GTX 1650 Ti Max-Q:
52.6 fps
100%
GeForce GTX 1650 (Desktop):
69.5 [X] Gainward GeForce GTX 1650 4 GB AMD Ryzen 9 3900X 3.8GHz
GeForce GTX 1650 (Desktop)
P1:
55.9 fps
fps
100%
GeForce GTX 1650 (Desktop):
40.3 [X] Gainward GeForce GTX 1650 4 GB AMD Ryzen 9 3900X 3.8GHz
GeForce GTX 1650 (Desktop)
P1:
31.3 fps
fps
100%
GeForce GTX 1650 (Desktop):
20.8 [X] Gainward GeForce GTX 1650 4 GB AMD Ryzen 9 3900X 3.8GHz
GeForce GTX 1650 (Desktop)
P1:
16.7 fps
fps
100%
GeForce GTX 1650 (Desktop):
138 [X] Gainward GeForce GTX 1650 4 GB AMD Ryzen 9 3900X 3.8GHz
GeForce GTX 1650 (Desktop)
min:
129 fps, max:
145 fps
153 [X] AMD Ryzen 9 3900X 3.8GHz
GeForce GTX 1650 (Desktop)
min:
140 fps, max:
183 fps
~ 146 fps
62%
Vega M GL / 870:
90.6 [X] Dell XPS 15 9575 FY00N Intel Core i7-8705G 3.1GHz
Vega M GL / 870
fps
79%
GeForce GTX 1650 Ti Max-Q:
115.7 fps
100%
GeForce GTX 1650 (Desktop):
50.2 [X] Gainward GeForce GTX 1650 4 GB AMD Ryzen 9 3900X 3.8GHz
GeForce GTX 1650 (Desktop)
min:
46 fps, max:
55 fps
60.8 [X] AMD Ryzen 9 3900X 3.8GHz
GeForce GTX 1650 (Desktop)
min:
53 fps, max:
73 fps
~ 56 fps
63%
Vega M GL / 870:
35.3 [X] Dell XPS 15 9575 FY00N Intel Core i7-8705G 3.1GHz
Vega M GL / 870
fps
89%
GeForce GTX 1650 Ti Max-Q:
50.1 fps
100%
GeForce GTX 1650 (Desktop):
44.9 [X] Gainward GeForce GTX 1650 4 GB AMD Ryzen 9 3900X 3.8GHz
GeForce GTX 1650 (Desktop)
min:
40 fps, max:
48 fps
46.7 [X] AMD Ryzen 9 3900X 3.8GHz
GeForce GTX 1650 (Desktop)
min:
42 fps, max:
57 fps
~ 46 fps
64%
Vega M GL / 870:
29.5 [X] Dell XPS 15 9575 FY00N Intel Core i7-8705G 3.1GHz
Vega M GL / 870
fps
91%
GeForce GTX 1650 Ti Max-Q:
41.8 fps
100%
GeForce GTX 1650 (Desktop):
27.1 [X] Gainward GeForce GTX 1650 4 GB AMD Ryzen 9 3900X 3.8GHz
GeForce GTX 1650 (Desktop)
min:
24 fps, max:
30 fps
29.3 [X] AMD Ryzen 9 3900X 3.8GHz
GeForce GTX 1650 (Desktop)
min:
24 fps, max:
37 fps
~ 28 fps
68%
Vega M GL / 870:
18.9 [X] Dell XPS 15 9575 FY00N Intel Core i7-8705G 3.1GHz
Vega M GL / 870
fps
100%
GeForce GTX 1650 (Desktop):
12.5 [X] Gainward GeForce GTX 1650 4 GB AMD Ryzen 9 3900X 3.8GHz
GeForce GTX 1650 (Desktop)
min:
11 fps, max:
15 fps
25.7 [X] AMD Ryzen 9 3900X 3.8GHz
GeForce GTX 1650 (Desktop)
min:
23 fps, max:
31 fps
~ 19 fps
100%
GeForce GTX 1650 (Desktop):
119 [X] Gainward GeForce GTX 1650 4 GB AMD Ryzen 9 3900X 3.8GHz
GeForce GTX 1650 (Desktop)
min:
106 fps, max:
122 fps
fps
82%
Vega M GL / 870:
97.9 [X] Dell XPS 15 9575 FY00N Intel Core i7-8705G 3.1GHz
Vega M GL / 870
fps
101%
GeForce GTX 1650 Ti Max-Q:
120.7 fps
100%
GeForce GTX 1650 (Desktop):
81.1 [X] Gainward GeForce GTX 1650 4 GB AMD Ryzen 9 3900X 3.8GHz
GeForce GTX 1650 (Desktop)
min:
68 fps, max:
93 fps
fps
56%
Vega M GL / 870:
45.2 [X] Dell XPS 15 9575 FY00N Intel Core i7-8705G 3.1GHz
Vega M GL / 870
fps
88%
GeForce GTX 1650 Ti Max-Q:
71.2 fps
100%
GeForce GTX 1650 (Desktop):
74.2 [X] Gainward GeForce GTX 1650 4 GB AMD Ryzen 9 3900X 3.8GHz
GeForce GTX 1650 (Desktop)
min:
69 fps, max:
82 fps
fps
46%
Vega M GL / 870:
34.3 [X] Dell XPS 15 9575 FY00N Intel Core i7-8705G 3.1GHz
Vega M GL / 870
fps
71%
GeForce GTX 1650 Ti Max-Q:
52.8 fps
100%
GeForce GTX 1650 (Desktop):
59.6 [X] Gainward GeForce GTX 1650 4 GB AMD Ryzen 9 3900X 3.8GHz
GeForce GTX 1650 (Desktop)
min:
46 fps, max:
70 fps
fps
50%
Vega M GL / 870:
29.8 [X] Dell XPS 15 9575 FY00N Intel Core i7-8705G 3.1GHz
Vega M GL / 870
fps
79%
GeForce GTX 1650 Ti Max-Q:
47 fps
100%
GeForce GTX 1650 (Desktop):
38.4 [X] Gainward GeForce GTX 1650 4 GB AMD Ryzen 9 3900X 3.8GHz
GeForce GTX 1650 (Desktop)
min:
34 fps, max:
44 fps
fps
54%
Vega M GL / 870:
20.8 [X] Dell XPS 15 9575 FY00N Intel Core i7-8705G 3.1GHz
Vega M GL / 870
fps
100%
GeForce GTX 1650 (Desktop):
18.7 [X] Gainward GeForce GTX 1650 4 GB AMD Ryzen 9 3900X 3.8GHz
GeForce GTX 1650 (Desktop)
min:
17 fps, max:
21 fps
fps
51%
Vega M GL / 870:
9.5 [X] Dell XPS 15 9575 FY00N Intel Core i7-8705G 3.1GHz
Vega M GL / 870
fps
100%
GeForce GTX 1650 (Desktop):
99 [X] Gainward GeForce GTX 1650 4 GB AMD Ryzen 9 3900X 3.8GHz
GeForce GTX 1650 (Desktop)
min:
81.5 fps, P1:
90.9 fps, max:
131 fps
111 [X] AMD Ryzen 9 3900X 3.8GHz
GeForce GTX 1650 (Desktop)
min:
93 fps, max:
144 fps
~ 105 fps
66%
Vega M GL / 870:
69.1 [X] Dell XPS 15 9575 FY00N Intel Core i7-8705G 3.1GHz
Vega M GL / 870
fps
100%
GeForce GTX 1650 (Desktop):
50.4 [X] Gainward GeForce GTX 1650 4 GB AMD Ryzen 9 3900X 3.8GHz
GeForce GTX 1650 (Desktop)
min:
39.7 fps, P1:
43.5 fps, max:
67.2 fps
54 [X] AMD Ryzen 9 3900X 3.8GHz
GeForce GTX 1650 (Desktop)
min:
46 fps, max:
69 fps
~ 52 fps
67%
Vega M GL / 870:
34.9 [X] Dell XPS 15 9575 FY00N Intel Core i7-8705G 3.1GHz
Vega M GL / 870
fps
100%
GeForce GTX 1650 (Desktop):
33.4 [X] Gainward GeForce GTX 1650 4 GB AMD Ryzen 9 3900X 3.8GHz
GeForce GTX 1650 (Desktop)
min:
24.1 fps, P1:
26.3 fps, max:
44.9 fps
34 [X] AMD Ryzen 9 3900X 3.8GHz
GeForce GTX 1650 (Desktop)
min:
26 fps, max:
45 fps
~ 34 fps
61%
Vega M GL / 870:
20.6 [X] Dell XPS 15 9575 FY00N Intel Core i7-8705G 3.1GHz
Vega M GL / 870
fps
100%
GeForce GTX 1650 (Desktop):
21.5 [X] Gainward GeForce GTX 1650 4 GB AMD Ryzen 9 3900X 3.8GHz
GeForce GTX 1650 (Desktop)
min:
13.7 fps, P1:
14.1 fps, max:
27 fps
22 [X] AMD Ryzen 9 3900X 3.8GHz
GeForce GTX 1650 (Desktop)
min:
12 fps, max:
67 fps
~ 22 fps
55%
Vega M GL / 870:
12.1 [X] Dell XPS 15 9575 FY00N Intel Core i7-8705G 3.1GHz
Vega M GL / 870
fps
100%
GeForce GTX 1650 (Desktop):
17.1 [X] Gainward GeForce GTX 1650 4 GB AMD Ryzen 9 3900X 3.8GHz
GeForce GTX 1650 (Desktop)
min:
11.9 fps, P1:
12.2 fps, max:
22.1 fps
fps
100%
GeForce GTX 1650 (Desktop):
77 [X] Gainward GeForce GTX 1650 4 GB AMD Ryzen 9 3900X 3.8GHz
GeForce GTX 1650 (Desktop)
min:
56 fps, max:
92 fps
77.7 [X] AMD Ryzen 9 3900X 3.8GHz
GeForce GTX 1650 (Desktop)
min:
58 fps, max:
90 fps
~ 77 fps
62%
Vega M GL / 870:
47.7 [X] Dell XPS 15 9575 FY00N Intel Core i7-8705G 3.1GHz
Vega M GL / 870
fps
82%
GeForce GTX 1650 Ti Max-Q:
63.3 fps
100%
GeForce GTX 1650 (Desktop):
61 [X] Gainward GeForce GTX 1650 4 GB AMD Ryzen 9 3900X 3.8GHz
GeForce GTX 1650 (Desktop)
min:
51 fps, max:
74 fps
65.5 [X] AMD Ryzen 9 3900X 3.8GHz
GeForce GTX 1650 (Desktop)
min:
56 fps, max:
79 fps
~ 63 fps
62%
Vega M GL / 870:
39.3 [X] Dell XPS 15 9575 FY00N Intel Core i7-8705G 3.1GHz
Vega M GL / 870
fps
84%
GeForce GTX 1650 Ti Max-Q:
53.2 fps
100%
GeForce GTX 1650 (Desktop):
52.8 [X] Gainward GeForce GTX 1650 4 GB AMD Ryzen 9 3900X 3.8GHz
GeForce GTX 1650 (Desktop)
min:
46 fps, max:
61 fps
54.9 [X] AMD Ryzen 9 3900X 3.8GHz
GeForce GTX 1650 (Desktop)
min:
45 fps, max:
62 fps
~ 54 fps
59%
Vega M GL / 870:
32 [X] Dell XPS 15 9575 FY00N Intel Core i7-8705G 3.1GHz
Vega M GL / 870
fps
85%
GeForce GTX 1650 Ti Max-Q:
46 fps
100%
GeForce GTX 1650 (Desktop):
33.1 [X] Gainward GeForce GTX 1650 4 GB AMD Ryzen 9 3900X 3.8GHz
GeForce GTX 1650 (Desktop)
min:
29 fps, max:
38 fps
36.3 [X] AMD Ryzen 9 3900X 3.8GHz
GeForce GTX 1650 (Desktop)
min:
32 fps, max:
41 fps
~ 35 fps
59%
Vega M GL / 870:
20.8 [X] Dell XPS 15 9575 FY00N Intel Core i7-8705G 3.1GHz
Vega M GL / 870
fps
100%
GeForce GTX 1650 (Desktop):
16.2 [X] Gainward GeForce GTX 1650 4 GB AMD Ryzen 9 3900X 3.8GHz
GeForce GTX 1650 (Desktop)
min:
14 fps, max:
19 fps
17 [X] AMD Ryzen 9 3900X 3.8GHz
GeForce GTX 1650 (Desktop)
min:
15 fps, max:
19 fps
~ 17 fps
58%
Vega M GL / 870:
9.9 [X] Dell XPS 15 9575 FY00N Intel Core i7-8705G 3.1GHz
Vega M GL / 870
fps
100%
GeForce GTX 1650 (Desktop):
113 [X] Gainward GeForce GTX 1650 4 GB AMD Ryzen 9 3900X 3.8GHz
GeForce GTX 1650 (Desktop)
min:
94 fps, max:
133 fps
114 [X] AMD Ryzen 9 3900X 3.8GHz
GeForce GTX 1650 (Desktop)
min:
98 fps, max:
135 fps
~ 114 fps
57%
Vega M GL / 870:
64.9 [X] Dell XPS 15 9575 FY00N Intel Core i7-8705G 3.1GHz
Vega M GL / 870
fps
54%
GeForce GTX 1650 Ti Max-Q:
61.8 fps
100%
GeForce GTX 1650 (Desktop):
64.4 [X] AMD Ryzen 9 3900X 3.8GHz
GeForce GTX 1650 (Desktop)
min:
39 fps, max:
75 fps
65 [X] Gainward GeForce GTX 1650 4 GB AMD Ryzen 9 3900X 3.8GHz
GeForce GTX 1650 (Desktop)
min:
56 fps, max:
74 fps
~ 65 fps
67%
Vega M GL / 870:
43.7 [X] Dell XPS 15 9575 FY00N Intel Core i7-8705G 3.1GHz
Vega M GL / 870
fps
76%
GeForce GTX 1650 Ti Max-Q:
49.3 fps
100%
GeForce GTX 1650 (Desktop):
53.6 [X] AMD Ryzen 9 3900X 3.8GHz
GeForce GTX 1650 (Desktop)
min:
12 fps, max:
66 fps
56.7 [X] Gainward GeForce GTX 1650 4 GB AMD Ryzen 9 3900X 3.8GHz
GeForce GTX 1650 (Desktop)
min:
45 fps, max:
65 fps
~ 55 fps
67%
Vega M GL / 870:
36.7 [X] Dell XPS 15 9575 FY00N Intel Core i7-8705G 3.1GHz
Vega M GL / 870
fps
83%
GeForce GTX 1650 Ti Max-Q:
45.8 fps
100%
GeForce GTX 1650 (Desktop):
39 [X] AMD Ryzen 9 3900X 3.8GHz
GeForce GTX 1650 (Desktop)
min:
16 fps, max:
56 fps
48.4 [X] Gainward GeForce GTX 1650 4 GB AMD Ryzen 9 3900X 3.8GHz
GeForce GTX 1650 (Desktop)
min:
38 fps, max:
56 fps
~ 44 fps
69%
Vega M GL / 870:
30.5 [X] Dell XPS 15 9575 FY00N Intel Core i7-8705G 3.1GHz
Vega M GL / 870
fps
77%
GeForce GTX 1650 Ti Max-Q:
33.9 fps
100%
GeForce GTX 1650 (Desktop):
17.7 [X] AMD Ryzen 9 3900X 3.8GHz
GeForce GTX 1650 (Desktop)
min:
7 fps, max:
34 fps
20.6 [X] Gainward GeForce GTX 1650 4 GB AMD Ryzen 9 3900X 3.8GHz
GeForce GTX 1650 (Desktop)
min:
9 fps, max:
38 fps
~ 19 fps
116%
Vega M GL / 870:
22.1 [X] Dell XPS 15 9575 FY00N Intel Core i7-8705G 3.1GHz
Vega M GL / 870
fps
100%
GeForce GTX 1650 (Desktop):
17.1 [X] AMD Ryzen 9 3900X 3.8GHz
GeForce GTX 1650 (Desktop)
min:
11 fps, max:
20 fps
17.3 [X] Gainward GeForce GTX 1650 4 GB AMD Ryzen 9 3900X 3.8GHz
GeForce GTX 1650 (Desktop)
min:
13 fps, max:
20 fps
~ 17 fps
68%
Vega M GL / 870:
11.5 [X] Dell XPS 15 9575 FY00N Intel Core i7-8705G 3.1GHz
Vega M GL / 870
fps
100%
GeForce GTX 1650 (Desktop):
110 [X] Gainward GeForce GTX 1650 4 GB AMD Ryzen 9 3900X 3.8GHz
GeForce GTX 1650 (Desktop)
P1:
83.3 fps
118 [X] AMD Ryzen 9 3900X 3.8GHz
GeForce GTX 1650 (Desktop)
~ 114 fps
63%
Vega M GL / 870:
72.1 [X] Dell XPS 15 9575 FY00N Intel Core i7-8705G 3.1GHz
Vega M GL / 870
fps
100%
GeForce GTX 1650 (Desktop):
74 [X] Gainward GeForce GTX 1650 4 GB AMD Ryzen 9 3900X 3.8GHz
GeForce GTX 1650 (Desktop)
P1:
60.2 fps
78 [X] AMD Ryzen 9 3900X 3.8GHz
GeForce GTX 1650 (Desktop)
~ 76 fps
58%
Vega M GL / 870:
44.4 [X] Dell XPS 15 9575 FY00N Intel Core i7-8705G 3.1GHz
Vega M GL / 870
fps
100%
GeForce GTX 1650 (Desktop):
61 [X] Gainward GeForce GTX 1650 4 GB AMD Ryzen 9 3900X 3.8GHz
GeForce GTX 1650 (Desktop)
P1:
44.6 fps
65 [X] AMD Ryzen 9 3900X 3.8GHz
GeForce GTX 1650 (Desktop)
~ 63 fps
60%
Vega M GL / 870:
37.8 [X] Dell XPS 15 9575 FY00N Intel Core i7-8705G 3.1GHz
Vega M GL / 870
fps
100%
GeForce GTX 1650 (Desktop):
51.7 [X] Gainward GeForce GTX 1650 4 GB AMD Ryzen 9 3900X 3.8GHz
GeForce GTX 1650 (Desktop)
P1:
40 fps
54 [X] AMD Ryzen 9 3900X 3.8GHz
GeForce GTX 1650 (Desktop)
~ 53 fps
63%
Vega M GL / 870:
33.5 [X] Dell XPS 15 9575 FY00N Intel Core i7-8705G 3.1GHz
Vega M GL / 870
fps
100%
GeForce GTX 1650 (Desktop):
35.7 [X] Gainward GeForce GTX 1650 4 GB AMD Ryzen 9 3900X 3.8GHz
GeForce GTX 1650 (Desktop)
P1:
26.4 fps
37 [X] AMD Ryzen 9 3900X 3.8GHz
GeForce GTX 1650 (Desktop)
~ 36 fps
59%
Vega M GL / 870:
21.1 [X] Dell XPS 15 9575 FY00N Intel Core i7-8705G 3.1GHz
Vega M GL / 870
fps
100%
GeForce GTX 1650 (Desktop):
19.1 [X] Gainward GeForce GTX 1650 4 GB AMD Ryzen 9 3900X 3.8GHz
GeForce GTX 1650 (Desktop)
P1:
13.3 fps
21 [X] AMD Ryzen 9 3900X 3.8GHz
GeForce GTX 1650 (Desktop)
~ 20 fps
59%
Vega M GL / 870:
11.8 [X] Dell XPS 15 9575 FY00N Intel Core i7-8705G 3.1GHz
Vega M GL / 870
fps
100%
GeForce GTX 1650 (Desktop):
148 [X] Gainward GeForce GTX 1650 4 GB AMD Ryzen 9 3900X 3.8GHz
GeForce GTX 1650 (Desktop)
P1:
108.7 fps
155 [X] AMD Ryzen 9 3900X 3.8GHz
GeForce GTX 1650 (Desktop)
~ 152 fps
79%
Vega M GL / 870:
120.5 [X] Dell XPS 15 9575 FY00N Intel Core i7-8705G 3.1GHz
Vega M GL / 870
fps
75%
GeForce GTX 1650 Ti Max-Q:
114 fps
100%
GeForce GTX 1650 (Desktop):
82 [X] Gainward GeForce GTX 1650 4 GB AMD Ryzen 9 3900X 3.8GHz
GeForce GTX 1650 (Desktop)
P1:
57.1 fps
86 [X] AMD Ryzen 9 3900X 3.8GHz
GeForce GTX 1650 (Desktop)
~ 84 fps
60%
Vega M GL / 870:
50.5 [X] Dell XPS 15 9575 FY00N Intel Core i7-8705G 3.1GHz
Vega M GL / 870
fps
92%
GeForce GTX 1650 Ti Max-Q:
76.9 fps
100%
GeForce GTX 1650 (Desktop):
68 [X] Gainward GeForce GTX 1650 4 GB AMD Ryzen 9 3900X 3.8GHz
GeForce GTX 1650 (Desktop)
P1:
51.5 fps
70 [X] AMD Ryzen 9 3900X 3.8GHz
GeForce GTX 1650 (Desktop)
~ 69 fps
61%
Vega M GL / 870:
42 [X] Dell XPS 15 9575 FY00N Intel Core i7-8705G 3.1GHz
Vega M GL / 870
fps
93%
GeForce GTX 1650 Ti Max-Q:
64.3 fps
100%
GeForce GTX 1650 (Desktop):
43.1 [X] Gainward GeForce GTX 1650 4 GB AMD Ryzen 9 3900X 3.8GHz
GeForce GTX 1650 (Desktop)
P1:
32.9 fps
45 [X] AMD Ryzen 9 3900X 3.8GHz
GeForce GTX 1650 (Desktop)
~ 44 fps
61%
Vega M GL / 870:
26.8 [X] Dell XPS 15 9575 FY00N Intel Core i7-8705G 3.1GHz
Vega M GL / 870
fps
63%
GeForce GTX 1650 Ti Max-Q:
27.5 fps
100%
GeForce GTX 1650 (Desktop):
31.1 [X] Gainward GeForce GTX 1650 4 GB AMD Ryzen 9 3900X 3.8GHz
GeForce GTX 1650 (Desktop)
P1:
10.4 fps
32 [X] AMD Ryzen 9 3900X 3.8GHz
GeForce GTX 1650 (Desktop)
~ 32 fps
46%
Vega M GL / 870:
14.7 [X] Dell XPS 15 9575 FY00N Intel Core i7-8705G 3.1GHz
Vega M GL / 870
fps
100%
GeForce GTX 1650 (Desktop):
17.4 [X] Gainward GeForce GTX 1650 4 GB AMD Ryzen 9 3900X 3.8GHz
GeForce GTX 1650 (Desktop)
P1:
7.3 fps
18 [X] AMD Ryzen 9 3900X 3.8GHz
GeForce GTX 1650 (Desktop)
~ 18 fps
51%
Vega M GL / 870:
9.2 [X] Dell XPS 15 9575 FY00N Intel Core i7-8705G 3.1GHz
Vega M GL / 870
fps
100%
GeForce GTX 1650 (Desktop):
92 [X] Gainward GeForce GTX 1650 4 GB AMD Ryzen 9 3900X 3.8GHz
GeForce GTX 1650 (Desktop)
min:
37 fps, max:
151 fps
fps
60%
Vega M GL / 870:
55 [X] Dell XPS 15 9575 FY00N Intel Core i7-8705G 3.1GHz
Vega M GL / 870
fps
80%
GeForce GTX 1650 Ti Max-Q:
74 fps
100%
GeForce GTX 1650 (Desktop):
52 [X] Gainward GeForce GTX 1650 4 GB AMD Ryzen 9 3900X 3.8GHz
GeForce GTX 1650 (Desktop)
max:
76 fps
fps
63%
Vega M GL / 870:
33 [X] Dell XPS 15 9575 FY00N Intel Core i7-8705G 3.1GHz
Vega M GL / 870
fps
87%
GeForce GTX 1650 Ti Max-Q:
45 fps
100%
GeForce GTX 1650 (Desktop):
46 [X] Gainward GeForce GTX 1650 4 GB AMD Ryzen 9 3900X 3.8GHz
GeForce GTX 1650 (Desktop)
min:
38 fps, max:
68 fps
fps
65%
Vega M GL / 870:
30 [X] Dell XPS 15 9575 FY00N Intel Core i7-8705G 3.1GHz
Vega M GL / 870
fps
74%
GeForce GTX 1650 Ti Max-Q:
34 fps
100%
GeForce GTX 1650 (Desktop):
8 [X] Gainward GeForce GTX 1650 4 GB AMD Ryzen 9 3900X 3.8GHz
GeForce GTX 1650 (Desktop)
min:
4 fps, max:
34 fps
fps
250%
Vega M GL / 870:
20 [X] Dell XPS 15 9575 FY00N Intel Core i7-8705G 3.1GHz
Vega M GL / 870
fps
275%
GeForce GTX 1650 Ti Max-Q:
22 fps
Vega M GL / 870:
12 [X] Dell XPS 15 9575 FY00N Intel Core i7-8705G 3.1GHz
Vega M GL / 870
fps
Vega M GL / 870:
4 [X] Dell XPS 15 9575 FY00N Intel Core i7-8705G 3.1GHz
Vega M GL / 870
fps
100%
GeForce GTX 1650 (Desktop):
237 [X] AMD Ryzen 9 3900X 3.8GHz
GeForce GTX 1650 (Desktop)
P1:
169.5 fps
263 [X] Gainward GeForce GTX 1650 4 GB AMD Ryzen 9 3900X 3.8GHz
GeForce GTX 1650 (Desktop)
P1:
185.2 fps
~ 250 fps
100%
GeForce GTX 1650 (Desktop):
215 [X] AMD Ryzen 9 3900X 3.8GHz
GeForce GTX 1650 (Desktop)
P1:
151.5 fps
236 [X] Gainward GeForce GTX 1650 4 GB AMD Ryzen 9 3900X 3.8GHz
GeForce GTX 1650 (Desktop)
P1:
169.5 fps
~ 226 fps
100%
GeForce GTX 1650 (Desktop):
192 [X] AMD Ryzen 9 3900X 3.8GHz
GeForce GTX 1650 (Desktop)
P1:
140.8 fps
219 [X] Gainward GeForce GTX 1650 4 GB AMD Ryzen 9 3900X 3.8GHz
GeForce GTX 1650 (Desktop)
P1:
158.7 fps
~ 206 fps
100%
GeForce GTX 1650 (Desktop):
137 [X] AMD Ryzen 9 3900X 3.8GHz
GeForce GTX 1650 (Desktop)
P1:
108.7 fps
184 [X] Gainward GeForce GTX 1650 4 GB AMD Ryzen 9 3900X 3.8GHz
GeForce GTX 1650 (Desktop)
P1:
140.8 fps
~ 161 fps
61%
Vega M GL / 870:
98.9 [X] Dell XPS 15 9575 FY00N Intel Core i7-8705G 3.1GHz
Vega M GL / 870
fps
100%
GeForce GTX 1650 (Desktop):
107 [X] AMD Ryzen 9 3900X 3.8GHz
GeForce GTX 1650 (Desktop)
P1:
89.3 fps
141 [X] Gainward GeForce GTX 1650 4 GB AMD Ryzen 9 3900X 3.8GHz
GeForce GTX 1650 (Desktop)
P1:
114.9 fps
~ 124 fps
62%
Vega M GL / 870:
76.9 [X] Dell XPS 15 9575 FY00N Intel Core i7-8705G 3.1GHz
Vega M GL / 870
fps
100%
GeForce GTX 1650 (Desktop):
69.9 [X] AMD Ryzen 9 3900X 3.8GHz
GeForce GTX 1650 (Desktop)
P1:
61.7 fps
86 [X] Gainward GeForce GTX 1650 4 GB AMD Ryzen 9 3900X 3.8GHz
GeForce GTX 1650 (Desktop)
P1:
74.6 fps
~ 78 fps
64%
Vega M GL / 870:
49.7 [X] Dell XPS 15 9575 FY00N Intel Core i7-8705G 3.1GHz
Vega M GL / 870
fps
100%
GeForce GTX 1650 (Desktop):
138.2 [X] Gainward GeForce GTX 1650 4 GB AMD Ryzen 9 3900X 3.8GHz
GeForce GTX 1650 (Desktop)
fps
63%
Vega M GL / 870:
87.5 [X] Dell XPS 15 9575 FY00N Intel Core i7-8705G 3.1GHz
Vega M GL / 870
fps
74%
GeForce GTX 1650 Ti Max-Q:
102.8 fps
100%
GeForce GTX 1650 (Desktop):
62.5 [X] Gainward GeForce GTX 1650 4 GB AMD Ryzen 9 3900X 3.8GHz
GeForce GTX 1650 (Desktop)
fps
63%
Vega M GL / 870:
39.3 [X] Dell XPS 15 9575 FY00N Intel Core i7-8705G 3.1GHz
Vega M GL / 870
fps
84%
GeForce GTX 1650 Ti Max-Q:
52.6 fps
100%
GeForce GTX 1650 (Desktop):
40.2 [X] Gainward GeForce GTX 1650 4 GB AMD Ryzen 9 3900X 3.8GHz
GeForce GTX 1650 (Desktop)
fps
60%
Vega M GL / 870:
24.2 [X] Dell XPS 15 9575 FY00N Intel Core i7-8705G 3.1GHz
Vega M GL / 870
fps
86%
GeForce GTX 1650 Ti Max-Q:
34.7 fps
100%
GeForce GTX 1650 (Desktop):
30.1 [X] Gainward GeForce GTX 1650 4 GB AMD Ryzen 9 3900X 3.8GHz
GeForce GTX 1650 (Desktop)
fps
61%
Vega M GL / 870:
18.5 [X] Dell XPS 15 9575 FY00N Intel Core i7-8705G 3.1GHz
Vega M GL / 870
fps
87%
GeForce GTX 1650 Ti Max-Q:
26.1 fps
100%
GeForce GTX 1650 (Desktop):
17.1 [X] Gainward GeForce GTX 1650 4 GB AMD Ryzen 9 3900X 3.8GHz
GeForce GTX 1650 (Desktop)
fps
74%
Vega M GL / 870:
12.6 [X] Dell XPS 15 9575 FY00N Intel Core i7-8705G 3.1GHz
Vega M GL / 870
fps
100%
GeForce GTX 1650 (Desktop):
6 [X] Gainward GeForce GTX 1650 4 GB AMD Ryzen 9 3900X 3.8GHz
GeForce GTX 1650 (Desktop)
fps
90%
Vega M GL / 870:
5.4 [X] Dell XPS 15 9575 FY00N Intel Core i7-8705G 3.1GHz
Vega M GL / 870
fps
100%
GeForce GTX 1650 (Desktop):
137 [X] Gainward GeForce GTX 1650 4 GB AMD Ryzen 9 3900X 3.8GHz
GeForce GTX 1650 (Desktop)
min:
118 fps, max:
157 fps
fps
64%
Vega M GL / 870:
87.6 [X] Dell XPS 15 9575 FY00N Intel Core i7-8705G 3.1GHz
Vega M GL / 870
fps
76%
GeForce GTX 1650 Ti Max-Q:
104.7 fps
100%
GeForce GTX 1650 (Desktop):
45.4 [X] Gainward GeForce GTX 1650 4 GB AMD Ryzen 9 3900X 3.8GHz
GeForce GTX 1650 (Desktop)
min:
39 fps, max:
52 fps
fps
61%
Vega M GL / 870:
27.5 [X] Dell XPS 15 9575 FY00N Intel Core i7-8705G 3.1GHz
Vega M GL / 870
fps
86%
GeForce GTX 1650 Ti Max-Q:
39.2 fps
100%
GeForce GTX 1650 (Desktop):
33.3 [X] Gainward GeForce GTX 1650 4 GB AMD Ryzen 9 3900X 3.8GHz
GeForce GTX 1650 (Desktop)
min:
28 fps, max:
39 fps
fps
59%
Vega M GL / 870:
19.8 [X] Dell XPS 15 9575 FY00N Intel Core i7-8705G 3.1GHz
Vega M GL / 870
fps
87%
GeForce GTX 1650 Ti Max-Q:
29.1 fps
100%
GeForce GTX 1650 (Desktop):
20.7 [X] Gainward GeForce GTX 1650 4 GB AMD Ryzen 9 3900X 3.8GHz
GeForce GTX 1650 (Desktop)
min:
17 fps, max:
24 fps
fps
61%
Vega M GL / 870:
12.6 [X] Dell XPS 15 9575 FY00N Intel Core i7-8705G 3.1GHz
Vega M GL / 870
fps
100%
GeForce GTX 1650 (Desktop):
8.1 [X] Gainward GeForce GTX 1650 4 GB AMD Ryzen 9 3900X 3.8GHz
GeForce GTX 1650 (Desktop)
min:
7 fps, max:
11 fps
fps
73%
Vega M GL / 870:
5.9 [X] Dell XPS 15 9575 FY00N Intel Core i7-8705G 3.1GHz
Vega M GL / 870
fps
100%
GeForce GTX 1650 (Desktop):
203 [X] Gainward GeForce GTX 1650 4 GB AMD Ryzen 7 2700X 3.7GHz
GeForce GTX 1650 (Desktop)
min:
185 fps, max:
224 fps
fps
52%
Vega M GL / 870:
105 fps
84%
GeForce GTX 1650 Ti Max-Q:
171 fps
100%
GeForce GTX 1650 (Desktop):
104 [X] Gainward GeForce GTX 1650 4 GB AMD Ryzen 7 2700X 3.7GHz
GeForce GTX 1650 (Desktop)
min:
90 fps, max:
117 fps
fps
63%
Vega M GL / 870:
65 fps
86%
GeForce GTX 1650 Ti Max-Q:
89 fps
100%
GeForce GTX 1650 (Desktop):
89 [X] Gainward GeForce GTX 1650 4 GB AMD Ryzen 7 2700X 3.7GHz
GeForce GTX 1650 (Desktop)
min:
76 fps, max:
102 fps
fps
63%
Vega M GL / 870:
56 fps
80%
GeForce GTX 1650 Ti Max-Q:
71 fps
100%
GeForce GTX 1650 (Desktop):
52 [X] Gainward GeForce GTX 1650 4 GB AMD Ryzen 7 2700X 3.7GHz
GeForce GTX 1650 (Desktop)
min:
42 fps, max:
64 fps
fps
73%
Vega M GL / 870:
38 fps
119%
GeForce GTX 1650 Ti Max-Q:
62 fps
100%
GeForce GTX 1650 (Desktop):
39 [X] Gainward GeForce GTX 1650 4 GB AMD Ryzen 7 2700X 3.7GHz
GeForce GTX 1650 (Desktop)
min:
32 fps, max:
48 fps
fps
100%
GeForce GTX 1650 (Desktop):
20 [X] Gainward GeForce GTX 1650 4 GB AMD Ryzen 7 2700X 3.7GHz
GeForce GTX 1650 (Desktop)
min:
16 fps, max:
25 fps
fps
80%
Vega M GL / 870:
16 fps
100%
GeForce GTX 1650 (Desktop):
197.2 [X] Gainward GeForce GTX 1650 4 GB AMD Ryzen 9 3900X 3.8GHz
GeForce GTX 1650 (Desktop)
202.1 [X] AMD Ryzen 9 3900X 3.8GHz
GeForce GTX 1650 (Desktop)
~ 200 fps
61%
Vega M GL / 870:
122.5 [X] Dell XPS 15 9575 FY00N Intel Core i7-8705G 3.1GHz
Vega M GL / 870
min:
103 fps, max:
135 fps
fps
100%
GeForce GTX 1650 (Desktop):
64.9 [X] Gainward GeForce GTX 1650 4 GB AMD Ryzen 9 3900X 3.8GHz
GeForce GTX 1650 (Desktop)
68.5 [X] AMD Ryzen 9 3900X 3.8GHz
GeForce GTX 1650 (Desktop)
~ 67 fps
56%
Vega M GL / 870:
37.8 [X] Dell XPS 15 9575 FY00N Intel Core i7-8705G 3.1GHz
Vega M GL / 870
min:
31 fps, max:
42 fps
fps
87%
GeForce GTX 1650 Ti Max-Q:
56 57.5 60.3 ~ 58 fps
100%
GeForce GTX 1650 (Desktop):
39.1 [X] Gainward GeForce GTX 1650 4 GB AMD Ryzen 9 3900X 3.8GHz
GeForce GTX 1650 (Desktop)
41.5 [X] AMD Ryzen 9 3900X 3.8GHz
GeForce GTX 1650 (Desktop)
~ 40 fps
59%
Vega M GL / 870:
23.7 [X] Dell XPS 15 9575 FY00N Intel Core i7-8705G 3.1GHz
Vega M GL / 870
min:
21 fps, max:
27 fps
fps
88%
GeForce GTX 1650 Ti Max-Q:
33.4 36 36.5 ~ 35 fps
100%
GeForce GTX 1650 (Desktop):
26.4 [X] AMD Ryzen 9 3900X 3.8GHz
GeForce GTX 1650 (Desktop)
27 [X] Gainward GeForce GTX 1650 4 GB AMD Ryzen 9 3900X 3.8GHz
GeForce GTX 1650 (Desktop)
~ 27 fps
62%
Vega M GL / 870:
16.7 [X] Dell XPS 15 9575 FY00N Intel Core i7-8705G 3.1GHz
Vega M GL / 870
min:
14 fps, max:
19 fps
fps
100%
GeForce GTX 1650 (Desktop):
15.2 [X] Gainward GeForce GTX 1650 4 GB AMD Ryzen 9 3900X 3.8GHz
GeForce GTX 1650 (Desktop)
15.7 [X] AMD Ryzen 9 3900X 3.8GHz
GeForce GTX 1650 (Desktop)
~ 15 fps
63%
Vega M GL / 870:
9.5 [X] Dell XPS 15 9575 FY00N Intel Core i7-8705G 3.1GHz
Vega M GL / 870
min:
8 fps, max:
11 fps
fps
100%
GeForce GTX 1650 (Desktop):
15 [X] AMD Ryzen 9 3900X 3.8GHz
GeForce GTX 1650 (Desktop)
15.2 [X] Gainward GeForce GTX 1650 4 GB AMD Ryzen 9 3900X 3.8GHz
GeForce GTX 1650 (Desktop)
~ 15 fps
24%
Vega M GL / 870:
3.6 [X] Dell XPS 15 9575 FY00N Intel Core i7-8705G 3.1GHz
Vega M GL / 870
min:
2 fps, max:
5 fps
fps
100%
GeForce GTX 1650 (Desktop):
128 [X] Gainward GeForce GTX 1650 4 GB AMD Ryzen 7 2700X 3.7GHz
GeForce GTX 1650 (Desktop)
P1:
110.8 fps
fps
41%
Vega M GL / 870:
52.8 [X] Dell XPS 15 9575 FY00N Intel Core i7-8705G 3.1GHz
Vega M GL / 870
fps
100%
GeForce GTX 1650 (Desktop):
57.6 [X] Gainward GeForce GTX 1650 4 GB AMD Ryzen 7 2700X 3.7GHz
GeForce GTX 1650 (Desktop)
P1:
49.8 fps
fps
48%
Vega M GL / 870:
27.7 [X] Dell XPS 15 9575 FY00N Intel Core i7-8705G 3.1GHz
Vega M GL / 870
fps
100%
GeForce GTX 1650 (Desktop):
44.4 [X] Gainward GeForce GTX 1650 4 GB AMD Ryzen 7 2700X 3.7GHz
GeForce GTX 1650 (Desktop)
P1:
38.2 fps
fps
10%
Vega M GL / 870:
4.4 [X] Dell XPS 15 9575 FY00N Intel Core i7-8705G 3.1GHz
Vega M GL / 870
fps
100%
GeForce GTX 1650 (Desktop):
43.7 [X] Gainward GeForce GTX 1650 4 GB AMD Ryzen 7 2700X 3.7GHz
GeForce GTX 1650 (Desktop)
P1:
38.1 fps
fps
100%
GeForce GTX 1650 (Desktop):
27.9 [X] Gainward GeForce GTX 1650 4 GB AMD Ryzen 7 2700X 3.7GHz
GeForce GTX 1650 (Desktop)
P1:
24.5 fps
fps
100%
GeForce GTX 1650 (Desktop):
12.7 [X] Gainward GeForce GTX 1650 4 GB AMD Ryzen 7 2700X 3.7GHz
GeForce GTX 1650 (Desktop)
P1:
11.4 fps
fps
100%
GeForce GTX 1650 (Desktop):
94 [X] Gainward GeForce GTX 1650 4 GB AMD Ryzen 7 2700X 3.7GHz
GeForce GTX 1650 (Desktop)
min:
86 fps, max:
104 fps
fps
89%
Vega M GL / 870:
84 [X] Dell XPS 15 9575 FY00N Intel Core i7-8705G 3.1GHz
Vega M GL / 870
fps
95%
GeForce GTX 1650 Ti Max-Q:
89.4 fps
100%
GeForce GTX 1650 (Desktop):
79 [X] Gainward GeForce GTX 1650 4 GB AMD Ryzen 7 2700X 3.7GHz
GeForce GTX 1650 (Desktop)
min:
67 fps, max:
86 fps
fps
52%
Vega M GL / 870:
41.3 [X] Dell XPS 15 9575 FY00N Intel Core i7-8705G 3.1GHz
Vega M GL / 870
fps
83%
GeForce GTX 1650 Ti Max-Q:
65.8 fps
100%
GeForce GTX 1650 (Desktop):
48.7 [X] Gainward GeForce GTX 1650 4 GB AMD Ryzen 7 2700X 3.7GHz
GeForce GTX 1650 (Desktop)
min:
44 fps, max:
52 fps
fps
49%
Vega M GL / 870:
23.7 [X] Dell XPS 15 9575 FY00N Intel Core i7-8705G 3.1GHz
Vega M GL / 870
fps
84%
GeForce GTX 1650 Ti Max-Q:
41.1 fps
100%
GeForce GTX 1650 (Desktop):
26.3 [X] Gainward GeForce GTX 1650 4 GB AMD Ryzen 7 2700X 3.7GHz
GeForce GTX 1650 (Desktop)
min:
23 fps, max:
29 fps
fps
46%
Vega M GL / 870:
12.1 [X] Dell XPS 15 9575 FY00N Intel Core i7-8705G 3.1GHz
Vega M GL / 870
fps
82%
GeForce GTX 1650 Ti Max-Q:
21.5 fps
100%
GeForce GTX 1650 (Desktop):
18.5 [X] Gainward GeForce GTX 1650 4 GB AMD Ryzen 7 2700X 3.7GHz
GeForce GTX 1650 (Desktop)
min:
15 fps, max:
22 fps
fps
43%
Vega M GL / 870:
8 [X] Dell XPS 15 9575 FY00N Intel Core i7-8705G 3.1GHz
Vega M GL / 870
fps
100%
GeForce GTX 1650 (Desktop):
10.7 [X] Gainward GeForce GTX 1650 4 GB AMD Ryzen 7 2700X 3.7GHz
GeForce GTX 1650 (Desktop)
min:
8 fps, max:
14 fps
fps
39%
Vega M GL / 870:
4.2 [X] Dell XPS 15 9575 FY00N Intel Core i7-8705G 3.1GHz
Vega M GL / 870
fps
100%
GeForce GTX 1650 (Desktop):
155 [X] Gainward GeForce GTX 1650 4 GB AMD Ryzen 7 2700X 3.7GHz
GeForce GTX 1650 (Desktop)
fps
57%
Vega M GL / 870:
88 [X] Dell XPS 15 9575 FY00N Intel Core i7-8705G 3.1GHz
Vega M GL / 870
fps
60%
GeForce GTX 1650 Ti Max-Q:
93 fps
100%
GeForce GTX 1650 (Desktop):
71 [X] Gainward GeForce GTX 1650 4 GB AMD Ryzen 7 2700X 3.7GHz
GeForce GTX 1650 (Desktop)
fps
65%
Vega M GL / 870:
46 [X] Dell XPS 15 9575 FY00N Intel Core i7-8705G 3.1GHz
Vega M GL / 870
fps
72%
GeForce GTX 1650 Ti Max-Q:
51 fps
100%
GeForce GTX 1650 (Desktop):
55 [X] Gainward GeForce GTX 1650 4 GB AMD Ryzen 7 2700X 3.7GHz
GeForce GTX 1650 (Desktop)
fps
62%
Vega M GL / 870:
34 [X] Dell XPS 15 9575 FY00N Intel Core i7-8705G 3.1GHz
Vega M GL / 870
fps
75%
GeForce GTX 1650 Ti Max-Q:
41 fps
100%
GeForce GTX 1650 (Desktop):
39 [X] Gainward GeForce GTX 1650 4 GB AMD Ryzen 7 2700X 3.7GHz
GeForce GTX 1650 (Desktop)
fps
62%
Vega M GL / 870:
24 [X] Dell XPS 15 9575 FY00N Intel Core i7-8705G 3.1GHz
Vega M GL / 870
fps
77%
GeForce GTX 1650 Ti Max-Q:
30 fps
100%
GeForce GTX 1650 (Desktop):
26 [X] Gainward GeForce GTX 1650 4 GB AMD Ryzen 7 2700X 3.7GHz
GeForce GTX 1650 (Desktop)
fps
58%
Vega M GL / 870:
15 [X] Dell XPS 15 9575 FY00N Intel Core i7-8705G 3.1GHz
Vega M GL / 870
fps
100%
GeForce GTX 1650 (Desktop):
12 [X] Gainward GeForce GTX 1650 4 GB AMD Ryzen 7 2700X 3.7GHz
GeForce GTX 1650 (Desktop)
fps
58%
Vega M GL / 870:
7 [X] Dell XPS 15 9575 FY00N Intel Core i7-8705G 3.1GHz
Vega M GL / 870
fps
100%
GeForce GTX 1650 (Desktop):
255 [X] Gainward GeForce GTX 1650 4 GB AMD Ryzen 7 2700X 3.7GHz
GeForce GTX 1650 (Desktop)
min:
221 fps, max:
274 fps
fps
70%
Vega M GL / 870:
179.6 [X] Dell XPS 15 9575 FY00N Intel Core i7-8705G 3.1GHz
Vega M GL / 870
fps
77%
GeForce GTX 1650 Ti Max-Q:
195.9 fps
100%
GeForce GTX 1650 (Desktop):
105 [X] Gainward GeForce GTX 1650 4 GB AMD Ryzen 7 2700X 3.7GHz
GeForce GTX 1650 (Desktop)
min:
96 fps, max:
120 fps
fps
67%
Vega M GL / 870:
70.7 [X] Dell XPS 15 9575 FY00N Intel Core i7-8705G 3.1GHz
Vega M GL / 870
fps
60%
GeForce GTX 1650 Ti Max-Q:
63.1 fps
100%
GeForce GTX 1650 (Desktop):
87 [X] Gainward GeForce GTX 1650 4 GB AMD Ryzen 7 2700X 3.7GHz
GeForce GTX 1650 (Desktop)
min:
81 fps, max:
95 fps
fps
63%
Vega M GL / 870:
54.4 [X] Dell XPS 15 9575 FY00N Intel Core i7-8705G 3.1GHz
Vega M GL / 870
fps
63%
GeForce GTX 1650 Ti Max-Q:
55.1 fps
100%
GeForce GTX 1650 (Desktop):
47.9 [X] Gainward GeForce GTX 1650 4 GB AMD Ryzen 7 2700X 3.7GHz
GeForce GTX 1650 (Desktop)
min:
43 fps, max:
55 fps
fps
63%
Vega M GL / 870:
30.1 [X] Dell XPS 15 9575 FY00N Intel Core i7-8705G 3.1GHz
Vega M GL / 870
fps
80%
GeForce GTX 1650 Ti Max-Q:
38.1 fps
Vega M GL / 870:
21.2 [X] Dell XPS 15 9575 FY00N Intel Core i7-8705G 3.1GHz
Vega M GL / 870
fps
Vega M GL / 870:
11.3 [X] Dell XPS 15 9575 FY00N Intel Core i7-8705G 3.1GHz
Vega M GL / 870
fps
100%
GeForce GTX 1650 (Desktop):
93 [X] Gainward GeForce GTX 1650 4 GB AMD Ryzen 7 2700X 3.7GHz
GeForce GTX 1650 (Desktop)
min:
44 fps, max:
118 fps
fps
60%
Vega M GL / 870:
55.6 [X] Dell XPS 15 9575 FY00N Intel Core i7-8705G 3.1GHz
Vega M GL / 870
fps
100%
GeForce GTX 1650 (Desktop):
55.5 [X] Gainward GeForce GTX 1650 4 GB AMD Ryzen 7 2700X 3.7GHz
GeForce GTX 1650 (Desktop)
min:
41 fps, max:
67 fps
fps
73%
Vega M GL / 870:
40.6 [X] Dell XPS 15 9575 FY00N Intel Core i7-8705G 3.1GHz
Vega M GL / 870
fps
100%
GeForce GTX 1650 (Desktop):
48.3 [X] Gainward GeForce GTX 1650 4 GB AMD Ryzen 7 2700X 3.7GHz
GeForce GTX 1650 (Desktop)
min:
35 fps, max:
59 fps
fps
77%
Vega M GL / 870:
37.4 [X] Dell XPS 15 9575 FY00N Intel Core i7-8705G 3.1GHz
Vega M GL / 870
fps
100%
GeForce GTX 1650 (Desktop):
46.9 [X] Gainward GeForce GTX 1650 4 GB AMD Ryzen 7 2700X 3.7GHz
GeForce GTX 1650 (Desktop)
min:
40 fps, max:
56 fps
fps
56%
Vega M GL / 870:
26.4 [X] Dell XPS 15 9575 FY00N Intel Core i7-8705G 3.1GHz
Vega M GL / 870
fps
100%
GeForce GTX 1650 (Desktop):
32.3 [X] Gainward GeForce GTX 1650 4 GB AMD Ryzen 7 2700X 3.7GHz
GeForce GTX 1650 (Desktop)
min:
28 fps, max:
38 fps
fps
61%
Vega M GL / 870:
19.8 [X] Dell XPS 15 9575 FY00N Intel Core i7-8705G 3.1GHz
Vega M GL / 870
fps
100%
GeForce GTX 1650 (Desktop):
16.6 [X] Gainward GeForce GTX 1650 4 GB AMD Ryzen 7 2700X 3.7GHz
GeForce GTX 1650 (Desktop)
min:
14 fps, max:
19 fps
fps
60%
Vega M GL / 870:
9.9 [X] Dell XPS 15 9575 FY00N Intel Core i7-8705G 3.1GHz
Vega M GL / 870
fps
100%
GeForce GTX 1650 (Desktop):
109 [X] Gainward GeForce GTX 1650 4 GB AMD Ryzen 7 2700X 3.7GHz
GeForce GTX 1650 (Desktop)
min:
74 fps, max:
141 fps
120 [X] AMD Ryzen 9 3900X 3.8GHz
GeForce GTX 1650 (Desktop)
min:
96 fps, max:
152 fps
~ 115 fps
64%
Vega M GL / 870:
74 [X] Dell XPS 15 9575 FY00N Intel Core i7-8705G 3.1GHz
Vega M GL / 870
fps
77%
GeForce GTX 1650 Ti Max-Q:
89 fps
100%
GeForce GTX 1650 (Desktop):
64 [X] Gainward GeForce GTX 1650 4 GB AMD Ryzen 7 2700X 3.7GHz
GeForce GTX 1650 (Desktop)
min:
52 fps, max:
75 fps
68 [X] AMD Ryzen 9 3900X 3.8GHz
GeForce GTX 1650 (Desktop)
min:
57 fps, max:
80 fps
~ 66 fps
67%
Vega M GL / 870:
44 [X] Dell XPS 15 9575 FY00N Intel Core i7-8705G 3.1GHz
Vega M GL / 870
fps
85%
GeForce GTX 1650 Ti Max-Q:
56 fps
100%
GeForce GTX 1650 (Desktop):
60 [X] Gainward GeForce GTX 1650 4 GB AMD Ryzen 7 2700X 3.7GHz
GeForce GTX 1650 (Desktop)
min:
44 fps, max:
71 fps
63 [X] AMD Ryzen 9 3900X 3.8GHz
GeForce GTX 1650 (Desktop)
min:
53 fps, max:
74 fps
~ 62 fps
66%
Vega M GL / 870:
41 [X] Dell XPS 15 9575 FY00N Intel Core i7-8705G 3.1GHz
Vega M GL / 870
fps
85%
GeForce GTX 1650 Ti Max-Q:
53 fps
100%
GeForce GTX 1650 (Desktop):
55 [X] Gainward GeForce GTX 1650 4 GB AMD Ryzen 7 2700X 3.7GHz
GeForce GTX 1650 (Desktop)
min:
44 fps, max:
67 fps
58 [X] AMD Ryzen 9 3900X 3.8GHz
GeForce GTX 1650 (Desktop)
min:
47 fps, max:
70 fps
~ 57 fps
67%
Vega M GL / 870:
38 [X] Dell XPS 15 9575 FY00N Intel Core i7-8705G 3.1GHz
Vega M GL / 870
fps
86%
GeForce GTX 1650 Ti Max-Q:
49 fps
100%
GeForce GTX 1650 (Desktop):
39 [X] Gainward GeForce GTX 1650 4 GB AMD Ryzen 7 2700X 3.7GHz
GeForce GTX 1650 (Desktop)
min:
32 fps, max:
48 fps
42 [X] AMD Ryzen 9 3900X 3.8GHz
GeForce GTX 1650 (Desktop)
min:
34 fps, max:
51 fps
~ 41 fps
66%
Vega M GL / 870:
27 [X] Dell XPS 15 9575 FY00N Intel Core i7-8705G 3.1GHz
Vega M GL / 870
fps
100%
GeForce GTX 1650 (Desktop):
20 [X] Gainward GeForce GTX 1650 4 GB AMD Ryzen 7 2700X 3.7GHz
GeForce GTX 1650 (Desktop)
min:
16 fps, max:
24 fps
21 [X] AMD Ryzen 9 3900X 3.8GHz
GeForce GTX 1650 (Desktop)
min:
17 fps, max:
26 fps
~ 21 fps
62%
Vega M GL / 870:
13 [X] Dell XPS 15 9575 FY00N Intel Core i7-8705G 3.1GHz
Vega M GL / 870
fps
100%
GeForce GTX 1650 (Desktop):
84.5 [X] Gainward GeForce GTX 1650 4 GB AMD Ryzen 7 2700X 3.7GHz
GeForce GTX 1650 (Desktop)
min:
47 fps, max:
154 fps
107 [X] AMD Ryzen 9 3900X 3.8GHz
GeForce GTX 1650 (Desktop)
min:
53.08 fps, max:
182.78 fps
~ 96 fps
76%
Vega M GL / 870:
72.7 [X] Dell XPS 15 9575 FY00N Intel Core i7-8705G 3.1GHz
Vega M GL / 870
fps
87%
GeForce GTX 1650 Ti Max-Q:
83.1 fps
100%
GeForce GTX 1650 (Desktop):
42 [X] Gainward GeForce GTX 1650 4 GB AMD Ryzen 7 2700X 3.7GHz
GeForce GTX 1650 (Desktop)
min:
23 fps, max:
74 fps
48 [X] AMD Ryzen 9 3900X 3.8GHz
GeForce GTX 1650 (Desktop)
min:
24.24 fps, max:
79.76 fps
~ 45 fps
73%
Vega M GL / 870:
32.8 [X] Dell XPS 15 9575 FY00N Intel Core i7-8705G 3.1GHz
Vega M GL / 870
fps
89%
GeForce GTX 1650 Ti Max-Q:
40.1 fps
100%
GeForce GTX 1650 (Desktop):
31 [X] Gainward GeForce GTX 1650 4 GB AMD Ryzen 7 2700X 3.7GHz
GeForce GTX 1650 (Desktop)
min:
17 fps, max:
50 fps
35.2 [X] AMD Ryzen 9 3900X 3.8GHz
GeForce GTX 1650 (Desktop)
min:
18.78 fps, max:
54.8 fps
~ 33 fps
65%
Vega M GL / 870:
21.6 [X] Dell XPS 15 9575 FY00N Intel Core i7-8705G 3.1GHz
Vega M GL / 870
fps
90%
GeForce GTX 1650 Ti Max-Q:
29.8 fps
100%
GeForce GTX 1650 (Desktop):
25.4 [X] Gainward GeForce GTX 1650 4 GB AMD Ryzen 7 2700X 3.7GHz
GeForce GTX 1650 (Desktop)
min:
15 fps, max:
38 fps
27.7 [X] AMD Ryzen 9 3900X 3.8GHz
GeForce GTX 1650 (Desktop)
min:
15.94 fps, max:
41.8 fps
~ 27 fps
67%
Vega M GL / 870:
18 [X] Dell XPS 15 9575 FY00N Intel Core i7-8705G 3.1GHz
Vega M GL / 870
fps
86%
GeForce GTX 1650 Ti Max-Q:
23.2 fps
100%
GeForce GTX 1650 (Desktop):
19.3 [X] Gainward GeForce GTX 1650 4 GB AMD Ryzen 7 2700X 3.7GHz
GeForce GTX 1650 (Desktop)
min:
12 fps, max:
29 fps
21.3 [X] AMD Ryzen 9 3900X 3.8GHz
GeForce GTX 1650 (Desktop)
min:
12.84 fps, max:
30.98 fps
~ 20 fps
70%
Vega M GL / 870:
13.9 [X] Dell XPS 15 9575 FY00N Intel Core i7-8705G 3.1GHz
Vega M GL / 870
fps
100%
GeForce GTX 1650 (Desktop):
11.6 [X] Gainward GeForce GTX 1650 4 GB AMD Ryzen 7 2700X 3.7GHz
GeForce GTX 1650 (Desktop)
min:
7 fps, max:
17 fps
12.1 [X] AMD Ryzen 9 3900X 3.8GHz
GeForce GTX 1650 (Desktop)
min:
7.44 fps, max:
17.73 fps
~ 12 fps
100%
GeForce GTX 1650 (Desktop):
144 [X] Gainward GeForce GTX 1650 4 GB AMD Ryzen 7 2700X 3.7GHz
GeForce GTX 1650 (Desktop)
min:
143 fps, max:
146 fps
144 [X] AMD Ryzen 9 3900X 3.8GHz
GeForce GTX 1650 (Desktop)
min:
143 fps, max:
145 fps
~ 144 fps
86%
Vega M GL / 870:
124.2 [X] Dell XPS 15 9575 FY00N Intel Core i7-8705G 3.1GHz
Vega M GL / 870
fps
100%
GeForce GTX 1650 Ti Max-Q:
143.7 fps
100%
GeForce GTX 1650 (Desktop):
90 [X] Gainward GeForce GTX 1650 4 GB AMD Ryzen 7 2700X 3.7GHz
GeForce GTX 1650 (Desktop)
min:
82 fps, max:
101 fps
111 [X] AMD Ryzen 9 3900X 3.8GHz
GeForce GTX 1650 (Desktop)
min:
102 fps, max:
131 fps
~ 101 fps
52%
Vega M GL / 870:
53 [X] Dell XPS 15 9575 FY00N Intel Core i7-8705G 3.1GHz
Vega M GL / 870
fps
85%
GeForce GTX 1650 Ti Max-Q:
86.2 fps
100%
GeForce GTX 1650 (Desktop):
70 [X] Gainward GeForce GTX 1650 4 GB AMD Ryzen 7 2700X 3.7GHz
GeForce GTX 1650 (Desktop)
min:
64 fps, max:
78 fps
76 [X] AMD Ryzen 9 3900X 3.8GHz
GeForce GTX 1650 (Desktop)
min:
69 fps, max:
89 fps
~ 73 fps
57%
Vega M GL / 870:
41.4 [X] Dell XPS 15 9575 FY00N Intel Core i7-8705G 3.1GHz
Vega M GL / 870
fps
94%
GeForce GTX 1650 Ti Max-Q:
68.7 fps
100%
GeForce GTX 1650 (Desktop):
67 [X] Gainward GeForce GTX 1650 4 GB AMD Ryzen 7 2700X 3.7GHz
GeForce GTX 1650 (Desktop)
min:
56 fps, max:
78 fps
71.3 [X] AMD Ryzen 9 3900X 3.8GHz
GeForce GTX 1650 (Desktop)
min:
63 fps, max:
85 fps
~ 69 fps
58%
Vega M GL / 870:
39.7 [X] Dell XPS 15 9575 FY00N Intel Core i7-8705G 3.1GHz
Vega M GL / 870
fps
91%
GeForce GTX 1650 Ti Max-Q:
62.9 fps
100%
GeForce GTX 1650 (Desktop):
48.6 [X] Gainward GeForce GTX 1650 4 GB AMD Ryzen 7 2700X 3.7GHz
GeForce GTX 1650 (Desktop)
min:
41 fps, max:
57 fps
50.4 [X] AMD Ryzen 9 3900X 3.8GHz
GeForce GTX 1650 (Desktop)
min:
44 fps, max:
61 fps
~ 50 fps
54%
Vega M GL / 870:
26.8 [X] Dell XPS 15 9575 FY00N Intel Core i7-8705G 3.1GHz
Vega M GL / 870
fps
100%
GeForce GTX 1650 (Desktop):
27 [X] AMD Ryzen 9 3900X 3.8GHz
GeForce GTX 1650 (Desktop)
min:
23 fps, max:
35 fps
27.1 [X] Gainward GeForce GTX 1650 4 GB AMD Ryzen 7 2700X 3.7GHz
GeForce GTX 1650 (Desktop)
min:
22 fps, max:
33 fps
~ 27 fps
55%
Vega M GL / 870:
14.8 [X] Dell XPS 15 9575 FY00N Intel Core i7-8705G 3.1GHz
Vega M GL / 870
fps
100%
GeForce GTX 1650 (Desktop):
118 [X] Gainward GeForce GTX 1650 4 GB AMD Ryzen 7 2700X 3.7GHz
GeForce GTX 1650 (Desktop)
min:
110 fps, max:
124 fps
fps
100%
GeForce GTX 1650 (Desktop):
80 [X] Gainward GeForce GTX 1650 4 GB AMD Ryzen 7 2700X 3.7GHz
GeForce GTX 1650 (Desktop)
min:
73 fps, max:
85 fps
fps
100%
GeForce GTX 1650 (Desktop):
58.2 [X] Gainward GeForce GTX 1650 4 GB AMD Ryzen 7 2700X 3.7GHz
GeForce GTX 1650 (Desktop)
min:
55 fps, max:
61 fps
fps
100%
GeForce GTX 1650 (Desktop):
54.1 [X] Gainward GeForce GTX 1650 4 GB AMD Ryzen 7 2700X 3.7GHz
GeForce GTX 1650 (Desktop)
min:
48 fps, max:
58 fps
fps
100%
GeForce GTX 1650 (Desktop):
36.3 [X] Gainward GeForce GTX 1650 4 GB AMD Ryzen 7 2700X 3.7GHz
GeForce GTX 1650 (Desktop)
min:
34 fps, max:
39 fps
fps
100%
GeForce GTX 1650 (Desktop):
17.4 [X] Gainward GeForce GTX 1650 4 GB AMD Ryzen 7 2700X 3.7GHz
GeForce GTX 1650 (Desktop)
min:
15 fps, max:
19 fps
fps
100%
GeForce GTX 1650 (Desktop):
208 [X] Gainward GeForce GTX 1650 4 GB AMD Ryzen 7 2700X 3.7GHz
GeForce GTX 1650 (Desktop)
min:
81 fps, max:
280 fps
fps
100%
GeForce GTX 1650 (Desktop):
82 [X] Gainward GeForce GTX 1650 4 GB AMD Ryzen 7 2700X 3.7GHz
GeForce GTX 1650 (Desktop)
min:
63 fps, max:
93 fps
fps
100%
GeForce GTX 1650 (Desktop):
63 [X] Gainward GeForce GTX 1650 4 GB AMD Ryzen 7 2700X 3.7GHz
GeForce GTX 1650 (Desktop)
min:
53 fps, max:
73 fps
fps
100%
GeForce GTX 1650 (Desktop):
55.8 [X] Gainward GeForce GTX 1650 4 GB AMD Ryzen 7 2700X 3.7GHz
GeForce GTX 1650 (Desktop)
min:
48 fps, max:
63 fps
fps
100%
GeForce GTX 1650 (Desktop):
33.1 [X] Gainward GeForce GTX 1650 4 GB AMD Ryzen 7 2700X 3.7GHz
GeForce GTX 1650 (Desktop)
min:
29 fps, max:
38 fps
fps
100%
GeForce GTX 1650 (Desktop):
10.6 [X] Gainward GeForce GTX 1650 4 GB AMD Ryzen 7 2700X 3.7GHz
GeForce GTX 1650 (Desktop)
min:
9 fps, max:
12 fps
fps
100%
GeForce GTX 1650 (Desktop):
109 [X] Gainward GeForce GTX 1650 4 GB AMD Ryzen 7 2700X 3.7GHz
GeForce GTX 1650 (Desktop)
min:
67 fps, max:
143 fps
fps
108%
Vega M GL / 870:
118.2 [X] Dell XPS 15 9575 FY00N Intel Core i7-8705G 3.1GHz
Vega M GL / 870
fps
100%
GeForce GTX 1650 (Desktop):
61 [X] Gainward GeForce GTX 1650 4 GB AMD Ryzen 7 2700X 3.7GHz
GeForce GTX 1650 (Desktop)
min:
47 fps, max:
82 fps
fps
101%
Vega M GL / 870:
61.6 [X] Dell XPS 15 9575 FY00N Intel Core i7-8705G 3.1GHz
Vega M GL / 870
fps
100%
GeForce GTX 1650 (Desktop):
52.6 [X] Gainward GeForce GTX 1650 4 GB AMD Ryzen 7 2700X 3.7GHz
GeForce GTX 1650 (Desktop)
min:
41 fps, max:
73 fps
fps
98%
Vega M GL / 870:
51.6 [X] Dell XPS 15 9575 FY00N Intel Core i7-8705G 3.1GHz
Vega M GL / 870
fps
100%
GeForce GTX 1650 (Desktop):
50.6 [X] Gainward GeForce GTX 1650 4 GB AMD Ryzen 7 2700X 3.7GHz
GeForce GTX 1650 (Desktop)
min:
41 fps, max:
72 fps
fps
94%
Vega M GL / 870:
47.7 [X] Dell XPS 15 9575 FY00N Intel Core i7-8705G 3.1GHz
Vega M GL / 870
fps
100%
GeForce GTX 1650 (Desktop):
39.4 [X] Gainward GeForce GTX 1650 4 GB AMD Ryzen 7 2700X 3.7GHz
GeForce GTX 1650 (Desktop)
min:
27 fps, max:
59 fps
fps
87%
Vega M GL / 870:
34.2 [X] Dell XPS 15 9575 FY00N Intel Core i7-8705G 3.1GHz
Vega M GL / 870
fps
100%
GeForce GTX 1650 (Desktop):
21.4 [X] Gainward GeForce GTX 1650 4 GB AMD Ryzen 7 2700X 3.7GHz
GeForce GTX 1650 (Desktop)
min:
15 fps, max:
36 fps
fps
77%
Vega M GL / 870:
16.4 [X] Dell XPS 15 9575 FY00N Intel Core i7-8705G 3.1GHz
Vega M GL / 870
fps
100%
GeForce GTX 1650 (Desktop):
186 [X] Gainward GeForce GTX 1650 4 GB AMD Ryzen 7 2700X 3.7GHz
GeForce GTX 1650 (Desktop)
min:
164 fps, max:
243 fps
fps
86%
Vega M GL / 870:
160.3 [X] Dell XPS 15 9575 FY00N Intel Core i7-8705G 3.1GHz
Vega M GL / 870
fps
100%
GeForce GTX 1650 (Desktop):
150 [X] Gainward GeForce GTX 1650 4 GB AMD Ryzen 7 2700X 3.7GHz
GeForce GTX 1650 (Desktop)
min:
132 fps, max:
197 fps
fps
77%
Vega M GL / 870:
115.9 [X] Dell XPS 15 9575 FY00N Intel Core i7-8705G 3.1GHz
Vega M GL / 870
fps
100%
GeForce GTX 1650 (Desktop):
103 [X] Gainward GeForce GTX 1650 4 GB AMD Ryzen 7 2700X 3.7GHz
GeForce GTX 1650 (Desktop)
min:
85 fps, max:
156 fps
fps
66%
Vega M GL / 870:
68.4 [X] Dell XPS 15 9575 FY00N Intel Core i7-8705G 3.1GHz
Vega M GL / 870
fps
100%
GeForce GTX 1650 (Desktop):
76 [X] Gainward GeForce GTX 1650 4 GB AMD Ryzen 7 2700X 3.7GHz
GeForce GTX 1650 (Desktop)
min:
60 fps, max:
125 fps
fps
49%
Vega M GL / 870:
37.1 [X] Dell XPS 15 9575 FY00N Intel Core i7-8705G 3.1GHz
Vega M GL / 870
fps
100%
GeForce GTX 1650 (Desktop):
51.9 [X] Gainward GeForce GTX 1650 4 GB AMD Ryzen 7 2700X 3.7GHz
GeForce GTX 1650 (Desktop)
min:
40 fps, max:
88 fps
fps
49%
Vega M GL / 870:
25.5 [X] Dell XPS 15 9575 FY00N Intel Core i7-8705G 3.1GHz
Vega M GL / 870
fps
100%
GeForce GTX 1650 (Desktop):
26.8 [X] Gainward GeForce GTX 1650 4 GB AMD Ryzen 7 2700X 3.7GHz
GeForce GTX 1650 (Desktop)
min:
20 fps, max:
49 fps
fps
46%
Vega M GL / 870:
12.2 [X] Dell XPS 15 9575 FY00N Intel Core i7-8705G 3.1GHz
Vega M GL / 870
fps
100%
GeForce GTX 1650 (Desktop):
85 [X] Gainward GeForce GTX 1650 4 GB AMD Ryzen 7 2700X 3.7GHz
GeForce GTX 1650 (Desktop)
min:
13 fps, max:
122 fps
fps
100%
GeForce GTX 1650 (Desktop):
66 [X] Gainward GeForce GTX 1650 4 GB AMD Ryzen 7 2700X 3.7GHz
GeForce GTX 1650 (Desktop)
min:
46 fps, max:
77 fps
fps
100%
GeForce GTX 1650 (Desktop):
60 [X] Gainward GeForce GTX 1650 4 GB AMD Ryzen 7 2700X 3.7GHz
GeForce GTX 1650 (Desktop)
min:
42 fps, max:
71 fps
fps
100%
GeForce GTX 1650 (Desktop):
55.1 [X] Gainward GeForce GTX 1650 4 GB AMD Ryzen 7 2700X 3.7GHz
GeForce GTX 1650 (Desktop)
min:
33 fps, max:
68 fps
fps
100%
GeForce GTX 1650 (Desktop):
38 [X] Gainward GeForce GTX 1650 4 GB AMD Ryzen 7 2700X 3.7GHz
GeForce GTX 1650 (Desktop)
min:
31 fps, max:
44 fps
fps
100%
GeForce GTX 1650 (Desktop):
17.5 [X] Gainward GeForce GTX 1650 4 GB AMD Ryzen 7 2700X 3.7GHz
GeForce GTX 1650 (Desktop)
min:
14 fps, max:
21 fps
fps
100%
GeForce GTX 1650 (Desktop):
196 [X] Gainward GeForce GTX 1650 4 GB AMD Ryzen 7 2700X 3.7GHz
GeForce GTX 1650 (Desktop)
min:
113 fps, max:
240 fps
fps
100%
GeForce GTX 1650 (Desktop):
79 [X] Gainward GeForce GTX 1650 4 GB AMD Ryzen 7 2700X 3.7GHz
GeForce GTX 1650 (Desktop)
min:
56 fps, max:
98 fps
fps
100%
GeForce GTX 1650 (Desktop):
75 [X] Gainward GeForce GTX 1650 4 GB AMD Ryzen 7 2700X 3.7GHz
GeForce GTX 1650 (Desktop)
min:
43 fps, max:
94 fps
fps
100%
GeForce GTX 1650 (Desktop):
68 [X] Gainward GeForce GTX 1650 4 GB AMD Ryzen 7 2700X 3.7GHz
GeForce GTX 1650 (Desktop)
min:
49 fps, max:
85 fps
fps
100%
GeForce GTX 1650 (Desktop):
42.2 [X] Gainward GeForce GTX 1650 4 GB AMD Ryzen 7 2700X 3.7GHz
GeForce GTX 1650 (Desktop)
min:
27 fps, max:
54 fps
fps
100%
GeForce GTX 1650 (Desktop):
20.1 [X] Gainward GeForce GTX 1650 4 GB AMD Ryzen 7 2700X 3.7GHz
GeForce GTX 1650 (Desktop)
min:
14 fps, max:
26 fps
fps
100%
GeForce GTX 1650 (Desktop):
84 [X] Gainward GeForce GTX 1650 4 GB AMD Ryzen 7 2700X 3.7GHz
GeForce GTX 1650 (Desktop)
fps
71%
Vega M GL / 870:
60 [X] Dell XPS 15 9575 FY00N Intel Core i7-8705G 3.1GHz
Vega M GL / 870
fps
75%
GeForce GTX 1650 Ti Max-Q:
63 fps
100%
GeForce GTX 1650 (Desktop):
53 [X] Gainward GeForce GTX 1650 4 GB AMD Ryzen 7 2700X 3.7GHz
GeForce GTX 1650 (Desktop)
fps
89%
Vega M GL / 870:
47 [X] Dell XPS 15 9575 FY00N Intel Core i7-8705G 3.1GHz
Vega M GL / 870
fps
92%
GeForce GTX 1650 Ti Max-Q:
49 fps
100%
GeForce GTX 1650 (Desktop):
47 [X] Gainward GeForce GTX 1650 4 GB AMD Ryzen 7 2700X 3.7GHz
GeForce GTX 1650 (Desktop)
fps
83%
Vega M GL / 870:
39 [X] Dell XPS 15 9575 FY00N Intel Core i7-8705G 3.1GHz
Vega M GL / 870
fps
87%
GeForce GTX 1650 Ti Max-Q:
41 fps
100%
GeForce GTX 1650 (Desktop):
25 [X] Gainward GeForce GTX 1650 4 GB AMD Ryzen 7 2700X 3.7GHz
GeForce GTX 1650 (Desktop)
fps
92%
Vega M GL / 870:
23 [X] Dell XPS 15 9575 FY00N Intel Core i7-8705G 3.1GHz
Vega M GL / 870
fps
76%
GeForce GTX 1650 Ti Max-Q:
19 fps
100%
GeForce GTX 1650 (Desktop):
18 [X] Gainward GeForce GTX 1650 4 GB AMD Ryzen 7 2700X 3.7GHz
GeForce GTX 1650 (Desktop)
fps
94%
Vega M GL / 870:
17 [X] Dell XPS 15 9575 FY00N Intel Core i7-8705G 3.1GHz
Vega M GL / 870
fps
100%
GeForce GTX 1650 (Desktop):
13 [X] Gainward GeForce GTX 1650 4 GB AMD Ryzen 7 2700X 3.7GHz
GeForce GTX 1650 (Desktop)
fps
85%
Vega M GL / 870:
11 [X] Dell XPS 15 9575 FY00N Intel Core i7-8705G 3.1GHz
Vega M GL / 870
fps
100%
GeForce GTX 1650 (Desktop):
139 [X] Gainward GeForce GTX 1650 4 GB AMD Ryzen 7 2700X 3.7GHz
GeForce GTX 1650 (Desktop)
fps
100%
GeForce GTX 1650 (Desktop):
90 [X] Gainward GeForce GTX 1650 4 GB AMD Ryzen 7 2700X 3.7GHz
GeForce GTX 1650 (Desktop)
fps
100%
GeForce GTX 1650 (Desktop):
83 [X] Gainward GeForce GTX 1650 4 GB AMD Ryzen 7 2700X 3.7GHz
GeForce GTX 1650 (Desktop)
fps
100%
GeForce GTX 1650 (Desktop):
65 [X] Gainward GeForce GTX 1650 4 GB AMD Ryzen 7 2700X 3.7GHz
GeForce GTX 1650 (Desktop)
fps
100%
GeForce GTX 1650 (Desktop):
46 [X] Gainward GeForce GTX 1650 4 GB AMD Ryzen 7 2700X 3.7GHz
GeForce GTX 1650 (Desktop)
fps
100%
GeForce GTX 1650 (Desktop):
30 [X] Gainward GeForce GTX 1650 4 GB AMD Ryzen 7 2700X 3.7GHz
GeForce GTX 1650 (Desktop)
fps
100%
GeForce GTX 1650 (Desktop):
294 [X] Gainward GeForce GTX 1650 4 GB AMD Ryzen 7 2700X 3.7GHz
GeForce GTX 1650 (Desktop)
min:
279 fps, max:
318 fps
fps
100%
GeForce GTX 1650 (Desktop):
229 [X] Gainward GeForce GTX 1650 4 GB AMD Ryzen 7 2700X 3.7GHz
GeForce GTX 1650 (Desktop)
min:
215 fps, max:
241 fps
fps
100%
GeForce GTX 1650 (Desktop):
201 [X] Gainward GeForce GTX 1650 4 GB AMD Ryzen 7 2700X 3.7GHz
GeForce GTX 1650 (Desktop)
min:
186 fps, max:
209 fps
fps
100%
GeForce GTX 1650 (Desktop):
172 [X] Gainward GeForce GTX 1650 4 GB AMD Ryzen 7 2700X 3.7GHz
GeForce GTX 1650 (Desktop)
min:
160 fps, max:
180 fps
fps
100%
GeForce GTX 1650 (Desktop):
122 [X] Gainward GeForce GTX 1650 4 GB AMD Ryzen 7 2700X 3.7GHz
GeForce GTX 1650 (Desktop)
min:
103 fps, max:
128 fps
fps
100%
GeForce GTX 1650 (Desktop):
69 [X] Gainward GeForce GTX 1650 4 GB AMD Ryzen 7 2700X 3.7GHz
GeForce GTX 1650 (Desktop)
min:
64 fps, max:
72 fps
fps
100%
GeForce GTX 1650 (Desktop):
132 [X] Gainward GeForce GTX 1650 4 GB AMD Ryzen 7 2700X 3.7GHz
GeForce GTX 1650 (Desktop)
fps
55%
Vega M GL / 870:
72 [X] Dell XPS 15 9575 FY00N Intel Core i7-8705G 3.1GHz
Vega M GL / 870
fps
100%
GeForce GTX 1650 (Desktop):
58 [X] Gainward GeForce GTX 1650 4 GB AMD Ryzen 7 2700X 3.7GHz
GeForce GTX 1650 (Desktop)
fps
71%
Vega M GL / 870:
41 [X] Dell XPS 15 9575 FY00N Intel Core i7-8705G 3.1GHz
Vega M GL / 870
fps
100%
GeForce GTX 1650 (Desktop):
50 [X] Gainward GeForce GTX 1650 4 GB AMD Ryzen 7 2700X 3.7GHz
GeForce GTX 1650 (Desktop)
fps
72%
Vega M GL / 870:
36 [X] Dell XPS 15 9575 FY00N Intel Core i7-8705G 3.1GHz
Vega M GL / 870
fps
100%
GeForce GTX 1650 (Desktop):
44 [X] Gainward GeForce GTX 1650 4 GB AMD Ryzen 7 2700X 3.7GHz
GeForce GTX 1650 (Desktop)
fps
68%
Vega M GL / 870:
30 [X] Dell XPS 15 9575 FY00N Intel Core i7-8705G 3.1GHz
Vega M GL / 870
fps
100%
GeForce GTX 1650 (Desktop):
29 [X] Gainward GeForce GTX 1650 4 GB AMD Ryzen 7 2700X 3.7GHz
GeForce GTX 1650 (Desktop)
fps
66%
Vega M GL / 870:
19 [X] Dell XPS 15 9575 FY00N Intel Core i7-8705G 3.1GHz
Vega M GL / 870
fps
100%
GeForce GTX 1650 (Desktop):
13 [X] Gainward GeForce GTX 1650 4 GB AMD Ryzen 7 2700X 3.7GHz
GeForce GTX 1650 (Desktop)
fps
69%
Vega M GL / 870:
9 [X] Dell XPS 15 9575 FY00N Intel Core i7-8705G 3.1GHz
Vega M GL / 870
fps
115%
GeForce GTX 1650 Ti Max-Q:
15 15 ~ 15 fps
100%
GeForce GTX 1650 (Desktop):
245 [X] 1.47.22.14 D3D12
AMD Ryzen 9 3900X 3.8GHz
GeForce GTX 1650 (Desktop)
min:
205 fps, P1:
215 fps, max:
316 fps
fps
75%
GeForce GTX 1650 Ti Max-Q:
167 [X] MSI Summit E14 A11SCS 1.47.22.14 D3D12
Intel Core i7-1185G7 3GHz
GeForce GTX 1650 Ti Max-Q
min:
117 fps, P1:
124 fps, max:
279 fps
188 [X] HP Envy 14-eb0010nr 1.47.22.14 D3D12
Intel Core i5-1135G7 2.4GHz
GeForce GTX 1650 Ti Max-Q
min:
61.8 fps, P1:
146 fps, max:
283 fps
196 ~ 184 fps
100%
GeForce GTX 1650 (Desktop):
94.4 [X] 1.47.22.14 D3D12
AMD Ryzen 9 3900X 3.8GHz
GeForce GTX 1650 (Desktop)
min:
81.1 fps, P1:
83.6 fps, max:
118 fps
fps
81%
GeForce GTX 1650 Ti Max-Q:
68.6 [X] MSI Summit E14 A11SCS 1.47.22.14 D3D12
Intel Core i7-1185G7 3GHz
GeForce GTX 1650 Ti Max-Q
min:
51.8 fps, P1:
56.2 fps, max:
105 fps
76.5 [X] HP Envy 14-eb0010nr 1.47.22.14 D3D12
Intel Core i5-1135G7 2.4GHz
GeForce GTX 1650 Ti Max-Q
min:
46.5 fps, P1:
66.4 fps, max:
168 fps
81.5 ~ 76 fps
100%
GeForce GTX 1650 (Desktop):
74 [X] 1.47.22.14 D3D12
AMD Ryzen 9 3900X 3.8GHz
GeForce GTX 1650 (Desktop)
min:
57.6 fps, P1:
59.2 fps, max:
99.1 fps
fps
82%
GeForce GTX 1650 Ti Max-Q:
54.9 [X] MSI Summit E14 A11SCS 1.47.22.14 D3D12
Intel Core i7-1185G7 3GHz
GeForce GTX 1650 Ti Max-Q
min:
40.1 fps, P1:
41.6 fps, max:
82.2 fps
62.2 [X] HP Envy 14-eb0010nr 1.47.22.14 D3D12
Intel Core i5-1135G7 2.4GHz
GeForce GTX 1650 Ti Max-Q
min:
48.5 fps, P1:
50 fps, max:
86.8 fps
65.6 ~ 61 fps
100%
GeForce GTX 1650 (Desktop):
62.2 [X] 1.47.22.14 D3D12
AMD Ryzen 9 3900X 3.8GHz
GeForce GTX 1650 (Desktop)
min:
49.1 fps, P1:
50.6 fps, max:
81.1 fps
fps
84%
GeForce GTX 1650 Ti Max-Q:
47.9 [X] MSI Summit E14 A11SCS 1.47.22.14 D3D12
Intel Core i7-1185G7 3GHz
GeForce GTX 1650 Ti Max-Q
min:
35.1 fps, P1:
36.4 fps, max:
68.6 fps
53.6 [X] HP Envy 14-eb0010nr 1.47.22.14 D3D12
Intel Core i5-1135G7 2.4GHz
GeForce GTX 1650 Ti Max-Q
min:
27 fps, P1:
43 fps, max:
125 fps
55.2 ~ 52 fps
100%
GeForce GTX 1650 (Desktop):
44.7 [X] 1.47.22.14 D3D12
AMD Ryzen 9 3900X 3.8GHz
GeForce GTX 1650 (Desktop)
min:
35.4 fps, P1:
37.8 fps, max:
57.7 fps
fps
78%
GeForce GTX 1650 Ti Max-Q:
35 [X] MSI Summit E14 A11SCS 1.47.22.14 D3D12
Intel Core i7-1185G7 3GHz
GeForce GTX 1650 Ti Max-Q
min:
29.2 fps, P1:
29.8 fps, max:
48 fps
fps
100%
GeForce GTX 1650 (Desktop):
25.7 [X] 1.47.22.14 D3D12
AMD Ryzen 9 3900X 3.8GHz
GeForce GTX 1650 (Desktop)
min:
22.6 fps, P1:
22.9 fps, max:
34 fps
fps
83%
GeForce GTX 1650 Ti Max-Q:
21.4 [X] MSI Summit E14 A11SCS 1.47.22.14 D3D12
Intel Core i7-1185G7 3GHz
GeForce GTX 1650 Ti Max-Q
min:
18.1 fps, P1:
18.5 fps, max:
26.5 fps
fps
100%
GeForce GTX 1650 (Desktop):
195 [X] Gainward GeForce GTX 1650 4 GB AMD Ryzen 7 2700X 3.7GHz
GeForce GTX 1650 (Desktop)
min:
99 fps, max:
217 fps
fps
100%
GeForce GTX 1650 (Desktop):
115 [X] Gainward GeForce GTX 1650 4 GB AMD Ryzen 7 2700X 3.7GHz
GeForce GTX 1650 (Desktop)
min:
101 fps, max:
136 fps
fps
100%
GeForce GTX 1650 (Desktop):
89 [X] Gainward GeForce GTX 1650 4 GB AMD Ryzen 7 2700X 3.7GHz
GeForce GTX 1650 (Desktop)
min:
80 fps, max:
98 fps
fps
100%
GeForce GTX 1650 (Desktop):
58 [X] Gainward GeForce GTX 1650 4 GB AMD Ryzen 7 2700X 3.7GHz
GeForce GTX 1650 (Desktop)
min:
53 fps, max:
65 fps
fps
100%
GeForce GTX 1650 (Desktop):
46 [X] Gainward GeForce GTX 1650 4 GB AMD Ryzen 7 2700X 3.7GHz
GeForce GTX 1650 (Desktop)
min:
41 fps, max:
51 fps
fps
100%
GeForce GTX 1650 (Desktop):
25 [X] Gainward GeForce GTX 1650 4 GB AMD Ryzen 7 2700X 3.7GHz
GeForce GTX 1650 (Desktop)
min:
20 fps, max:
29 fps
fps
100%
GeForce GTX 1650 (Desktop):
135 [X] Gainward GeForce GTX 1650 4 GB AMD Ryzen 7 2700X 3.7GHz
GeForce GTX 1650 (Desktop)
min:
107 fps, max:
158 fps
fps
100%
GeForce GTX 1650 (Desktop):
58.4 [X] Gainward GeForce GTX 1650 4 GB AMD Ryzen 7 2700X 3.7GHz
GeForce GTX 1650 (Desktop)
min:
50 fps, max:
72 fps
fps
100%
GeForce GTX 1650 (Desktop):
54.2 [X] Gainward GeForce GTX 1650 4 GB AMD Ryzen 7 2700X 3.7GHz
GeForce GTX 1650 (Desktop)
min:
47 fps, max:
62 fps
fps
100%
GeForce GTX 1650 (Desktop):
40.8 [X] Gainward GeForce GTX 1650 4 GB AMD Ryzen 7 2700X 3.7GHz
GeForce GTX 1650 (Desktop)
min:
34 fps, max:
47 fps
fps
100%
GeForce GTX 1650 (Desktop):
34.8 [X] Gainward GeForce GTX 1650 4 GB AMD Ryzen 7 2700X 3.7GHz
GeForce GTX 1650 (Desktop)
min:
22 fps, max:
301 fps
fps
100%
GeForce GTX 1650 (Desktop):
12 [X] Gainward GeForce GTX 1650 4 GB AMD Ryzen 7 2700X 3.7GHz
GeForce GTX 1650 (Desktop)
min:
10 fps, max:
14 fps
fps
100%
GeForce GTX 1650 (Desktop):
60 [X] Gainward GeForce GTX 1650 4 GB AMD Ryzen 7 2700X 3.7GHz
GeForce GTX 1650 (Desktop)
min:
59 fps, max:
61 fps
fps
100%
GeForce GTX 1650 (Desktop):
59.9 [X] Gainward GeForce GTX 1650 4 GB AMD Ryzen 7 2700X 3.7GHz
GeForce GTX 1650 (Desktop)
min:
57 fps, max:
61 fps
fps
100%
GeForce GTX 1650 (Desktop):
59.8 [X] Gainward GeForce GTX 1650 4 GB AMD Ryzen 7 2700X 3.7GHz
GeForce GTX 1650 (Desktop)
min:
55 fps, max:
62 fps
fps
100%
GeForce GTX 1650 (Desktop):
53.2 [X] Gainward GeForce GTX 1650 4 GB AMD Ryzen 7 2700X 3.7GHz
GeForce GTX 1650 (Desktop)
min:
48 fps, max:
58 fps
fps
100%
GeForce GTX 1650 (Desktop):
35.1 [X] Gainward GeForce GTX 1650 4 GB AMD Ryzen 7 2700X 3.7GHz
GeForce GTX 1650 (Desktop)
min:
33 fps, max:
38 fps
fps
100%
GeForce GTX 1650 (Desktop):
17 [X] Gainward GeForce GTX 1650 4 GB AMD Ryzen 7 2700X 3.7GHz
GeForce GTX 1650 (Desktop)
min:
16 fps, max:
19 fps
fps
100%
GeForce GTX 1650 (Desktop):
123 [X] Gainward GeForce GTX 1650 4 GB AMD Ryzen 7 2700X 3.7GHz
GeForce GTX 1650 (Desktop)
min:
77 fps, max:
145 fps
135 [X] AMD Ryzen 9 3900X 3.8GHz
GeForce GTX 1650 (Desktop)
min:
119 fps, max:
152 fps
~ 129 fps
60%
Vega M GL / 870:
78 [X] Dell XPS 15 9575 FY00N Intel Core i7-8705G 3.1GHz
Vega M GL / 870
fps
79%
GeForce GTX 1650 Ti Max-Q:
90 102 115 ~ 102 fps
100%
GeForce GTX 1650 (Desktop):
66 [X] Gainward GeForce GTX 1650 4 GB AMD Ryzen 7 2700X 3.7GHz
GeForce GTX 1650 (Desktop)
min:
60 fps, max:
78 fps
69 [X] AMD Ryzen 9 3900X 3.8GHz
GeForce GTX 1650 (Desktop)
min:
60 fps, max:
82 fps
~ 68 fps
62%
Vega M GL / 870:
42 [X] Dell XPS 15 9575 FY00N Intel Core i7-8705G 3.1GHz
Vega M GL / 870
fps
81%
GeForce GTX 1650 Ti Max-Q:
46 56 64 ~ 55 fps
100%
GeForce GTX 1650 (Desktop):
60 [X] Gainward GeForce GTX 1650 4 GB AMD Ryzen 7 2700X 3.7GHz
GeForce GTX 1650 (Desktop)
min:
53 fps, max:
72 fps
63 [X] AMD Ryzen 9 3900X 3.8GHz
GeForce GTX 1650 (Desktop)
min:
56 fps, max:
76 fps
~ 62 fps
63%
Vega M GL / 870:
39 [X] Dell XPS 15 9575 FY00N Intel Core i7-8705G 3.1GHz
Vega M GL / 870
fps
82%
GeForce GTX 1650 Ti Max-Q:
42 51 60 ~ 51 fps
100%
GeForce GTX 1650 (Desktop):
56 [X] Gainward GeForce GTX 1650 4 GB AMD Ryzen 7 2700X 3.7GHz
GeForce GTX 1650 (Desktop)
min:
50 fps, max:
66 fps
59 [X] AMD Ryzen 9 3900X 3.8GHz
GeForce GTX 1650 (Desktop)
min:
52 fps, max:
68 fps
~ 58 fps
62%
Vega M GL / 870:
36 [X] Dell XPS 15 9575 FY00N Intel Core i7-8705G 3.1GHz
Vega M GL / 870
fps
83%
GeForce GTX 1650 Ti Max-Q:
39 47 48 [X] MSI Summit E15 A11SCST High Performance
Intel Core i7-1185G7 3GHz
GeForce GTX 1650 Ti Max-Q
min:
41 fps, max:
56 fps
56 ~ 48 fps
100%
GeForce GTX 1650 (Desktop):
38 [X] Gainward GeForce GTX 1650 4 GB AMD Ryzen 7 2700X 3.7GHz
GeForce GTX 1650 (Desktop)
min:
34 fps, max:
46 fps
40 [X] AMD Ryzen 9 3900X 3.8GHz
GeForce GTX 1650 (Desktop)
min:
36 fps, max:
48 fps
~ 39 fps
62%
Vega M GL / 870:
24 [X] Dell XPS 15 9575 FY00N Intel Core i7-8705G 3.1GHz
Vega M GL / 870
fps
85%
GeForce GTX 1650 Ti Max-Q:
27 38 ~ 33 fps
100%
GeForce GTX 1650 (Desktop):
19 [X] Gainward GeForce GTX 1650 4 GB AMD Ryzen 7 2700X 3.7GHz
GeForce GTX 1650 (Desktop)
min:
16 fps, max:
23 fps
19 [X] AMD Ryzen 9 3900X 3.8GHz
GeForce GTX 1650 (Desktop)
min:
17 fps, max:
25 fps
~ 19 fps
63%
Vega M GL / 870:
12 [X] Dell XPS 15 9575 FY00N Intel Core i7-8705G 3.1GHz
Vega M GL / 870
fps
84%
GeForce GTX 1650 Ti Max-Q:
14 17 ~ 16 fps
Vega M GL / 870:
318.5 [X] Dell XPS 15 9575 FY00N Intel Core i7-8705G 3.1GHz
Vega M GL / 870
fps
Vega M GL / 870:
130.6 [X] Dell XPS 15 9575 FY00N Intel Core i7-8705G 3.1GHz
Vega M GL / 870
fps
Vega M GL / 870:
50.8 [X] Dell XPS 15 9575 FY00N Intel Core i7-8705G 3.1GHz
Vega M GL / 870
fps
Vega M GL / 870:
32.2 [X] Dell XPS 15 9575 FY00N Intel Core i7-8705G 3.1GHz
Vega M GL / 870
fps
Vega M GL / 870:
15.4 [X] Dell XPS 15 9575 FY00N Intel Core i7-8705G 3.1GHz
Vega M GL / 870
fps
100%
GeForce GTX 1650 (Desktop):
123 [X] AMD Ryzen 9 3900X 3.8GHz
GeForce GTX 1650 (Desktop)
fps
41%
Vega M GL / 870:
50.4 [X] Dell XPS 15 9575 FY00N Intel Core i7-8705G 3.1GHz
Vega M GL / 870
fps
73%
GeForce GTX 1650 Ti Max-Q:
79 80.2 85.9 86.6 86.8 91.2 92.6 93.9 96.4 97.5 [X] MSI Summit E15 A11SCST High Performance
Intel Core i7-1185G7 3GHz
GeForce GTX 1650 Ti Max-Q
98 [X] MSI Summit E15 A11SCST High Performance, Cooler Boost
Intel Core i7-1185G7 3GHz
GeForce GTX 1650 Ti Max-Q
~ 90 fps
100%
GeForce GTX 1650 (Desktop):
110 [X] AMD Ryzen 9 3900X 3.8GHz
GeForce GTX 1650 (Desktop)
fps
38%
Vega M GL / 870:
42.2 [X] Dell XPS 15 9575 FY00N Intel Core i7-8705G 3.1GHz
Vega M GL / 870
fps
71%
GeForce GTX 1650 Ti Max-Q:
71.5 71.9 72.8 73.5 78.2 79.2 79.4 80.7 83.5 [X] MSI Summit E15 A11SCST High Performance
Intel Core i7-1185G7 3GHz
GeForce GTX 1650 Ti Max-Q
83.9 [X] MSI Summit E15 A11SCST High Performance, Cooler Boost
Intel Core i7-1185G7 3GHz
GeForce GTX 1650 Ti Max-Q
87.5 ~ 78 fps
100%
GeForce GTX 1650 (Desktop):
89.6 [X] AMD Ryzen 9 3900X 3.8GHz
GeForce GTX 1650 (Desktop)
fps
41%
Vega M GL / 870:
36.9 [X] Dell XPS 15 9575 FY00N Intel Core i7-8705G 3.1GHz
Vega M GL / 870
fps
75%
GeForce GTX 1650 Ti Max-Q:
60.5 62.6 62.7 63.1 66.4 66.7 67.5 69.7 70.6 [X] MSI Summit E15 A11SCST High Performance
Intel Core i7-1185G7 3GHz
GeForce GTX 1650 Ti Max-Q
70.8 [X] MSI Summit E15 A11SCST High Performance, Cooler Boost
Intel Core i7-1185G7 3GHz
GeForce GTX 1650 Ti Max-Q
72.3 ~ 67 fps
100%
GeForce GTX 1650 (Desktop):
66.9 [X] AMD Ryzen 9 3900X 3.8GHz
GeForce GTX 1650 (Desktop)
fps
35%
Vega M GL / 870:
23.6 [X] Dell XPS 15 9575 FY00N Intel Core i7-8705G 3.1GHz
Vega M GL / 870
fps
100%
GeForce GTX 1650 (Desktop):
139 [X] Gainward GeForce GTX 1650 4 GB AMD Ryzen 7 2700X 3.7GHz
GeForce GTX 1650 (Desktop)
min:
61 fps, max:
180 fps
fps
100%
GeForce GTX 1650 (Desktop):
64 [X] Gainward GeForce GTX 1650 4 GB AMD Ryzen 7 2700X 3.7GHz
GeForce GTX 1650 (Desktop)
min:
42 fps, max:
73 fps
fps
100%
GeForce GTX 1650 (Desktop):
52 [X] Gainward GeForce GTX 1650 4 GB AMD Ryzen 7 2700X 3.7GHz
GeForce GTX 1650 (Desktop)
min:
43 fps, max:
61 fps
fps
100%
GeForce GTX 1650 (Desktop):
38.6 [X] Gainward GeForce GTX 1650 4 GB AMD Ryzen 7 2700X 3.7GHz
GeForce GTX 1650 (Desktop)
min:
29 fps, max:
46 fps
fps
100%
GeForce GTX 1650 (Desktop):
24.2 [X] Gainward GeForce GTX 1650 4 GB AMD Ryzen 7 2700X 3.7GHz
GeForce GTX 1650 (Desktop)
min:
20 fps, max:
28 fps
fps
100%
GeForce GTX 1650 (Desktop):
11.5 [X] Gainward GeForce GTX 1650 4 GB AMD Ryzen 7 2700X 3.7GHz
GeForce GTX 1650 (Desktop)
min:
9 fps, max:
14 fps
fps
100%
GeForce GTX 1650 (Desktop):
57.2 [X] Gainward GeForce GTX 1650 4 GB AMD Ryzen 7 2700X 3.7GHz
GeForce GTX 1650 (Desktop)
min:
32 fps, max:
89 fps
108 [X] 1.3
AMD Ryzen 9 3900X 3.8GHz
GeForce GTX 1650 (Desktop)
~ 83 fps
40%
Vega M GL / 870:
9 57.3 [X] Dell XPS 15 9575 FY00N Intel Core i7-8705G 3.1GHz
Vega M GL / 870
~ 33 fps
102%
GeForce GTX 1650 Ti Max-Q:
72 90.1 94 ~ 85 fps
100%
GeForce GTX 1650 (Desktop):
50.1 [X] Gainward GeForce GTX 1650 4 GB AMD Ryzen 7 2700X 3.7GHz
GeForce GTX 1650 (Desktop)
min:
40 fps, max:
66 fps
55.3 [X] 1.3
AMD Ryzen 9 3900X 3.8GHz
GeForce GTX 1650 (Desktop)
~ 53 fps
59%
Vega M GL / 870:
31.3 [X] Dell XPS 15 9575 FY00N Intel Core i7-8705G 3.1GHz
Vega M GL / 870
fps
100%
GeForce GTX 1650 (Desktop):
35.7 [X] Gainward GeForce GTX 1650 4 GB AMD Ryzen 7 2700X 3.7GHz
GeForce GTX 1650 (Desktop)
min:
18 fps, max:
56 fps
41.2 [X] 1.3
AMD Ryzen 9 3900X 3.8GHz
GeForce GTX 1650 (Desktop)
~ 38 fps
54%
Vega M GL / 870:
20.7 [X] Dell XPS 15 9575 FY00N Intel Core i7-8705G 3.1GHz
Vega M GL / 870
fps
100%
GeForce GTX 1650 (Desktop):
28.9 [X] 1.3
AMD Ryzen 9 3900X 3.8GHz
GeForce GTX 1650 (Desktop)
fps
67%
GeForce GTX 1650 Ti Max-Q:
19.3 fps
100%
GeForce GTX 1650 (Desktop):
12.5 [X] Gainward GeForce GTX 1650 4 GB AMD Ryzen 7 2700X 3.7GHz
GeForce GTX 1650 (Desktop)
min:
3 fps, max:
20 fps
15.8 [X] 1.3
AMD Ryzen 9 3900X 3.8GHz
GeForce GTX 1650 (Desktop)
~ 14 fps
59%
Vega M GL / 870:
8.2 [X] Dell XPS 15 9575 FY00N Intel Core i7-8705G 3.1GHz
Vega M GL / 870
fps
72%
GeForce GTX 1650 Ti Max-Q:
10.1 fps
100%
GeForce GTX 1650 (Desktop):
250 [X] Gainward GeForce GTX 1650 4 GB AMD Ryzen 7 2700X 3.7GHz
GeForce GTX 1650 (Desktop)
min:
157 fps, max:
283 fps
fps
51%
Vega M GL / 870:
126.9 [X] Dell XPS 15 9575 FY00N Intel Core i7-8705G 3.1GHz
Vega M GL / 870
fps
100%
GeForce GTX 1650 (Desktop):
211 [X] Gainward GeForce GTX 1650 4 GB AMD Ryzen 7 2700X 3.7GHz
GeForce GTX 1650 (Desktop)
min:
152 fps, max:
271 fps
fps
41%
Vega M GL / 870:
86.2 [X] Dell XPS 15 9575 FY00N Intel Core i7-8705G 3.1GHz
Vega M GL / 870
fps
100%
GeForce GTX 1650 (Desktop):
85 [X] Gainward GeForce GTX 1650 4 GB AMD Ryzen 7 2700X 3.7GHz
GeForce GTX 1650 (Desktop)
min:
74 fps, max:
95 fps
fps
66%
Vega M GL / 870:
55.7 [X] Dell XPS 15 9575 FY00N Intel Core i7-8705G 3.1GHz
Vega M GL / 870
fps
100%
GeForce GTX 1650 (Desktop):
61 [X] Gainward GeForce GTX 1650 4 GB AMD Ryzen 7 2700X 3.7GHz
GeForce GTX 1650 (Desktop)
min:
55 fps, max:
67 fps
fps
62%
Vega M GL / 870:
37.9 [X] Dell XPS 15 9575 FY00N Intel Core i7-8705G 3.1GHz
Vega M GL / 870
fps
100%
GeForce GTX 1650 (Desktop):
41.7 [X] Gainward GeForce GTX 1650 4 GB AMD Ryzen 7 2700X 3.7GHz
GeForce GTX 1650 (Desktop)
min:
35 fps, max:
54 fps
fps
58%
Vega M GL / 870:
24.2 [X] Dell XPS 15 9575 FY00N Intel Core i7-8705G 3.1GHz
Vega M GL / 870
fps
100%
GeForce GTX 1650 (Desktop):
11.3 [X] Gainward GeForce GTX 1650 4 GB AMD Ryzen 7 2700X 3.7GHz
GeForce GTX 1650 (Desktop)
min:
8 fps, max:
13 fps
fps
78%
Vega M GL / 870:
8.8 [X] Dell XPS 15 9575 FY00N Intel Core i7-8705G 3.1GHz
Vega M GL / 870
fps
100%
GeForce GTX 1650 (Desktop):
227 [X] Gainward GeForce GTX 1650 4 GB AMD Ryzen 7 2700X 3.7GHz
GeForce GTX 1650 (Desktop)
min:
156 fps, max:
314 fps
fps
100%
GeForce GTX 1650 (Desktop):
181 [X] Gainward GeForce GTX 1650 4 GB AMD Ryzen 7 2700X 3.7GHz
GeForce GTX 1650 (Desktop)
min:
130 fps, max:
240 fps
fps
100%
GeForce GTX 1650 (Desktop):
82 [X] Gainward GeForce GTX 1650 4 GB AMD Ryzen 7 2700X 3.7GHz
GeForce GTX 1650 (Desktop)
min:
60 fps, max:
99 fps
fps
100%
GeForce GTX 1650 (Desktop):
54.4 [X] Gainward GeForce GTX 1650 4 GB AMD Ryzen 7 2700X 3.7GHz
GeForce GTX 1650 (Desktop)
min:
39 fps, max:
68 fps
fps
100%
GeForce GTX 1650 (Desktop):
44.7 [X] Gainward GeForce GTX 1650 4 GB AMD Ryzen 7 2700X 3.7GHz
GeForce GTX 1650 (Desktop)
min:
23 fps, max:
57 fps
fps
100%
GeForce GTX 1650 (Desktop):
27.5 [X] Gainward GeForce GTX 1650 4 GB AMD Ryzen 7 2700X 3.7GHz
GeForce GTX 1650 (Desktop)
min:
13 fps, max:
35 fps
fps
100%
GeForce GTX 1650 (Desktop):
102 [X] Gainward GeForce GTX 1650 4 GB AMD Ryzen 7 2700X 3.7GHz
GeForce GTX 1650 (Desktop)
fps
100%
GeForce GTX 1650 (Desktop):
63 [X] Gainward GeForce GTX 1650 4 GB AMD Ryzen 7 2700X 3.7GHz
GeForce GTX 1650 (Desktop)
fps
100%
GeForce GTX 1650 (Desktop):
57 [X] Gainward GeForce GTX 1650 4 GB AMD Ryzen 7 2700X 3.7GHz
GeForce GTX 1650 (Desktop)
fps
100%
GeForce GTX 1650 (Desktop):
47 [X] Gainward GeForce GTX 1650 4 GB AMD Ryzen 7 2700X 3.7GHz
GeForce GTX 1650 (Desktop)
fps
100%
GeForce GTX 1650 (Desktop):
33 [X] Gainward GeForce GTX 1650 4 GB AMD Ryzen 7 2700X 3.7GHz
GeForce GTX 1650 (Desktop)
fps
100%
GeForce GTX 1650 (Desktop):
17 [X] Gainward GeForce GTX 1650 4 GB AMD Ryzen 7 2700X 3.7GHz
GeForce GTX 1650 (Desktop)
fps
100%
GeForce GTX 1650 (Desktop):
140 [X] Gainward GeForce GTX 1650 4 GB AMD Ryzen 7 2700X 3.7GHz
GeForce GTX 1650 (Desktop)
P1:
98.8 fps
fps
100%
GeForce GTX 1650 (Desktop):
87 [X] Gainward GeForce GTX 1650 4 GB AMD Ryzen 7 2700X 3.7GHz
GeForce GTX 1650 (Desktop)
P1:
71.4 fps
fps
100%
GeForce GTX 1650 (Desktop):
80 [X] Gainward GeForce GTX 1650 4 GB AMD Ryzen 7 2700X 3.7GHz
GeForce GTX 1650 (Desktop)
P1:
64.2 fps
fps
100%
GeForce GTX 1650 (Desktop):
66 [X] Gainward GeForce GTX 1650 4 GB AMD Ryzen 7 2700X 3.7GHz
GeForce GTX 1650 (Desktop)
P1:
54.9 fps
fps
100%
GeForce GTX 1650 (Desktop):
43.7 [X] Gainward GeForce GTX 1650 4 GB AMD Ryzen 7 2700X 3.7GHz
GeForce GTX 1650 (Desktop)
P1:
38.3 fps
fps
100%
GeForce GTX 1650 (Desktop):
22.5 [X] Gainward GeForce GTX 1650 4 GB AMD Ryzen 7 2700X 3.7GHz
GeForce GTX 1650 (Desktop)
P1:
20.3 fps
fps
100%
GeForce GTX 1650 (Desktop):
190 [X] Gainward GeForce GTX 1650 4 GB AMD Ryzen 7 2700X 3.7GHz
GeForce GTX 1650 (Desktop)
min:
139 fps, max:
226 fps
fps
100%
GeForce GTX 1650 (Desktop):
90 [X] Gainward GeForce GTX 1650 4 GB AMD Ryzen 7 2700X 3.7GHz
GeForce GTX 1650 (Desktop)
min:
82 fps, max:
97 fps
fps
100%
GeForce GTX 1650 (Desktop):
86 [X] Gainward GeForce GTX 1650 4 GB AMD Ryzen 7 2700X 3.7GHz
GeForce GTX 1650 (Desktop)
min:
77 fps, max:
98 fps
fps
100%
GeForce GTX 1650 (Desktop):
66 [X] Gainward GeForce GTX 1650 4 GB AMD Ryzen 7 2700X 3.7GHz
GeForce GTX 1650 (Desktop)
min:
55 fps, max:
84 fps
fps
100%
GeForce GTX 1650 (Desktop):
26.3 [X] Gainward GeForce GTX 1650 4 GB AMD Ryzen 7 2700X 3.7GHz
GeForce GTX 1650 (Desktop)
min:
22 fps, max:
31 fps
fps
100%
GeForce GTX 1650 (Desktop):
316 [X] Gainward GeForce GTX 1650 4 GB AMD Ryzen 7 2700X 3.7GHz
GeForce GTX 1650 (Desktop)
min:
300 fps, max:
329 fps
fps
13%
Vega M GL / 870:
40.9 fps
100%
GeForce GTX 1650 (Desktop):
165 [X] Gainward GeForce GTX 1650 4 GB AMD Ryzen 7 2700X 3.7GHz
GeForce GTX 1650 (Desktop)
min:
143 fps, max:
182 fps
fps
10%
Vega M GL / 870:
16.3 fps
100%
GeForce GTX 1650 (Desktop):
112 [X] Gainward GeForce GTX 1650 4 GB AMD Ryzen 7 2700X 3.7GHz
GeForce GTX 1650 (Desktop)
min:
102 fps, max:
126 fps
fps
9%
Vega M GL / 870:
9.7 fps
100%
GeForce GTX 1650 (Desktop):
61 [X] Gainward GeForce GTX 1650 4 GB AMD Ryzen 7 2700X 3.7GHz
GeForce GTX 1650 (Desktop)
min:
53 fps, max:
75 fps
fps
Vega M GL / 870:
248.2 [X] Dell XPS 15 9575 FY00N Intel Core i7-8705G 3.1GHz
Vega M GL / 870
fps
Vega M GL / 870:
159.8 [X] Dell XPS 15 9575 FY00N Intel Core i7-8705G 3.1GHz
Vega M GL / 870
fps
Vega M GL / 870:
99.1 [X] Dell XPS 15 9575 FY00N Intel Core i7-8705G 3.1GHz
Vega M GL / 870
fps
Vega M GL / 870:
61.6 [X] Dell XPS 15 9575 FY00N Intel Core i7-8705G 3.1GHz
Vega M GL / 870
fps
Vega M GL / 870:
29.6 [X] Dell XPS 15 9575 FY00N Intel Core i7-8705G 3.1GHz
Vega M GL / 870
fps
100%
GeForce GTX 1650 (Desktop):
125.9 [X] Gainward GeForce GTX 1650 4 GB AMD Ryzen 7 2700X 3.7GHz
GeForce GTX 1650 (Desktop)
min:
78 fps, max:
145 fps
fps
100%
GeForce GTX 1650 (Desktop):
60.6 [X] Gainward GeForce GTX 1650 4 GB AMD Ryzen 7 2700X 3.7GHz
GeForce GTX 1650 (Desktop)
min:
48 fps, max:
68 fps
fps
100%
GeForce GTX 1650 (Desktop):
55.8 [X] Gainward GeForce GTX 1650 4 GB AMD Ryzen 7 2700X 3.7GHz
GeForce GTX 1650 (Desktop)
min:
44 fps, max:
64 fps
fps
100%
GeForce GTX 1650 (Desktop):
20.1 [X] Gainward GeForce GTX 1650 4 GB AMD Ryzen 7 2700X 3.7GHz
GeForce GTX 1650 (Desktop)
min:
19 fps, max:
35 fps
fps
100%
GeForce GTX 1650 (Desktop):
17.8 [X] Gainward GeForce GTX 1650 4 GB AMD Ryzen 7 2700X 3.7GHz
GeForce GTX 1650 (Desktop)
min:
14 fps, max:
21 fps
fps
100%
GeForce GTX 1650 (Desktop):
216 [X] Gainward GeForce GTX 1650 4 GB AMD Ryzen 7 2700X 3.7GHz
GeForce GTX 1650 (Desktop)
min:
96 fps, max:
303 fps
fps
100%
GeForce GTX 1650 (Desktop):
81.1 [X] Gainward GeForce GTX 1650 4 GB AMD Ryzen 7 2700X 3.7GHz
GeForce GTX 1650 (Desktop)
min:
47 fps, max:
100 fps
fps
100%
GeForce GTX 1650 (Desktop):
77.6 [X] Gainward GeForce GTX 1650 4 GB AMD Ryzen 7 2700X 3.7GHz
GeForce GTX 1650 (Desktop)
min:
58 fps, max:
96 fps
fps
100%
GeForce GTX 1650 (Desktop):
59.3 [X] Gainward GeForce GTX 1650 4 GB AMD Ryzen 7 2700X 3.7GHz
GeForce GTX 1650 (Desktop)
min:
39 fps, max:
79 fps
fps
100%
GeForce GTX 1650 (Desktop):
23.4 [X] Gainward GeForce GTX 1650 4 GB AMD Ryzen 7 2700X 3.7GHz
GeForce GTX 1650 (Desktop)
min:
17 fps, max:
29 fps
fps
100%
GeForce GTX 1650 (Desktop):
121 [X] Gainward GeForce GTX 1650 4 GB AMD Ryzen 7 2700X 3.7GHz
GeForce GTX 1650 (Desktop)
min:
100 fps, max:
139 fps
fps
100%
GeForce GTX 1650 (Desktop):
102 [X] Gainward GeForce GTX 1650 4 GB AMD Ryzen 7 2700X 3.7GHz
GeForce GTX 1650 (Desktop)
min:
87 fps, max:
115 fps
fps
100%
GeForce GTX 1650 (Desktop):
51.7 [X] Gainward GeForce GTX 1650 4 GB AMD Ryzen 7 2700X 3.7GHz
GeForce GTX 1650 (Desktop)
min:
32 fps, max:
58 fps
fps
100%
GeForce GTX 1650 (Desktop):
32.4 [X] Gainward GeForce GTX 1650 4 GB AMD Ryzen 7 2700X 3.7GHz
GeForce GTX 1650 (Desktop)
min:
25 fps, max:
38 fps
fps
100%
GeForce GTX 1650 (Desktop):
18 [X] Gainward GeForce GTX 1650 4 GB AMD Ryzen 7 2700X 3.7GHz
GeForce GTX 1650 (Desktop)
min:
16 fps, max:
20 fps
fps
100%
GeForce GTX 1650 (Desktop):
118.3 [X] Gainward GeForce GTX 1650 4 GB AMD Ryzen 7 2700X 3.7GHz
GeForce GTX 1650 (Desktop)
fps
100%
GeForce GTX 1650 (Desktop):
112 [X] Gainward GeForce GTX 1650 4 GB AMD Ryzen 7 2700X 3.7GHz
GeForce GTX 1650 (Desktop)
fps
100%
GeForce GTX 1650 (Desktop):
71 [X] Gainward GeForce GTX 1650 4 GB AMD Ryzen 7 2700X 3.7GHz
GeForce GTX 1650 (Desktop)
fps
100%
GeForce GTX 1650 (Desktop):
58.9 [X] Gainward GeForce GTX 1650 4 GB AMD Ryzen 7 2700X 3.7GHz
GeForce GTX 1650 (Desktop)
fps
100%
GeForce GTX 1650 (Desktop):
26 [X] Gainward GeForce GTX 1650 4 GB AMD Ryzen 7 2700X 3.7GHz
GeForce GTX 1650 (Desktop)
fps
100%
GeForce GTX 1650 (Desktop):
193 [X] Gainward GeForce GTX 1650 4 GB AMD Ryzen 7 2700X 3.7GHz
GeForce GTX 1650 (Desktop)
min:
171 fps, max:
201 fps
fps
100%
GeForce GTX 1650 (Desktop):
158 [X] Gainward GeForce GTX 1650 4 GB AMD Ryzen 7 2700X 3.7GHz
GeForce GTX 1650 (Desktop)
min:
146 fps, max:
170 fps
fps
100%
GeForce GTX 1650 (Desktop):
78 [X] Gainward GeForce GTX 1650 4 GB AMD Ryzen 7 2700X 3.7GHz
GeForce GTX 1650 (Desktop)
min:
70 fps, max:
84 fps
fps
100%
GeForce GTX 1650 (Desktop):
71 [X] Gainward GeForce GTX 1650 4 GB AMD Ryzen 7 2700X 3.7GHz
GeForce GTX 1650 (Desktop)
min:
61 fps, max:
76 fps
fps
100%
GeForce GTX 1650 (Desktop):
28.8 [X] Gainward GeForce GTX 1650 4 GB AMD Ryzen 7 2700X 3.7GHz
GeForce GTX 1650 (Desktop)
min:
27 fps, max:
31 fps
fps
100%
GeForce GTX 1650 (Desktop):
130.4 [X] Gainward GeForce GTX 1650 4 GB AMD Ryzen 7 2700X 3.7GHz
GeForce GTX 1650 (Desktop)
min:
8 fps, max:
183 fps
fps
100%
GeForce GTX 1650 (Desktop):
97 [X] Gainward GeForce GTX 1650 4 GB AMD Ryzen 7 2700X 3.7GHz
GeForce GTX 1650 (Desktop)
min:
74 fps, max:
131 fps
fps
100%
GeForce GTX 1650 (Desktop):
52.5 [X] Gainward GeForce GTX 1650 4 GB AMD Ryzen 7 2700X 3.7GHz
GeForce GTX 1650 (Desktop)
min:
43 fps, max:
67 fps
fps
100%
GeForce GTX 1650 (Desktop):
27.6 [X] Gainward GeForce GTX 1650 4 GB AMD Ryzen 7 2700X 3.7GHz
GeForce GTX 1650 (Desktop)
min:
22 fps, max:
36 fps
fps
100%
GeForce GTX 1650 (Desktop):
16.8 [X] Gainward GeForce GTX 1650 4 GB AMD Ryzen 7 2700X 3.7GHz
GeForce GTX 1650 (Desktop)
min:
14 fps, max:
21 fps
fps
100%
GeForce GTX 1650 (Desktop):
291 [X] Gainward GeForce GTX 1650 4 GB AMD Ryzen 7 2700X 3.7GHz
GeForce GTX 1650 (Desktop)
min:
240 fps, max:
302 fps
fps
100%
GeForce GTX 1650 (Desktop):
300 [X] Gainward GeForce GTX 1650 4 GB AMD Ryzen 7 2700X 3.7GHz
GeForce GTX 1650 (Desktop)
min:
297 fps, max:
301 fps
fps
61%
Vega M GL / 870:
184.3 fps
100%
GeForce GTX 1650 (Desktop):
149 [X] Gainward GeForce GTX 1650 4 GB AMD Ryzen 7 2700X 3.7GHz
GeForce GTX 1650 (Desktop)
min:
121 fps, max:
172 fps
fps
73%
Vega M GL / 870:
108.2 fps
100%
GeForce GTX 1650 (Desktop):
87 [X] Gainward GeForce GTX 1650 4 GB AMD Ryzen 7 2700X 3.7GHz
GeForce GTX 1650 (Desktop)
min:
71 fps, max:
102 fps
fps
57%
Vega M GL / 870:
50 fps
100%
GeForce GTX 1650 (Desktop):
46.9 [X] Gainward GeForce GTX 1650 4 GB AMD Ryzen 7 2700X 3.7GHz
GeForce GTX 1650 (Desktop)
min:
39 fps, max:
54 fps
fps
100%
GeForce GTX 1650 (Desktop):
166 [X] Gainward GeForce GTX 1650 4 GB AMD Ryzen 7 2700X 3.7GHz
GeForce GTX 1650 (Desktop)
min:
103 fps, max:
201 fps
fps
100%
GeForce GTX 1650 (Desktop):
141 [X] Gainward GeForce GTX 1650 4 GB AMD Ryzen 7 2700X 3.7GHz
GeForce GTX 1650 (Desktop)
min:
88 fps, max:
192 fps
fps
100%
GeForce GTX 1650 (Desktop):
111 [X] Gainward GeForce GTX 1650 4 GB AMD Ryzen 7 2700X 3.7GHz
GeForce GTX 1650 (Desktop)
min:
86 fps, max:
147 fps
fps
100%
GeForce GTX 1650 (Desktop):
91 [X] Gainward GeForce GTX 1650 4 GB AMD Ryzen 7 2700X 3.7GHz
GeForce GTX 1650 (Desktop)
min:
67 fps, max:
135 fps
fps
100%
GeForce GTX 1650 (Desktop):
37.2 [X] Gainward GeForce GTX 1650 4 GB AMD Ryzen 7 2700X 3.7GHz
GeForce GTX 1650 (Desktop)
min:
31 fps, max:
48 fps
fps
Vega M GL / 870:
54.1 54.9 58.7 [X] Dell XPS 15 9575 FY00N Intel Core i7-8705G 3.1GHz
Vega M GL / 870
~ 56 fps
Vega M GL / 870:
36.4 37 38.4 [X] Dell XPS 15 9575 FY00N Intel Core i7-8705G 3.1GHz
Vega M GL / 870
~ 37 fps
Vega M GL / 870:
32.3 32.5 [X] Dell XPS 15 9575 FY00N Intel Core i7-8705G 3.1GHz
Vega M GL / 870
32.7 ~ 33 fps
100%
GeForce GTX 1650 (Desktop):
173.4 [X] Gainward GeForce GTX 1650 4 GB AMD Ryzen 7 2700X 3.7GHz
GeForce GTX 1650 (Desktop)
fps
100%
GeForce GTX 1650 (Desktop):
114.7 [X] Gainward GeForce GTX 1650 4 GB AMD Ryzen 7 2700X 3.7GHz
GeForce GTX 1650 (Desktop)
fps
100%
GeForce GTX 1650 (Desktop):
56.1 [X] Gainward GeForce GTX 1650 4 GB AMD Ryzen 7 2700X 3.7GHz
GeForce GTX 1650 (Desktop)
fps
100%
GeForce GTX 1650 (Desktop):
40.4 [X] Gainward GeForce GTX 1650 4 GB AMD Ryzen 7 2700X 3.7GHz
GeForce GTX 1650 (Desktop)
fps
100%
GeForce GTX 1650 (Desktop):
1.4 [X] Gainward GeForce GTX 1650 4 GB AMD Ryzen 7 2700X 3.7GHz
GeForce GTX 1650 (Desktop)
fps
100%
GeForce GTX 1650 (Desktop):
120 [X] Gainward GeForce GTX 1650 4 GB AMD Ryzen 7 2700X 3.7GHz
GeForce GTX 1650 (Desktop)
min:
93 fps, max:
138 fps
fps
100%
GeForce GTX 1650 (Desktop):
80 [X] Gainward GeForce GTX 1650 4 GB AMD Ryzen 7 2700X 3.7GHz
GeForce GTX 1650 (Desktop)
min:
73 fps, max:
92 fps
fps
100%
GeForce GTX 1650 (Desktop):
70 [X] Gainward GeForce GTX 1650 4 GB AMD Ryzen 7 2700X 3.7GHz
GeForce GTX 1650 (Desktop)
min:
63 fps, max:
80 fps
fps
100%
GeForce GTX 1650 (Desktop):
51 [X] Gainward GeForce GTX 1650 4 GB AMD Ryzen 7 2700X 3.7GHz
GeForce GTX 1650 (Desktop)
min:
40 fps, max:
65 fps
fps
100%
GeForce GTX 1650 (Desktop):
22 [X] Gainward GeForce GTX 1650 4 GB AMD Ryzen 7 2700X 3.7GHz
GeForce GTX 1650 (Desktop)
min:
21 fps, max:
24 fps
fps
100%
GeForce GTX 1650 (Desktop):
207 [X] Gainward GeForce GTX 1650 4 GB AMD Ryzen 7 2700X 3.7GHz
GeForce GTX 1650 (Desktop)
min:
190 fps, max:
223 fps
fps
61%
GeForce GTX 1650 Ti Max-Q:
89.7 163.4 ~ 127 fps
100%
GeForce GTX 1650 (Desktop):
122 [X] Gainward GeForce GTX 1650 4 GB AMD Ryzen 7 2700X 3.7GHz
GeForce GTX 1650 (Desktop)
min:
116 fps, max:
130 fps
fps
79%
GeForce GTX 1650 Ti Max-Q:
84.7 107.4 ~ 96 fps
100%
GeForce GTX 1650 (Desktop):
66 [X] Gainward GeForce GTX 1650 4 GB AMD Ryzen 7 2700X 3.7GHz
GeForce GTX 1650 (Desktop)
min:
59 fps, max:
73 fps
fps
89%
GeForce GTX 1650 Ti Max-Q:
58.1 60.5 ~ 59 fps
100%
GeForce GTX 1650 (Desktop):
53.4 [X] Gainward GeForce GTX 1650 4 GB AMD Ryzen 7 2700X 3.7GHz
GeForce GTX 1650 (Desktop)
min:
48 fps, max:
59 fps
fps
92%
GeForce GTX 1650 Ti Max-Q:
48.9 49.1 ~ 49 fps
100%
GeForce GTX 1650 (Desktop):
22 [X] Gainward GeForce GTX 1650 4 GB AMD Ryzen 7 2700X 3.7GHz
GeForce GTX 1650 (Desktop)
min:
20 fps, max:
26 fps
fps
59%
Vega M GL / 870:
12 14.3 ~ 13 fps
95%
GeForce GTX 1650 Ti Max-Q:
19.9 22.9 ~ 21 fps
100%
GeForce GTX 1650 (Desktop):
264.1 [X] Gainward GeForce GTX 1650 4 GB AMD Ryzen 7 2700X 3.7GHz
GeForce GTX 1650 (Desktop)
min:
26 fps, max:
447 fps
fps
68%
Vega M GL / 870:
180.9 [X] Dell XPS 15 9575 FY00N Intel Core i7-8705G 3.1GHz
Vega M GL / 870
fps
100%
GeForce GTX 1650 (Desktop):
209.9 [X] Gainward GeForce GTX 1650 4 GB AMD Ryzen 7 2700X 3.7GHz
GeForce GTX 1650 (Desktop)
min:
45 fps, max:
348 fps
fps
71%
Vega M GL / 870:
149.4 [X] Dell XPS 15 9575 FY00N Intel Core i7-8705G 3.1GHz
Vega M GL / 870
fps
100%
GeForce GTX 1650 (Desktop):
146.2 [X] Gainward GeForce GTX 1650 4 GB AMD Ryzen 7 2700X 3.7GHz
GeForce GTX 1650 (Desktop)
min:
51 fps, max:
248 fps
fps
66%
Vega M GL / 870:
97 [X] Dell XPS 15 9575 FY00N Intel Core i7-8705G 3.1GHz
Vega M GL / 870
fps
100%
GeForce GTX 1650 (Desktop):
124 [X] Gainward GeForce GTX 1650 4 GB AMD Ryzen 7 2700X 3.7GHz
GeForce GTX 1650 (Desktop)
min:
26 fps, max:
195 fps
fps
65%
Vega M GL / 870:
80.5 [X] Dell XPS 15 9575 FY00N Intel Core i7-8705G 3.1GHz
Vega M GL / 870
fps
100%
GeForce GTX 1650 (Desktop):
49.6 [X] Gainward GeForce GTX 1650 4 GB AMD Ryzen 7 2700X 3.7GHz
GeForce GTX 1650 (Desktop)
min:
37 fps, max:
58 fps
fps
62%
Vega M GL / 870:
30.8 [X] Dell XPS 15 9575 FY00N Intel Core i7-8705G 3.1GHz
Vega M GL / 870
fps
100%
GeForce GTX 1650 (Desktop):
92 [X] Desktop Asus M5A97 Evo, Zotac GTX 1650 AMD FX-8350 4GHz
GeForce GTX 1650 (Desktop)
min:
79.6 fps
156.7 [X] AMD Ryzen 9 3900X 3.8GHz
GeForce GTX 1650 (Desktop)
min:
134.4 fps, max:
-1 fps
~ 124 fps
110%
GeForce GTX 1650 Ti Max-Q:
118 128 130 137 140 [X] MSI Summit E15 A11SCST High Performance, Cooler Boost
Intel Core i7-1185G7 3GHz
GeForce GTX 1650 Ti Max-Q
min:
123.5 fps, max:
-1 fps
140 142 143 [X] MSI Summit E15 A11SCST High Performance
Intel Core i7-1185G7 3GHz
GeForce GTX 1650 Ti Max-Q
min:
125.9 fps, max:
-1 fps
143 144 147 ~ 137 fps
100%
GeForce GTX 1650 (Desktop):
85 [X] Desktop Asus M5A97 Evo, Zotac GTX 1650 AMD FX-8350 4GHz
GeForce GTX 1650 (Desktop)
min:
73.7 fps
114.3 [X] AMD Ryzen 9 3900X 3.8GHz
GeForce GTX 1650 (Desktop)
min:
73.1 fps, max:
-1 fps
~ 100 fps
120%
GeForce GTX 1650 Ti Max-Q:
112 116 117 118 118 119 121 124 [X] MSI Summit E15 A11SCST High Performance
Intel Core i7-1185G7 3GHz
GeForce GTX 1650 Ti Max-Q
min:
109 fps, max:
-1 fps
124 [X] MSI Summit E15 A11SCST High Performance, Cooler Boost
Intel Core i7-1185G7 3GHz
GeForce GTX 1650 Ti Max-Q
min:
107.8 fps, max:
-1 fps
127 129 ~ 120 fps
100%
GeForce GTX 1650 (Desktop):
82 [X] Desktop Asus M5A97 Evo, Zotac GTX 1650 AMD FX-8350 4GHz
GeForce GTX 1650 (Desktop)
min:
71.1 fps
112.6 [X] AMD Ryzen 9 3900X 3.8GHz
GeForce GTX 1650 (Desktop)
min:
72 fps, max:
-1 fps
~ 97 fps
116%
GeForce GTX 1650 Ti Max-Q:
107 107 109 111 111 112 113 115 117 [X] MSI Summit E15 A11SCST High Performance
Intel Core i7-1185G7 3GHz
GeForce GTX 1650 Ti Max-Q
min:
100.4 fps, max:
-1 fps
117 [X] MSI Summit E15 A11SCST High Performance, Cooler Boost
Intel Core i7-1185G7 3GHz
GeForce GTX 1650 Ti Max-Q
min:
100.7 fps, max:
-1 fps
121 ~ 113 fps
100%
GeForce GTX 1650 (Desktop):
77 [X] Desktop Asus M5A97 Evo, Zotac GTX 1650 AMD FX-8350 4GHz
GeForce GTX 1650 (Desktop)
min:
66.6 fps
106.9 [X] AMD Ryzen 9 3900X 3.8GHz
GeForce GTX 1650 (Desktop)
min:
65.6 fps, max:
-1 fps
~ 92 fps
115%
GeForce GTX 1650 Ti Max-Q:
101 103 104 104 105 106 107 108 [X] MSI Summit E15 A11SCST High Performance
Intel Core i7-1185G7 3GHz
GeForce GTX 1650 Ti Max-Q
min:
89.9 fps, max:
-1 fps
108 [X] MSI Summit E15 A11SCST High Performance, Cooler Boost
Intel Core i7-1185G7 3GHz
GeForce GTX 1650 Ti Max-Q
min:
91.3 fps, max:
-1 fps
109 110 ~ 106 fps
100%
GeForce GTX 1650 (Desktop):
59.1 [X] AMD Ryzen 9 3900X 3.8GHz
GeForce GTX 1650 (Desktop)
min:
54.1 fps, max:
-1 fps
fps
Vega M GL / 870:
108 111 118 [X] Dell XPS 15 9575 FY00N Intel Core i7-8705G 3.1GHz
Vega M GL / 870
~ 112 fps
Vega M GL / 870:
95 97 107 [X] Dell XPS 15 9575 FY00N Intel Core i7-8705G 3.1GHz
Vega M GL / 870
~ 100 fps
Vega M GL / 870:
53 54 55 [X] Dell XPS 15 9575 FY00N Intel Core i7-8705G 3.1GHz
Vega M GL / 870
~ 54 fps
Vega M GL / 870:
16 16 [X] Dell XPS 15 9575 FY00N Intel Core i7-8705G 3.1GHz
Vega M GL / 870
~ 16 fps
100%
GeForce GTX 1650 (Desktop):
208 [X] Gainward GeForce GTX 1650 4 GB AMD Ryzen 7 2700X 3.7GHz
GeForce GTX 1650 (Desktop)
min:
190 fps, max:
229 fps
216 [X] AMD Ryzen 9 3900X 3.8GHz
GeForce GTX 1650 (Desktop)
min:
195 fps, max:
238 fps
~ 212 fps
55%
Vega M GL / 870:
116.6 fps
100%
GeForce GTX 1650 (Desktop):
128 [X] AMD Ryzen 9 3900X 3.8GHz
GeForce GTX 1650 (Desktop)
min:
116 fps, max:
143 fps
136 [X] Gainward GeForce GTX 1650 4 GB AMD Ryzen 7 2700X 3.7GHz
GeForce GTX 1650 (Desktop)
min:
124 fps, max:
146 fps
~ 132 fps
100%
GeForce GTX 1650 (Desktop):
70.1 [X] AMD Ryzen 9 3900X 3.8GHz
GeForce GTX 1650 (Desktop)
min:
63 fps, max:
78 fps
77 [X] Gainward GeForce GTX 1650 4 GB AMD Ryzen 7 2700X 3.7GHz
GeForce GTX 1650 (Desktop)
min:
67 fps, max:
82 fps
~ 74 fps
100%
GeForce GTX 1650 (Desktop):
40.4 [X] AMD Ryzen 9 3900X 3.8GHz
GeForce GTX 1650 (Desktop)
min:
35 fps, max:
46 fps
43 [X] Gainward GeForce GTX 1650 4 GB AMD Ryzen 7 2700X 3.7GHz
GeForce GTX 1650 (Desktop)
min:
37 fps, max:
47 fps
~ 42 fps
100%
GeForce GTX 1650 (Desktop):
23.6 [X] AMD Ryzen 9 3900X 3.8GHz
GeForce GTX 1650 (Desktop)
min:
20 fps, max:
28 fps
27.7 [X] Gainward GeForce GTX 1650 4 GB AMD Ryzen 7 2700X 3.7GHz
GeForce GTX 1650 (Desktop)
min:
25 fps, max:
30 fps
~ 26 fps
54%
Vega M GL / 870:
13 14.4 ~ 14 fps
100%
GeForce GTX 1650 (Desktop):
171 [X] Gainward GeForce GTX 1650 4 GB AMD Ryzen 7 2700X 3.7GHz
GeForce GTX 1650 (Desktop)
min:
2.7 fps, P1:
111 fps, max:
298 fps
fps
81%
Vega M GL / 870:
138.7 [X] Dell XPS 15 9575 FY00N Intel Core i7-8705G 3.1GHz
Vega M GL / 870
fps
96%
GeForce GTX 1650 Ti Max-Q:
156 [X] HP Envy 14-eb0010nr Intel Core i5-1135G7 2.4GHz
GeForce GTX 1650 Ti Max-Q
min:
4.62 fps, P1:
90.9 fps, max:
263 fps
167 171 ~ 165 fps
100%
GeForce GTX 1650 (Desktop):
165 [X] Gainward GeForce GTX 1650 4 GB AMD Ryzen 7 2700X 3.7GHz
GeForce GTX 1650 (Desktop)
min:
2.66 fps, P1:
111 fps, max:
284 fps
fps
79%
Vega M GL / 870:
130.8 [X] Dell XPS 15 9575 FY00N Intel Core i7-8705G 3.1GHz
Vega M GL / 870
fps
94%
GeForce GTX 1650 Ti Max-Q:
145 [X] HP Envy 14-eb0010nr Intel Core i5-1135G7 2.4GHz
GeForce GTX 1650 Ti Max-Q
min:
4.59 fps, P1:
83.3 fps, max:
250 fps
157 164 ~ 155 fps
100%
GeForce GTX 1650 (Desktop):
101 [X] Gainward GeForce GTX 1650 4 GB AMD Ryzen 7 2700X 3.7GHz
GeForce GTX 1650 (Desktop)
min:
2.98 fps, P1:
71.4 fps, max:
210 fps
fps
58%
Vega M GL / 870:
58.1 [X] Dell XPS 15 9575 FY00N Intel Core i7-8705G 3.1GHz
Vega M GL / 870
fps
83%
GeForce GTX 1650 Ti Max-Q:
73.2 88.1 [X] HP Envy 14-eb0010nr Intel Core i5-1135G7 2.4GHz
GeForce GTX 1650 Ti Max-Q
min:
15.1 fps, P1:
62.5 fps, max:
150 fps
91.5 ~ 84 fps
100%
GeForce GTX 1650 (Desktop):
48.5 [X] Gainward GeForce GTX 1650 4 GB AMD Ryzen 7 2700X 3.7GHz
GeForce GTX 1650 (Desktop)
min:
7.34 fps, P1:
33.3 fps, max:
86.5 fps
fps
49%
Vega M GL / 870:
24 [X] Dell XPS 15 9575 FY00N Intel Core i7-8705G 3.1GHz
Vega M GL / 870
fps
89%
GeForce GTX 1650 Ti Max-Q:
37.1 45.3 [X] HP Envy 14-eb0010nr Intel Core i5-1135G7 2.4GHz
GeForce GTX 1650 Ti Max-Q
min:
17.6 fps, P1:
29.4 fps, max:
102 fps
45.4 ~ 43 fps
GeForce GTX 1650 Ti Max-Q:
26 fps
100%
GeForce GTX 1650 (Desktop):
29.1 [X] Gainward GeForce GTX 1650 4 GB AMD Ryzen 7 2700X 3.7GHz
GeForce GTX 1650 (Desktop)
min:
2.55 fps, P1:
14.9 fps, max:
32.4 fps
fps
99%
Vega M GL / 870:
28.8 [X] Dell XPS 15 9575 FY00N Intel Core i7-8705G 3.1GHz
Vega M GL / 870
fps
85%
GeForce GTX 1650 Ti Max-Q:
24.8 fps
100%
GeForce GTX 1650 (Desktop):
200 [X] Gainward GeForce GTX 1650 4 GB AMD Ryzen 7 2700X 3.7GHz
GeForce GTX 1650 (Desktop)
min:
196 fps, max:
202 fps
fps
100%
GeForce GTX 1650 (Desktop):
200 [X] Gainward GeForce GTX 1650 4 GB AMD Ryzen 7 2700X 3.7GHz
GeForce GTX 1650 (Desktop)
min:
190 fps, max:
202 fps
fps
100%
GeForce GTX 1650 (Desktop):
193 [X] Gainward GeForce GTX 1650 4 GB AMD Ryzen 7 2700X 3.7GHz
GeForce GTX 1650 (Desktop)
min:
182 fps, max:
201 fps
fps
100%
GeForce GTX 1650 (Desktop):
84 [X] Gainward GeForce GTX 1650 4 GB AMD Ryzen 7 2700X 3.7GHz
GeForce GTX 1650 (Desktop)
min:
77 fps, max:
102 fps
fps
100%
GeForce GTX 1650 (Desktop):
41.3 [X] Gainward GeForce GTX 1650 4 GB AMD Ryzen 7 2700X 3.7GHz
GeForce GTX 1650 (Desktop)
min:
37 fps, max:
48 fps
fps
Vega M GL / 870:
105.8 fps
Vega M GL / 870:
148 152 157 161 166.7 [X] Dell XPS 15 9575 FY00N Intel Core i7-8705G 3.1GHz
Vega M GL / 870
~ 157 fps
Vega M GL / 870:
51.7 51.7 52.5 59.8 60.2 [X] Dell XPS 15 9575 FY00N Intel Core i7-8705G 3.1GHz
Vega M GL / 870
~ 55 fps
Average Gaming NVIDIA GeForce GTX 1650 (Desktop) → 100% Average Gaming 30-70 fps → 100%
Average Gaming AMD Radeon RX Vega M GL / 870 → 63% Average Gaming 30-70 fps → 63%
Average Gaming NVIDIA GeForce GTX 1650 Ti Max-Q → 89% Average Gaming 30-70 fps → 86%
 Deutsch
 English
 Español
 Français
 Italiano
 Nederlands
 Polski
 Português
 Русский
 Türkçe
 Svenska
 Chinese
 Magyar