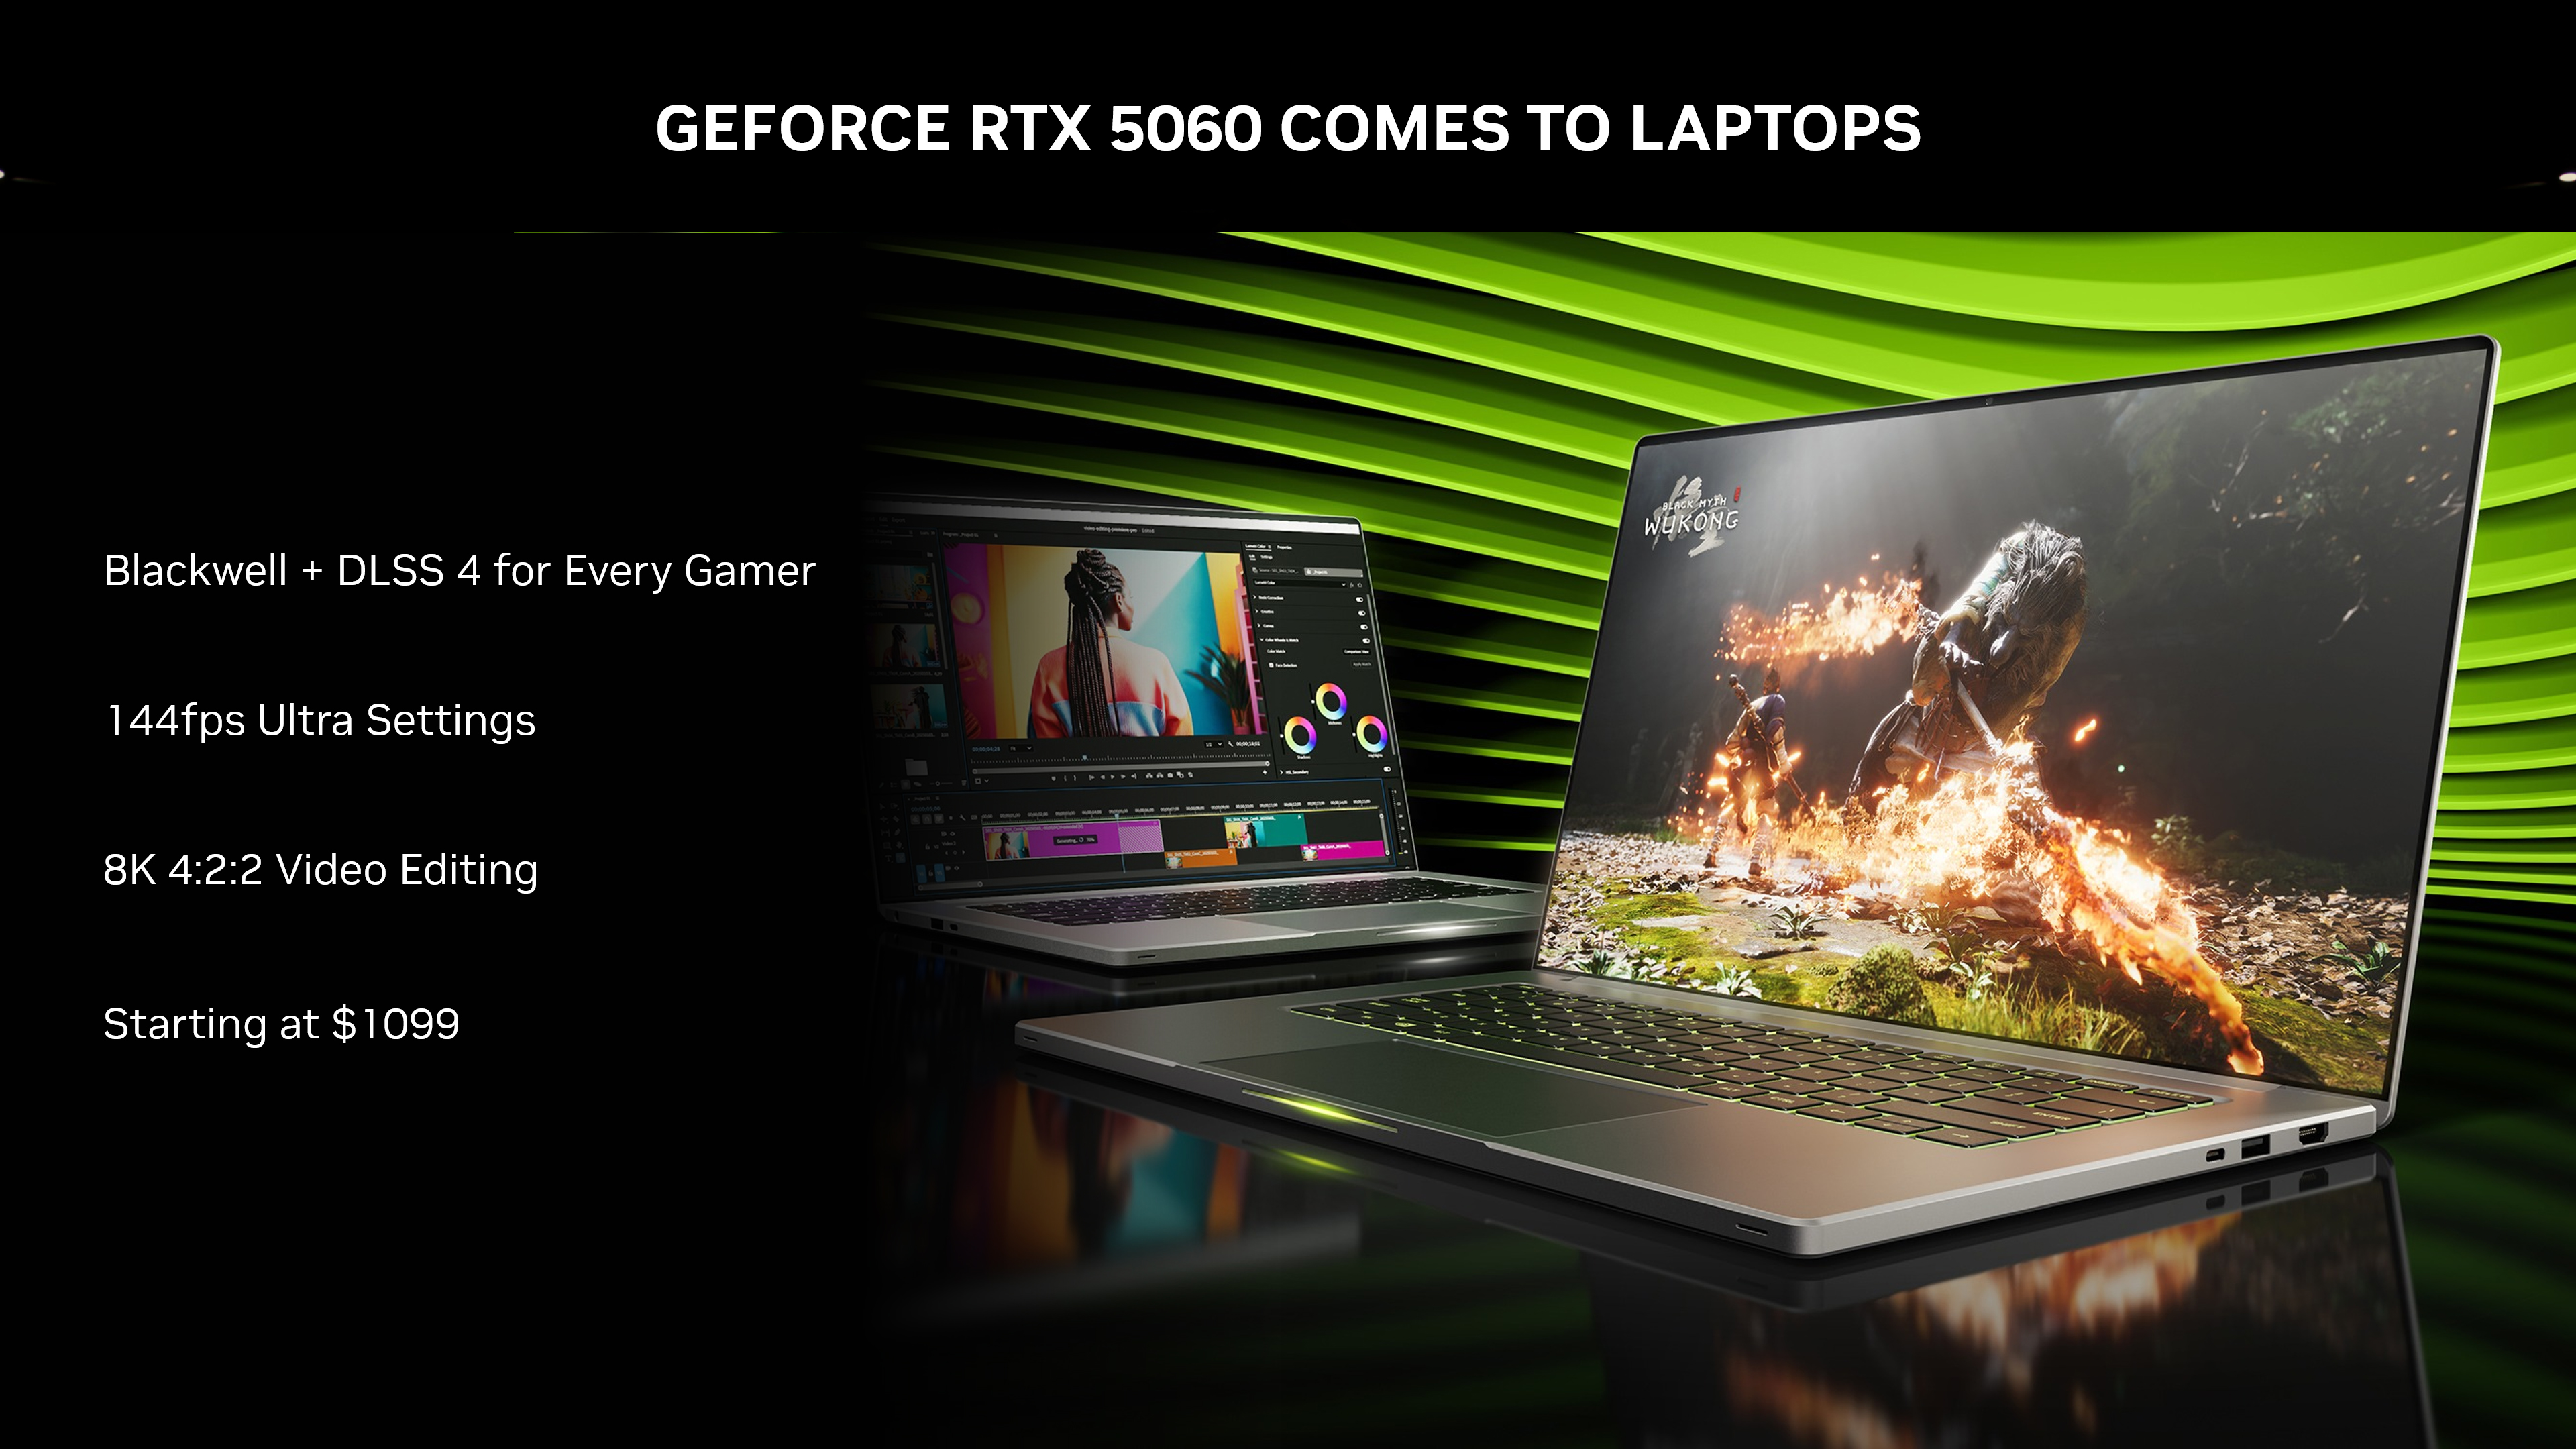
Nvidia GeForce RTX 5060 Laptop ► remove from comparison The Nvidia GeForce RTX 5060 Laptop is a mobile graphics card from the Blackwell family for laptops, which Team Green presented in April 2025 and became available in May. It is based on the GB206 chip and offers 3328 shader / CUDA cores, 104 tensor cores and 26 ray tracing units. The 8 GB GDDR7 graphics memory is connected via a 128-bit memory bus. Other features of the GPU include native PCIe 5 support, DisplayPort 2.1a, DirectX 12_2 Ultimate and support for DLSS4 and Reflex 2.
Performance
As always, the performance depends on the cooling and the maximum power consumption (TGP) of the RTX 5060 Laptop. In synthetic benchmarks, the new card is just ahead of the old RTX 4070 Laptop GPU in synthetic benchmarks. In our gaming tests, however, the mobile RTX 4070 is still slightly faster. As a result, the GPU is recommended for QHD gaming with maximum settings and DLSS or slightly reduced detail level in demanding games (such as F1 25).
Power consumption
The chip can be configured from 45 to 100 watts TGP and can be clocked differently accordingly. With 45 watts TGP, for example, the GP clocks from 952 - 1455 MHz, at the full 100 watts with 1950 - 2310 MHz.
The chip is produced in the 5nm process at TSMC (4N FinFET).
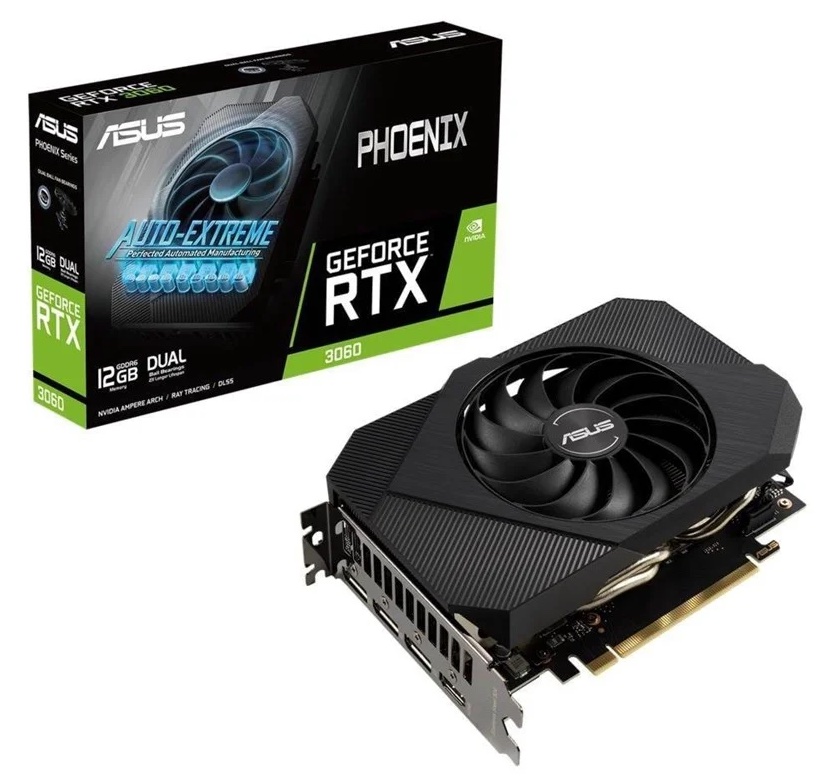
NVIDIA GeForce RTX 3060 ► remove from comparison The Nvidia GeForce RTX 3060 is a fast desktop graphics card. It is based on the GA106 Ampere chip and offers 12 GB GDDR6 graphics memory with a 192 Bit memory bus. It offers 3,584 cores and supports PCIe 4.0.
The performance is similar to the older GeForce RTX 2070 and therefore best suited for 1080p gaming of modern and demanding games in high settings.
The GA106 chip offers 3,840 FP32 ALUs of which half can also execute INT32 instructions (i.e. 1,920 INT32 ALUs). With Turing all shaders could still execute FP32 or INT32 instructions. The raytracing and tensor cores on the chip were also improved according to Nvidia. The Ampere chips also include an improved 5th generation video encoder (NVENC for H.264 and H.265) and a 7th generation decoder (for various formats now including AV1).
The GA106 chip is manufactured by Samsung in 8nm (8N), which is not quite able to keep up with the 7nm node at TSMC (e.g. used by AMD and also for the professional GA100 Ampere chip). The TDP of the RTX 3060 is specified at 170 Watt and therefore slightly higher than the previous RTX 2060 (160 Watt).
Nvidia GeForce RTX 5060 Laptop NVIDIA GeForce RTX 3060 GeForce RTX 3000 Series Codename GN22-X4 Ampere GA106 Architecture Blackwell Ampere Pipelines 3328 - unified 3584 - unified TMUs 104 112 ROPs 48 48 Raytracing Cores 26 28 Tensor / AI Cores 104 112 Core Speed 952 - 1455 (Boost) MHz 1320 - 1777 (Boost) MHz Theoretical Performance 9.684 TFLOPS FP16, 9.684 TFLOPS FP32 Cache L1: 3.3 MB, L2: 32 MB Memory Speed 24000 effective = 1500 MHz 15000 effective = 1875 MHz Memory Bus Width 128 Bit 192 Bit Memory Type GDDR7 GDDR6 Max. Amount of Memory 8 GB 12 GB Shared Memory no no Memory Bandwidth 384 GB/s 360 GB/s API DirectX 12_2, Shader 6.8, OpenGL 4.6, OpenCL 3.0, Vulkan 1.4 DirectX 12_2, Shader 6.6, OpenGL 4.6 Power Consumption 100 Watt (45 - 100 Watt TGP) 170 Watt Transistors 21.9 Billion 12 Billion Die Size 181 mm² 13250 mm² technology 5 nm 8 nm PCIe 5 4.0 Displays 4 Displays (max.), DisplayPort 2.1a HDMI 2.1, DisplayPort 1.4a Features DLSS4, Reflex 2, CUDA 12.8 NVIDIA DLSS, NVIDIA Reflex, Resizable BAR, NVIDIA Broadcast, NVIDIA Ansel, NVIDIA ShadowPlay®, NVIDIA G-SYNC®, VR-ready, Nvidia Omniverse Notebook Size medium sized Date of Announcement 02.01.2025 12.01.2021 Link to Manufacturer Page www.nvidia.com www.nvidia.com Predecessor NVIDIA GeForce RTX 4060 Laptop GPU
Performance Rating - 3DMark 11 + Fire Strike + Time Spy - GeForce RTX 5060 Laptop
...
Nvidia GeForce RTX 5060 Laptop
max:
Performance Rating - 3DMark 11 + Fire Strike + Time Spy - NVIDIA GeForce RTX 3060
3DMark - 3DMark Speed Way Score
min: 2585 avg: 2785 median: 2785 (19%) max: 2985 Points
GPU TDP 80 W TDP 115 W 87% 100%
min: 2216 avg: 2221 median: 2220.5 (15%) max: 2225 Points
GPU TDP 80 W TDP 115 W TDP 170 W 87% 100% 74%
3DMark - 3DMark Steel Nomad
min: 2072 avg: 2533 median: 2575 (18%) max: 2806 Points
GPU TDP ? TDP 80 W TDP 95 W TDP 115 W 94% 76% 93% 100%
min: 1989 avg: 2038 median: 1995 (14%) max: 2131 Points
GPU TDP ? TDP 80 W TDP 95 W TDP 115 W TDP 170 W 94% 76% 93% 100% 74%
3DMark - 3DMark Steel Nomad Light
min: 11681 avg: 11994 median: 11994 (27%) max: 12307 Points
GPU TDP ? TDP 115 W 95% 100%
3DMark - 3DMark Wild Life Extreme Unlimited
3DMark - 3DMark Solar Bay
3DMark - 3DMark Fire Strike Standard Score
min: 24120 avg: 27934 median: 28344 (43%) max: 31650 Points
GPU TDP ? TDP 80 W TDP 95 W TDP 115 W 91% 83% 97% 100%
min: 15750 avg: 19730 median: 20911 (32%) max: 21586 Points
GPU TDP ? TDP 80 W TDP 95 W TDP 115 W TDP 170 W 78% 83% 97% 100% 66%
3DMark - 3DMark Fire Strike Standard Graphics
min: 29011 avg: 31751 median: 33000 (30%) max: 33912 Points
GPU TDP ? TDP 80 W TDP 95 W TDP 115 W 89% 89% 100% 100%
min: 18711 avg: 21264 median: 21689 (20%) max: 22327 Points
GPU TDP ? TDP 80 W TDP 95 W TDP 115 W TDP 170 W 75% 89% 100% 100% 64%
3DMark - 3DMark Ice Storm Graphics
min: 326331 avg: 427886 median: 438544 (49%) max: 490039 Points
GPU TDP ? TDP 115 W TDP 170 W 100% 59% 95%
3DMark - 3DMark Time Spy Score
min: 10688 avg: 11818 median: 11854 (32%) max: 12787 Points
GPU TDP ? TDP 80 W TDP 95 W TDP 115 W 100% 89% 99% 100%
min: 7303 avg: 8886 median: 9026 (24%) max: 9782 Points
GPU TDP ? TDP 80 W TDP 95 W TDP 115 W TDP 170 W 89% 90% 99% 100% 74%
3DMark - 3DMark Time Spy Graphics
min: 10262 avg: 11777 median: 12093.5 (25%) max: 12322 Points
GPU TDP ? TDP 80 W TDP 95 W TDP 115 W 95% 84% 100% 99%
min: 7866 avg: 8558 median: 8578 (17%) max: 8897 Points
GPU TDP ? TDP 80 W TDP 95 W TDP 115 W TDP 170 W 83% 84% 100% 99% 70%
3DMark - 3DMark Ice Storm Unlimited Graphics
min: 478217 avg: 612349 median: 561364 (57%) max: 806680 Points
GPU TDP ? TDP 170 W 83% 100%
3DMark - 3DMark Ice Storm Extreme Graphics
min: 289413 avg: 358304 median: 356550 (42%) max: 419899 Points
GPU TDP ? TDP 170 W 100% 97%
3DMark - 3DMark Cloud Gate Score
min: 50015 avg: 58051 median: 56116.5 (53%) max: 69955 Points
min: 31438 avg: 56666 median: 56566 (53%) max: 72456 Points
GPU TDP ? TDP 115 W TDP 170 W 99% 100% 97%
3DMark - 3DMark Cloud Gate Graphics
min: 86886 avg: 132394 median: 144500 (36%) max: 153691 Points
min: 96330 avg: 118306 median: 120756 (30%) max: 124830 Points
GPU TDP ? TDP 115 W TDP 170 W 91% 100% 88%
3DMark - 3DMark Night Raid
min: 52521 avg: 62142 median: 65191 (62%) max: 68715 Points
3DMark - 3DMark Night Raid Graphics Score
min: 96914 avg: 102366 median: 104641 (40%) max: 105543 Points
3DMark 11 - 3DM11 Performance Score
min: 30945 avg: 33066 median: 33080 (40%) max: 35012 Points
GPU TDP ? TDP 80 W TDP 115 W 100% 96% 97%
min: 18861 avg: 26026 median: 26986 (33%) max: 30325 Points
GPU TDP ? TDP 80 W TDP 115 W TDP 170 W 85% 99% 100% 79%
3DMark 11 - 3DM11 Performance GPU
min: 36253 avg: 39289 median: 39428 (30%) max: 41490 Points
GPU TDP ? TDP 80 W TDP 115 W 99% 91% 100%
min: 24369 avg: 28359 median: 28939 (22%) max: 29959 Points
GPU TDP ? TDP 80 W TDP 115 W TDP 170 W 78% 91% 100% 71%
3DMark Vantage + Nvidia GeForce RTX 5060 Laptop 3DMark Vantage - 3DM Vant. Perf. total
3DM Vant. Perf. total + NVIDIA GeForce RTX 3060 min: 75053 avg: 83745 median: 81033 (23%) max: 100659 Points
GPU TDP ? TDP 115 W TDP 170 W 89% 91% 100%
3DM Vant. Perf. GPU no PhysX + Nvidia GeForce RTX 5060 Laptop 3DMark Vantage - 3DM Vant. Perf. GPU no PhysX
3DM Vant. Perf. GPU no PhysX + NVIDIA GeForce RTX 3060 min: 77510 avg: 85087 median: 83168 (45%) max: 98243 Points
GPU TDP ? TDP 115 W TDP 170 W 90% 93% 100%
3DMark 05 - 3DMark 05 - Standard
min: 48871 avg: 65489 median: 62529 (68%) max: 84989 Points
GPU TDP ? TDP 170 W 96% 100%
3DMark 06 3DMark 06 - Standard 1280x1024 + Nvidia GeForce RTX 5060 Laptop 3DMark 06 - Standard 1280x1024 + NVIDIA GeForce RTX 3060 min: 47148 avg: 54815 median: 51633 (67%) max: 66584 Points
GPU TDP ? TDP 115 W TDP 170 W 88% 92% 100%
Unigine Valley 1.0 - Unigine Valley 1.0 DX
min: 105.1 avg: 106.9 median: 106.7 (32%) max: 108.3 fps
GPU TDP ? TDP 170 W 100% 100%
Blender - Blender 3.3 Classroom CUDA *
min: 38 avg: 39.3 median: 38 (6%) max: 42 Seconds
GPU TDP ? TDP 80 W TDP 115 W 100% 100% 101%
min: 56 avg: 57 median: 57 (8%) max: 58 Seconds
GPU TDP ? TDP 80 W TDP 115 W TDP 170 W 103% 102% 103% 100%
Blender - Blender 3.3 Classroom OPTIX *
min: 21 avg: 22.1 median: 21 (8%) max: 25 Seconds
GPU TDP ? TDP 80 W TDP 115 W 101% 100% 101%
min: 31 avg: 32 median: 32 (12%) max: 33 Seconds
GPU TDP ? TDP 80 W TDP 115 W TDP 170 W 104% 103% 104% 100%
SPECviewperf 12 + NVIDIA GeForce RTX 3060 SPECviewperf 12 - specvp12 sw-03
min: 47.8 avg: 65.3 median: 69.3 (17%) max: 75.9 fps
GPU TDP ? TDP 170 W 100% 99%
specvp12 snx-02 + NVIDIA GeForce RTX 3060 SPECviewperf 12 - specvp12 snx-02
min: 7.39 avg: 9 median: 8.9 (1%) max: 10.4 fps
GPU TDP ? TDP 170 W 100% 97%
specvp12 showcase-01 + NVIDIA GeForce RTX 3060 SPECviewperf 12 - specvp12 showcase-01
min: 72.6 avg: 108.4 median: 114.5 (20%) max: 119 fps
GPU TDP ? TDP 170 W 100% 88%
specvp12 mediacal-01 + NVIDIA GeForce RTX 3060 SPECviewperf 12 - specvp12 mediacal-01
min: 24.9 avg: 44.6 median: 43 (11%) max: 71.2 fps
GPU TDP ? TDP 170 W 95% 100%
specvp12 maya-04 + NVIDIA GeForce RTX 3060 SPECviewperf 12 - specvp12 maya-04
min: 66 avg: 167.5 median: 183 (50%) max: 204 fps
GPU TDP ? TDP 170 W 100% 85%
specvp12 energy-01 + NVIDIA GeForce RTX 3060 SPECviewperf 12 - specvp12 energy-01
min: 8.21 avg: 9.9 median: 10.1 (9%) max: 10.7 fps
GPU TDP ? TDP 170 W 100% 94%
specvp12 creo-01 + NVIDIA GeForce RTX 3060 SPECviewperf 12 - specvp12 creo-01
min: 45.4 avg: 52 median: 51.3 (21%) max: 57.9 fps
GPU TDP ? TDP 170 W 100% 96%
specvp12 catia-04 + NVIDIA GeForce RTX 3060 SPECviewperf 12 - specvp12 catia-04
min: 63.1 avg: 75.1 median: 75.8 (13%) max: 84.5 fps
GPU TDP ? TDP 170 W 100% 99%
specvp12 3dsmax-05 + NVIDIA GeForce RTX 3060 SPECviewperf 12 - specvp12 3dsmax-05
min: 98 avg: 192 median: 207.5 (31%) max: 225 fps
GPU TDP ? TDP 170 W 100% 83%
SPECviewperf 13 specvp13 sw-04 + NVIDIA GeForce RTX 3060 SPECviewperf 13 - specvp13 sw-04
min: 73.2 avg: 96.5 median: 102 (27%) max: 110 fps
GPU TDP ? TDP 170 W 100% 98%
specvp13 snx-03 + NVIDIA GeForce RTX 3060 SPECviewperf 13 - specvp13 snx-03
min: 13.4 avg: 16.3 median: 16 (2%) max: 18.8 fps
GPU TDP ? TDP 170 W 100% 97%
specvp13 showcase-02 + NVIDIA GeForce RTX 3060 SPECviewperf 13 - specvp13 showcase-02
min: 72.9 avg: 108.3 median: 114.5 (20%) max: 118 fps
GPU TDP ? TDP 170 W 100% 88%
specvp13 medical-02 + NVIDIA GeForce RTX 3060 SPECviewperf 13 - specvp13 medical-02
min: 44.9 avg: 52.8 median: 54.7 (9%) max: 55.7 fps
GPU TDP ? TDP 170 W 100% 91%
specvp13 maya-05 + NVIDIA GeForce RTX 3060 SPECviewperf 13 - specvp13 maya-05
min: 141 avg: 249 median: 264 (30%) max: 283 fps
GPU TDP ? TDP 170 W 100% 85%
specvp13 energy-02 + NVIDIA GeForce RTX 3060 SPECviewperf 13 - specvp13 energy-02
min: 13.1 avg: 14.3 median: 13.7 (4%) max: 18 fps
GPU TDP ? TDP 170 W 92% 100%
specvp13 creo-02 + NVIDIA GeForce RTX 3060 SPECviewperf 13 - specvp13 creo-02
min: 111 avg: 172.2 median: 181.5 (27%) max: 196 fps
GPU TDP ? TDP 170 W 100% 86%
specvp13 catia-05 + NVIDIA GeForce RTX 3060 SPECviewperf 13 - specvp13 catia-05
min: 92.9 avg: 105.7 median: 106.5 (12%) max: 115 fps
GPU TDP ? TDP 170 W 100% 97%
specvp13 3dsmax-06 + NVIDIA GeForce RTX 3060 SPECviewperf 13 - specvp13 3dsmax-06
min: 97.7 avg: 191.1 median: 204.5 (32%) max: 229 fps
GPU TDP ? TDP 170 W 100% 86%
SPECviewperf 2020 specvp2020 snx-04 1080p + NVIDIA GeForce RTX 3060 SPECviewperf 2020 - specvp2020 snx-04 1080p
specvp2020 medical-03 1080p + NVIDIA GeForce RTX 3060 SPECviewperf 2020 - specvp2020 medical-03 1080p
specvp2020 maya-06 1080p + NVIDIA GeForce RTX 3060 SPECviewperf 2020 - specvp2020 maya-06 1080p
specvp2020 energy-03 1080p + NVIDIA GeForce RTX 3060 SPECviewperf 2020 - specvp2020 energy-03 1080p
specvp2020 creo-03 1080p + NVIDIA GeForce RTX 3060 SPECviewperf 2020 - specvp2020 creo-03 1080p
specvp2020 catia-06 1080p + NVIDIA GeForce RTX 3060 SPECviewperf 2020 - specvp2020 catia-06 1080p
specvp2020 3dsmax-07 1080p + NVIDIA GeForce RTX 3060 SPECviewperf 2020 - specvp2020 3dsmax-07 1080p
specvp2020 solidworks-05 4k + NVIDIA GeForce RTX 3060 SPECviewperf 2020 - specvp2020 solidworks-05 4k
min: 79.7 avg: 86 median: 81.7 (20%) max: 105 fps
GPU TDP ? TDP 170 W 88% 100%
specvp2020 snx-04 4k + NVIDIA GeForce RTX 3060 SPECviewperf 2020 - specvp2020 snx-04 4k
min: 12.4 avg: 13.1 median: 12.9 (1%) max: 14.3 fps
GPU TDP ? TDP 170 W 96% 100%
specvp2020 medical-03 4k + NVIDIA GeForce RTX 3060 SPECviewperf 2020 - specvp2020 medical-03 4k
min: 8.39 avg: 11 median: 8.5 (5%) max: 22.2 fps
GPU TDP ? TDP 170 W 63% 100%
specvp2020 maya-06 4k + NVIDIA GeForce RTX 3060 SPECviewperf 2020 - specvp2020 maya-06 4k
min: 141 avg: 160 median: 162.5 (23%) max: 171 fps
GPU TDP ? TDP 170 W 100% 96%
specvp2020 energy-03 4k + NVIDIA GeForce RTX 3060 SPECviewperf 2020 - specvp2020 energy-03 4k
min: 13.1 avg: 22.4 median: 15.3 (3%) max: 38.2 fps
GPU TDP ? TDP 170 W 100% 95%
specvp2020 creo-03 4k + NVIDIA GeForce RTX 3060 SPECviewperf 2020 - specvp2020 creo-03 4k
min: 64 avg: 68.8 median: 68 (30%) max: 75.5 fps
GPU TDP ? TDP 170 W 99% 100%
specvp2020 catia-06 4k + NVIDIA GeForce RTX 3060 SPECviewperf 2020 - specvp2020 catia-06 4k
min: 17.5 avg: 26.9 median: 28.4 (19%) max: 29.6 fps
GPU TDP ? TDP 170 W 100% 88%
specvp2020 3dsmax-07 4k + NVIDIA GeForce RTX 3060 SPECviewperf 2020 - specvp2020 3dsmax-07 4k
min: 64.8 avg: 66.7 median: 65.7 (22%) max: 72.5 fps
GPU TDP ? TDP 170 W 97% 100%
Cinebench R10 Cinebench R10 Shading (32bit) + Nvidia GeForce RTX 5060 Laptop Cinebench R10 - Cinebench R10 Shading (32bit)
Cinebench R10 Shading (32bit) + NVIDIA GeForce RTX 3060 min: 6811 avg: 13079 median: 13079 (9%) max: 19347 Points
GPU TDP ? TDP 115 W TDP 170 W 100% 75% 35%
Cinebench R11.5 Cinebench R11.5 OpenGL 64 Bit + Nvidia GeForce RTX 5060 Laptop Cinebench R11.5 - Cinebench R11.5 OpenGL 64 Bit
Cinebench R11.5 OpenGL 64 Bit + NVIDIA GeForce RTX 3060 GPU TDP 115 W TDP 170 W 65% 100%
Cinebench R15 + Nvidia GeForce RTX 5060 Laptop Cinebench R15 - Cinebench R15 OpenGL 64 Bit
min: 188.3 avg: 242.2 median: 248 (14%) max: 288 fps
GPU TDP ? TDP 80 W TDP 115 W 100% 86% 91%
Cinebench R15 OpenGL 64 Bit + NVIDIA GeForce RTX 3060 GPU TDP ? TDP 80 W TDP 115 W TDP 170 W 100% 86% 91% 93%
Cinebench R15 OpenGL Ref. Match 64 Bit + Nvidia GeForce RTX 5060 Laptop Cinebench R15 - Cinebench R15 OpenGL Ref. Match 64 Bit
GPU TDP ? TDP 80 W TDP 115 W 100% 100% 100%
Cinebench R15 OpenGL Ref. Match 64 Bit + NVIDIA GeForce RTX 3060 GPU TDP ? TDP 80 W TDP 115 W TDP 170 W 100% 100% 100% 100%
GFXBench - GFXBench 5.0 4K Aztec Ruins High Tier Offscreen
GFXBench - GFXBench 5.0 Aztec Ruins High Tier Offscreen
GFXBench - GFXBench 5.0 Aztec Ruins Normal Tier Offscreen
Basemark GPU 1.2 - Basemark GPU 1.2 Vulkan Official Medium Offscreen 1080
min: 37.8 avg: 163.6 median: 104.6 (3%) max: 315 fps
GPU TDP ? TDP 80 W TDP 115 W 100% 12% 50%
GPU TDP ? TDP 80 W TDP 115 W TDP 170 W 32% 4% 16% 100%
Basemark GPU 1.2 - Basemark GPU 1.2 Vulkan Official High Offscreen 2160
GPU TDP 80 W TDP 115 W 100% 100%
GPU TDP 80 W TDP 115 W TDP 170 W 4% 4% 100%
Geekbench 6.5 - Geekbench 6.5 GPU OpenCL
min: 104228 avg: 107373 median: 105441 (27%) max: 116422 Points
GPU TDP ? TDP 80 W TDP 115 W 97% 97% 100%
min: 90892 avg: 94285 median: 94284.5 (25%) max: 97677 Points
GPU TDP ? TDP 80 W TDP 115 W TDP 170 W 97% 97% 100% 87%
Geekbench 6.5 - Geekbench 6.5 GPU Vulkan
min: 15405 avg: 49180 median: 32040 (8%) max: 104897 Points
GPU TDP ? TDP 80 W TDP 115 W 55% 25% 100%
GPU TDP ? TDP 80 W TDP 115 W TDP 170 W 38% 17% 69% 100%
LuxMark v2.0 64Bit - LuxMark v2.0 Room GPU
min: 1647 avg: 2044 median: 1849.5 (7%) max: 2954 Samples/s
GPU TDP ? TDP 115 W TDP 170 W 29% 100% 37%
LuxMark v2.0 64Bit - LuxMark v2.0 Sala GPU
min: 6513 avg: 7115 median: 6856 (12%) max: 7996 Samples/s
GPU TDP ? TDP 115 W TDP 170 W 55% 100% 55%
ComputeMark v2.1 - ComputeMark v2.1 Result
min: 19540 avg: 20361 median: 20449.5 (17%) max: 20905 Points
GPU TDP ? TDP 115 W TDP 170 W 82% 100% 82%
Power Consumption - Furmark Stress Test Power Consumption - external Monitor *
min: 61.5 avg: 129.9 median: 138.8 (19%) max: 173.5 Watt
GPU TDP ? TDP 80 W TDP 115 W 100% 106% 101%
min: 252.8 avg: 324.5 median: 296.1 (40%) max: 453 Watt
GPU TDP ? TDP 80 W TDP 115 W TDP 170 W 100% 144% 137% 106%
Power Consumption - The Witcher 3 Power Consumption - external Monitor *
min: 229.9 avg: 276.1 median: 283.5 (40%) max: 307.5 Watt
GPU TDP ? TDP 170 W 100% 107%
Power Consumption - Power Efficiency - Witcher 3 ultra external Monitor
min: 0.2059 avg: 0.3 median: 0.3 (27%) max: 0.332 fps per Watt
GPU TDP ? TDP 170 W 82% 100%
Power Consumption - Cyberpunk 2077 Power Consumption 150cd *
min: 123 avg: 163.5 median: 162.6 (45%) max: 192 Watt
GPU TDP ? TDP 80 W TDP 115 W 108% 127% 100%
Power Consumption - Cyberpunk 2077 Power Consumption - external Monitor *
min: 120.6 avg: 158.5 median: 164.5 (21%) max: 187.5 Watt
GPU TDP ? TDP 80 W TDP 115 W 102% 107% 100%
GPU TDP ? TDP 80 W TDP 115 W TDP 170 W 133% 141% 131% 100%
Power Consumption - Power Efficiency - Cyberpunk 2077 ultra
min: 0.4582 avg: 0.5 median: 0.5 (2%) max: 0.529 fps per Watt
GPU TDP ? TDP 115 W 100% 99%
Average Benchmarks Nvidia GeForce RTX 5060 Laptop → 100% n=27 Average Benchmarks NVIDIA GeForce RTX 3060 → 219% n=27
- Range of benchmark values for this graphics card
- Average benchmark values for this graphics card
* Smaller numbers mean a higher performance
1 This benchmark is not used for the average calculation
The following benchmarks stem from our benchmarks of review laptops. The performance depends on the used graphics memory, clock rate, processor, system settings, drivers, and operating systems. So the results don't have to be representative for all laptops with this GPU. For detailed information on the benchmark results, click on the fps number.
Nvidia GeForce RTX 5060 Laptop NVIDIA GeForce RTX 3060 low med. high ultra QHD 4K low med. high ultra QHD 4K Borderlands 4 42.8 34.7 28.7 21.2 11.5 42.5 34.6 26.8 19.6 F1 25 195 174 155 22 11 228 183 138 12 7 3 Doom: The Dark Ages 64 58 57 37 61.7 54.1 49.8 47.9 32 The Elder Scrolls IV Oblivion Remastered 64 52 28 13 107.8 70.1 47 26.6 18 Assassin's Creed Shadows 59 55 48 35 28 14 47 40 32 23 19 Civilization 7 163.1 148.6 96 274 192.8 116.6 69.8 32.9 Monster Hunter Wilds 65 57 25 16 10.6 61.7 50.5 38.4 29.3 17.3 Kingdom Come Deliverance 2 105 86 61 45 111.2 82 67 48 34.4 19.5 Indiana Jones and the Great Circle 115 59 12 8 5.3 97 67 60 46 27 Stalker 2 57 50 43 32 64 56 47 39 28 16 Call of Duty Black Ops 6 144 131 93 84 64 114 104 69 65 48 30 Until Dawn 84 64 49 34 119 78 52 37 26 15 Space Marine 2 72 72 71 55 96 78 75 67 46 24 Star Wars Outlaws 49 45 38 27 49 45 39 32 22 13 Black Myth: Wukong 92 68 53 30 21 9 75 56 42 22 17 9 F1 24 238 230 198 66 40 10.7 283 248 179 57 37 18 Senua's Saga Hellblade 2 55 40 29 Ghost of Tsushima 83 75 60 46 Horizon Forbidden West 86 60 56 48 Alan Wake 2 73 66 61 36 12.1 54.1 36.2 18 Cyberpunk 2077 2.2 Phantom Liberty 135 112 96 86 54 21.5 128 98 83 72 42 18 Baldur's Gate 3 155 125 107 101 70 34.8 131 100 86.7 85 59 31 Strange Brigade 475 304 250 221 154 78 432 214 171 149 115 67 X-Plane 11.11 124 108 90 62.9 157 141 114 97 Final Fantasy XV Benchmark 216 155 120 89 45 194 121 88 66 39 Dota 2 Reborn 183 164 158 146 105.2 212 191 181 168 118 GTA V 185 180 174 124 105 90.2 180 176 165 97 81 82 Nvidia GeForce RTX 5060 Laptop NVIDIA GeForce RTX 3060 low med. high ultra QHD 4K low med. high ultra QHD 4K < 30 fps < 60 fps < 120 fps ≥ 120 fps 2 4 10 6 11 9 1 8 10 7 5 7 7 3 9 10 5 1 7 2 4 < 30 fps < 60 fps < 120 fps ≥ 120 fps 3 10 10 7 7 8 1 8 9 5 4 7 6 2 9 9 4 12 4 4
log 19. 05:12:41
#0 ran 0s before starting gpusingle class +0s ... 0s
#1 checking url part for id 12924 +0s ... 0s
#2 checking url part for id 10960 +0s ... 0s
#3 redirected to Ajax server, took 1760843561s time from redirect:0 +0s ... 0s
#4 did not recreate cache, as it is less than 5 days old! Created at Thu, 16 Oct 2025 05:22:23 +0200 +0s ... 0s
#5 composed specs +0.029s ... 0.029s
#6 did output specs +0s ... 0.029s
#7 start showIntegratedCPUs +0s ... 0.029s
#8 getting avg benchmarks for device 12924 +0.02s ... 0.049s
#9 got single benchmarks 12924 +0.017s ... 0.066s
#10 getting avg benchmarks for device 10960 +0.004s ... 0.07s
#11 got single benchmarks 10960 +0.012s ... 0.082s
#12 got avg benchmarks for devices +0s ... 0.082s
#13 min, max, avg, median took s +0.05s ... 0.131s
#14 before gaming benchmark output +0s ... 0.131s
#15 Got 1384 rows for game benchmarks. +0.055s ... 0.186s
#16 composed SQL query for gamebenchmarks +0s ... 0.186s
#17 got data and put it in $dataArray +0.009s ... 0.195s
#18 benchmarks composed for output. +0.034s ... 0.229s
#19 calculated avg scores. +0s ... 0.229s
#20 return log +0.003s ... 0.232s