NVIDIA GeForce GTX 1050 Ti (Desktop) vs Intel Iris Plus Graphics 655 vs NVIDIA GeForce GTX 1050 Ti Max-Q
NVIDIA GeForce GTX 1050 Ti (Desktop) ► remove from comparison
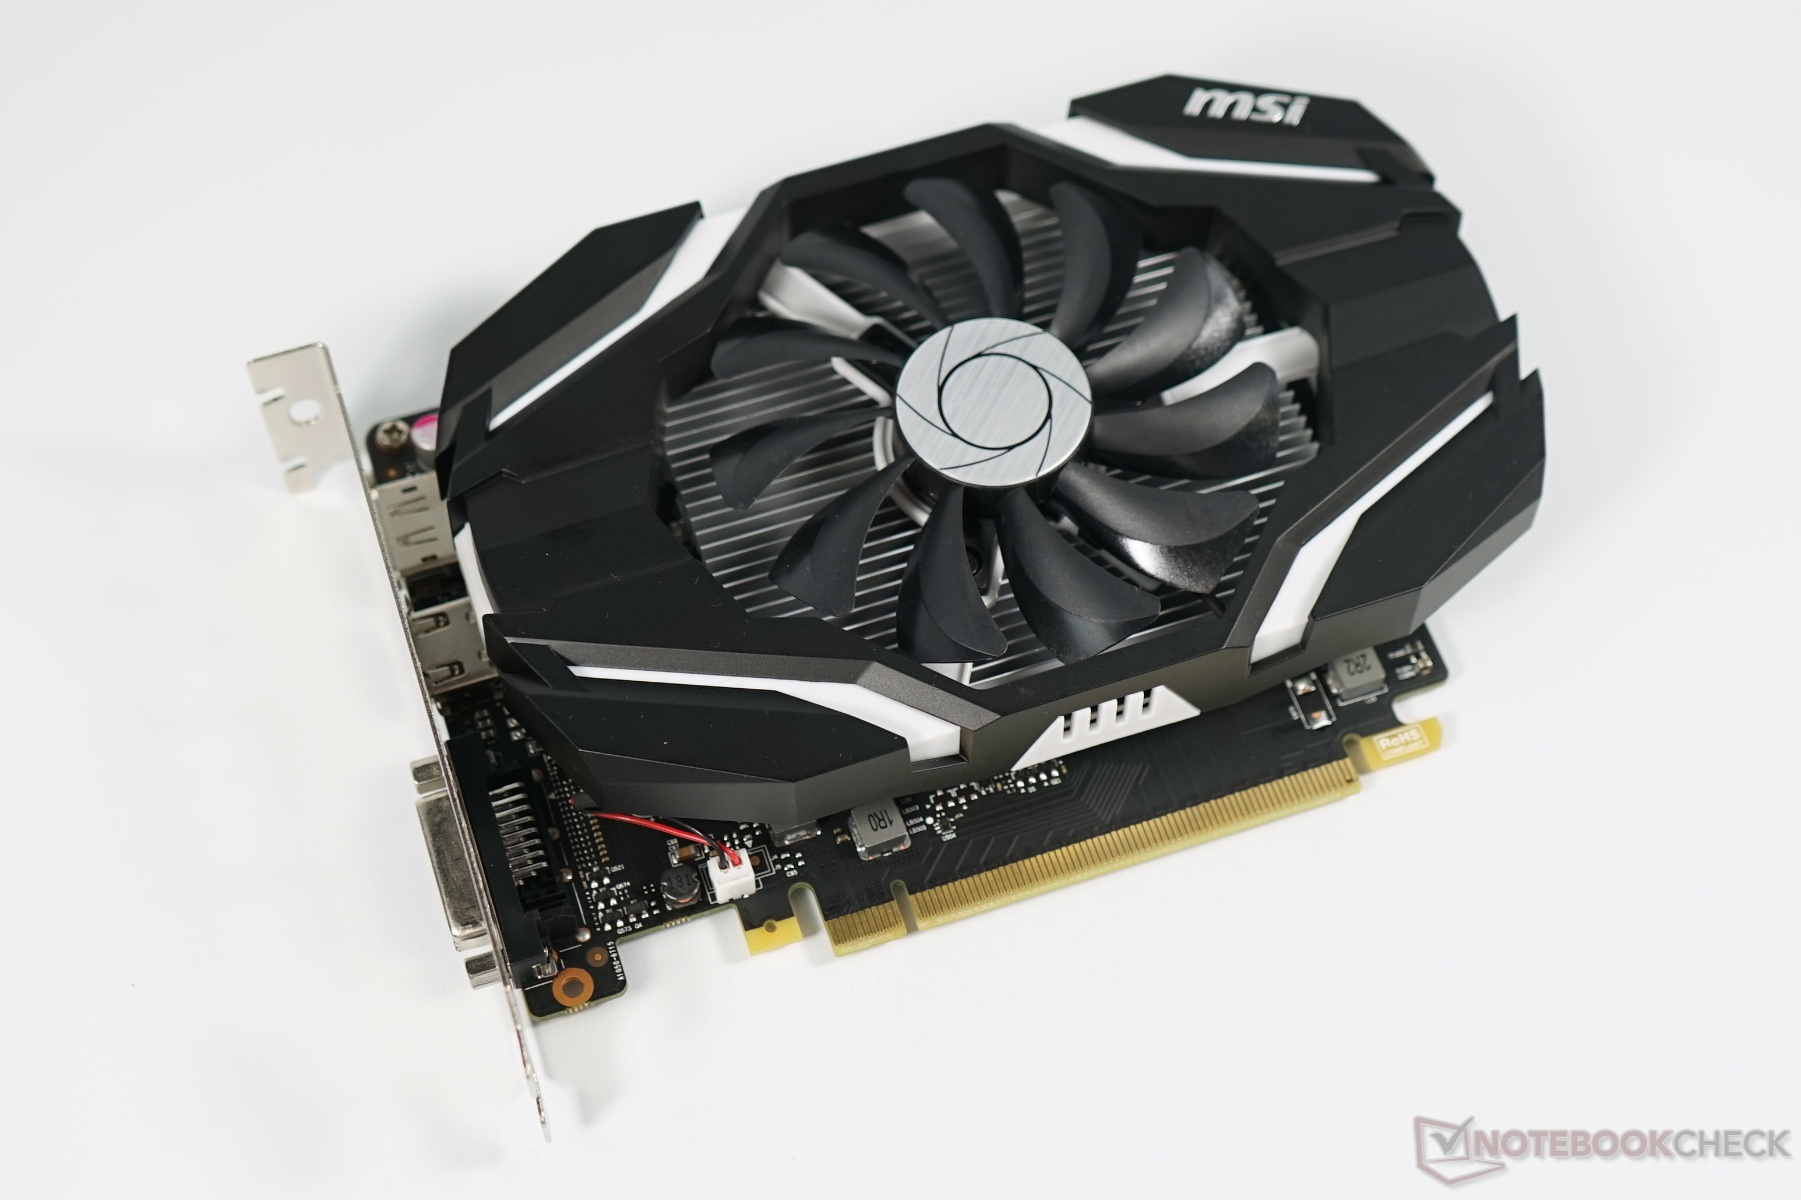
The Nvidia GeForce GTX 1050 Ti (N17P-G1) for desktops is an entry level gaming graphics card that was announced late 2016. It is based on the GP107 chip using the Pascal architecture and manufactured in 14nm FinFET at Samsung (the bigger Pascal chips are manufactured in 16nm at TSMC). Usually it is equipped with 4 GB GDDR5 memory with a 7 Gbps data rate. The mobile GTX 1050 Ti version should be announced later (beginning of 2017) and feature similar specs.
The performance of the GTX 1050 lies between the Radeon RX 460 and the RX 470 on a similar level of the old GeForce GTX 960 (or 970M ). Therefore, the card is most suited for 1080p gaming at high detail settings (but not maximum settings).
See our extensive review of the MSI GeForce GTX 1050 Ti for more information on power consumption, benchmarks and noise level.
Intel Iris Plus Graphics 655 ► remove from comparison
The Intel Iris Plus Graphics 655 (GT3e) is a processor graphics card announced in September 2017. As the successor to the Intel Iris Graphics 650 (Kaby Lake), the Iris Plus Graphics 655 is used for 28-Watt Coffee Lake-U models. The biggest difference is the doubled eDRAM-cache at 128 MB. There should not be any big changes compared to the Iris Graphics 650.
The so called GT3e version of the Kaby Lake GPU still has 48 Execution Units (EUs), which can reach up to 1200 MHz (previously 1100 MHz) depending on the model. Besides eDRAM cache, the Iris 655 can also access the system memory (2x 64 Bit DDR3L-2133/DDR4-2400) via processor interface.
Compared to the Iris Plus 640 from the 15-Watt models, the Iris 655 only has a slightly higher maximum clock as well as almost twice the TDP, which allows a better utilization of the Turbo Boost potential.
The exact performance of the Iris Plus Graphics 655 depends on the CPU model, because maximum clock as well as the size of the L3 cache can differ a bit. The system memory (DDR3/DDR4) will influence the performance as well.
The fastest chips are high-clocked Core i7 models like the Core i7-8559U. Depending on the game, the Iris Plus 655 will probably be on par with a dedicated GeForce 930M or GeForce 940MX and can handle smooth gameplay in modern titles in low up to medium settings.
The reworked video engine now fully supports hardware decoding of H.265/HEVC videos. Contrary to Skylake, however, Kaby Lake can now also decode H.265/HEVC Main 10 with a 10-bit color depth as well as Google's VP9 codec. The video output is possible via DP 1.2/eDP 1.3 (up to 3840 x 2160 @60 Hz), whereas HDMI is also supported in the older 1.4a standard. An HDMI 2.0 output can be added via converter from DisplayPort. The GPU can drive up to three displays simultaneously.
The Iris Plus Graphics 655 is used for 28-Watt processor and therefore small/medium-sized notebooks.
NVIDIA GeForce GTX 1050 Ti Max-Q ► remove from comparison
The Nvidia GTX 1050 Ti with Max-Q design is a power efficient mainstream GPU for laptops based on the Pascal architecture and was announced in January 2017. Contrary to the faster models, the GTX 1050 uses the GP107 chip, which is manufactured in a 14 nm process at Samsung.
The clock is not the only difference compared to the regular GTX 1050 Ti though. The drivers for the Max-Q version were optimized for efficiency (and not performance; only for Max-Q models), there are optimized voltage converters for 1V operation, high-end cooling methods, and a 40 dB limit for the fan noise (with clock adjustments to ensure this at all times).
Features
The GP107 chip is manufactured in a 14 nm FinFET process at Samsung and offers a number of new features, including support for DisplayPort 1.4 (ready), HDMI 2.0b, HDR, Simultaneous Multi-Projection (SMP) as well as improved H.265 video de- and encoding (PlayReady 3.0). A full list of improvements and the new Pascal desktop GPUs is available in our dedicated Pascal architecture article .
Performance
The performance of the GeForce GTX 1050 Ti can vary quite a lot depending on the cooling performance of the laptop. Nvidia states that the Max-Q variant should be about 10 to 15% slower than a regular GTX 1050 Ti for laptops. Therefore, the GPU is most suited for Full HD and high quality settings for games of 2016.
Power Consumption
The power consumption of the GeForce GTX 1050 Ti with Max-Q design is rated at 40 to 46 Watt and therefore a lot lower than a regular GTX 1050 Ti for laptops (53 Watt). This means that the Max-Q GTX 1050 Ti is also suited for thin and light laptops.
NVIDIA GeForce GTX 1050 Ti (Desktop) Intel Iris Plus Graphics 655 NVIDIA GeForce GTX 1050 Ti Max-Q GeForce GTX 1000 Series Codename N17P-G1 Kaby Lake GT3e N17P-G1 Max-Q Architecture Pascal Gen. 9.5 Kaby Lake Pascal Pipelines 768 - unified 48 - unified 768 - unified Core Speed 1290 - 1392 (Boost) MHz 300 - 1200 (Boost) MHz 1151 – 1290 - 1290 – 1417 (Boost) MHz Memory Speed 7008 MHz 7000 MHz Memory Bus Width 128 Bit 128 Bit Memory Type GDDR5 DDR3/DDR4 GDDR5 Max. Amount of Memory 4 GB 4 GB Shared Memory no yes no API DirectX 12_1, OpenGL 4.5 DirectX 12_1, OpenGL 4.5 DirectX 12_1, OpenGL 4.5 technology 16 nm 14 nm 16 nm Features Multi-Projection, VR Ready, G-SYNC, Vulkan, Multi Monitor QuickSync Multi-Projection, VR Ready, G-SYNC, Vulkan, Multi Monitor Date of Announcement 25.10.2016 01.09.2017 03.01.2018 Power Consumption 40 - 46 Watt Notebook Size medium sized Link to Manufacturer Page www.nvidia.com
Benchmarks Performance Rating - 3DMark 11 + Fire Strike + Time Spy - Iris Plus Graphics 655
0.9 pt (3%)
...
Intel UHD Graphics 32EUs (Alder Lake)
Intel Iris Plus Graphics 655
NVIDIA GeForce GTX 460 768MB
...
Performance Rating - 3DMark 11 + Fire Strike + Time Spy - GeForce GTX 1050 Ti Max-Q
3.3 pt (10%)
...
NVIDIA GeForce GTX 1050 Ti Max-Q
...
3DMark - 3DMark Time Spy Score
min: 2474 avg: 2568 median: 2568 (7%) max: 2662 Points
min: 348 avg: 647 median: 684 (2%) max: 722 Points
min: 2361 avg: 2453 median: 2485 (7%) max: 2513 Points
3DMark - 3DMark Time Spy Graphics
min: 2277 avg: 2309 median: 2308.5 (6%) max: 2340 Points
min: 301 avg: 570 median: 604.5 (2%) max: 633 Points
min: 2196 avg: 2245 median: 2261 (6%) max: 2278 Points
3DMark - 3DMark Ice Storm Unlimited Graphics
352876 Points (40%)
min: 131607 avg: 139716 median: 137266 (16%) max: 152727 Points
324705 Points (37%)
3DMark - 3DMark Ice Storm Extreme Graphics
min: 57033 avg: 72655 median: 71073 (9%) max: 89859 Points
39641 Points (5%)
3DMark - 3DMark Cloud Gate Score
24195 Points (26%)
min: 6769 avg: 10798 median: 11622 (12%) max: 13037 Points
min: 20755 avg: 24100 median: 24021 (26%) max: 28253 Points
3DMark - 3DMark Cloud Gate Graphics
50939 Points (13%)
min: 6498 avg: 13736 median: 14343 (4%) max: 16698 Points
min: 41871 avg: 46017 median: 46952 (12%) max: 50801 Points
3DMark - 3DMark Fire Strike Standard Score
min: 6644 avg: 6783 median: 6816 (12%) max: 6888 Points
min: 852 avg: 1703 median: 1850 (3%) max: 2040 Points
min: 6175 avg: 6548 median: 6688 (12%) max: 6753 Points
3DMark - 3DMark Fire Strike Standard Graphics
min: 7293 avg: 7491 median: 7485 (8%) max: 7696 Points
min: 920 avg: 1836 median: 1983 (2%) max: 2260 Points
min: 6957 avg: 7281 median: 7324 (8%) max: 7428 Points
3DMark - 3DMark Ice Storm Graphics
min: 85405 avg: 107151 median: 110302 (13%) max: 122594 Points
min: 41029 avg: 73224 median: 60442 (7%) max: 118202 Points
3DMark 11 - 3DM11 Performance Score
min: 9151 avg: 9481 median: 9480.5 (13%) max: 9810 Points
min: 1548 avg: 2942 median: 3180.5 (4%) max: 3349 Points
min: 8250 avg: 8936 median: 9106 (13%) max: 9414 Points
3DMark 11 - 3DM11 Performance GPU
min: 9212 avg: 9453 median: 9453 (8%) max: 9694 Points
min: 1365 avg: 2707 median: 2894 (2%) max: 3081 Points
min: 8317 avg: 8781 median: 8752 (8%) max: 9079 Points
3DMark Vantage + Intel Iris Plus Graphics 655 3DMark Vantage - 3DM Vant. Perf. total
min: 12093 avg: 12287 median: 12287 (4%) max: 12481 Points
3DM Vant. Perf. total + NVIDIA GeForce GTX 1050 Ti Max-Q
min: 24827 avg: 29504 median: 29503.5 (9%) max: 34180 Points
3DM Vant. Perf. GPU no PhysX + Intel Iris Plus Graphics 655 3DMark Vantage - 3DM Vant. Perf. GPU no PhysX
min: 10337 avg: 10514 median: 10513.5 (6%) max: 10690 Points
3DM Vant. Perf. GPU no PhysX + NVIDIA GeForce GTX 1050 Ti Max-Q
min: 25707 avg: 29448 median: 29448 (17%) max: 33189 Points
3DMark 05 - 3DMark 05 - Standard
22740 Points (25%)
3DMark 06 3DMark 06 - Standard 1280x1024 + NVIDIA GeForce GTX 1050 Ti (Desktop)
min: 36277 avg: 38484 median: 38483.5 (50%) max: 40690 Points
3DMark 06 - Standard 1280x1024 + Intel Iris Plus Graphics 655
min: 17176 avg: 17885 median: 17885 (23%) max: 18594 Points
3DMark 06 - Standard 1280x1024 + NVIDIA GeForce GTX 1050 Ti Max-Q
min: 26796 avg: 28797 median: 28797 (38%) max: 30798 Points
3DMark 06 - Standard 1024x768 + NVIDIA GeForce GTX 1050 Ti Max-Q
34786 Points (45%)
Unigine Valley 1.0 - Unigine Valley 1.0 DX
40.7 fps (13%)
8.2 fps (3%)
40.1 fps (13%)
Unigine Heaven 2.1 - Heaven 2.1 high
86 fps (16%)
SPECviewperf 12 + Intel Iris Plus Graphics 655 SPECviewperf 12 - specvp12 sw-03
28.2 fps (7%)
specvp12 snx-02 + Intel Iris Plus Graphics 655 SPECviewperf 12 - specvp12 snx-02
2.1 fps (0%)
specvp12 showcase-01 + Intel Iris Plus Graphics 655 SPECviewperf 12 - specvp12 showcase-01
10.3 fps (2%)
specvp12 mediacal-01 + Intel Iris Plus Graphics 655 SPECviewperf 12 - specvp12 mediacal-01
4.6 fps (1%)
specvp12 maya-04 + Intel Iris Plus Graphics 655 SPECviewperf 12 - specvp12 maya-04
20.4 fps (6%)
specvp12 energy-01 + Intel Iris Plus Graphics 655 SPECviewperf 12 - specvp12 energy-01
0.3 fps (0%)
specvp12 creo-01 + Intel Iris Plus Graphics 655 SPECviewperf 12 - specvp12 creo-01
14.9 fps (6%)
specvp12 catia-04 + Intel Iris Plus Graphics 655 SPECviewperf 12 - specvp12 catia-04
18.8 fps (3%)
specvp12 3dsmax-05 + Intel Iris Plus Graphics 655 SPECviewperf 12 - specvp12 3dsmax-05
18.1 fps (3%)
SPECviewperf 13 specvp13 sw-04 + Intel Iris Plus Graphics 655 SPECviewperf 13 - specvp13 sw-04
34.6 fps (9%)
specvp13 snx-03 + Intel Iris Plus Graphics 655 SPECviewperf 13 - specvp13 snx-03
3.8 fps (0%)
specvp13 showcase-02 + Intel Iris Plus Graphics 655 SPECviewperf 13 - specvp13 showcase-02
10.3 fps (2%)
specvp13 medical-02 + Intel Iris Plus Graphics 655 SPECviewperf 13 - specvp13 medical-02
3.8 fps (1%)
specvp13 maya-05 + Intel Iris Plus Graphics 655 SPECviewperf 13 - specvp13 maya-05
25.9 fps (3%)
specvp13 energy-02 + Intel Iris Plus Graphics 655 SPECviewperf 13 - specvp13 energy-02
1.1 fps (0%)
specvp13 creo-02 + Intel Iris Plus Graphics 655 SPECviewperf 13 - specvp13 creo-02
19.6 fps (3%)
specvp13 catia-05 + Intel Iris Plus Graphics 655 SPECviewperf 13 - specvp13 catia-05
26.4 fps (3%)
specvp13 3dsmax-06 + Intel Iris Plus Graphics 655 SPECviewperf 13 - specvp13 3dsmax-06
18.2 fps (3%)
SPECviewperf 2020 specvp2020 solidworks-05 4k + Intel Iris Plus Graphics 655 SPECviewperf 2020 - specvp2020 solidworks-05 4k
21.2 fps (6%)
specvp2020 snx-04 4k + Intel Iris Plus Graphics 655 SPECviewperf 2020 - specvp2020 snx-04 4k
3.8 fps (0%)
specvp2020 medical-03 4k + Intel Iris Plus Graphics 655 SPECviewperf 2020 - specvp2020 medical-03 4k
1.8 fps (2%)
specvp2020 maya-06 4k + Intel Iris Plus Graphics 655 SPECviewperf 2020 - specvp2020 maya-06 4k
32.7 fps (5%)
specvp2020 energy-03 4k + Intel Iris Plus Graphics 655 SPECviewperf 2020 - specvp2020 energy-03 4k
1.1 fps (0%)
specvp2020 creo-03 4k + Intel Iris Plus Graphics 655 SPECviewperf 2020 - specvp2020 creo-03 4k
12.1 fps (6%)
specvp2020 catia-06 4k + Intel Iris Plus Graphics 655 SPECviewperf 2020 - specvp2020 catia-06 4k
6.3 fps (4%)
specvp2020 3dsmax-07 4k + Intel Iris Plus Graphics 655 SPECviewperf 2020 - specvp2020 3dsmax-07 4k
8.4 fps (3%)
Cinebench R10 Cinebench R10 Shading (32bit) + Intel Iris Plus Graphics 655 Cinebench R10 - Cinebench R10 Shading (32bit)
min: 7836 avg: 9544 median: 10263 (7%) max: 10533 Points
Cinebench R10 Shading (32bit) + NVIDIA GeForce GTX 1050 Ti Max-Q
min: 4597 avg: 5340 median: 4972 (4%) max: 6451 Points
Cinebench R11.5 Cinebench R11.5 OpenGL 64 Bit + Intel Iris Plus Graphics 655 Cinebench R11.5 - Cinebench R11.5 OpenGL 64 Bit
min: 50.25 avg: 51.4 median: 51.6 (18%) max: 52.2 fps
Cinebench R11.5 OpenGL 64 Bit + NVIDIA GeForce GTX 1050 Ti Max-Q
min: 66.9 avg: 71.7 median: 71.7 (25%) max: 76.5 fps
Cinebench R15 + NVIDIA GeForce GTX 1050 Ti (Desktop) Cinebench R15 - Cinebench R15 OpenGL 64 Bit
min: 134.7 avg: 150.4 median: 150.4 (9%) max: 166 fps
Cinebench R15 OpenGL 64 Bit + Intel Iris Plus Graphics 655
min: 33.91 avg: 67 median: 74 (4%) max: 88 fps
Cinebench R15 OpenGL 64 Bit + NVIDIA GeForce GTX 1050 Ti Max-Q
min: 92.1 avg: 105.4 median: 102 (6%) max: 120.7 fps
Cinebench R15 OpenGL Ref. Match 64 Bit + NVIDIA GeForce GTX 1050 Ti (Desktop) Cinebench R15 - Cinebench R15 OpenGL Ref. Match 64 Bit
min: 99.6 avg: 99.8 median: 99.8 (100%) max: 100 %
Cinebench R15 OpenGL Ref. Match 64 Bit + Intel Iris Plus Graphics 655
min: 97.8 avg: 98.1 median: 97.8 (98%) max: 99.3 %
Cinebench R15 OpenGL Ref. Match 64 Bit + NVIDIA GeForce GTX 1050 Ti Max-Q
99.6 % (100%)
GFXBench - GFXBench 5.0 Aztec Ruins High Tier Offscreen
49.5 fps (9%)
GFXBench - GFXBench 5.0 Aztec Ruins Normal Tier Offscreen
119.1 fps (9%)
GFXBench - GFXBench Car Chase Offscreen
min: 108.8 avg: 124.2 median: 124.2 (14%) max: 139.5 fps
GFXBench 3.1 - GFXBench Manhattan ES 3.1 Offscreen
min: 43.1 avg: 2387 median: 2387.1 (50%) max: 4731 fps
min: 168 avg: 184.9 median: 184.9 (4%) max: 201.7 fps
GFXBench 3.0 - GFXBench 3.0 Manhattan Offscreen
199.6 fps (12%)
min: 229.8 avg: 253.2 median: 253.2 (15%) max: 276.5 fps
GFXBench (DX / GLBenchmark) 2.7 + Intel Iris Plus Graphics 655 GFXBench (DX / GLBenchmark) 2.7 - GFXBench T-Rex HD Offscreen C24Z16
min: 199.6 avg: 6375 median: 6375.3 (51%) max: 12551 fps
GFXBench T-Rex HD Offscreen C24Z16 + NVIDIA GeForce GTX 1050 Ti Max-Q
min: 501 avg: 531 median: 531 (4%) max: 561 fps
LuxMark v2.0 64Bit - LuxMark v2.0 Room GPU
1175 Samples/s (5%)
min: 359 avg: 419.5 median: 419.5 (2%) max: 480 Samples/s
min: 1167 avg: 1201 median: 1200.5 (5%) max: 1234 Samples/s
LuxMark v2.0 64Bit - LuxMark v2.0 Sala GPU
2156 Samples/s (4%)
min: 882 avg: 1038 median: 1038 (2%) max: 1194 Samples/s
min: 2100 avg: 2222 median: 2221.5 (4%) max: 2343 Samples/s
ComputeMark v2.1 - ComputeMark v2.1 Result
5493 Points (6%)
min: 1584 avg: 1713 median: 1712.5 (2%) max: 1841 Points
min: 4515 avg: 4879 median: 4879 (5%) max: 5243 Points
Power Consumption - Furmark Stress Test Power Consumption - external Monitor *
164 Watt (23%)
min: 28.9 avg: 37.4 median: 39.2 (6%) max: 42.4 Watt
73.1 Watt (10%)
Power Consumption - The Witcher 3 Power Consumption - external Monitor *
155 Watt (22%)
min: 35.3 avg: 40.6 median: 39.4 (6%) max: 47.2 Watt
75.8 Watt (11%)
Power Consumption - Witcher 3 Power Consumption *
99.5 Watt (22%)
min: 39.4 avg: 43.3 median: 43.3 (10%) max: 47.2 Watt
min: 82 avg: 90 median: 85 (19%) max: 103 Watt
Power Consumption - Witcher 3 ultra Power Efficiency
0.2 fps per Watt (24%)
0.1 fps per Watt (14%)
min: 0.2379 avg: 0.3 median: 0.3 (29%) max: 0.3073 fps per Watt
Power Consumption - Witcher 3 ultra Power Efficiency - external Monitor
0.2 fps per Watt (15%)
0.2 fps per Watt (13%)
0.3 fps per Watt (27%)
Emissions Witcher 3 Fan Noise + NVIDIA GeForce GTX 1050 Ti (Desktop) Emissions - Witcher 3 Fan Noise
42 dB(A) (67%)
Witcher 3 Fan Noise + Intel Iris Plus Graphics 655
min: 32.5 avg: 36.2 median: 37.2 (60%) max: 39 dB(A)
Witcher 3 Fan Noise + NVIDIA GeForce GTX 1050 Ti Max-Q
min: 36.4 avg: 40.2 median: 38.4 (61%) max: 47.6 dB(A)
Clock Speed - GPU Clock Witcher 3 ultra
998 MHz (39%)
1392 MHz (55%)
Average Benchmarks NVIDIA GeForce GTX 1050 Ti (Desktop) → 100% n=16 Average Benchmarks Intel Iris Plus Graphics 655 → 38% n=16 Average Benchmarks NVIDIA GeForce GTX 1050 Ti Max-Q → 94% n=16
- Range of benchmark values for this graphics card
- Average benchmark values for this graphics card
* Smaller numbers mean a higher performance
1 This benchmark is not used for the average calculation
Game Benchmarks The following benchmarks stem from our benchmarks of review laptops. The performance depends on the used graphics memory, clock rate, processor, system settings, drivers, and operating systems. So the results don't have to be representative for all laptops with this GPU. For detailed information on the benchmark results, click on the fps number.
100%
GeForce GTX 1050 Ti (Desktop):
31 [X] Asus Maximum XIII Hero Desktop MSI GTX 1050 Ti Intel Core i9-11900K 3.5GHz
GeForce GTX 1050 Ti (Desktop)
min:
19 fps
fps
100%
GeForce GTX 1050 Ti (Desktop):
18 [X] Asus Maximum XIII Hero Desktop MSI GTX 1050 Ti Intel Core i9-11900K 3.5GHz
GeForce GTX 1050 Ti (Desktop)
min:
8 fps
fps
100%
GeForce GTX 1050 Ti (Desktop):
11 [X] Asus Maximum XIII Hero Desktop MSI GTX 1050 Ti Intel Core i9-11900K 3.5GHz
GeForce GTX 1050 Ti (Desktop)
min:
5 fps
fps
100%
GeForce GTX 1050 Ti (Desktop):
7 [X] Asus Maximum XIII Hero Desktop MSI GTX 1050 Ti Intel Core i9-11900K 3.5GHz
GeForce GTX 1050 Ti (Desktop)
min:
2 fps
fps
100%
GeForce GTX 1050 Ti (Desktop):
86.5 [X] Asus Maximum XIII Hero Desktop MSI GTX 1050 Ti 918016
Intel Core i9-11900K 3.5GHz
GeForce GTX 1050 Ti (Desktop)
min:
74 fps, P1:
72 fps, max:
101 fps
fps
100%
GeForce GTX 1050 Ti (Desktop):
75.3 [X] Asus Maximum XIII Hero Desktop MSI GTX 1050 Ti 918016
Intel Core i9-11900K 3.5GHz
GeForce GTX 1050 Ti (Desktop)
min:
64 fps, P1:
63 fps, max:
86 fps
fps
100%
GeForce GTX 1050 Ti (Desktop):
52.5 [X] Asus Maximum XIII Hero Desktop MSI GTX 1050 Ti 918016
Intel Core i9-11900K 3.5GHz
GeForce GTX 1050 Ti (Desktop)
min:
46 fps, P1:
45 fps, max:
60 fps
fps
100%
GeForce GTX 1050 Ti (Desktop):
65 [X] Asus Maximum XIII Hero Desktop MSI GTX 1050 Ti Intel Core i9-11900K 3.5GHz
GeForce GTX 1050 Ti (Desktop)
min:
40.3 fps, P0.1:
49.9 fps, P1:
53.2 fps, max:
202 fps
fps
100%
GeForce GTX 1050 Ti (Desktop):
23.3 [X] Asus Maximum XIII Hero Desktop MSI GTX 1050 Ti Intel Core i9-11900K 3.5GHz
GeForce GTX 1050 Ti (Desktop)
min:
17.1 fps, P0.1:
17.5 fps, P1:
18.8 fps, max:
33 fps
fps
100%
GeForce GTX 1050 Ti (Desktop):
15.8 [X] Asus Maximum XIII Hero Desktop MSI GTX 1050 Ti Intel Core i9-11900K 3.5GHz
GeForce GTX 1050 Ti (Desktop)
min:
12 fps, P0.1:
12.1 fps, P1:
13 fps, max:
20.3 fps
fps
100%
GeForce GTX 1050 Ti (Desktop):
7.7 [X] Asus Maximum XIII Hero Desktop MSI GTX 1050 Ti Intel Core i9-11900K 3.5GHz
GeForce GTX 1050 Ti (Desktop)
min:
6.08 fps, P0.1:
6.1 fps, P1:
6.17 fps, max:
9.98 fps
fps
100%
GeForce GTX 1050 Ti (Desktop):
55 [X] Asus Maximum XIII Hero Desktop MSI GTX 1050 Ti Intel Core i9-11900K 3.5GHz
GeForce GTX 1050 Ti (Desktop)
min:
14 fps, max:
73 fps
fps
100%
GeForce GTX 1050 Ti (Desktop):
37 [X] Asus Maximum XIII Hero Desktop MSI GTX 1050 Ti Intel Core i9-11900K 3.5GHz
GeForce GTX 1050 Ti (Desktop)
min:
25 fps, max:
46 fps
fps
100%
GeForce GTX 1050 Ti (Desktop):
36 [X] Asus Maximum XIII Hero Desktop MSI GTX 1050 Ti Intel Core i9-11900K 3.5GHz
GeForce GTX 1050 Ti (Desktop)
min:
25 fps, max:
46 fps
fps
100%
GeForce GTX 1050 Ti (Desktop):
35 [X] Asus Maximum XIII Hero Desktop MSI GTX 1050 Ti Intel Core i9-11900K 3.5GHz
GeForce GTX 1050 Ti (Desktop)
min:
24 fps, max:
45 fps
fps
100%
GeForce GTX 1050 Ti (Desktop):
24 [X] Asus Maximum XIII Hero Desktop MSI GTX 1050 Ti Intel Core i9-11900K 3.5GHz
GeForce GTX 1050 Ti (Desktop)
min:
14 fps, max:
29 fps
fps
100%
GeForce GTX 1050 Ti (Desktop):
11 [X] Asus Maximum XIII Hero Desktop MSI GTX 1050 Ti Intel Core i9-11900K 3.5GHz
GeForce GTX 1050 Ti (Desktop)
min:
8 fps, max:
13 fps
fps
100%
GeForce GTX 1050 Ti (Desktop):
185 [X] Aorus Z370 Ultra Gaming Desktop MSI GTX 1050 Ti 797778
Intel Core i7-8086K 3.7GHz
GeForce GTX 1050 Ti (Desktop)
min:
152 fps, P1:
142 fps, max:
230 fps
fps
24%
Iris Plus Graphics 655:
44.6 fps
100%
GeForce GTX 1050 Ti (Desktop):
88.8 [X] Aorus Z370 Ultra Gaming Desktop MSI GTX 1050 Ti 797778
Intel Core i7-8086K 3.7GHz
GeForce GTX 1050 Ti (Desktop)
min:
74 fps, P1:
71 fps, max:
104 fps
fps
24%
Iris Plus Graphics 655:
21.6 fps
100%
GeForce GTX 1050 Ti (Desktop):
71.7 [X] Aorus Z370 Ultra Gaming Desktop MSI GTX 1050 Ti 797778
Intel Core i7-8086K 3.7GHz
GeForce GTX 1050 Ti (Desktop)
min:
59 fps, P1:
56 fps, max:
83 fps
fps
23%
Iris Plus Graphics 655:
16.4 fps
Iris Plus Graphics 655:
10.2 fps
100%
GeForce GTX 1050 Ti (Desktop):
41.3 [X] Aorus Z370 Ultra Gaming Desktop MSI GTX 1050 Ti Intel Core i7-8086K 3.7GHz
GeForce GTX 1050 Ti (Desktop)
min:
17.7 fps, P0.1:
28.4 fps, P1:
32.5 fps, max:
81.3 fps
fps
100%
GeForce GTX 1050 Ti (Desktop):
21.3 [X] Aorus Z370 Ultra Gaming Desktop MSI GTX 1050 Ti Intel Core i7-8086K 3.7GHz
GeForce GTX 1050 Ti (Desktop)
min:
14.9 fps, P0.1:
15.3 fps, P1:
18.1 fps, max:
35.3 fps
fps
100%
GeForce GTX 1050 Ti (Desktop):
17 [X] Aorus Z370 Ultra Gaming Desktop MSI GTX 1050 Ti Intel Core i7-8086K 3.7GHz
GeForce GTX 1050 Ti (Desktop)
min:
12.5 fps, P0.1:
12.6 fps, P1:
13.3 fps, max:
19.3 fps
fps
100%
GeForce GTX 1050 Ti (Desktop):
56.1 [X] Aorus Z370 Ultra Gaming Desktop MSI GTX 1050 Ti Intel Core i7-8086K 3.7GHz
GeForce GTX 1050 Ti (Desktop)
min:
7 fps, P1:
41.5 fps, max:
81 fps
fps
100%
GeForce GTX 1050 Ti (Desktop):
25.6 [X] Aorus Z370 Ultra Gaming Desktop MSI GTX 1050 Ti Intel Core i7-8086K 3.7GHz
GeForce GTX 1050 Ti (Desktop)
min:
8 fps, P1:
21.2 fps, max:
55 fps
fps
100%
GeForce GTX 1050 Ti (Desktop):
18.1 [X] Aorus Z370 Ultra Gaming Desktop MSI GTX 1050 Ti Intel Core i7-8086K 3.7GHz
GeForce GTX 1050 Ti (Desktop)
min:
10 fps, P1:
12.3 fps, max:
47 fps
fps
100%
GeForce GTX 1050 Ti (Desktop):
12.1 [X] Aorus Z370 Ultra Gaming Desktop MSI GTX 1050 Ti Intel Core i7-8086K 3.7GHz
GeForce GTX 1050 Ti (Desktop)
min:
7 fps, P1:
8.3 fps, max:
26 fps
fps
100%
GeForce GTX 1050 Ti (Desktop):
8.6 [X] Aorus Z370 Ultra Gaming Desktop MSI GTX 1050 Ti Intel Core i7-8086K 3.7GHz
GeForce GTX 1050 Ti (Desktop)
min:
6 fps, P1:
6.4 fps, max:
12 fps
fps
Iris Plus Graphics 655:
40.7 fps
Iris Plus Graphics 655:
19.1 fps
Iris Plus Graphics 655:
14.5 fps
100%
GeForce GTX 1050 Ti (Desktop):
44.7 [X] Aorus Z370 Ultra Gaming Desktop MSI GTX 1050 Ti 670054
Intel Core i7-8086K 3.7GHz
GeForce GTX 1050 Ti (Desktop)
min:
34 fps, max:
54 fps
fps
22%
Iris Plus Graphics 655:
9.6 fps
100%
GeForce GTX 1050 Ti (Desktop):
32.3 [X] Aorus Z370 Ultra Gaming Desktop MSI GTX 1050 Ti 670054
Intel Core i7-8086K 3.7GHz
GeForce GTX 1050 Ti (Desktop)
min:
25 fps, max:
38 fps
fps
100%
GeForce GTX 1050 Ti (Desktop):
17.6 [X] Aorus Z370 Ultra Gaming Desktop MSI GTX 1050 Ti 670054
Intel Core i7-8086K 3.7GHz
GeForce GTX 1050 Ti (Desktop)
min:
14 fps, max:
20 fps
fps
100%
GeForce GTX 1050 Ti (Desktop):
200 [X] Aorus Z370 Ultra Gaming Desktop MSI GTX 1050 Ti Intel Core i7-8086K 3.7GHz
GeForce GTX 1050 Ti (Desktop)
fps
27%
Iris Plus Graphics 655:
54.8 fps
100%
GeForce GTX 1050 Ti (Desktop):
71.7 [X] Aorus Z370 Ultra Gaming Desktop MSI GTX 1050 Ti Intel Core i7-8086K 3.7GHz
GeForce GTX 1050 Ti (Desktop)
fps
24%
Iris Plus Graphics 655:
17.3 fps
100%
GeForce GTX 1050 Ti (Desktop):
44.3 □ [X] Aorus Z370 Ultra Gaming Desktop MSI GTX 1050 Ti Intel Core i7-8086K 3.7GHz
GeForce GTX 1050 Ti (Desktop)
fps
26%
Iris Plus Graphics 655:
11.6 fps
100%
GeForce GTX 1050 Ti (Desktop):
32.6 [X] Aorus Z370 Ultra Gaming Desktop MSI GTX 1050 Ti Intel Core i7-8086K 3.7GHz
GeForce GTX 1050 Ti (Desktop)
fps
100%
GeForce GTX 1050 Ti (Desktop):
20.6 [X] Aorus Z370 Ultra Gaming Desktop MSI GTX 1050 Ti Intel Core i7-8086K 3.7GHz
GeForce GTX 1050 Ti (Desktop)
fps
100%
GeForce GTX 1050 Ti (Desktop):
101 [X] Aorus Z370 Ultra Gaming Desktop MSI GTX 1050 Ti Intel Core i7-8086K 3.7GHz
GeForce GTX 1050 Ti (Desktop)
P1:
69 fps
fps
0%
Iris Plus Graphics 655:
0 (!) [X] Intel NUC8i7BE Intel Core i7-8559U 2.7GHz
Iris Plus Graphics 655
fps
100%
GeForce GTX 1050 Ti (Desktop):
62.9 [X] Aorus Z370 Ultra Gaming Desktop MSI GTX 1050 Ti Intel Core i7-8086K 3.7GHz
GeForce GTX 1050 Ti (Desktop)
P1:
55.2 fps
fps
100%
GeForce GTX 1050 Ti (Desktop):
55.5 [X] Aorus Z370 Ultra Gaming Desktop MSI GTX 1050 Ti Intel Core i7-8086K 3.7GHz
GeForce GTX 1050 Ti (Desktop)
P1:
36.4 fps
fps
100%
GeForce GTX 1050 Ti (Desktop):
52.9 [X] Aorus Z370 Ultra Gaming Desktop MSI GTX 1050 Ti Intel Core i7-8086K 3.7GHz
GeForce GTX 1050 Ti (Desktop)
P1:
33.1 fps
fps
100%
GeForce GTX 1050 Ti (Desktop):
39.3 [X] Aorus Z370 Ultra Gaming Desktop MSI GTX 1050 Ti Intel Core i7-8086K 3.7GHz
GeForce GTX 1050 Ti (Desktop)
P1:
25.4 fps
fps
100%
GeForce GTX 1050 Ti (Desktop):
109 [X] Aorus Z370 Ultra Gaming Desktop MSI GTX 1050 Ti Intel Core i7-8086K 3.7GHz
GeForce GTX 1050 Ti (Desktop)
min:
97 fps, max:
124 fps
fps
100%
GeForce GTX 1050 Ti (Desktop):
41.6 [X] Aorus Z370 Ultra Gaming Desktop MSI GTX 1050 Ti Intel Core i7-8086K 3.7GHz
GeForce GTX 1050 Ti (Desktop)
min:
39 fps, max:
45 fps
fps
100%
GeForce GTX 1050 Ti (Desktop):
33.5 [X] Aorus Z370 Ultra Gaming Desktop MSI GTX 1050 Ti Intel Core i7-8086K 3.7GHz
GeForce GTX 1050 Ti (Desktop)
min:
30 fps, max:
36 fps
fps
Iris Plus Graphics 655:
29.1 [X] Intel NUC8i7BE Intel Core i7-8559U 2.7GHz
Iris Plus Graphics 655
min:
17 fps, max:
36 fps
fps
Iris Plus Graphics 655:
16.2 [X] Intel NUC8i7BE Intel Core i7-8559U 2.7GHz
Iris Plus Graphics 655
min:
11 fps, max:
22 fps
fps
100%
GeForce GTX 1050 Ti (Desktop):
50.9 [X] Aorus Z370 Ultra Gaming Desktop MSI GTX 1050 Ti Intel Core i7-8086K 3.7GHz
GeForce GTX 1050 Ti (Desktop)
min:
41 fps, max:
56 fps
fps
28%
Iris Plus Graphics 655:
14.1 [X] Intel NUC8i7BE Intel Core i7-8559U 2.7GHz
Iris Plus Graphics 655
min:
11 fps, max:
21 fps
fps
100%
GeForce GTX 1050 Ti (Desktop):
40.2 [X] Aorus Z370 Ultra Gaming Desktop MSI GTX 1050 Ti Intel Core i7-8086K 3.7GHz
GeForce GTX 1050 Ti (Desktop)
min:
28 fps, max:
55 fps
fps
16%
Iris Plus Graphics 655:
6.6 [X] Intel NUC8i7BE Intel Core i7-8559U 2.7GHz
Iris Plus Graphics 655
min:
3 fps, max:
9 fps
fps
100%
GeForce GTX 1050 Ti (Desktop):
32.4 [X] Aorus Z370 Ultra Gaming Desktop MSI GTX 1050 Ti Intel Core i7-8086K 3.7GHz
GeForce GTX 1050 Ti (Desktop)
min:
24 fps, max:
39 fps
fps
Iris Plus Graphics 655:
59.8 [X] Intel NUC8i7BE Intel Core i7-8559U 2.7GHz
Iris Plus Graphics 655
min:
56 fps, max:
62 fps
fps
Iris Plus Graphics 655:
27.2 [X] Intel NUC8i7BE Intel Core i7-8559U 2.7GHz
Iris Plus Graphics 655
min:
20 fps, max:
31 fps
fps
100%
GeForce GTX 1050 Ti (Desktop):
75 [X] MSI GeForce GTX 1050 Ti Intel Core i7-7740X 4.3GHz
GeForce GTX 1050 Ti (Desktop)
min:
13 fps, P1:
66.7 fps, max:
140 fps
fps
21%
Iris Plus Graphics 655:
15.8 [X] Intel NUC8i7BE Intel Core i7-8559U 2.7GHz
Iris Plus Graphics 655
min:
3.7 fps, P1:
6.17 fps, max:
130 fps
fps
100%
GeForce GTX 1050 Ti (Desktop):
34.8 [X] MSI GeForce GTX 1050 Ti Intel Core i7-7740X 4.3GHz
GeForce GTX 1050 Ti (Desktop)
min:
24 fps, P1:
30.3 fps, max:
135 fps
fps
100%
GeForce GTX 1050 Ti (Desktop):
22.3 [X] MSI GeForce GTX 1050 Ti Intel Core i7-7740X 4.3GHz
GeForce GTX 1050 Ti (Desktop)
min:
16.7 fps, P1:
17.5 fps, max:
128 fps
fps
100%
GeForce GTX 1050 Ti (Desktop):
14.3 [X] MSI GeForce GTX 1050 Ti Intel Core i7-7740X 4.3GHz
GeForce GTX 1050 Ti (Desktop)
min:
5.82 fps, P1:
10 fps, max:
128 fps
fps
Iris Plus Graphics 655:
0 (!) [X] Intel NUC8i7BE Intel Core i7-8559U 2.7GHz
Iris Plus Graphics 655
fps
100%
GeForce GTX 1050 Ti (Desktop):
43.2 [X] MSI GeForce GTX 1050 Ti Intel Core i7-7740X 4.3GHz
GeForce GTX 1050 Ti (Desktop)
P1:
31.4 fps
fps
100%
GeForce GTX 1050 Ti (Desktop):
33.9 [X] MSI GeForce GTX 1050 Ti Intel Core i7-7740X 4.3GHz
GeForce GTX 1050 Ti (Desktop)
P1:
24.8 fps
fps
100%
GeForce GTX 1050 Ti (Desktop):
24 [X] MSI GeForce GTX 1050 Ti Intel Core i7-7740X 4.3GHz
GeForce GTX 1050 Ti (Desktop)
P1:
16.6 fps
fps
Iris Plus Graphics 655:
36.3 (!) [X] Intel NUC8i7BE Intel Core i7-8559U 2.7GHz
Iris Plus Graphics 655
P1:
24.6 fps
fps
Iris Plus Graphics 655:
20.9 (!) [X] Intel NUC8i7BE Intel Core i7-8559U 2.7GHz
Iris Plus Graphics 655
P1:
14.5 fps
fps
Iris Plus Graphics 655:
0 (!) [X] Intel NUC8i7BE Intel Core i7-8559U 2.7GHz
Iris Plus Graphics 655
fps
Iris Plus Graphics 655:
92 [X] Intel NUC8i7BE DirectX 11
Intel Core i7-8559U 2.7GHz
Iris Plus Graphics 655
P1:
74.1 fps
fps
Iris Plus Graphics 655:
55.9 [X] Intel NUC8i7BE DirectX 11
Intel Core i7-8559U 2.7GHz
Iris Plus Graphics 655
P1:
47.4 fps
fps
Iris Plus Graphics 655:
46.3 [X] Intel NUC8i7BE DirectX 11
Intel Core i7-8559U 2.7GHz
Iris Plus Graphics 655
P1:
35.6 fps
fps
100%
GeForce GTX 1050 Ti (Desktop):
141 [X] MSI GeForce GTX 1050 Ti Intel Core i7-7740X 4.3GHz
GeForce GTX 1050 Ti (Desktop)
P1:
103.1 fps
fps
25%
Iris Plus Graphics 655:
34.9 [X] Intel NUC8i7BE DirectX 11
Intel Core i7-8559U 2.7GHz
Iris Plus Graphics 655
P1:
31.3 fps
fps
100%
GeForce GTX 1050 Ti (Desktop):
107 [X] MSI GeForce GTX 1050 Ti Intel Core i7-7740X 4.3GHz
GeForce GTX 1050 Ti (Desktop)
P1:
84.7 fps
fps
25%
Iris Plus Graphics 655:
26.5 [X] Intel NUC8i7BE DirectX 11
Intel Core i7-8559U 2.7GHz
Iris Plus Graphics 655
P1:
24 fps
fps
100%
GeForce GTX 1050 Ti (Desktop):
62 [X] MSI GeForce GTX 1050 Ti Intel Core i7-7740X 4.3GHz
GeForce GTX 1050 Ti (Desktop)
P1:
51.5 fps
fps
22%
Iris Plus Graphics 655:
13.6 [X] Intel NUC8i7BE DirectX 11
Intel Core i7-8559U 2.7GHz
Iris Plus Graphics 655
P1:
12 fps
fps
100%
GeForce GTX 1050 Ti (Desktop):
115 [X] MSI GeForce GTX 1050 Ti Intel Core i7-7740X 4.3GHz
GeForce GTX 1050 Ti (Desktop)
fps
20%
Iris Plus Graphics 655:
22.5 23.5 ~ 23 fps
100%
GeForce GTX 1050 Ti (Desktop):
47.5 [X] MSI GeForce GTX 1050 Ti Intel Core i7-7740X 4.3GHz
GeForce GTX 1050 Ti (Desktop)
fps
21%
Iris Plus Graphics 655:
10.2 10.4 ~ 10 fps
100%
GeForce GTX 1050 Ti (Desktop):
29.6 [X] MSI GeForce GTX 1050 Ti Intel Core i7-7740X 4.3GHz
GeForce GTX 1050 Ti (Desktop)
fps
24%
Iris Plus Graphics 655:
6.4 6.7 ~ 7 fps
100%
GeForce GTX 1050 Ti (Desktop):
21.8 [X] MSI GeForce GTX 1050 Ti Intel Core i7-7740X 4.3GHz
GeForce GTX 1050 Ti (Desktop)
fps
100%
GeForce GTX 1050 Ti (Desktop):
15 [X] MSI GeForce GTX 1050 Ti Intel Core i7-7740X 4.3GHz
GeForce GTX 1050 Ti (Desktop)
fps
100%
GeForce GTX 1050 Ti (Desktop):
94 [X] MSI GeForce GTX 1050 Ti Intel Core i7-7740X 4.3GHz
GeForce GTX 1050 Ti (Desktop)
min:
81 fps, max:
107 fps
fps
27%
Iris Plus Graphics 655:
25.4 (!) [X] Intel NUC8i7BE Intel Core i7-8559U 2.7GHz
Iris Plus Graphics 655
min:
20 fps, max:
31 fps
fps
100%
GeForce GTX 1050 Ti (Desktop):
29.9 [X] MSI GeForce GTX 1050 Ti Intel Core i7-7740X 4.3GHz
GeForce GTX 1050 Ti (Desktop)
min:
26 fps, max:
34 fps
fps
100%
GeForce GTX 1050 Ti (Desktop):
21.3 [X] MSI GeForce GTX 1050 Ti Intel Core i7-7740X 4.3GHz
GeForce GTX 1050 Ti (Desktop)
min:
18 fps, max:
24 fps
fps
100%
GeForce GTX 1050 Ti (Desktop):
164 [X] MSI GeForce GTX 1050 Ti Intel Core i7-7740X 4.3GHz
GeForce GTX 1050 Ti (Desktop)
min:
143 fps, max:
181 fps
fps
31%
Iris Plus Graphics 655:
51.2 [X] Intel NUC8i7BE Intel Core i7-8559U 2.7GHz
Iris Plus Graphics 655
min:
46 fps, max:
56 fps
fps
100%
GeForce GTX 1050 Ti (Desktop):
73 [X] MSI GeForce GTX 1050 Ti Intel Core i7-7740X 4.3GHz
GeForce GTX 1050 Ti (Desktop)
min:
65 fps, max:
77 fps
fps
30%
Iris Plus Graphics 655:
21.9 [X] Intel NUC8i7BE Intel Core i7-8559U 2.7GHz
Iris Plus Graphics 655
min:
19 fps, max:
23 fps
fps
100%
GeForce GTX 1050 Ti (Desktop):
52.8 [X] MSI GeForce GTX 1050 Ti Intel Core i7-7740X 4.3GHz
GeForce GTX 1050 Ti (Desktop)
min:
49 fps, max:
55 fps
fps
37%
Iris Plus Graphics 655:
19.3 [X] Intel NUC8i7BE Intel Core i7-8559U 2.7GHz
Iris Plus Graphics 655
min:
17 fps, max:
21 fps
fps
100%
GeForce GTX 1050 Ti (Desktop):
37.4 [X] MSI GeForce GTX 1050 Ti Intel Core i7-7740X 4.3GHz
GeForce GTX 1050 Ti (Desktop)
min:
34 fps, max:
39 fps
fps
100%
GeForce GTX 1050 Ti (Desktop):
29.3 [X] MSI GeForce GTX 1050 Ti Intel Core i7-7740X 4.3GHz
GeForce GTX 1050 Ti (Desktop)
min:
27 fps, max:
30 fps
fps
100%
GeForce GTX 1050 Ti (Desktop):
18 [X] MSI GeForce GTX 1050 Ti Intel Core i7-7740X 4.3GHz
GeForce GTX 1050 Ti (Desktop)
min:
15 fps, max:
18 fps
fps
100%
GeForce GTX 1050 Ti (Desktop):
153 [X] MSI GeForce GTX 1050 Ti Intel Core i7-7740X 4.3GHz
GeForce GTX 1050 Ti (Desktop)
min:
128 fps, max:
183 fps
fps
37%
Iris Plus Graphics 655:
56.7 [X] Intel NUC8i7BE Intel Core i7-8559U 2.7GHz
Iris Plus Graphics 655
min:
51 fps, max:
63 fps
fps
100%
GeForce GTX 1050 Ti (Desktop):
51.4 [X] MSI GeForce GTX 1050 Ti Intel Core i7-7740X 4.3GHz
GeForce GTX 1050 Ti (Desktop)
min:
43 fps, max:
59 fps
fps
36%
Iris Plus Graphics 655:
18.5 [X] Intel NUC8i7BE Intel Core i7-8559U 2.7GHz
Iris Plus Graphics 655
min:
14 fps, max:
24 fps
fps
100%
GeForce GTX 1050 Ti (Desktop):
31.5 [X] MSI GeForce GTX 1050 Ti Intel Core i7-7740X 4.3GHz
GeForce GTX 1050 Ti (Desktop)
min:
27 fps, max:
36 fps
fps
33%
Iris Plus Graphics 655:
10.5 [X] Intel NUC8i7BE Intel Core i7-8559U 2.7GHz
Iris Plus Graphics 655
min:
8 fps, max:
13 fps
fps
100%
GeForce GTX 1050 Ti (Desktop):
21.4 [X] MSI GeForce GTX 1050 Ti Intel Core i7-7740X 4.3GHz
GeForce GTX 1050 Ti (Desktop)
min:
18 fps, max:
26 fps
fps
100%
GeForce GTX 1050 Ti (Desktop):
12.8 [X] MSI GeForce GTX 1050 Ti Intel Core i7-7740X 4.3GHz
GeForce GTX 1050 Ti (Desktop)
min:
11 fps, max:
15 fps
fps
Iris Plus Graphics 655:
24.5 fps
Iris Plus Graphics 655:
30.2 [X] Intel NUC8i7BE Intel Core i7-8559U 2.7GHz
Iris Plus Graphics 655
min:
26 fps, max:
34 fps
fps
100%
GeForce GTX 1050 Ti (Desktop):
156 [X] MSI GeForce GTX 1050 Ti Intel Core i7-7740X 4.3GHz
GeForce GTX 1050 Ti (Desktop)
min:
64.9351 fps, P1:
104.167 fps, max:
322.581 fps
fps
22%
Iris Plus Graphics 655:
35 fps
100%
GeForce GTX 1050 Ti (Desktop):
53.6 [X] MSI GeForce GTX 1050 Ti Intel Core i7-7740X 4.3GHz
GeForce GTX 1050 Ti (Desktop)
min:
20.3666 fps, P1:
36.6596 fps, max:
86.9565 fps
fps
100%
GeForce GTX 1050 Ti (Desktop):
41.4 [X] MSI GeForce GTX 1050 Ti Intel Core i7-7740X 4.3GHz
GeForce GTX 1050 Ti (Desktop)
min:
16.8634 fps, P1:
25.3165 fps, max:
83.3333 fps
fps
100%
GeForce GTX 1050 Ti (Desktop):
31.5 [X] MSI GeForce GTX 1050 Ti Intel Core i7-7740X 4.3GHz
GeForce GTX 1050 Ti (Desktop)
min:
15.9744 fps, P1:
20.6612 fps, max:
59.8802 fps
fps
100%
GeForce GTX 1050 Ti (Desktop):
21.5 [X] MSI GeForce GTX 1050 Ti Intel Core i7-7740X 4.3GHz
GeForce GTX 1050 Ti (Desktop)
min:
12.3609 fps, P1:
16.3319 fps, max:
45.6621 fps
fps
100%
GeForce GTX 1050 Ti (Desktop):
10.2 [X] MSI GeForce GTX 1050 Ti Intel Core i7-7740X 4.3GHz
GeForce GTX 1050 Ti (Desktop)
min:
3.60881 fps, P1:
7.28385 fps, max:
16.7785 fps
fps
100%
GeForce GTX 1050 Ti (Desktop):
149 [X] MSI GeForce GTX 1050 Ti Intel Core i7-7740X 4.3GHz
GeForce GTX 1050 Ti (Desktop)
min:
135 fps, max:
177 fps
fps
43%
Iris Plus Graphics 655:
64 [X] Intel NUC8i7BE Intel Core i7-8559U 2.7GHz
Iris Plus Graphics 655
min:
57 fps, max:
76 fps
fps
89%
GeForce GTX 1050 Ti Max-Q:
133.2 fps
100%
GeForce GTX 1050 Ti (Desktop):
67 [X] MSI GeForce GTX 1050 Ti Intel Core i7-7740X 4.3GHz
GeForce GTX 1050 Ti (Desktop)
min:
59 fps, max:
81 fps
fps
34%
Iris Plus Graphics 655:
22.8 [X] Intel NUC8i7BE Intel Core i7-8559U 2.7GHz
Iris Plus Graphics 655
min:
20 fps, max:
25 fps
fps
85%
GeForce GTX 1050 Ti Max-Q:
56.7 fps
100%
GeForce GTX 1050 Ti (Desktop):
52.3 [X] MSI GeForce GTX 1050 Ti Intel Core i7-7740X 4.3GHz
GeForce GTX 1050 Ti (Desktop)
min:
46 fps, max:
63 fps
fps
85%
GeForce GTX 1050 Ti Max-Q:
44.3 fps
100%
GeForce GTX 1050 Ti (Desktop):
32.3 [X] MSI GeForce GTX 1050 Ti Intel Core i7-7740X 4.3GHz
GeForce GTX 1050 Ti (Desktop)
min:
29 fps, max:
39 fps
fps
84%
GeForce GTX 1050 Ti Max-Q:
27.2 fps
100%
GeForce GTX 1050 Ti (Desktop):
23.5 [X] MSI GeForce GTX 1050 Ti Intel Core i7-7740X 4.3GHz
GeForce GTX 1050 Ti (Desktop)
min:
21 fps, max:
27 fps
fps
100%
GeForce GTX 1050 Ti (Desktop):
13.4 [X] MSI GeForce GTX 1050 Ti Intel Core i7-7740X 4.3GHz
GeForce GTX 1050 Ti (Desktop)
min:
12 fps, max:
15 fps
fps
84%
GeForce GTX 1050 Ti Max-Q:
11.3 fps
Iris Plus Graphics 655:
16.6 [X] Intel NUC8i7BE Intel Core i7-8559U 2.7GHz
Iris Plus Graphics 655
min:
8 fps, max:
21 fps
fps
GeForce GTX 1050 Ti Max-Q:
67.1 fps
GeForce GTX 1050 Ti Max-Q:
40.5 fps
GeForce GTX 1050 Ti Max-Q:
34 fps
GeForce GTX 1050 Ti Max-Q:
30.4 fps
GeForce GTX 1050 Ti Max-Q:
9 fps
100%
GeForce GTX 1050 Ti (Desktop):
87 [X] MSI GeForce GTX 1050 Ti Intel Core i7-7740X 4.3GHz
GeForce GTX 1050 Ti (Desktop)
min:
65 fps, max:
111 fps
fps
25%
Iris Plus Graphics 655:
21 22 [X] Intel NUC8i7BE Intel Core i7-8559U 2.7GHz
Iris Plus Graphics 655
min:
19 fps, max:
27 fps
~ 22 fps
99%
GeForce GTX 1050 Ti Max-Q:
83 89 [X] MSI GF75 8RD-001 Intel Core i7-8750H 2.2GHz
GeForce GTX 1050 Ti Max-Q
min:
61 fps, max:
89 fps
~ 86 fps
100%
GeForce GTX 1050 Ti (Desktop):
48 [X] MSI GeForce GTX 1050 Ti Intel Core i7-7740X 4.3GHz
GeForce GTX 1050 Ti (Desktop)
min:
38 fps, max:
58 fps
fps
23%
Iris Plus Graphics 655:
11 [X] Intel NUC8i7BE Intel Core i7-8559U 2.7GHz
Iris Plus Graphics 655
min:
10 fps, max:
14 fps
11 ~ 11 fps
102%
GeForce GTX 1050 Ti Max-Q:
47 50 [X] MSI GF75 8RD-001 Intel Core i7-8750H 2.2GHz
GeForce GTX 1050 Ti Max-Q
min:
40 fps, max:
60 fps
~ 49 fps
100%
GeForce GTX 1050 Ti (Desktop):
45 [X] MSI GeForce GTX 1050 Ti Intel Core i7-7740X 4.3GHz
GeForce GTX 1050 Ti (Desktop)
min:
36 fps, max:
54 fps
fps
22%
Iris Plus Graphics 655:
10 fps
100%
GeForce GTX 1050 Ti Max-Q:
43 46 [X] MSI GF75 8RD-001 Intel Core i7-8750H 2.2GHz
GeForce GTX 1050 Ti Max-Q
min:
38 fps, max:
56 fps
~ 45 fps
100%
GeForce GTX 1050 Ti (Desktop):
41 [X] MSI GeForce GTX 1050 Ti Intel Core i7-7740X 4.3GHz
GeForce GTX 1050 Ti (Desktop)
min:
31 fps, max:
51 fps
fps
22%
Iris Plus Graphics 655:
9 fps
102%
GeForce GTX 1050 Ti Max-Q:
40 43 [X] MSI GF75 8RD-001 Intel Core i7-8750H 2.2GHz
GeForce GTX 1050 Ti Max-Q
min:
33 fps, max:
53 fps
~ 42 fps
100%
GeForce GTX 1050 Ti (Desktop):
29 [X] MSI GeForce GTX 1050 Ti Intel Core i7-7740X 4.3GHz
GeForce GTX 1050 Ti (Desktop)
min:
23 fps, max:
36 fps
fps
100%
GeForce GTX 1050 Ti Max-Q:
29 [X] MSI GF75 8RD-001 Intel Core i7-8750H 2.2GHz
GeForce GTX 1050 Ti Max-Q
min:
24 fps, max:
37 fps
fps
100%
GeForce GTX 1050 Ti (Desktop):
14 [X] MSI GeForce GTX 1050 Ti Intel Core i7-7740X 4.3GHz
GeForce GTX 1050 Ti (Desktop)
min:
11 fps, max:
18 fps
fps
107%
GeForce GTX 1050 Ti Max-Q:
14 15 [X] MSI GF75 8RD-001 Intel Core i7-8750H 2.2GHz
GeForce GTX 1050 Ti Max-Q
min:
11 fps, max:
19 fps
~ 15 fps
100%
GeForce GTX 1050 Ti (Desktop):
64.7 [X] MSI GeForce GTX 1050 Ti Intel Core i7-7740X 4.3GHz
GeForce GTX 1050 Ti (Desktop)
min:
34 fps, max:
116 fps
fps
29%
Iris Plus Graphics 655:
18.3 [X] Intel NUC8i7BE Intel Core i7-8559U 2.7GHz
Iris Plus Graphics 655
min:
10.36 fps, max:
31.73 fps
20.1 ~ 19 fps
90%
GeForce GTX 1050 Ti Max-Q:
55.5 60.4 [X] MSI GF75 8RD-001 Intel Core i7-8750H 2.2GHz
GeForce GTX 1050 Ti Max-Q
min:
31.8 fps, max:
115.6 fps
~ 58 fps
100%
GeForce GTX 1050 Ti (Desktop):
32.8 [X] MSI GeForce GTX 1050 Ti Intel Core i7-7740X 4.3GHz
GeForce GTX 1050 Ti (Desktop)
min:
17 fps, max:
53 fps
fps
31%
Iris Plus Graphics 655:
10.1 fps
125%
GeForce GTX 1050 Ti Max-Q:
31.4 [X] MSI GF75 8RD-001 Intel Core i7-8750H 2.2GHz
GeForce GTX 1050 Ti Max-Q
min:
15.8 fps, max:
53.7 fps
49.8 ~ 41 fps
100%
GeForce GTX 1050 Ti (Desktop):
24 [X] MSI GeForce GTX 1050 Ti Intel Core i7-7740X 4.3GHz
GeForce GTX 1050 Ti (Desktop)
min:
13 fps, max:
40 fps
fps
31%
Iris Plus Graphics 655:
7.4 fps
125%
GeForce GTX 1050 Ti Max-Q:
23.5 [X] MSI GF75 8RD-001 Intel Core i7-8750H 2.2GHz
GeForce GTX 1050 Ti Max-Q
min:
12.1 fps, max:
39.8 fps
36.5 ~ 30 fps
100%
GeForce GTX 1050 Ti (Desktop):
19.8 [X] MSI GeForce GTX 1050 Ti Intel Core i7-7740X 4.3GHz
GeForce GTX 1050 Ti (Desktop)
min:
11 fps, max:
32 fps
fps
121%
GeForce GTX 1050 Ti Max-Q:
19.3 [X] MSI GF75 8RD-001 Intel Core i7-8750H 2.2GHz
GeForce GTX 1050 Ti Max-Q
min:
10.4 fps, max:
19.3 fps
28.3 ~ 24 fps
100%
GeForce GTX 1050 Ti (Desktop):
9.2 [X] MSI GeForce GTX 1050 Ti Intel Core i7-7740X 4.3GHz
GeForce GTX 1050 Ti (Desktop)
min:
6 fps, max:
14 fps
fps
51%
GeForce GTX 1050 Ti Max-Q:
4.7 fps
100%
GeForce GTX 1050 Ti (Desktop):
128 [X] MSI GeForce GTX 1050 Ti Intel Core i7-7740X 4.3GHz
GeForce GTX 1050 Ti (Desktop)
min:
115 fps, max:
144 fps
fps
100%
GeForce GTX 1050 Ti (Desktop):
55.6 [X] MSI GeForce GTX 1050 Ti Intel Core i7-7740X 4.3GHz
GeForce GTX 1050 Ti (Desktop)
min:
46 fps, max:
69 fps
fps
100%
GeForce GTX 1050 Ti (Desktop):
46.7 [X] MSI GeForce GTX 1050 Ti Intel Core i7-7740X 4.3GHz
GeForce GTX 1050 Ti (Desktop)
min:
41 fps, max:
57 fps
fps
100%
GeForce GTX 1050 Ti (Desktop):
45 [X] MSI GeForce GTX 1050 Ti Intel Core i7-7740X 4.3GHz
GeForce GTX 1050 Ti (Desktop)
min:
33 fps, max:
57 fps
fps
100%
GeForce GTX 1050 Ti (Desktop):
28.8 [X] MSI GeForce GTX 1050 Ti Intel Core i7-7740X 4.3GHz
GeForce GTX 1050 Ti (Desktop)
min:
25 fps, max:
37 fps
fps
100%
GeForce GTX 1050 Ti (Desktop):
14.1 [X] MSI GeForce GTX 1050 Ti Intel Core i7-7740X 4.3GHz
GeForce GTX 1050 Ti (Desktop)
min:
11 fps, max:
18 fps
fps
GeForce GTX 1050 Ti Max-Q:
73.2 fps
GeForce GTX 1050 Ti Max-Q:
47.9 fps
100%
GeForce GTX 1050 Ti (Desktop):
41.9 [X] MSI GeForce GTX 1050 Ti Intel Core i7-7740X 4.3GHz
GeForce GTX 1050 Ti (Desktop)
min:
38 fps, max:
45 fps
fps
86%
GeForce GTX 1050 Ti Max-Q:
36.1 fps
100%
GeForce GTX 1050 Ti (Desktop):
40.1 [X] MSI GeForce GTX 1050 Ti Intel Core i7-7740X 4.3GHz
GeForce GTX 1050 Ti (Desktop)
min:
37 fps, max:
44 fps
fps
88%
GeForce GTX 1050 Ti Max-Q:
35.3 fps
GeForce GTX 1050 Ti Max-Q:
12.9 fps
GeForce GTX 1050 Ti Max-Q:
134.5 fps
GeForce GTX 1050 Ti Max-Q:
87.4 fps
100%
GeForce GTX 1050 Ti (Desktop):
50.9 [X] MSI GeForce GTX 1050 Ti Intel Core i7-7740X 4.3GHz
GeForce GTX 1050 Ti (Desktop)
min:
45 fps, max:
58 fps
fps
145%
GeForce GTX 1050 Ti Max-Q:
73.7 fps
100%
GeForce GTX 1050 Ti (Desktop):
43.3 [X] MSI GeForce GTX 1050 Ti Intel Core i7-7740X 4.3GHz
GeForce GTX 1050 Ti (Desktop)
min:
39 fps, max:
49 fps
fps
150%
GeForce GTX 1050 Ti Max-Q:
65 fps
GeForce GTX 1050 Ti Max-Q:
13.2 fps
100%
GeForce GTX 1050 Ti (Desktop):
140 [X] MSI GeForce GTX 1050 Ti Intel Core i7-7740X 4.3GHz
GeForce GTX 1050 Ti (Desktop)
min:
107 fps, max:
186 fps
fps
14%
Iris Plus Graphics 655:
19.9 [X] Intel NUC8i7BE Intel Core i7-8559U 2.7GHz
Iris Plus Graphics 655
min:
1 fps, max:
33 fps
fps
72%
GeForce GTX 1050 Ti Max-Q:
100.1 fps
100%
GeForce GTX 1050 Ti (Desktop):
63 [X] MSI GeForce GTX 1050 Ti Intel Core i7-7740X 4.3GHz
GeForce GTX 1050 Ti (Desktop)
min:
52 fps, max:
92 fps
fps
91%
GeForce GTX 1050 Ti Max-Q:
57.3 fps
100%
GeForce GTX 1050 Ti (Desktop):
51.9 [X] MSI GeForce GTX 1050 Ti Intel Core i7-7740X 4.3GHz
GeForce GTX 1050 Ti (Desktop)
min:
42 fps, max:
79 fps
fps
92%
GeForce GTX 1050 Ti Max-Q:
47.9 fps
100%
GeForce GTX 1050 Ti (Desktop):
50.9 [X] MSI GeForce GTX 1050 Ti Intel Core i7-7740X 4.3GHz
GeForce GTX 1050 Ti (Desktop)
min:
41 fps, max:
78 fps
fps
88%
GeForce GTX 1050 Ti Max-Q:
44.8 fps
100%
GeForce GTX 1050 Ti (Desktop):
35.6 [X] MSI GeForce GTX 1050 Ti Intel Core i7-7740X 4.3GHz
GeForce GTX 1050 Ti (Desktop)
min:
29 fps, max:
55 fps
fps
100%
GeForce GTX 1050 Ti (Desktop):
17.5 [X] MSI GeForce GTX 1050 Ti Intel Core i7-7740X 4.3GHz
GeForce GTX 1050 Ti (Desktop)
min:
13 fps, max:
29 fps
fps
99%
GeForce GTX 1050 Ti Max-Q:
17.3 fps
GeForce GTX 1050 Ti Max-Q:
193.6 fps
GeForce GTX 1050 Ti Max-Q:
128.7 fps
GeForce GTX 1050 Ti Max-Q:
80.5 fps
100%
GeForce GTX 1050 Ti (Desktop):
60 [X] MSI GeForce GTX 1050 Ti Intel Core i7-7740X 4.3GHz
GeForce GTX 1050 Ti (Desktop)
min:
48 fps, max:
93 fps
fps
102%
GeForce GTX 1050 Ti Max-Q:
61 fps
100%
GeForce GTX 1050 Ti (Desktop):
20.3 [X] MSI GeForce GTX 1050 Ti Intel Core i7-7740X 4.3GHz
GeForce GTX 1050 Ti (Desktop)
min:
16 fps, max:
36 fps
fps
108%
GeForce GTX 1050 Ti Max-Q:
22 fps
100%
GeForce GTX 1050 Ti (Desktop):
46.4 [X] MSI GeForce GTX 1050 Ti Intel Core i7-7740X 4.3GHz
GeForce GTX 1050 Ti (Desktop)
min:
37 fps, max:
57 fps
fps
100%
GeForce GTX 1050 Ti (Desktop):
30.7 [X] MSI GeForce GTX 1050 Ti Intel Core i7-7740X 4.3GHz
GeForce GTX 1050 Ti (Desktop)
min:
23 fps, max:
36 fps
fps
GeForce GTX 1050 Ti Max-Q:
64.8 fps
GeForce GTX 1050 Ti Max-Q:
41 fps
GeForce GTX 1050 Ti Max-Q:
37.5 fps
100%
GeForce GTX 1050 Ti (Desktop):
39.1 [X] MSI GeForce GTX 1050 Ti Intel Core i7-7740X 4.3GHz
GeForce GTX 1050 Ti (Desktop)
min:
32 fps, max:
47 fps
fps
92%
GeForce GTX 1050 Ti Max-Q:
35.9 fps
GeForce GTX 1050 Ti Max-Q:
11.3 fps
Iris Plus Graphics 655:
0 (!) fps
GeForce GTX 1050 Ti Max-Q:
118.7 fps
100%
GeForce GTX 1050 Ti (Desktop):
53 [X] MSI GeForce GTX 1050 Ti Intel Core i7-7740X 4.3GHz
GeForce GTX 1050 Ti (Desktop)
min:
34 fps, max:
73 fps
fps
87%
GeForce GTX 1050 Ti Max-Q:
46.3 fps
100%
GeForce GTX 1050 Ti (Desktop):
47.3 [X] MSI GeForce GTX 1050 Ti Intel Core i7-7740X 4.3GHz
GeForce GTX 1050 Ti (Desktop)
min:
34 fps, max:
63 fps
fps
95%
GeForce GTX 1050 Ti Max-Q:
45 fps
100%
GeForce GTX 1050 Ti (Desktop):
41.6 [X] MSI GeForce GTX 1050 Ti Intel Core i7-7740X 4.3GHz
GeForce GTX 1050 Ti (Desktop)
min:
30 fps, max:
57 fps
fps
90%
GeForce GTX 1050 Ti Max-Q:
37.5 fps
GeForce GTX 1050 Ti Max-Q:
10.1 fps
Iris Plus Graphics 655:
13 18 [X] Intel NUC8i7BE Intel Core i7-8559U 2.7GHz
Iris Plus Graphics 655
min:
7 fps, max:
26 fps
~ 16 fps
GeForce GTX 1050 Ti Max-Q:
67 fps
100%
GeForce GTX 1050 Ti (Desktop):
48 [X] MSI GeForce GTX 1050 Ti Intel Core i7-7740X 4.3GHz
GeForce GTX 1050 Ti (Desktop)
min:
18 fps, max:
101 fps
fps
90%
GeForce GTX 1050 Ti Max-Q:
43 fps
100%
GeForce GTX 1050 Ti (Desktop):
40 [X] MSI GeForce GTX 1050 Ti Intel Core i7-7740X 4.3GHz
GeForce GTX 1050 Ti (Desktop)
min:
17 fps, max:
86 fps
fps
85%
GeForce GTX 1050 Ti Max-Q:
34 fps
100%
GeForce GTX 1050 Ti (Desktop):
24 [X] MSI GeForce GTX 1050 Ti Intel Core i7-7740X 4.3GHz
GeForce GTX 1050 Ti (Desktop)
min:
12 fps, max:
54 fps
fps
75%
GeForce GTX 1050 Ti Max-Q:
18 fps
GeForce GTX 1050 Ti Max-Q:
7 fps
100%
GeForce GTX 1050 Ti (Desktop):
133 [X] MSI GeForce GTX 1050 Ti Intel Core i7-7740X 4.3GHz
GeForce GTX 1050 Ti (Desktop)
min:
115 fps, max:
174 fps
fps
19%
Iris Plus Graphics 655:
25 fps
92%
GeForce GTX 1050 Ti Max-Q:
122 fps
100%
GeForce GTX 1050 Ti (Desktop):
69 [X] MSI GeForce GTX 1050 Ti Intel Core i7-7740X 4.3GHz
GeForce GTX 1050 Ti (Desktop)
min:
60 fps, max:
87 fps
fps
0%
Iris Plus Graphics 655:
0 (!) fps
97%
GeForce GTX 1050 Ti Max-Q:
67 fps
100%
GeForce GTX 1050 Ti (Desktop):
64 [X] MSI GeForce GTX 1050 Ti Intel Core i7-7740X 4.3GHz
GeForce GTX 1050 Ti (Desktop)
min:
56 fps, max:
80 fps
fps
95%
GeForce GTX 1050 Ti Max-Q:
61 fps
100%
GeForce GTX 1050 Ti (Desktop):
45 [X] MSI GeForce GTX 1050 Ti Intel Core i7-7740X 4.3GHz
GeForce GTX 1050 Ti (Desktop)
min:
37 fps, max:
58 fps
fps
104%
GeForce GTX 1050 Ti Max-Q:
47 fps
100%
GeForce GTX 1050 Ti (Desktop):
20 [X] MSI GeForce GTX 1050 Ti Intel Core i7-7740X 4.3GHz
GeForce GTX 1050 Ti (Desktop)
min:
13.5 fps, max:
25.2 fps
fps
100%
GeForce GTX 1050 Ti Max-Q:
20 fps
Iris Plus Graphics 655:
82 [X] Intel NUC8i7BE Intel Core i7-8559U 2.7GHz
Iris Plus Graphics 655
min:
70 fps, max:
96 fps
fps
Iris Plus Graphics 655:
45.8 [X] Intel NUC8i7BE Intel Core i7-8559U 2.7GHz
Iris Plus Graphics 655
min:
39 fps, max:
51 fps
fps
Iris Plus Graphics 655:
40.3 [X] Intel NUC8i7BE Intel Core i7-8559U 2.7GHz
Iris Plus Graphics 655
min:
32 fps, max:
48 fps
fps
100%
GeForce GTX 1050 Ti (Desktop):
105 [X] MSI GeForce GTX 1050 Ti Intel Core i7-7740X 4.3GHz
GeForce GTX 1050 Ti (Desktop)
min:
86 fps, max:
113 fps
fps
35%
Iris Plus Graphics 655:
36.7 [X] Intel NUC8i7BE Intel Core i7-8559U 2.7GHz
Iris Plus Graphics 655
min:
30 fps, max:
45 fps
fps
100%
GeForce GTX 1050 Ti (Desktop):
75 [X] MSI GeForce GTX 1050 Ti Intel Core i7-7740X 4.3GHz
GeForce GTX 1050 Ti (Desktop)
min:
60 fps, max:
80 fps
fps
100%
GeForce GTX 1050 Ti (Desktop):
40.1 [X] MSI GeForce GTX 1050 Ti Intel Core i7-7740X 4.3GHz
GeForce GTX 1050 Ti (Desktop)
min:
33 fps, max:
43 fps
fps
GeForce GTX 1050 Ti Max-Q:
97 fps
100%
GeForce GTX 1050 Ti (Desktop):
31 [X] MSI GeForce GTX 1050 Ti Intel Core i7-7740X 4.3GHz
GeForce GTX 1050 Ti (Desktop)
min:
23 fps, max:
61 fps
fps
39%
Iris Plus Graphics 655:
11 13 ~ 12 fps
126%
GeForce GTX 1050 Ti Max-Q:
39 fps
100%
GeForce GTX 1050 Ti (Desktop):
29 [X] MSI GeForce GTX 1050 Ti Intel Core i7-7740X 4.3GHz
GeForce GTX 1050 Ti (Desktop)
min:
23 fps, max:
55 fps
fps
31%
Iris Plus Graphics 655:
8 10.1 ~ 9 fps
121%
GeForce GTX 1050 Ti Max-Q:
35 fps
100%
GeForce GTX 1050 Ti (Desktop):
25 [X] MSI GeForce GTX 1050 Ti Intel Core i7-7740X 4.3GHz
GeForce GTX 1050 Ti (Desktop)
min:
17 fps, max:
47 fps
fps
116%
GeForce GTX 1050 Ti Max-Q:
29 fps
GeForce GTX 1050 Ti Max-Q:
11 fps
100%
GeForce GTX 1050 Ti (Desktop):
169 [X] Aorus Z370 Ultra Gaming Desktop MSI GTX 1050 Ti 1.47.22.14 D3D12
Intel Core i7-8086K 3.7GHz
GeForce GTX 1050 Ti (Desktop)
min:
133 fps, P1:
138 fps, max:
237 fps
fps
24%
Iris Plus Graphics 655:
41.4 fps
100%
GeForce GTX 1050 Ti (Desktop):
66.6 [X] Aorus Z370 Ultra Gaming Desktop MSI GTX 1050 Ti 1.47.22.14 D3D12
Intel Core i7-8086K 3.7GHz
GeForce GTX 1050 Ti (Desktop)
min:
56.2 fps, P1:
57.3 fps, max:
82.7 fps
fps
26%
Iris Plus Graphics 655:
17.6 fps
100%
GeForce GTX 1050 Ti (Desktop):
49.8 [X] Aorus Z370 Ultra Gaming Desktop MSI GTX 1050 Ti 1.47.22.14 D3D12
Intel Core i7-8086K 3.7GHz
GeForce GTX 1050 Ti (Desktop)
min:
39.1 fps, P1:
39.7 fps, max:
71.6 fps
fps
34%
Iris Plus Graphics 655:
16.9 fps
100%
GeForce GTX 1050 Ti (Desktop):
42.5 [X] Aorus Z370 Ultra Gaming Desktop MSI GTX 1050 Ti 1.47.22.14 D3D12
Intel Core i7-8086K 3.7GHz
GeForce GTX 1050 Ti (Desktop)
min:
33.5 fps, P1:
34.4 fps, max:
60 fps
fps
34%
Iris Plus Graphics 655:
14.5 fps
100%
GeForce GTX 1050 Ti (Desktop):
30.2 [X] Aorus Z370 Ultra Gaming Desktop MSI GTX 1050 Ti 1.47.22.14 D3D12
Intel Core i7-8086K 3.7GHz
GeForce GTX 1050 Ti (Desktop)
min:
25.3 fps, P1:
25.6 fps, max:
40.6 fps
fps
100%
GeForce GTX 1050 Ti (Desktop):
17 [X] Aorus Z370 Ultra Gaming Desktop MSI GTX 1050 Ti 1.47.22.14 D3D12
Intel Core i7-8086K 3.7GHz
GeForce GTX 1050 Ti (Desktop)
min:
14.3 fps, P1:
14.7 fps, max:
22.8 fps
fps
100%
GeForce GTX 1050 Ti (Desktop):
136 [X] MSI GeForce GTX 1050 Ti Intel Core i7-7740X 4.3GHz
GeForce GTX 1050 Ti (Desktop)
min:
105 fps, max:
159 fps
fps
33%
Iris Plus Graphics 655:
45 fps
99%
GeForce GTX 1050 Ti Max-Q:
134 fps
100%
GeForce GTX 1050 Ti (Desktop):
80 [X] MSI GeForce GTX 1050 Ti Intel Core i7-7740X 4.3GHz
GeForce GTX 1050 Ti (Desktop)
min:
67 fps, max:
90 fps
fps
29%
Iris Plus Graphics 655:
23 fps
100%
GeForce GTX 1050 Ti Max-Q:
80 fps
100%
GeForce GTX 1050 Ti (Desktop):
63 [X] MSI GeForce GTX 1050 Ti Intel Core i7-7740X 4.3GHz
GeForce GTX 1050 Ti (Desktop)
min:
55 fps, max:
67 fps
fps
27%
Iris Plus Graphics 655:
17 fps
98%
GeForce GTX 1050 Ti Max-Q:
62 fps
100%
GeForce GTX 1050 Ti (Desktop):
42.4 [X] MSI GeForce GTX 1050 Ti Intel Core i7-7740X 4.3GHz
GeForce GTX 1050 Ti (Desktop)
min:
36 fps, max:
46 fps
fps
28%
Iris Plus Graphics 655:
12 12 ~ 12 fps
90%
GeForce GTX 1050 Ti Max-Q:
38 fps
100%
GeForce GTX 1050 Ti (Desktop):
29.5 [X] MSI GeForce GTX 1050 Ti Intel Core i7-7740X 4.3GHz
GeForce GTX 1050 Ti (Desktop)
min:
26 fps, max:
31 fps
fps
100%
GeForce GTX 1050 Ti (Desktop):
18.3 [X] MSI GeForce GTX 1050 Ti Intel Core i7-7740X 4.3GHz
GeForce GTX 1050 Ti (Desktop)
min:
16 fps, max:
19 fps
fps
93%
GeForce GTX 1050 Ti Max-Q:
17 fps
GeForce GTX 1050 Ti Max-Q:
100.3 fps
GeForce GTX 1050 Ti Max-Q:
39.2 fps
GeForce GTX 1050 Ti Max-Q:
34.9 fps
GeForce GTX 1050 Ti Max-Q:
26.8 fps
GeForce GTX 1050 Ti Max-Q:
8.3 fps
Iris Plus Graphics 655:
30.9 fps
GeForce GTX 1050 Ti Max-Q:
60 fps
GeForce GTX 1050 Ti Max-Q:
49.1 fps
GeForce GTX 1050 Ti Max-Q:
45.3 fps
GeForce GTX 1050 Ti Max-Q:
42 fps
GeForce GTX 1050 Ti Max-Q:
14 fps
Iris Plus Graphics 655:
20 22 23 [X] Intel NUC8i7BE Intel Core i7-8559U 2.7GHz
Iris Plus Graphics 655
min:
20 fps, max:
28 fps
~ 22 fps
GeForce GTX 1050 Ti Max-Q:
76 91 91 ~ 86 fps
Iris Plus Graphics 655:
10 11 [X] Intel NUC8i7BE Intel Core i7-8559U 2.7GHz
Iris Plus Graphics 655
min:
10 fps, max:
14 fps
11 ~ 11 fps
GeForce GTX 1050 Ti Max-Q:
45 48 48 ~ 47 fps
Iris Plus Graphics 655:
10 fps
GeForce GTX 1050 Ti Max-Q:
41 44 44 ~ 43 fps
100%
GeForce GTX 1050 Ti (Desktop):
36 [X] MSI GeForce GTX 1050 Ti Intel Core i7-7740X 4.3GHz
GeForce GTX 1050 Ti (Desktop)
min:
32 fps, max:
42 fps
fps
25%
Iris Plus Graphics 655:
9 fps
108%
GeForce GTX 1050 Ti Max-Q:
38 38 41 ~ 39 fps
GeForce GTX 1050 Ti Max-Q:
13 13 14 ~ 13 fps
Iris Plus Graphics 655:
15.7 250 ~ 133 fps
Iris Plus Graphics 655:
40.3 fps
100%
GeForce GTX 1050 Ti (Desktop):
94 [X] Asus Prime X299 Deluxe XMP OC Intel Core i9-9980XE @4.4GHz
GeForce GTX 1050 Ti (Desktop)
102 [X] MSI GeForce GTX 1050 Ti Intel Core i7-7740X 4.3GHz
GeForce GTX 1050 Ti (Desktop)
~ 98 fps
95%
GeForce GTX 1050 Ti Max-Q:
92.7 fps
100%
GeForce GTX 1050 Ti (Desktop):
86 [X] Asus Prime X299 Deluxe XMP OC Intel Core i9-9980XE @4.4GHz
GeForce GTX 1050 Ti (Desktop)
92 [X] MSI GeForce GTX 1050 Ti Intel Core i7-7740X 4.3GHz
GeForce GTX 1050 Ti (Desktop)
~ 89 fps
90%
GeForce GTX 1050 Ti Max-Q:
80.3 fps
100%
GeForce GTX 1050 Ti (Desktop):
74 [X] Asus Prime X299 Deluxe XMP OC Intel Core i9-9980XE @4.4GHz
GeForce GTX 1050 Ti (Desktop)
79 [X] MSI GeForce GTX 1050 Ti Intel Core i7-7740X 4.3GHz
GeForce GTX 1050 Ti (Desktop)
~ 77 fps
90%
GeForce GTX 1050 Ti Max-Q:
69.4 fps
100%
GeForce GTX 1050 Ti (Desktop):
41.7 [X] MSI GeForce GTX 1050 Ti Intel Core i7-7740X 4.3GHz
GeForce GTX 1050 Ti (Desktop)
fps
95%
GeForce GTX 1050 Ti Max-Q:
39.5 fps
100%
GeForce GTX 1050 Ti (Desktop):
35.2 [X] Intel Core i7-4790K 4GHz
GeForce GTX 1050 Ti (Desktop)
min:
28 fps, max:
41 fps
fps
100%
GeForce GTX 1050 Ti (Desktop):
26.6 [X] Intel Core i7-4790K 4GHz
GeForce GTX 1050 Ti (Desktop)
min:
20 fps, max:
32 fps
fps
100%
GeForce GTX 1050 Ti (Desktop):
62 [X] Intel Core i7-4790K 4GHz
GeForce GTX 1050 Ti (Desktop)
min:
41 fps, max:
78 fps
fps
110%
GeForce GTX 1050 Ti Max-Q:
61.5 75.1 ~ 68 fps
100%
GeForce GTX 1050 Ti (Desktop):
33.3 [X] Intel Core i7-4790K 4GHz
GeForce GTX 1050 Ti (Desktop)
min:
26 fps, max:
45 fps
fps
111%
GeForce GTX 1050 Ti Max-Q:
36.6 37.7 ~ 37 fps
100%
GeForce GTX 1050 Ti (Desktop):
22.7 [X] Intel Core i7-4790K 4GHz
GeForce GTX 1050 Ti (Desktop)
max:
36 fps
fps
106%
GeForce GTX 1050 Ti Max-Q:
23.3 25 ~ 24 fps
GeForce GTX 1050 Ti Max-Q:
9.2 fps
Iris Plus Graphics 655:
51.5 fps
Iris Plus Graphics 655:
21.6 fps
100%
GeForce GTX 1050 Ti (Desktop):
65 [X] Intel Core i7-4790K 4GHz
GeForce GTX 1050 Ti (Desktop)
min:
53 fps, max:
78 fps
fps
100%
GeForce GTX 1050 Ti (Desktop):
44.8 [X] Intel Core i7-4790K 4GHz
GeForce GTX 1050 Ti (Desktop)
min:
36 fps, max:
55 fps
fps
100%
GeForce GTX 1050 Ti (Desktop):
12.5 [X] Intel Core i7-4790K 4GHz
GeForce GTX 1050 Ti (Desktop)
min:
9 fps, max:
15 fps
fps
GeForce GTX 1050 Ti Max-Q:
92.3 fps
GeForce GTX 1050 Ti Max-Q:
42 fps
GeForce GTX 1050 Ti Max-Q:
34.3 fps
GeForce GTX 1050 Ti Max-Q:
30.4 fps
Iris Plus Graphics 655:
13 fps
GeForce GTX 1050 Ti Max-Q:
58 fps
GeForce GTX 1050 Ti Max-Q:
41 fps
GeForce GTX 1050 Ti Max-Q:
33 fps
GeForce GTX 1050 Ti Max-Q:
27 fps
GeForce GTX 1050 Ti Max-Q:
13 fps
GeForce GTX 1050 Ti Max-Q:
119.5 fps
GeForce GTX 1050 Ti Max-Q:
69.4 fps
GeForce GTX 1050 Ti Max-Q:
64.3 fps
GeForce GTX 1050 Ti Max-Q:
57.9 fps
GeForce GTX 1050 Ti Max-Q:
18.9 fps
Iris Plus Graphics 655:
30 fps
GeForce GTX 1050 Ti Max-Q:
105 fps
Iris Plus Graphics 655:
18 fps
GeForce GTX 1050 Ti Max-Q:
55 fps
Iris Plus Graphics 655:
14 fps
GeForce GTX 1050 Ti Max-Q:
41 fps
Iris Plus Graphics 655:
9 fps
GeForce GTX 1050 Ti Max-Q:
31 fps
GeForce GTX 1050 Ti Max-Q:
13 fps
100%
GeForce GTX 1050 Ti (Desktop):
127 [X] Intel Core i7-4790K 4GHz
GeForce GTX 1050 Ti (Desktop)
min:
85 fps, max:
144 fps
fps
100%
GeForce GTX 1050 Ti (Desktop):
55.1 [X] Intel Core i7-4790K 4GHz
GeForce GTX 1050 Ti (Desktop)
min:
43 fps, max:
64 fps
fps
100%
GeForce GTX 1050 Ti (Desktop):
49.5 [X] Intel Core i7-4790K 4GHz
GeForce GTX 1050 Ti (Desktop)
min:
38 fps, max:
57 fps
fps
100%
GeForce GTX 1050 Ti (Desktop):
35.5 [X] Intel Core i7-4790K 4GHz
GeForce GTX 1050 Ti (Desktop)
min:
25 fps, max:
40 fps
fps
100%
GeForce GTX 1050 Ti (Desktop):
11.4 [X] Intel Core i7-4790K 4GHz
GeForce GTX 1050 Ti (Desktop)
min:
8 fps, max:
13 fps
fps
Iris Plus Graphics 655:
128 fps
GeForce GTX 1050 Ti Max-Q:
129.8 fps
Iris Plus Graphics 655:
125 fps
GeForce GTX 1050 Ti Max-Q:
123.6 fps
Iris Plus Graphics 655:
113 fps
GeForce GTX 1050 Ti Max-Q:
115.7 fps
Iris Plus Graphics 655:
57.8 fps
GeForce GTX 1050 Ti Max-Q:
112.6 fps
Iris Plus Graphics 655:
34.4 fps
GeForce GTX 1050 Ti Max-Q:
65.2 fps
GeForce GTX 1050 Ti Max-Q:
249.1 fps
GeForce GTX 1050 Ti Max-Q:
169.1 fps
100%
GeForce GTX 1050 Ti (Desktop):
52.2 [X] MSI GeForce GTX 1050 Ti Intel Core i7-7740X 4.3GHz
GeForce GTX 1050 Ti (Desktop)
min:
38 fps, max:
74 fps
fps
216%
GeForce GTX 1050 Ti Max-Q:
112.5 fps
100%
GeForce GTX 1050 Ti (Desktop):
30.7 [X] MSI GeForce GTX 1050 Ti Intel Core i7-7740X 4.3GHz
GeForce GTX 1050 Ti (Desktop)
min:
24 fps, max:
43 fps
fps
138%
GeForce GTX 1050 Ti Max-Q:
42.3 fps
100%
GeForce GTX 1050 Ti (Desktop):
143 [X] Intel Core i7-4790K 4GHz
GeForce GTX 1050 Ti (Desktop)
fps
100%
GeForce GTX 1050 Ti Max-Q:
142.4 fps
GeForce GTX 1050 Ti Max-Q:
85.6 fps
100%
GeForce GTX 1050 Ti (Desktop):
82 [X] Intel Core i7-4790K 4GHz
GeForce GTX 1050 Ti (Desktop)
min:
66 fps, max:
105 fps
fps
83%
GeForce GTX 1050 Ti Max-Q:
68.3 fps
100%
GeForce GTX 1050 Ti (Desktop):
66.6 [X] Intel Core i7-4790K 4GHz
GeForce GTX 1050 Ti (Desktop)
min:
56 fps, max:
84 fps
fps
88%
GeForce GTX 1050 Ti Max-Q:
58.9 fps
100%
GeForce GTX 1050 Ti (Desktop):
23 [X] Intel Core i7-4790K 4GHz
GeForce GTX 1050 Ti (Desktop)
min:
19 fps, max:
29 fps
fps
94%
GeForce GTX 1050 Ti Max-Q:
21.7 fps
100%
GeForce GTX 1050 Ti (Desktop):
30 [X] Intel Core i7-4790K 4GHz
GeForce GTX 1050 Ti (Desktop)
min:
23 fps, max:
43 fps
fps
100%
GeForce GTX 1050 Ti (Desktop):
25.9 [X] Intel Core i7-4790K 4GHz
GeForce GTX 1050 Ti (Desktop)
min:
20 fps, max:
37 fps
fps
100%
GeForce GTX 1050 Ti (Desktop):
52.7 [X] Intel Core i7-4790K 4GHz
GeForce GTX 1050 Ti (Desktop)
min:
40 fps, max:
71 fps
fps
100%
GeForce GTX 1050 Ti (Desktop):
34.8 [X] Intel Core i7-4790K 4GHz
GeForce GTX 1050 Ti (Desktop)
min:
30 fps, max:
46 fps
fps
100%
GeForce GTX 1050 Ti (Desktop):
31.4 [X] Intel Core i7-4790K 4GHz
GeForce GTX 1050 Ti (Desktop)
min:
28 fps, max:
40 fps
fps
100%
GeForce GTX 1050 Ti (Desktop):
13.2 [X] Intel Core i7-4790K 4GHz
GeForce GTX 1050 Ti (Desktop)
min:
12 fps, max:
16 fps
fps
Iris Plus Graphics 655:
20.4 22.7 [X] Intel NUC8i7BE Intel Core i7-8559U 2.7GHz
Iris Plus Graphics 655
min:
15 fps, max:
27 fps
~ 22 fps
GeForce GTX 1050 Ti Max-Q:
68.6 96.7 ~ 83 fps
Iris Plus Graphics 655:
10.2 fps
GeForce GTX 1050 Ti Max-Q:
13.9 14.5 ~ 14 fps
100%
GeForce GTX 1050 Ti (Desktop):
198 [X] Intel Core i7-4790K 4GHz
GeForce GTX 1050 Ti (Desktop)
min:
152 fps, max:
257 fps
fps
11%
Iris Plus Graphics 655:
0 (!) 41.3 [X] Intel NUC8i7BE Intel Core i7-8559U 2.7GHz
Iris Plus Graphics 655
min:
31 fps, max:
65 fps
~ 21 fps
74%
GeForce GTX 1050 Ti Max-Q:
113.6 179.3 ~ 146 fps
100%
GeForce GTX 1050 Ti (Desktop):
71.4 [X] Intel Core i7-4790K 4GHz
GeForce GTX 1050 Ti (Desktop)
min:
58 fps, max:
83 fps
fps
23%
Iris Plus Graphics 655:
16.1 [X] Intel NUC8i7BE Intel Core i7-8559U 2.7GHz
Iris Plus Graphics 655
min:
13 fps, max:
21 fps
fps
92%
GeForce GTX 1050 Ti Max-Q:
63.8 68.2 ~ 66 fps
100%
GeForce GTX 1050 Ti (Desktop):
68 [X] Intel Core i7-4790K 4GHz
GeForce GTX 1050 Ti (Desktop)
min:
54 fps, max:
81 fps
fps
96%
GeForce GTX 1050 Ti Max-Q:
64.9 65.5 ~ 65 fps
100%
GeForce GTX 1050 Ti (Desktop):
48.9 [X] Intel Core i7-4790K 4GHz
GeForce GTX 1050 Ti (Desktop)
min:
35 fps, max:
67 fps
fps
102%
GeForce GTX 1050 Ti Max-Q:
49.5 50.4 ~ 50 fps
100%
GeForce GTX 1050 Ti (Desktop):
19.7 [X] Intel Core i7-4790K 4GHz
GeForce GTX 1050 Ti (Desktop)
min:
15 fps, max:
43 fps
fps
96%
GeForce GTX 1050 Ti Max-Q:
19.2 19.2 ~ 19 fps
100%
GeForce GTX 1050 Ti (Desktop):
70 [X] Intel Core i7-4790K 4GHz
GeForce GTX 1050 Ti (Desktop)
min:
56 fps, max:
81 fps
fps
100%
GeForce GTX 1050 Ti (Desktop):
58.4 [X] Intel Core i7-4790K 4GHz
GeForce GTX 1050 Ti (Desktop)
min:
48 fps, max:
68 fps
fps
100%
GeForce GTX 1050 Ti (Desktop):
18.6 [X] Intel Core i7-4790K 4GHz
GeForce GTX 1050 Ti (Desktop)
min:
15 fps, max:
23 fps
fps
100%
GeForce GTX 1050 Ti (Desktop):
45.4 [X] Intel Core i7-4790K 4GHz
GeForce GTX 1050 Ti (Desktop)
min:
40 fps, max:
51 fps
fps
100%
GeForce GTX 1050 Ti (Desktop):
28.5 [X] Intel Core i7-4790K 4GHz
GeForce GTX 1050 Ti (Desktop)
min:
22 fps, max:
34 fps
fps
100%
GeForce GTX 1050 Ti (Desktop):
15.2 [X] Intel Core i7-4790K 4GHz
GeForce GTX 1050 Ti (Desktop)
min:
13 fps, max:
19 fps
fps
100%
GeForce GTX 1050 Ti (Desktop):
82 [X] Intel Core i7-4790K 4GHz
GeForce GTX 1050 Ti (Desktop)
min:
70 fps, max:
99 fps
fps
100%
GeForce GTX 1050 Ti (Desktop):
73 [X] Intel Core i7-4790K 4GHz
GeForce GTX 1050 Ti (Desktop)
min:
64 fps, max:
88 fps
fps
100%
GeForce GTX 1050 Ti (Desktop):
41.1 [X] Intel Core i7-4790K 4GHz
GeForce GTX 1050 Ti (Desktop)
min:
32 fps, max:
50 fps
fps
100%
GeForce GTX 1050 Ti (Desktop):
38.7 [X] Intel Core i7-4790K 4GHz
GeForce GTX 1050 Ti (Desktop)
min:
32 fps, max:
48 fps
fps
100%
GeForce GTX 1050 Ti (Desktop):
21.9 [X] Intel Core i7-4790K 4GHz
GeForce GTX 1050 Ti (Desktop)
min:
17 fps, max:
27 fps
fps
100%
GeForce GTX 1050 Ti (Desktop):
60.5 [X] Intel Core i7-4790K 4GHz
GeForce GTX 1050 Ti (Desktop)
min:
43 fps, max:
98 fps
fps
100%
GeForce GTX 1050 Ti (Desktop):
26.1 [X] Intel Core i7-4790K 4GHz
GeForce GTX 1050 Ti (Desktop)
min:
19 fps, max:
40 fps
fps
100%
GeForce GTX 1050 Ti (Desktop):
62 [X] Intel Core i7-4790K 4GHz
GeForce GTX 1050 Ti (Desktop)
min:
51 fps, max:
80 fps
fps
100%
GeForce GTX 1050 Ti (Desktop):
56.6 [X] Intel Core i7-4790K 4GHz
GeForce GTX 1050 Ti (Desktop)
min:
46 fps, max:
72 fps
fps
100%
GeForce GTX 1050 Ti (Desktop):
18.5 [X] Intel Core i7-4790K 4GHz
GeForce GTX 1050 Ti (Desktop)
min:
15 fps, max:
23 fps
fps
GeForce GTX 1050 Ti Max-Q:
137.3 fps
100%
GeForce GTX 1050 Ti (Desktop):
113 [X] Intel Core i7-4790K 4GHz
GeForce GTX 1050 Ti (Desktop)
min:
105 fps, max:
141 fps
fps
93%
GeForce GTX 1050 Ti Max-Q:
104.6 fps
100%
GeForce GTX 1050 Ti (Desktop):
51.1 [X] Intel Core i7-4790K 4GHz
GeForce GTX 1050 Ti (Desktop)
min:
47 fps, max:
63 fps
fps
100%
GeForce GTX 1050 Ti (Desktop):
199 [X] Intel Core i7-4790K 4GHz
GeForce GTX 1050 Ti (Desktop)
min:
195 fps, max:
201 fps
fps
61%
GeForce GTX 1050 Ti Max-Q:
89.5 154.8 ~ 122 fps
100%
GeForce GTX 1050 Ti (Desktop):
144 [X] Intel Core i7-4790K 4GHz
GeForce GTX 1050 Ti (Desktop)
min:
137 fps, max:
159 fps
fps
72%
GeForce GTX 1050 Ti Max-Q:
85.2 120 ~ 103 fps
100%
GeForce GTX 1050 Ti (Desktop):
69 [X] Intel Core i7-4790K 4GHz
GeForce GTX 1050 Ti (Desktop)
min:
62 fps, max:
73 fps
fps
80%
GeForce GTX 1050 Ti Max-Q:
51.7 58.1 ~ 55 fps
100%
GeForce GTX 1050 Ti (Desktop):
62.4 [X] Intel Core i7-4790K 4GHz
GeForce GTX 1050 Ti (Desktop)
min:
53 fps, max:
68 fps
fps
82%
GeForce GTX 1050 Ti Max-Q:
49.8 53.1 ~ 51 fps
100%
GeForce GTX 1050 Ti (Desktop):
25.2 [X] Intel Core i7-4790K 4GHz
GeForce GTX 1050 Ti (Desktop)
min:
21 fps, max:
27 fps
fps
83%
GeForce GTX 1050 Ti Max-Q:
20.7 21.1 ~ 21 fps
GeForce GTX 1050 Ti Max-Q:
112.5 fps
GeForce GTX 1050 Ti Max-Q:
85.8 fps
100%
GeForce GTX 1050 Ti (Desktop):
57.5 [X] Intel Core i7-4790K 4GHz
GeForce GTX 1050 Ti (Desktop)
min:
42 fps, max:
86 fps
fps
89%
GeForce GTX 1050 Ti Max-Q:
51 fps
100%
GeForce GTX 1050 Ti (Desktop):
47.3 [X] Intel Core i7-4790K 4GHz
GeForce GTX 1050 Ti (Desktop)
min:
36 fps, max:
71 fps
fps
91%
GeForce GTX 1050 Ti Max-Q:
43 fps
100%
GeForce GTX 1050 Ti (Desktop):
36.3 [X] Intel Core i7-4790K 4GHz
GeForce GTX 1050 Ti (Desktop)
min:
29 fps, max:
53 fps
fps
100%
GeForce GTX 1050 Ti (Desktop):
68.2 [X] Intel Core i7-4790K 4GHz
GeForce GTX 1050 Ti (Desktop)
min:
61 fps, max:
79 fps
fps
100%
GeForce GTX 1050 Ti (Desktop):
41.8 [X] Intel Core i7-4790K 4GHz
GeForce GTX 1050 Ti (Desktop)
min:
37 fps, max:
49 fps
fps
100%
GeForce GTX 1050 Ti (Desktop):
22.1 [X] Intel Core i7-4790K 4GHz
GeForce GTX 1050 Ti (Desktop)
min:
19 fps, max:
25 fps
fps
100%
GeForce GTX 1050 Ti (Desktop):
187 [X] Intel Core i7-4790K 4GHz
GeForce GTX 1050 Ti (Desktop)
min:
135 fps, max:
215 fps
fps
100%
GeForce GTX 1050 Ti (Desktop):
72 [X] Intel Core i7-4790K 4GHz
GeForce GTX 1050 Ti (Desktop)
min:
55 fps, max:
78 fps
fps
Iris Plus Graphics 655:
28.7 [X] Intel NUC8i7BE Intel Core i7-8559U 2.7GHz
Iris Plus Graphics 655
min:
2.6 fps, max:
41.3 fps
fps
100%
GeForce GTX 1050 Ti (Desktop):
61.4 [X] Intel Core i7-4790K 4GHz
GeForce GTX 1050 Ti (Desktop)
min:
49 fps, max:
78 fps
fps
34%
Iris Plus Graphics 655:
21.1 [X] Intel NUC8i7BE Intel Core i7-8559U 2.7GHz
Iris Plus Graphics 655
min:
16 fps, max:
29 fps
fps
100%
GeForce GTX 1050 Ti (Desktop):
32.7 [X] Intel Core i7-4790K 4GHz
GeForce GTX 1050 Ti (Desktop)
min:
27 fps, max:
39 fps
fps
100%
GeForce GTX 1050 Ti (Desktop):
22.8 [X] Intel Core i7-4790K 4GHz
GeForce GTX 1050 Ti (Desktop)
min:
18 fps, max:
28 fps
fps
100%
GeForce GTX 1050 Ti (Desktop):
79 [X] Intel Core i7-4790K 4GHz
GeForce GTX 1050 Ti (Desktop)
min:
51 fps, max:
104 fps
fps
100%
GeForce GTX 1050 Ti (Desktop):
44.6 [X] Intel Core i7-4790K 4GHz
GeForce GTX 1050 Ti (Desktop)
min:
36 fps, max:
53 fps
fps
100%
GeForce GTX 1050 Ti (Desktop):
20.7 [X] Intel Core i7-4790K 4GHz
GeForce GTX 1050 Ti (Desktop)
min:
15 fps, max:
25 fps
fps
100%
GeForce GTX 1050 Ti (Desktop):
46.5 [X] Intel Core i7-4790K 4GHz
GeForce GTX 1050 Ti (Desktop)
min:
43 fps, max:
50 fps
fps
Iris Plus Graphics 655:
91 fps
GeForce GTX 1050 Ti Max-Q:
285.4 fps
Iris Plus Graphics 655:
68 fps
GeForce GTX 1050 Ti Max-Q:
233.9 fps
100%
GeForce GTX 1050 Ti (Desktop):
114 [X] Intel Core i7-4790K 4GHz
GeForce GTX 1050 Ti (Desktop)
min:
94 fps, max:
132 fps
fps
26%
Iris Plus Graphics 655:
29.9 fps
103%
GeForce GTX 1050 Ti Max-Q:
117.7 fps
100%
GeForce GTX 1050 Ti (Desktop):
68 [X] Intel Core i7-4790K 4GHz
GeForce GTX 1050 Ti (Desktop)
min:
58 fps, max:
82 fps
fps
27%
Iris Plus Graphics 655:
18.2 fps
104%
GeForce GTX 1050 Ti Max-Q:
70.5 fps
100%
GeForce GTX 1050 Ti (Desktop):
35.6 [X] Intel Core i7-4790K 4GHz
GeForce GTX 1050 Ti (Desktop)
min:
31 fps, max:
42 fps
fps
104%
GeForce GTX 1050 Ti Max-Q:
37 fps
100%
GeForce GTX 1050 Ti (Desktop):
69 [X] Intel Core i7-4790K 4GHz
GeForce GTX 1050 Ti (Desktop)
min:
58 fps, max:
94 fps
fps
100%
GeForce GTX 1050 Ti (Desktop):
23.3 [X] OGL
Intel Core i7-4790K 4GHz
GeForce GTX 1050 Ti (Desktop)
min:
19 fps, max:
31 fps
fps
Iris Plus Graphics 655:
19.4 fps
GeForce GTX 1050 Ti Max-Q:
63 fps
100%
GeForce GTX 1050 Ti (Desktop):
40.4 [X] DX12
Intel Core i7-4790K 4GHz
GeForce GTX 1050 Ti (Desktop)
42.9 [X] DX11
Intel Core i7-4790K 4GHz
GeForce GTX 1050 Ti (Desktop)
43.9 ~ 42 fps
27%
Iris Plus Graphics 655:
11.3 fps
98%
GeForce GTX 1050 Ti Max-Q:
41.3 fps
100%
GeForce GTX 1050 Ti (Desktop):
37.9 [X] DX11
Intel Core i7-4790K 4GHz
GeForce GTX 1050 Ti (Desktop)
39.1 ~ 39 fps
27%
Iris Plus Graphics 655:
10.5 fps
92%
GeForce GTX 1050 Ti Max-Q:
35.8 fps
100%
GeForce GTX 1050 Ti (Desktop):
12.8 [X] DX12
Intel Core i7-4790K 4GHz
GeForce GTX 1050 Ti (Desktop)
fps
123%
GeForce GTX 1050 Ti Max-Q:
15.7 fps
100%
GeForce GTX 1050 Ti (Desktop):
88 [X] Intel Core i7-4790K 4GHz
GeForce GTX 1050 Ti (Desktop)
min:
61 fps, max:
107 fps
fps
100%
GeForce GTX 1050 Ti (Desktop):
34.5 [X] DX11
Intel Core i7-4790K 4GHz
GeForce GTX 1050 Ti (Desktop)
min:
25 fps, max:
44 fps
fps
100%
GeForce GTX 1050 Ti (Desktop):
32.7 [X] DX11
Intel Core i7-4790K 4GHz
GeForce GTX 1050 Ti (Desktop)
min:
23 fps, max:
42 fps
fps
Iris Plus Graphics 655:
34.2 fps
Iris Plus Graphics 655:
21.2 fps
GeForce GTX 1050 Ti Max-Q:
83.4 89.5 ~ 86 fps
GeForce GTX 1050 Ti Max-Q:
41.9 42.5 ~ 42 fps
GeForce GTX 1050 Ti Max-Q:
32.2 34.8 ~ 34 fps
GeForce GTX 1050 Ti Max-Q:
14.6 15.7 ~ 15 fps
100%
GeForce GTX 1050 Ti (Desktop):
135 [X] Intel Core i7-4790K 4GHz
GeForce GTX 1050 Ti (Desktop)
min:
118 fps, max:
151 fps
fps
100%
GeForce GTX 1050 Ti (Desktop):
61 [X] Intel Core i7-4790K 4GHz
GeForce GTX 1050 Ti (Desktop)
min:
56 fps, max:
68 fps
fps
100%
GeForce GTX 1050 Ti (Desktop):
54 [X] Intel Core i7-4790K 4GHz
GeForce GTX 1050 Ti (Desktop)
min:
49 fps, max:
60 fps
fps
100%
GeForce GTX 1050 Ti (Desktop):
41 [X] Intel Core i7-4790K 4GHz
GeForce GTX 1050 Ti (Desktop)
min:
32 fps, max:
49 fps
fps
Iris Plus Graphics 655:
25.9 39.2 ~ 33 fps
Iris Plus Graphics 655:
17.6 22.3 ~ 20 fps
100%
GeForce GTX 1050 Ti (Desktop):
48.9 [X] Intel Core i7-4790K 4GHz
GeForce GTX 1050 Ti (Desktop)
min:
45 fps, max:
53 fps
fps
22%
Iris Plus Graphics 655:
10.8 fps
100%
GeForce GTX 1050 Ti (Desktop):
40.7 [X] Intel Core i7-4790K 4GHz
GeForce GTX 1050 Ti (Desktop)
min:
37 fps, max:
45 fps
fps
22%
Iris Plus Graphics 655:
8.9 fps
GeForce GTX 1050 Ti Max-Q:
16.8 17.1 ~ 17 fps
100%
GeForce GTX 1050 Ti (Desktop):
272 [X] Intel Core i7-4790K 4GHz
GeForce GTX 1050 Ti (Desktop)
fps
28%
Iris Plus Graphics 655:
75.8 [X] Intel NUC8i7BE Intel Core i7-8559U 2.7GHz
Iris Plus Graphics 655
min:
12 fps, max:
128 fps
fps
92%
GeForce GTX 1050 Ti Max-Q:
236.6 263.6 ~ 250 fps
100%
GeForce GTX 1050 Ti (Desktop):
181 [X] Intel Core i7-4790K 4GHz
GeForce GTX 1050 Ti (Desktop)
min:
103 fps, max:
275 fps
fps
0%
Iris Plus Graphics 655:
0 (!) [X] Intel NUC8i7BE Intel Core i7-8559U 2.7GHz
Iris Plus Graphics 655
fps
87%
GeForce GTX 1050 Ti Max-Q:
154.6 162.2 ~ 158 fps
100%
GeForce GTX 1050 Ti (Desktop):
95 [X] Intel Core i7-4790K 4GHz
GeForce GTX 1050 Ti (Desktop)
min:
63 fps, max:
148 fps
fps
96%
GeForce GTX 1050 Ti Max-Q:
90.2 92.7 ~ 91 fps
100%
GeForce GTX 1050 Ti (Desktop):
79 [X] Intel Core i7-4790K 4GHz
GeForce GTX 1050 Ti (Desktop)
min:
56 fps, max:
104 fps
fps
82%
GeForce GTX 1050 Ti Max-Q:
62.5 67.5 ~ 65 fps
GeForce GTX 1050 Ti Max-Q:
27.7 29.3 ~ 29 fps
100%
GeForce GTX 1050 Ti (Desktop):
61 [X] Intel Core i7-4790K 4GHz
GeForce GTX 1050 Ti (Desktop)
min:
52 fps, max:
74 fps
fps
100%
GeForce GTX 1050 Ti (Desktop):
21.6 [X] Intel Core i7-4790K 4GHz
GeForce GTX 1050 Ti (Desktop)
min:
18 fps, max:
26 fps
fps
100%
GeForce GTX 1050 Ti (Desktop):
52.6 [X] Intel Core i7-4790K 4GHz
GeForce GTX 1050 Ti (Desktop)
min:
48 fps, max:
58 fps
fps
100%
GeForce GTX 1050 Ti (Desktop):
22.9 [X] Intel Core i7-4790K 4GHz
GeForce GTX 1050 Ti (Desktop)
min:
18 fps, max:
27 fps
fps
100%
GeForce GTX 1050 Ti (Desktop):
46.4 [X] Intel Core i7-4790K 4GHz
GeForce GTX 1050 Ti (Desktop)
min:
38 fps, max:
58 fps
fps
100%
GeForce GTX 1050 Ti (Desktop):
61.8 [X] Intel Core i7-4790K 4GHz
GeForce GTX 1050 Ti (Desktop)
min:
56 fps, max:
66 fps
fps
100%
GeForce GTX 1050 Ti (Desktop):
20.7 [X] Intel Core i7-4790K 4GHz
GeForce GTX 1050 Ti (Desktop)
min:
17 fps, max:
23 fps
fps
GeForce GTX 1050 Ti Max-Q:
168.6 fps
GeForce GTX 1050 Ti Max-Q:
143.9 fps
GeForce GTX 1050 Ti Max-Q:
112.7 fps
100%
GeForce GTX 1050 Ti (Desktop):
113 [X] Intel Core i7-4790K 4GHz
GeForce GTX 1050 Ti (Desktop)
min:
86 fps, max:
152 fps
fps
89%
GeForce GTX 1050 Ti Max-Q:
101 fps
100%
GeForce GTX 1050 Ti (Desktop):
35.7 [X] Intel Core i7-4790K 4GHz
GeForce GTX 1050 Ti (Desktop)
min:
22 fps, max:
54 fps
fps
96%
GeForce GTX 1050 Ti Max-Q:
34.4 fps
100%
GeForce GTX 1050 Ti (Desktop):
79 [X] Intel Core i7-4790K 4GHz
GeForce GTX 1050 Ti (Desktop)
min:
72 fps, max:
87 fps
fps
100%
GeForce GTX 1050 Ti (Desktop):
26.9 [X] Intel Core i7-4790K 4GHz
GeForce GTX 1050 Ti (Desktop)
min:
24 fps, max:
30 fps
fps
100%
GeForce GTX 1050 Ti (Desktop):
178 [X] Asus Prime X299 Deluxe XMP OC Intel Core i9-9980XE @4.4GHz
GeForce GTX 1050 Ti (Desktop)
min:
153.9 fps
fps
63%
GeForce GTX 1050 Ti Max-Q:
111.9 fps
100%
GeForce GTX 1050 Ti (Desktop):
161 [X] Asus Prime X299 Deluxe XMP OC Intel Core i9-9980XE @4.4GHz
GeForce GTX 1050 Ti (Desktop)
min:
141.3 fps
fps
65%
GeForce GTX 1050 Ti Max-Q:
104.2 fps
100%
GeForce GTX 1050 Ti (Desktop):
141 [X] Asus Prime X299 Deluxe XMP OC Intel Core i9-9980XE @4.4GHz
GeForce GTX 1050 Ti (Desktop)
min:
123.3 fps
fps
70%
GeForce GTX 1050 Ti Max-Q:
98.1 fps
100%
GeForce GTX 1050 Ti (Desktop):
125 [X] Asus Prime X299 Deluxe XMP OC Intel Core i9-9980XE @4.4GHz
GeForce GTX 1050 Ti (Desktop)
min:
107.3 fps
fps
75%
GeForce GTX 1050 Ti Max-Q:
93.5 fps
100%
GeForce GTX 1050 Ti (Desktop):
63 [X] Intel Core i7-4790K 4GHz
GeForce GTX 1050 Ti (Desktop)
min:
58 fps
fps
19%
Iris Plus Graphics 655:
11.6 12.2 ~ 12 fps
73%
GeForce GTX 1050 Ti Max-Q:
46 fps
Iris Plus Graphics 655:
14.6 17.8 ~ 16 fps
100%
GeForce GTX 1050 Ti (Desktop):
49.4 [X] Intel Core i7-4790K 4GHz
GeForce GTX 1050 Ti (Desktop)
min:
41 fps, max:
54 fps
fps
22%
Iris Plus Graphics 655:
10.1 10.9 ~ 11 fps
100%
GeForce GTX 1050 Ti (Desktop):
24 27.5 [X] Intel Core i7-4790K 4GHz
GeForce GTX 1050 Ti (Desktop)
min:
22 fps, max:
32 fps
~ 26 fps
23%
Iris Plus Graphics 655:
5.6 5.6 ~ 6 fps
100%
GeForce GTX 1050 Ti (Desktop):
62.1 [X] Intel Core i7-4790K 4GHz
GeForce GTX 1050 Ti (Desktop)
min:
51 fps, max:
75 fps
fps
100%
GeForce GTX 1050 Ti (Desktop):
52.7 [X] Intel Core i7-4790K 4GHz
GeForce GTX 1050 Ti (Desktop)
min:
46 fps, max:
67 fps
fps
100%
GeForce GTX 1050 Ti (Desktop):
176 [X] Aorus Z370 Ultra Gaming Desktop MSI GTX 1050 Ti Intel Core i7-8086K 3.7GHz
GeForce GTX 1050 Ti (Desktop)
min:
3.93 fps, P1:
125 fps, max:
337 fps
fps
35%
Iris Plus Graphics 655:
57 61 68 [X] Intel NUC8i7BE Intel Core i7-8559U 2.7GHz
Iris Plus Graphics 655
min:
17.5 fps, P1:
40 fps, max:
131 fps
~ 62 fps
85%
GeForce GTX 1050 Ti Max-Q:
150.4 fps
100%
GeForce GTX 1050 Ti (Desktop):
169 [X] Aorus Z370 Ultra Gaming Desktop MSI GTX 1050 Ti Intel Core i7-8086K 3.7GHz
GeForce GTX 1050 Ti (Desktop)
min:
20.6 fps, P1:
125 fps, max:
258 fps
fps
33%
Iris Plus Graphics 655:
51.2 51.8 62.1 [X] Intel NUC8i7BE Intel Core i7-8559U 2.7GHz
Iris Plus Graphics 655
min:
15.1 fps, P1:
37 fps, max:
117 fps
~ 55 fps
85%
GeForce GTX 1050 Ti Max-Q:
143.3 fps
100%
GeForce GTX 1050 Ti (Desktop):
88.8 [X] Aorus Z370 Ultra Gaming Desktop MSI GTX 1050 Ti Intel Core i7-8086K 3.7GHz
GeForce GTX 1050 Ti (Desktop)
min:
10.1 fps, P1:
62.5 fps, max:
163 fps
fps
17%
Iris Plus Graphics 655:
13.7 14.3 15.8 [X] Intel NUC8i7BE Intel Core i7-8559U 2.7GHz
Iris Plus Graphics 655
min:
8.44 fps, P1:
11.9 fps, max:
85.5 fps
~ 15 fps
89%
GeForce GTX 1050 Ti Max-Q:
78.9 fps
100%
GeForce GTX 1050 Ti (Desktop):
36.4 [X] Intel Core i7-4790K 4GHz
GeForce GTX 1050 Ti (Desktop)
min:
22.1 fps, max:
102 fps
41.2 [X] Aorus Z370 Ultra Gaming Desktop MSI GTX 1050 Ti Intel Core i7-8086K 3.7GHz
GeForce GTX 1050 Ti (Desktop)
min:
6.32 fps, P1:
27.8 fps, max:
110 fps
~ 39 fps
15%
Iris Plus Graphics 655:
5.2 5.5 6.2 [X] Intel NUC8i7BE Intel Core i7-8559U 2.7GHz
Iris Plus Graphics 655
min:
3.37 fps, P1:
4.2 fps, max:
28.7 fps
~ 6 fps
88%
GeForce GTX 1050 Ti Max-Q:
34.5 fps
100%
GeForce GTX 1050 Ti (Desktop):
29.4 [X] Aorus Z370 Ultra Gaming Desktop MSI GTX 1050 Ti Intel Core i7-8086K 3.7GHz
GeForce GTX 1050 Ti (Desktop)
min:
5.25 fps, P1:
20.8 fps, max:
79.5 fps
fps
14%
Iris Plus Graphics 655:
4.2 [X] Intel NUC8i7BE Intel Core i7-8559U 2.7GHz
Iris Plus Graphics 655
min:
2.38 fps, P1:
2.82 fps, max:
99 fps
fps
100%
GeForce GTX 1050 Ti (Desktop):
27.8 [X] Aorus Z370 Ultra Gaming Desktop MSI GTX 1050 Ti Intel Core i7-8086K 3.7GHz
GeForce GTX 1050 Ti (Desktop)
min:
6.34 fps, P1:
20.8 fps, max:
126 fps
fps
128%
GeForce GTX 1050 Ti Max-Q:
35.5 fps
100%
GeForce GTX 1050 Ti (Desktop):
39.9 [X] Intel Core i7-4790K 4GHz
GeForce GTX 1050 Ti (Desktop)
min:
29 fps
fps
100%
GeForce GTX 1050 Ti (Desktop):
84 [X] Intel Core i7-4790K 4GHz
GeForce GTX 1050 Ti (Desktop)
fps
100%
GeForce GTX 1050 Ti (Desktop):
58.2 [X] Intel Core i7-4790K 4GHz
GeForce GTX 1050 Ti (Desktop)
min:
25 fps, max:
165 fps
fps
100%
GeForce GTX 1050 Ti (Desktop):
66 [X] Intel Core i7-4790K 4GHz
GeForce GTX 1050 Ti (Desktop)
min:
58 fps, max:
81 fps
fps
100%
GeForce GTX 1050 Ti (Desktop):
30.2 [X] Intel Core i7-4790K 4GHz
GeForce GTX 1050 Ti (Desktop)
min:
27 fps, max:
36 fps
fps
100%
GeForce GTX 1050 Ti (Desktop):
303.5 fps
32%
Iris Plus Graphics 655:
78.4 116.6 ~ 98 fps
Iris Plus Graphics 655:
54.3 64.8 ~ 60 fps
100%
GeForce GTX 1050 Ti (Desktop):
208 [X] Intel Core i7-4790K 4GHz
GeForce GTX 1050 Ti (Desktop)
min:
58 fps, max:
311 fps
fps
25%
Iris Plus Graphics 655:
49.4 55 ~ 52 fps
100%
GeForce GTX 1050 Ti (Desktop):
77.2 79 [X] Intel Core i7-4790K 4GHz
GeForce GTX 1050 Ti (Desktop)
min:
45 fps, max:
130 fps
~ 78 fps
21%
Iris Plus Graphics 655:
15.5 17 ~ 16 fps
100%
GeForce GTX 1050 Ti (Desktop):
35.8 [X] Intel Core i7-4790K 4GHz
GeForce GTX 1050 Ti (Desktop)
min:
29 fps, max:
54 fps
fps
Iris Plus Graphics 655:
93.7 fps
Iris Plus Graphics 655:
49.6 fps
Iris Plus Graphics 655:
12.4 fps
GeForce GTX 1050 Ti Max-Q:
228.2 fps
GeForce GTX 1050 Ti Max-Q:
202.6 fps
GeForce GTX 1050 Ti Max-Q:
202.1 fps
GeForce GTX 1050 Ti Max-Q:
170.1 fps
GeForce GTX 1050 Ti Max-Q:
433.4 fps
GeForce GTX 1050 Ti Max-Q:
200.4 fps
GeForce GTX 1050 Ti Max-Q:
186.7 fps
GeForce GTX 1050 Ti Max-Q:
126.7 fps
100%
GeForce GTX 1050 Ti (Desktop):
55.1 [X] Intel Core i7-4790K 4GHz
GeForce GTX 1050 Ti (Desktop)
min:
22 fps, max:
93 fps
fps
Average Gaming NVIDIA GeForce GTX 1050 Ti (Desktop) → 100% Average Gaming 30-70 fps → 100%
Average Gaming Intel Iris Plus Graphics 655 → 26% Average Gaming 30-70 fps → 33%
Average Gaming NVIDIA GeForce GTX 1050 Ti Max-Q → 96% Average Gaming 30-70 fps → 97%
 Deutsch
 English
 Español
 Français
 Italiano
 Nederlands
 Polski
 Português
 Русский
 Türkçe
 Svenska
 Chinese
 Magyar