Notebookcheck Logo

Intel Core i7-3520M vs Intel Core i5-7200U vs Intel Pentium Gold 4415U

Intel Core i7-3520M

► remove from comparison Intel 3520M

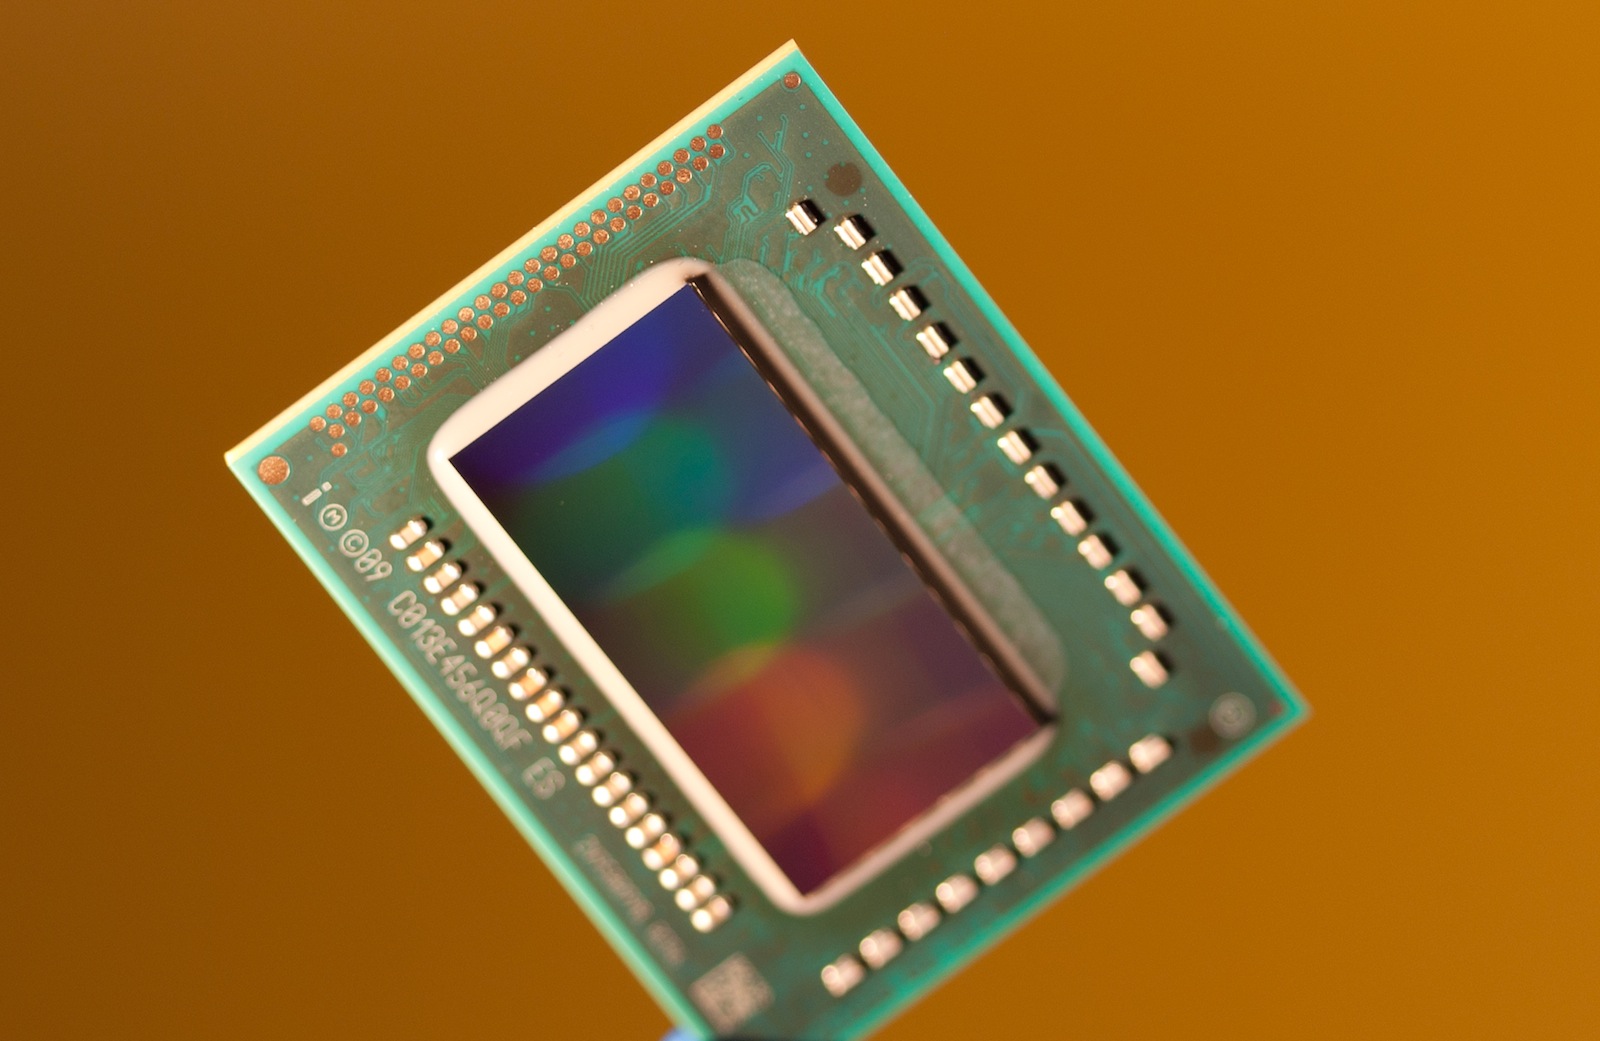
The Intel Core i7-3520M is the fastest dual-core processor for laptops based on the Ivy Bridge architecture at the time of introduction in Q2 2012. Due to Hyperthreading, the two cores can handle up to four threads in parallel leading to better utilization of the CPU. Each core offers a base speed of 2.9 GHz but can dynamically increase clock rates with Turbo Boost up to 3.4 GHz (for 2 active cores) and 3.6 GHz (for 1 active core). As its Sandy-Bridge-based predecessor Core i7-2640M, it offers a 4 MB L3-Cache.

Ivy Bridge is an enhanced die shrink of the Sandy Bridge architecture with improvements on both GPU and CPU performance. The CPUs are produced in 22nm (versus 32nm Sandy Bridge CPUs) and are the first to introduce 3D transistors for increased energy efficiency when compared to similarly clocked Sandy Bridge processors. Other new features are integrated PCI Express 3.0 and  DDR3(L)-1600 support.

The performance of the Core i7-3520M is slightly above a similarly clocked Sandy Bridge processor due to the architectural improvements. As a result, overall performance is about 5 - 10 % above the old i7-2640M (see benchmarks below).

The integrated Intel HD Graphics 4000 offers 16 Execution Units (EUs) clocked at 650 MHz up to 1250 MHz with Turbo Boost, making it one of the fastest variants.

Just like most other Ivy Bridge dual-cores, the i7-3520M is rated at a TDP of 35 W. Therefore, even smaller laptops can use the Core i7.

Intel Core i5-7200U

► remove from comparison Intel i5-7200U

The Intel Core i5-7200U is a dual-core processor of the Kaby Lake architecture. It offers two CPU cores clocked at 2.5 - 3.1 GHz and integrates HyperThreading to work with up to 4 threads at once. The architectural differences are rather small compared to the Skylake generation, therefore the performance per MHz is very similar. The SoC includes a dual channel DDR4 memory controller and Intel HD Graphics 620 graphics card (clocked at 300 - 1000 MHz). It is manufactured in an improved 14nm FinFET process at Intel. Compared to the old Skylake based Core i5-6200U, the i5-7200U offers a 300 MHz higher clock speed.

Intel Pentium Gold 4415U

► remove from comparison Intel Pentium 4415U

The Intel Pentium 4415U is an ULV (ultra low voltage) dual-core SoC based on the Kaby-Lake architecture and has been launched in the first quarter of 2017. The CPU can be found in ultrabooks as well as normal notebooks. In addition to two CPU cores with Hyper-Threading clocked at 2.3 GHz (no Turbo Boost), the chip also integrates an HD Graphics 610 GPU and a dual-channel DDR4-2133/DDR3L-1600 memory controller. The SoC is manufactured using a 14 nm process with FinFET transistors.

Architecture

Intel basically uses the same micro architecture compared to Skylake, so the per-MHz performance does not differ. The manufacturer only reworked the Speed Shift technology for faster dynamic adjustments of voltages and clocks, and the improved 14nm process allows much higher frequencies combined with better efficiency than before.

Performance

Compared to the more expensive Core i3-7100U, the 4415U offers a similar CPU performance (2.3 versus 2.4 GHz) and less level 3 cache but a slower integrated graphics card. Still, the CPU has sufficient power for office and multimedia purposes as well as somewhat more demanding applications.

Graphics

The integrated graphics unit called HD Graphics 610 (similar to the HD Graphics 510) represents the "GT1" version of the Kaby Lake GPU (Intel Gen. 9). Its 12 Execution Units, also called EUs, are clocked at 300 - 950 MHz and offer a performance somewhat below the older HD Graphics 4400. Only a few games of 2015 can be played smoothly in lowest settings.

Power Consumption

Specified at a TDP of 15 W (including CPU, GPU and memory controller), the CPU is best suited for small notebooks and ultrabooks (11-inches and above). Optionally, the TDP can be lowered to 10 watts (cTDP down), reducing both heat dissipation and performance and allowing even more compact designs.

ModelIntel Core i7-3520MIntel Core i5-7200UIntel Pentium Gold 4415U
SeriesIntel Core i7Intel Kaby LakeIntel Kaby Lake
CodenameIvy BridgeKaby LakeKaby Lake
Series: Kaby Lake Kaby Lake
Intel Core i7-3940XM3 - 3.9 GHz4 / 8 cores8 MB L3
Intel Core i7-3920XM2.9 - 3.8 GHz4 / 8 cores8 MB L3
Intel Core i7-3840QM2.8 - 3.8 GHz4 / 8 cores8 MB L3
Intel Core i7-3820QM2.7 - 3.7 GHz4 / 8 cores8 MB L3
Intel Core i7-3740QM2.7 - 3.7 GHz4 / 8 cores6 MB L3
Intel Core i7-3720QM2.6 - 3.6 GHz4 / 8 cores6 MB L3
Intel Core i7-3635QM2.4 - 3.4 GHz4 / 8 cores6 MB L3
Intel Core i7-3630QM2.4 - 3.4 GHz4 / 8 cores6 MB L3
Intel Core i7-3615QM2.3 - 3.3 GHz4 / 8 cores6 MB L3
Intel Core i7-3610QM2.3 - 3.3 GHz4 / 8 cores6 MB L3
Intel Core i7-3632QM2.2 - 3.2 GHz4 / 8 cores6 MB L3
Intel Core i7-3612QM2.1 - 3.1 GHz4 / 8 cores6 MB L3
Intel Core i7-3540M3 - 3.7 GHz2 / 4 cores4 MB L3
Intel Core i7-3520M « 2.9 - 3.6 GHz2 / 4 cores4 MB L3
Intel Core i7-3687U2.1 - 3.3 GHz2 / 4 cores4 MB L3
Intel Core i7-3667U2 - 3.2 GHz2 / 4 cores4 MB L3
Intel Core i7-3537U2 - 3.1 GHz2 / 4 cores4 MB L3
Intel Core i7-3517U1.9 - 3 GHz2 / 4 cores4 MB L3
Intel Core i7-3689Y1.5 - 2.6 GHz2 / 4 cores4 MB L3
Intel Core i7-7700K4.2 - 4.5 GHz4 / 8 cores8 MB L3
Intel Core i7-77003.6 - 4.2 GHz4 / 8 cores8 MB L3
Intel Xeon E3-1535M v63.1 - 4.2 GHz4 / 8 cores8 MB L3
Intel Core i7-7920HQ3.1 - 4.1 GHz4 / 8 cores8 MB L3
Intel Core i7-7700T2.9 - 3.8 GHz4 / 8 cores8 MB L3
Intel Core i5-7600K3.8 - 4.2 GHz4 / 4 cores8 MB L3
Intel Xeon E3-1505M v63 - 4 GHz4 / 8 cores8 MB L3
Intel Core i7-7820HQ2.9 - 3.9 GHz4 / 8 cores8 MB L3
Intel Core i7-7820HK2.9 - 3.9 GHz4 / 8 cores8 MB L3
Intel Core i7-7700HQ2.8 - 3.8 GHz4 / 8 cores6 MB L3
Intel Core i5-75003.4 - 3.8 GHz4 / 4 cores6 MB L3
Intel Core i5-7440HQ2.8 - 3.8 GHz4 / 4 cores6 MB L3
Intel Core i7-7567U3.5 - 4 GHz2 / 4 cores4 MB L3
Intel Core i7-7660U2.5 - 4 GHz2 / 4 cores4 MB L3
Intel Core i7-7600U2.8 - 3.9 GHz2 / 4 cores4 MB L3
Intel Core i5-7300HQ2.5 - 3.5 GHz4 / 4 cores6 MB L3
Intel Core i5-7500T2.7 - 3.3 GHz4 / 4 cores6 MB L3
Intel Core i5-7287U3.3 - 3.7 GHz2 / 4 cores4 MB L3
Intel Core i7-7560U2.4 - 3.8 GHz2 / 4 cores4 MB L3
Intel Core i5-7267U3.1 - 3.5 GHz2 / 4 cores4 MB L3
Intel Core i5-7360U2.3 - 3.6 GHz2 / 4 cores4 MB L3
Intel Core i7-7500U2.7 - 3.5 GHz2 / 4 cores4 MB L3
Intel Core i5-7300U2.6 - 3.5 GHz2 / 4 cores3 MB L3
Intel Core i5-7260U2.2 - 3.4 GHz2 / 4 cores4 MB L3
Intel Core i5-7200U « 2.5 - 3.1 GHz2 / 4 cores3 MB L3
Intel Core i3-7100H3 GHz2 / 4 cores3 MB L3
Intel Core i3-7167U2.8 GHz2 / 4 cores3 MB L3
Intel Core i7-7Y751.3 - 3.6 GHz2 / 4 cores4 MB L3
Intel Core i5-7Y571.2 - 3.3 GHz2 / 4 cores4 MB L3
Intel Core i5-7Y541.2 - 3.2 GHz2 / 4 cores4 MB L3
Intel Core i3-7100U2.4 GHz2 / 4 cores3 MB L3
Intel Core m3-7Y321 - 3 GHz2 / 4 cores4 MB L3
Intel Pentium Gold 4415U2.3 GHz2 / 4 cores2 MB L3
Intel Core m3-7Y301 - 2.6 GHz2 / 4 cores4 MB L3
Intel Celeron 3965U2.2 GHz2 / 2 cores2 MB L3
Intel Core i3-7020U2.3 GHz2 / 4 cores3 MB L3
Intel Celeron 3867U1.8 GHz2 / 2 cores2 MB L3
Intel Celeron 3865U1.8 GHz2 / 2 cores2 MB L3
Intel Pentium Gold 4425Y1.7 GHz2 / 4 cores2 MB L3
Intel Pentium Gold 4415Y1.6 GHz2 / 4 cores2 MB L3
Intel Pentium Gold 4410Y1.5 GHz2 / 4 cores2 MB L3
Intel Celeron 3965Y1.5 GHz2 / 2 cores2 MB L3
Intel Core i7-7700K4.2 - 4.5 GHz4 / 8 cores8 MB L3
Intel Core i7-77003.6 - 4.2 GHz4 / 8 cores8 MB L3
Intel Xeon E3-1535M v63.1 - 4.2 GHz4 / 8 cores8 MB L3
Intel Core i7-7920HQ3.1 - 4.1 GHz4 / 8 cores8 MB L3
Intel Core i7-7700T2.9 - 3.8 GHz4 / 8 cores8 MB L3
Intel Core i5-7600K3.8 - 4.2 GHz4 / 4 cores8 MB L3
Intel Xeon E3-1505M v63 - 4 GHz4 / 8 cores8 MB L3
Intel Core i7-7820HQ2.9 - 3.9 GHz4 / 8 cores8 MB L3
Intel Core i7-7820HK2.9 - 3.9 GHz4 / 8 cores8 MB L3
Intel Core i7-7700HQ2.8 - 3.8 GHz4 / 8 cores6 MB L3
Intel Core i5-75003.4 - 3.8 GHz4 / 4 cores6 MB L3
Intel Core i5-7440HQ2.8 - 3.8 GHz4 / 4 cores6 MB L3
Intel Core i7-7567U3.5 - 4 GHz2 / 4 cores4 MB L3
Intel Core i7-7660U2.5 - 4 GHz2 / 4 cores4 MB L3
Intel Core i7-7600U2.8 - 3.9 GHz2 / 4 cores4 MB L3
Intel Core i5-7300HQ2.5 - 3.5 GHz4 / 4 cores6 MB L3
Intel Core i5-7500T2.7 - 3.3 GHz4 / 4 cores6 MB L3
Intel Core i5-7287U3.3 - 3.7 GHz2 / 4 cores4 MB L3
Intel Core i7-7560U2.4 - 3.8 GHz2 / 4 cores4 MB L3
Intel Core i5-7267U3.1 - 3.5 GHz2 / 4 cores4 MB L3
Intel Core i5-7360U2.3 - 3.6 GHz2 / 4 cores4 MB L3
Intel Core i7-7500U2.7 - 3.5 GHz2 / 4 cores4 MB L3
Intel Core i5-7300U2.6 - 3.5 GHz2 / 4 cores3 MB L3
Intel Core i5-7260U2.2 - 3.4 GHz2 / 4 cores4 MB L3
Intel Core i5-7200U2.5 - 3.1 GHz2 / 4 cores3 MB L3
Intel Core i3-7100H3 GHz2 / 4 cores3 MB L3
Intel Core i3-7167U2.8 GHz2 / 4 cores3 MB L3
Intel Core i7-7Y751.3 - 3.6 GHz2 / 4 cores4 MB L3
Intel Core i5-7Y571.2 - 3.3 GHz2 / 4 cores4 MB L3
Intel Core i5-7Y541.2 - 3.2 GHz2 / 4 cores4 MB L3
Intel Core i3-7100U2.4 GHz2 / 4 cores3 MB L3
Intel Core m3-7Y321 - 3 GHz2 / 4 cores4 MB L3
Intel Pentium Gold 4415U « 2.3 GHz2 / 4 cores2 MB L3
Intel Core m3-7Y301 - 2.6 GHz2 / 4 cores4 MB L3
Intel Celeron 3965U2.2 GHz2 / 2 cores2 MB L3
Intel Core i3-7020U2.3 GHz2 / 4 cores3 MB L3
Intel Celeron 3867U1.8 GHz2 / 2 cores2 MB L3
Intel Celeron 3865U1.8 GHz2 / 2 cores2 MB L3
Intel Pentium Gold 4425Y1.7 GHz2 / 4 cores2 MB L3
Intel Pentium Gold 4415Y1.6 GHz2 / 4 cores2 MB L3
Intel Pentium Gold 4410Y1.5 GHz2 / 4 cores2 MB L3
Intel Celeron 3965Y1.5 GHz2 / 2 cores2 MB L3
Clock2900 - 3600 MHz2500 - 3100 MHz2300 MHz
L1 Cache128 KB128 KB128 KB
L2 Cache512 KB512 KB512 KB
L3 Cache4 MB3 MB2 MB
Cores / Threads2 / 42 / 42 / 4
TDP35 Watt15 Watt15 Watt
Technology22 nm14 nm14 nm
max. Temp.105 °C100 °C100 °C
SocketBGA1023, PGA988BGA1356BGA
FeaturesHD Graphics 4000, DDR3-1600 Memory Controller, HyperThreading, AVX, Quick Sync, VirtualizationDual-Channel DDR4 Memory Controller, HyperThreading, AVX, AVX2, Quick Sync, Virtualization, AES-NIDual-Channel LPDDR3-1866/DDR4-2133 Memory Controller, HyperThreading, AVX, AVX2, Quick Sync, Virtualization, AES-NI
iGPUIntel HD Graphics 4000 (650 - 1250 MHz)Intel HD Graphics 620 (300 - 1000 MHz)Intel HD Graphics 610 (300 - 950 MHz)
Architecturex86x86x86
$346 U.S.$281 U.S.$161 U.S.
Announced
Manufacturerark.intel.comark.intel.comark.intel.com

Benchmarks

Performance Rating - CB R15 + R20 + 7-Zip + X265 + Blender + 3DM11 CPU - Pentium 4415U
18.9 pt (26%)
Cinebench R23 - Cinebench R23 Multi Core
1366 Points (1%)
Cinebench R23 - Cinebench R23 Single Core
529 Points (23%)
Cinebench R20 - Cinebench R20 CPU (Single Core)
181.3 Points (20%)
Cinebench R20 - Cinebench R20 CPU (Multi Core)
356 Points (1%)
Cinebench R15 - Cinebench R15 CPU Multi 64 Bit
min: 268     avg: 324.5     median: 327 (2%)     max: 337 Points
min: 238     avg: 239.5     median: 239.5 (2%)     max: 241 Points
Cinebench R15 - Cinebench R15 CPU Single 64 Bit
min: 88     avg: 126.3     median: 128 (39%)     max: 132 Points
min: 93     avg: 94     median: 94 (28%)     max: 95 Points
Cinebench R11.5 - Cinebench R11.5 CPU Multi 64 Bit
min: 3     avg: 3.3     median: 3.4 (4%)     max: 3.44 Points
min: 2.85     avg: 3.6     median: 3.7 (5%)     max: 3.7 Points
2.7 Points (4%)
Cinebench R11.5 - Cinebench R11.5 CPU Single 64 Bit
min: 1.41     avg: 1.4     median: 1.5 (36%)     max: 1.47 Points
min: 1.2     avg: 1.4     median: 1.5 (36%)     max: 1.49 Points
1 Points (25%)
Cinebench R10 - Cinebench R10 Rend. Single (32bit)
min: 4408     avg: 4813     median: 4855 (29%)     max: 4903 Points
min: 4787     avg: 4976     median: 4985.5 (30%)     max: 5022 Points
3587 Points (22%)
Cinebench R10 - Cinebench R10 Rend. Multi (32bit)
min: 9112     avg: 10167     median: 10467 (8%)     max: 10605 Points
min: 9213     avg: 11161     median: 11308 (8%)     max: 11955 Points
8169 Points (6%)
Cinebench R10 - Cinebench R10 Rend. Multi (64bit)
100%
1 3520M +
min: 11581     avg: 12766     median: 12889.5 (9%)     max: 13151 Points
Cinebench R10 - Cinebench R10 Rend. Single (64bit)
100%
1 3520M +
min: 6029     avg: 6128     median: 6146.5 (7%)     max: 6203 Points
wPrime 2.10 - wPrime 2.0 1024m *
min: 456     avg: 493.2     median: 492.1 (6%)     max: 570 s
min: 460.9     avg: 495     median: 491.2 (6%)     max: 537 s
wPrime 2.10 - wPrime 2.0 32m *
min: 14.4     avg: 15.5     median: 15.4 (3%)     max: 17.1 s
min: 14.66     avg: 15.6     median: 15.5 (3%)     max: 17.62 s
20.9 s (4%)
wPrime 1.55 - wPrime 1.55 1024m *
464.8 s (2%)
wPrime 1.55 - wPrime 1.55 32m *
14.9 s (8%)
WinRAR - WinRAR 4.0
min: 2661     avg: 2863     median: 2715 (4%)     max: 3527 Points
2003 Points (3%)
7-Zip 18.03 - 7-Zip 18.03 Multli Thread 4 runs
6602 MIPS (4%)
7-Zip 18.03 - 7-Zip 18.03 Single Thread 4 runs
2575 MIPS (31%)
X264 HD Benchmark 4.0 - x264 Pass 2
min: 6.7     avg: 16.1     median: 18.9 (7%)     max: 19.44 fps
min: 19     avg: 21.3     median: 21.6 (8%)     max: 22 fps
X264 HD Benchmark 4.0 - x264 Pass 1
min: 35.1     avg: 86.2     median: 98.6 (23%)     max: 101.8 fps
min: 100     avg: 112.7     median: 113.1 (26%)     max: 117 fps
85.7 fps (20%)
HWBOT x265 Benchmark v2.2 - HWBOT x265 4k Preset
1.6 fps (3%)
TrueCrypt - TrueCrypt Serpent
min: 0.164     avg: 0.2     median: 0.2 (0%)     max: 0.176 GB/s
0.1 GB/s (0%)
TrueCrypt - TrueCrypt Twofish
min: 0.249     avg: 0.3     median: 0.3 (5%)     max: 0.302 GB/s
0.2 GB/s (4%)
TrueCrypt - TrueCrypt AES
min: 1.2     avg: 1.6     median: 1.7 (4%)     max: 1.7 GB/s
1.4 GB/s (4%)
Blender - Blender 3.3 Classroom CPU *
3786 Seconds (48%)
Blender - Blender 2.79 BMW27 CPU *
2188 Seconds (15%)
R Benchmark 2.5 - R Benchmark 2.5 *
1.2 sec (26%)
3DMark 06 - CPU - 3DMark 06 - CPU
min: 3528     avg: 4086     median: 4134 (9%)     max: 4212 Points
3249 Points (7%)
Super Pi mod 1.5 XS 1M - Super Pi mod 1.5 XS 1M *
min: 10     avg: 10.3     median: 10 (2%)     max: 10.94 s
min: 12     avg: 12.3     median: 12.3 (3%)     max: 12.61 s
16.7 s (4%)
Super Pi mod 1.5 XS 2M - Super Pi mod 1.5 XS 2M *
min: 24     avg: 24.8     median: 25 (1%)     max: 25.87 s
min: 27.36     avg: 28.2     median: 28 (1%)     max: 29.69 s
Super Pi Mod 1.5 XS 32M - Super Pi mod 1.5 XS 32M *
min: 565     avg: 591     median: 594 (3%)     max: 612 s
min: 610     avg: 645     median: 643.5 (3%)     max: 722 s
SiSoft Sandra Dhrystone (MIPS) - SiSoft Sandra Dhrystone (MIPS)
100%
1 3520M +
min: 55800     avg: 63808     median: 67130 (32%)     max: 69140 MIPS
SiSoft Sandra Whetstone (MFLOPS) - SiSoft Sandra Whetstone (MFLOPS)
100%
1 3520M +
min: 41450     avg: 42502     median: 42450 (33%)     max: 44032 MFLOPS
Windows 7 Experience Index - Win7 CPU
100%
1 3520M +
7.2 Points (92%)
3DMark Vantage - 3DM Vant. Perf. CPU no Physx
min: 9277     avg: 11188     median: 11511 (10%)     max: 11788 Points
min: 9939     avg: 11370     median: 11779 (10%)     max: 12049 Points
9098 Points (8%)
3DMark 11 - 3DM11 Performance Physics
min: 3582     avg: 4275     median: 4466 (12%)     max: 4774 Points
min: 3242     avg: 4145     median: 4107 (11%)     max: 4695 Points
min: 2788     avg: 3025     median: 3024.5 (8%)     max: 3261 Points
3DMark - 3DMark Ice Storm Physics
39221 Points (32%)
min: 28394     avg: 37794     median: 37804 (31%)     max: 42974 Points
31354 Points (25%)
3DMark - 3DMark Ice Storm Extreme Physics
min: 26941     avg: 36877     median: 37260 (30%)     max: 42166 Points
30220 Points (25%)
3DMark - 3DMark Ice Storm Unlimited Physics
min: 36369     avg: 41562     median: 42260 (36%)     max: 43942 Points
31593 Points (27%)
3DMark - 3DMark Cloud Gate Physics
3393 Points (9%)
min: 2622     avg: 3414     median: 3503 (9%)     max: 3684 Points
2628 Points (7%)
3DMark - 3DMark Fire Strike Standard Physics
4772 Points (9%)
min: 3866     avg: 4887     median: 4979 (9%)     max: 5252 Points
3755 Points (7%)
Geekbench 5.5 - Geekbench 5.1 - 5.4 64 Bit Single-Core
599 Points (25%)
Geekbench 5.5 - Geekbench 5.1 - 5.4 64 Bit Multi-Core
1374 Points (2%)
Geekbench 4.4 - Geekbench 4.1 - 4.4 64 Bit Single-Core
min: 3648     avg: 3799     median: 3809 (38%)     max: 3958 Points
2943 Points (29%)
Geekbench 4.4 - Geekbench 4.1 - 4.4 64 Bit Multi-Core
min: 7066     avg: 7413     median: 7516 (8%)     max: 7767 Points
5630 Points (6%)
Geekbench 4.0 - Geekbench 4.0 64 Bit Single-Core
min: 3484     avg: 3661     median: 3630 (49%)     max: 3902 Points
2816 Points (38%)
Geekbench 4.0 - Geekbench 4.0 64 Bit Multi-Core
min: 6425     avg: 6947     median: 6806 (17%)     max: 7439 Points
5455 Points (13%)
Geekbench 3 - Geekbench 3 32 Bit Multi-Core
min: 6297     avg: 6584     median: 6480.5 (12%)     max: 6932 Points
5270 Points (9%)
Geekbench 3 - Geekbench 3 32 Bit Single-Core
min: 2812     avg: 2983     median: 2906 (57%)     max: 3209 Points
2510 Points (49%)
Geekbench 3 - Geekbench 3 64 Bit Multi-Core
min: 6695     avg: 6772     median: 6772 (11%)     max: 6849 Points
5481 Points (9%)
Geekbench 3 - Geekbench 3 64 Bit Single-Core
min: 3037     avg: 3144     median: 3143.5 (47%)     max: 3250 Points
2625 Points (39%)
Geekbench 2 - 32 Bit - Geekbench Stream
7986 Points (64%)
Geekbench 2 - 32 Bit - Geekbench Memory
6662 Points (60%)
Geekbench 2 - 32 Bit - Geekbench Floating Point
5132 Points (10%)
Geekbench 2 - 32 Bit - Geekbench Integer
5122 Points (10%)
Geekbench 2 - 32 Bit - Geekbench Total Score
5719 Points (15%)
PassMark PerformanceTest 9 - PerformanceTest 9.0 CPU Mark
4907 Points (26%)
Mozilla Kraken 1.1 - Kraken 1.1 Total Score *
min: 1109     avg: 1211     median: 1196 (1%)     max: 1542 ms
min: 1652     avg: 1697     median: 1696.5 (2%)     max: 1741 ms
Sunspider - Sunspider 1.0 Total Score *
min: 77.7     avg: 124.3     median: 86.3 (1%)     max: 826 ms
119.1 ms (1%)
Octane V2 - Octane V2 Total Score
min: 21890     avg: 29883     median: 30957 (28%)     max: 32838 Points
21322 Points (19%)
WebXPRT 4 - WebXPRT 4 Score
82.2 Points (24%)
WebXPRT 3 - WebXPRT 3 Score
110.2 Points (23%)
Power Consumption - Prime95 Power Consumption - external Monitor *
26.8 Watt (5%)
Power Consumption - Cinebench R15 Multi Power Consumption - external Monitor *
25.5 Watt (5%)
Power Consumption - Cinebench R15 Multi Power Efficiency - external Monitor
12.8 Points per Watt (10%)

Average Benchmarks Intel Core i7-3520M → 100% n=21

Average Benchmarks Intel Core i5-7200U → 103% n=21

Average Benchmarks Intel Pentium Gold 4415U → 83% n=21

- Range of benchmark values for this graphics card
- Average benchmark values for this graphics card
* Smaller numbers mean a higher performance
1 This benchmark is not used for the average calculation

v1.27
log 17. 06:02:59

#0 checking url part for id 3065 +0s ... 0s

#1 checking url part for id 8152 +0s ... 0s

#2 checking url part for id 9292 +0s ... 0s

#3 not redirecting to Ajax server +0s ... 0s

#4 did not recreate cache, as it is less than 5 days old! Created at Sun, 16 Jun 2024 05:37:17 +0200 +0.001s ... 0.001s

#5 composed specs +0.064s ... 0.065s

#6 did output specs +0s ... 0.065s

#7 getting avg benchmarks for device 3065 +0.004s ... 0.069s

#8 got single benchmarks 3065 +0.037s ... 0.106s

#9 getting avg benchmarks for device 8152 +0.004s ... 0.11s

#10 got single benchmarks 8152 +0.359s ... 0.469s

#11 getting avg benchmarks for device 9292 +0.024s ... 0.493s

#12 got single benchmarks 9292 +0.023s ... 0.516s

#13 got avg benchmarks for devices +0s ... 0.516s

#14 min, max, avg, median took s +0.585s ... 1.101s

#15 return log +0s ... 1.101s

Please share our article, every link counts!
> Expert Reviews and News on Laptops, Smartphones and Tech Innovations > Benchmarks / Tech > Processor Comparison - Head 2 Head
Redaktion, 2017-09- 8 (Update: 2023-07- 1)