Notebookcheck Logo

Intel HD Graphics 400 (Braswell) vs AMD Radeon R5 (Stoney Ridge) vs Intel HD Graphics (Broadwell)

Intel HD Graphics 400 (Braswell)

► remove from comparison Intel HD Graphics 400 (Braswell)

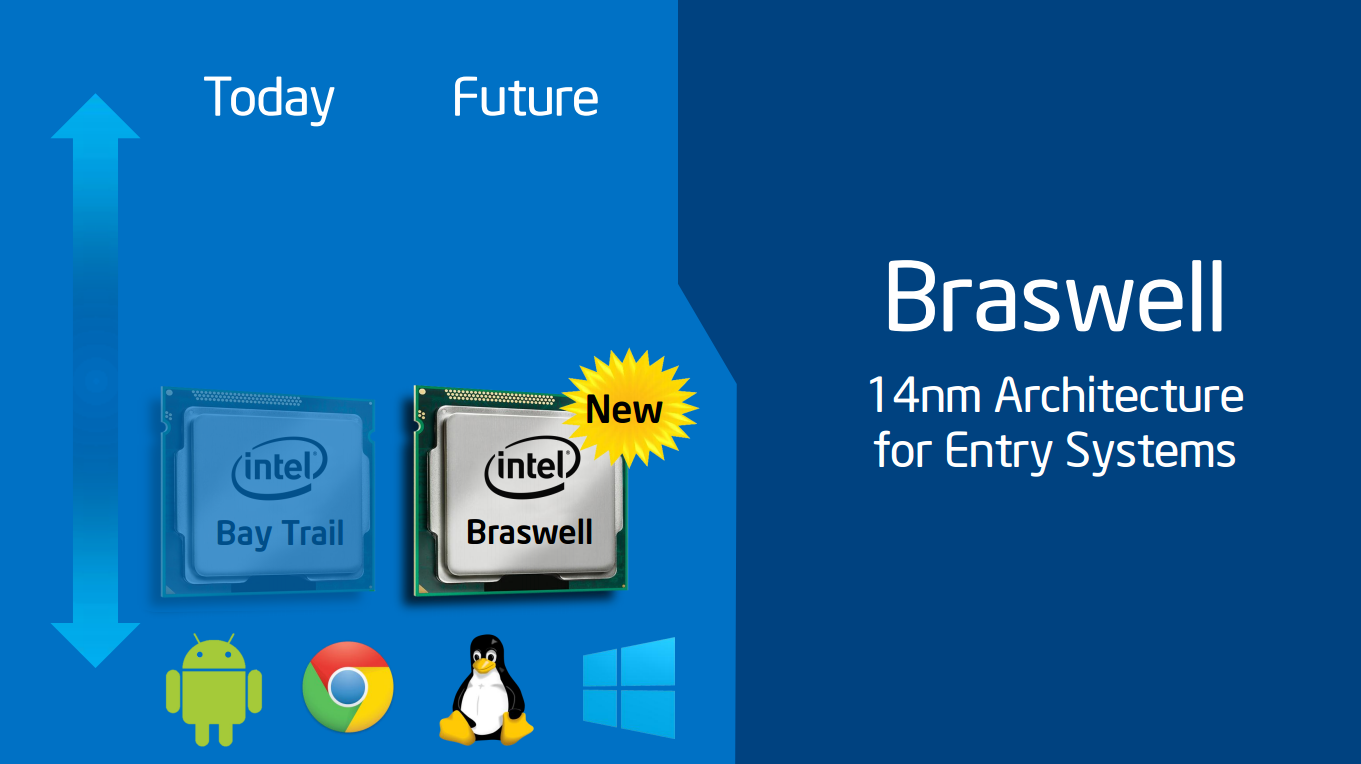
The Intel HD Graphics 400 (Braswell)  is an integrated graphics card in the low end SoCs of the Braswell series (2016 Celeron models). It is based on the same architecture as the integrated GPU of the Broadwell graphics cards (e.g. HD Graphics 5300), but offers less shader cores and slower clock speeds.

It is a rename from the Intel HD Graphics (Braswell) card that included the faster 16 EU model in the Pentium SoCs. See the Intel HD Graphics Braswell graphics card page for benchmarks.

The performance depends on the processor (different boost speed for the GPU) and the used memory.

Gaming performance ist still only suited for older or less demanding games. Often also the processor is limited gaming performance (e.g. in the dual-core N3000).

The SoC also integrates a video decoding engine that should be able to handle 4K H.265 videos.

AMD Radeon R5 (Stoney Ridge)

► remove from comparison AMD Radeon R5 (Stoney Ridge)

The AMD Radeon R5 (Stoney Ridge) is an integrated graphics adapter of the weaker mobile dual-core Stoney Ridge APUs. At its launch, it is being used in the AMD A9-9410 and has 3 active Compute Cores (384 shaders). Depending on the model, the maximum clock is 800 MHz. The performance can vary heavily depending on the configured TDP and the system memory. Compared to the Radeon R5 from the Bristol Ridge series, it only has 3 instead of 6 GCN cores (and is the full configuration of the Stoney Ridge chip).

Architecture and Features

The Radeon R5 is equipped with three cores from the third GCN generation (often called GCN 1.2 or 2.0 by the press). This means it is very similar to the Tonga desktop chip and supports DirectX 12 (FL 12_0), but the graphics cores can also be accessed via Mantle, OpenGL, and OpenCL. The GPU supports the HSA 1.0 standard as well and can therefore use the connection with the CPU cores very efficiently. The technical specifications are identical to the Carrizo predecessor. 

The video unit includes the UVD 6 (Unified Video Decoder), which can decode HEVC/H.265 and 4K with support from the hardware. More details are available in our dedicated Stoney Ridge article

Power Consumption

Depending on the model and configured TDP (cTDP), the 28 nm chip is specified with 10 up to 25 Watts. This means it can also be used for thin and light notebooks.

Intel HD Graphics (Broadwell)

► remove from comparison Intel HD Graphics (Broadwell)

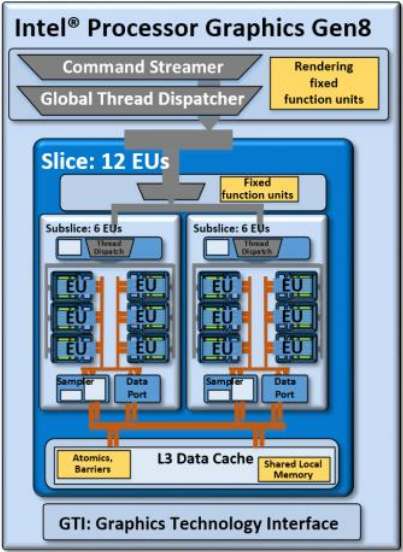
The Intel HD Graphics (Broadwell) (GT1) is an integrated Broadwell graphics card revealed in Q1 2015. It can be found in several low-end CPUs such as the Pentium 3805U or Celeron 3755U. The so-called GT1 GPU offers 12 EUs (Execution Units) and therefore somewhat more shader power than the previous HD Graphics (Haswell). The clock range may depend on the specific model it is built into.

Architecture and Features

Broadwell features a GPU based on the Intel Gen8 architecture, which has been optimized in various aspects compared to the previous Gen7.5 (Haswell). In case of the GT1 version, the shader arrays called "subslice" have been reorganized and now offer 6 Execution Units (EUs) each. Two subslices form a "slice" for a total of 12 EUs. Combined with other improvements such as larger L1 caches and an optimized frontend, the integrated GPU has become faster and more efficient than its predecessor.

The HD Graphics (Broadwell) represents the low-end version of the Broadwell GPU family and consists of one slice with 12 EUs. Beyond that, there is also a mid-range variant (GT2, 24 EUs) as well as higher-end models (GT3/GT3e + eDRAM, 48 EUs).

All Broadwell GPUs support OpenCL 2.0 and DirectX 12 (FL 11_1). The video engine can now decode H.265 using both fixed function hardware as well as available GPU shaders. Up to three displays can be connected via DP 1.2/eDP 1.3 (max. 3840 x 2160 @ 60 Hz) or HDMI 1.4a (max. 3840 x 2160 @ 24 Hz). HDMI 2.0, however, is not supported.

Performance

Even though the HD Graphics (Broadwell) is clocked a bit lower, the performance should be clearly above the HD Graphics (Haswell) and similar to the HD Graphics 4000. Nevertheless, only a few games as of 2014/2015 will run fluently at (very) low settings, e.g. Dota 2 or Sims 4.

Power Consumption

Utilizing a new 14 nm process, the HD Graphics (Broadwell) can be found in ULV models (15 W) as well as regular dual core CPUs (37 W, not yet presented). The TDP is flexible and can be further reduced, which has a significant impact on performance.

Intel HD Graphics 400 (Braswell)AMD Radeon R5 (Stoney Ridge)Intel HD Graphics (Broadwell)
HD Graphics Series
HD Graphics P530 24 @ 0.35 - 1.05 GHz64/128 Bit
HD Graphics 5600 24 @ 0.3 - 1.05 GHz64/128 Bit
HD Graphics 6000 48 @ 0.3 - 1 GHz64/128 Bit
HD Graphics 4600 20 @ 0.2 - 1.35 GHz64/128 Bit
HD Graphics 5500 24 @ 0.3 - 0.95 GHz64/128 Bit
HD Graphics 5000 40 @ 0.2 - 1.1 GHz64/128 Bit
HD Graphics 4400 20 @ 0.2 - 1.1 GHz64/128 Bit
HD Graphics 5300 24 @ 0.1 - 0.9 GHz64/128 Bit
HD Graphics 4000 16 @ 0.35 - 1.35 GHz64/128 Bit
HD Graphics (Broadwell) 12 @ 0.1 - 0.85 GHz64/128 Bit
HD Graphics 4200 20 @ 0.2 - 0.85 GHz64/128 Bit
HD Graphics (Skylake) 12 @ 0.3 - 0.8 GHz64/128 Bit
HD Graphics 405 (Braswell) 16 @ 0.32 - 0.7 GHz64/128 Bit
HD Graphics (Braswell) 16 @ 0.32 - 0.7 GHz64/128 Bit
HD Graphics 400 (Braswell) 12 @ 0.32 - 0.64 GHz64/128 Bit
HD Graphics (Haswell) 10 @ 0.2 - 1 GHz64/128 Bit
HD Graphics (Cherry Trail) 16 @ 0.2 - 0.6 GHz64/128 Bit
HD Graphics 3000 12 @ 0.35 - 1.35 GHz64/128 Bit
HD Graphics 2500 6 @ 0.65 - 1.15 GHz64/128 Bit
HD Graphics (Ivy Bridge) 6 @ 0.35 - 1.1 GHz64/128 Bit
HD Graphics 2000 6 @ 0.85 - 1.35 GHz64/128 Bit
HD Graphics (Sandy Bridge) 6 @ 0.35 - 1.1 GHz64/128 Bit
HD Graphics (Bay Trail) 4 @ 0.31 - 0.9 GHz32/64/128 Bit
Radeon R7 (Bristol Ridge) 512 @ 0.9 GHz64/128 Bit
Radeon R5 (Bristol Ridge) 384 @ 0.8 GHz64/128 Bit
Radeon R5 (Stoney Ridge) 192 @ 0.8 GHz64 Bit
Radeon R4 (Stoney Ridge) 192 @ 0.6 GHz64 Bit
Radeon R2 (Stoney Ridge) 128 @ 0.6 GHz64 Bit
HD Graphics P530 24 @ 0.35 - 1.05 GHz64/128 Bit
HD Graphics 5600 24 @ 0.3 - 1.05 GHz64/128 Bit
HD Graphics 6000 48 @ 0.3 - 1 GHz64/128 Bit
HD Graphics 4600 20 @ 0.2 - 1.35 GHz64/128 Bit
HD Graphics 5500 24 @ 0.3 - 0.95 GHz64/128 Bit
HD Graphics 5000 40 @ 0.2 - 1.1 GHz64/128 Bit
HD Graphics 4400 20 @ 0.2 - 1.1 GHz64/128 Bit
HD Graphics 5300 24 @ 0.1 - 0.9 GHz64/128 Bit
HD Graphics 4000 16 @ 0.35 - 1.35 GHz64/128 Bit
HD Graphics (Broadwell) 12 @ 0.1 - 0.85 GHz64/128 Bit
HD Graphics 4200 20 @ 0.2 - 0.85 GHz64/128 Bit
HD Graphics (Skylake) 12 @ 0.3 - 0.8 GHz64/128 Bit
HD Graphics 405 (Braswell) 16 @ 0.32 - 0.7 GHz64/128 Bit
HD Graphics (Braswell) 16 @ 0.32 - 0.7 GHz64/128 Bit
HD Graphics 400 (Braswell) 12 @ 0.32 - 0.64 GHz64/128 Bit
HD Graphics (Haswell) 10 @ 0.2 - 1 GHz64/128 Bit
HD Graphics (Cherry Trail) 16 @ 0.2 - 0.6 GHz64/128 Bit
HD Graphics 3000 12 @ 0.35 - 1.35 GHz64/128 Bit
HD Graphics 2500 6 @ 0.65 - 1.15 GHz64/128 Bit
HD Graphics (Ivy Bridge) 6 @ 0.35 - 1.1 GHz64/128 Bit
HD Graphics 2000 6 @ 0.85 - 1.35 GHz64/128 Bit
HD Graphics (Sandy Bridge) 6 @ 0.35 - 1.1 GHz64/128 Bit
HD Graphics (Bay Trail) 4 @ 0.31 - 0.9 GHz32/64/128 Bit
CodenameBraswellStoney RidgeBroadwell GT1
ArchitectureGen. 8GCN 1.2/2.0Gen. 8 Broadwell
Pipelines12 - unified192 - unified12 - unified
Core Speed320 - 640 (Boost) MHz800 (Boost) MHz100 - 850 (Boost) MHz
Memory Bus Width64/128 Bit64 Bit64/128 Bit
Shared Memoryyesyesyes
APIDirectX 11.2, Shader 5.0DirectX 12 (FL 12_0), OpenGL 4.4DirectX 12 (FL 11_1), OpenGL 4.3
technology14 nm28 nm14 nm
Date of Announcement01.04.2016 01.06.2016 05.01.2015
Power Consumption12-45 Watt
FeaturesUVD 6, VCEQuickSync
Notebook Sizemedium sized
CPU in HD Graphics 400 (Braswell)GPU Base SpeedGPU Boost / Turbo
Intel Atom x5-Z85504 x 1440 MHz200 MHz600 MHz
Intel Celeron N30602 x 1600 MHz, 6 W320 MHz700 MHz
min. - max.200 - 320 MHz600 - 700 MHz
CPU in Radeon R5 (Stoney Ridge)GPU Base SpeedGPU Boost / Turbo
AMD A9-94252 x 3100 MHz, 15 W? MHz900 MHz
AMD A9-9420e2 x ? MHz, 15 W? MHz? MHz
AMD A9-94202 x 3000 MHz, 15 W? MHz800 MHz
min. - max.? MHz720 - 900 MHz
CPU in HD Graphics (Broadwell)GPU Base SpeedGPU Boost / Turbo
Intel Pentium 3825U2 x 1900 MHz, 15 W100 MHz850 MHz
Intel Celeron 3765U2 x 1900 MHz, 15 W300 MHz850 MHz
Intel Pentium 3805U2 x 1900 MHz, 15 W100 MHz800 MHz
min. - max.100 - 300 MHz800 - 850 MHz

Benchmarks

Performance Rating - 3DMark 11 + Fire Strike + Time Spy - HD Graphics 400 (Braswell)
0.1 pt (0%)
Restrict / Search: Model: Max. age: years
Performance Rating - 3DMark 11 + Fire Strike + Time Spy - Radeon R5 (Stoney Ridge)
0.3 pt (1%)
Restrict / Search: Model: Max. age: years
Performance Rating - 3DMark 11 + Fire Strike + Time Spy - HD Graphics (Broadwell)
0.2 pt (1%)
Restrict / Search: Model: Max. age: years
3DMark - 3DMark Time Spy Score
min: 274     avg: 281.5     median: 281.5 (1%)     max: 289 Points
3DMark - 3DMark Time Spy Graphics
min: 247     avg: 254.5     median: 254.5 (1%)     max: 262 Points
3DMark - 3DMark Ice Storm Unlimited Graphics
min: 17968     avg: 20459     median: 20277 (2%)     max: 23161 Points
min: 46978     avg: 50907     median: 51382 (5%)     max: 54361 Points
3DMark - 3DMark Ice Storm Extreme Graphics
14334 Points (2%)
min: 32172     avg: 33058     median: 33057.5 (4%)     max: 33943 Points
3DMark - 3DMark Cloud Gate Score
min: 1350     avg: 1553     median: 1457 (1%)     max: 2087 Points
min: 2673     avg: 2893     median: 2995 (3%)     max: 3010 Points
3398 Points (3%)
3DMark - 3DMark Cloud Gate Graphics
min: 1519     avg: 1865     median: 1841 (0%)     max: 2455 Points
min: 3661     avg: 4439     median: 4755 (1%)     max: 4902 Points
4015 Points (1%)
3DMark - 3DMark Fire Strike Standard Score
min: 176     avg: 188     median: 188 (0%)     max: 200 Points
min: 596     avg: 688     median: 712 (1%)     max: 757 Points
428 Points (1%)
3DMark - 3DMark Fire Strike Standard Graphics
min: 202     avg: 218     median: 218 (0%)     max: 234 Points
min: 642     avg: 765     median: 772 (1%)     max: 881 Points
463 Points (0%)
3DMark - 3DMark Ice Storm Graphics
min: 13689     avg: 18517     median: 18516.5 (2%)     max: 23344 Points
min: 49964     avg: 51392     median: 51392 (6%)     max: 52820 Points
45539 Points (5%)
3DMark - 3DMark Sling Shot (ES 3.0) Unlimited
min: 1502     avg: 1926     median: 1925.5 (8%)     max: 2349 Points
3DMark - 3DMark Sling Shot (ES 3.0) Unlimited Graphics
min: 1452     avg: 2046     median: 2046 (4%)     max: 2640 Points
3DMark - 3DMark Sling Shot Extreme (ES 3.1) Unlimited
1180 Points (5%)
3DMark - 3DMark Sling Shot Extreme (ES 3.1) Unlimited Graphics
977 Points (2%)
3DMark - 3DMark Sling Shot (ES 3.0)
min: 1473     avg: 1871     median: 1870.5 (17%)     max: 2268 Points
3DMark - 3DMark Sling Shot (ES 3.0) Graphics
min: 1431     avg: 2005     median: 2005 (12%)     max: 2579 Points
3DMark - 3DMark Sling Shot Extreme (ES 3.1)
1050 Points (5%)
3DMark - 3DMark Sling Shot Extreme (ES 3.1) Graphics
967 Points (3%)
min: 1103     avg: 1254     median: 1263 (2%)     max: 1387 Points
729 Points (1%)
min: 1096     avg: 1245     median: 1264 (1%)     max: 1356 Points
641 Points (0%)
3DMark Vantage
3DM Vant. Perf. total + AMD Radeon R5 (Stoney Ridge)
3DMark Vantage - 3DM Vant. Perf. total
3346 Points (1%)
3DM Vant. Perf. total + Intel HD Graphics (Broadwell)
2651 Points (1%)
3DM Vant. Perf. GPU no PhysX + AMD Radeon R5 (Stoney Ridge)
3DMark Vantage - 3DM Vant. Perf. GPU no PhysX
3044 Points (2%)
3DM Vant. Perf. GPU no PhysX + Intel HD Graphics (Broadwell)
2196 Points (1%)
3DMark 06 3DMark 06 - Standard 1280x1024 + Intel HD Graphics 400 (Braswell)
3DMark 06
2474 Points (3%)
3DMark 06 - Standard 1280x1024 + AMD Radeon R5 (Stoney Ridge)
min: 5141     avg: 5174     median: 5174 (7%)     max: 5207 Points
3DMark 06 - Standard 1280x1024 + Intel HD Graphics (Broadwell)
5077 Points (7%)
Unigine Heaven 3.0 - Unigine Heaven 3.0 DX 11
13.7 fps (5%)
Unigine Heaven 3.0 - Unigine Heaven 3.0 OpenGL
10.5 fps (5%)
Unigine Heaven 2.1 - Heaven 2.1 high
10.8 fps (2%)
10.9 fps (2%)
Cinebench R10 Cinebench R10 Shading (32bit) + Intel HD Graphics 400 (Braswell)
Cinebench R10 - Cinebench R10 Shading (32bit)
min: 1627     avg: 2057     median: 2052.5 (1%)     max: 2510 Points
Cinebench R10 Shading (32bit) + AMD Radeon R5 (Stoney Ridge)
min: 2752     avg: 3847     median: 3773 (3%)     max: 5088 Points
Cinebench R10 Shading (32bit) + Intel HD Graphics (Broadwell)
4886 Points (3%)
Cinebench R11.5 Cinebench R11.5 OpenGL 64 Bit + Intel HD Graphics 400 (Braswell)
Cinebench R11.5 - Cinebench R11.5 OpenGL 64 Bit
min: 9.97     avg: 10.1     median: 10 (3%)     max: 10.12 fps
Cinebench R11.5 OpenGL 64 Bit + AMD Radeon R5 (Stoney Ridge)
min: 16.4     avg: 17.8     median: 16.6 (5%)     max: 20.39 fps
Cinebench R11.5 OpenGL 64 Bit + Intel HD Graphics (Broadwell)
12.8 fps (4%)
Cinebench R15
Cinebench R15 OpenGL 64 Bit + Intel HD Graphics 400 (Braswell)
Cinebench R15 OpenGL 64 Bit + AMD Radeon R5 (Stoney Ridge)
min: 19.66     avg: 22.3     median: 23 (1%)     max: 23.42 fps
Cinebench R15 OpenGL 64 Bit + Intel HD Graphics (Broadwell)
17.8 fps (1%)
Cinebench R15 OpenGL Ref. Match 64 Bit + Intel HD Graphics 400 (Braswell)
Cinebench R15 OpenGL Ref. Match 64 Bit + AMD Radeon R5 (Stoney Ridge)
Cinebench R15 OpenGL Ref. Match 64 Bit + Intel HD Graphics (Broadwell)
98 % (98%)
GFXBench - GFXBench 5.0 Aztec Ruins High Tier Offscreen
3.3 fps (1%)
GFXBench - GFXBench 5.0 Aztec Ruins Normal Tier Offscreen
9.3 fps (1%)
GFXBench - GFXBench Car Chase Offscreen
15.6 fps (1%)
GFXBench 3.1 - GFXBench Manhattan ES 3.1 Offscreen
min: 7.2     avg: 10.6     median: 10.6 (0%)     max: 14 fps
20.4 fps (0%)
17.4 fps (0%)
GFXBench 3.0 - GFXBench 3.0 Manhattan Offscreen
min: 14     avg: 16     median: 16 (1%)     max: 18 fps
21.8 fps (1%)
21.5 fps (1%)
GFXBench (DX / GLBenchmark) 2.7
GFXBench T-Rex HD Offscreen C24Z16 + Intel HD Graphics 400 (Braswell)
GFXBench (DX / GLBenchmark) 2.7 - GFXBench T-Rex HD Offscreen C24Z16
min: 27     avg: 29     median: 29 (0%)     max: 31 fps
GFXBench T-Rex HD Offscreen C24Z16 + AMD Radeon R5 (Stoney Ridge)
67.8 fps (1%)
GFXBench T-Rex HD Offscreen C24Z16 + Intel HD Graphics (Broadwell)
47.1 fps (0%)
LuxMark v2.0 64Bit - LuxMark v2.0 Room GPU
92 Samples/s (0%)
86 Samples/s (0%)
LuxMark v2.0 64Bit - LuxMark v2.0 Sala GPU
124 Samples/s (0%)
182 Samples/s (0%)
ComputeMark v2.1 - ComputeMark v2.1 Result
min: 458     avg: 597     median: 597 (0%)     max: 736 Points
374 Points (0%)

Average Benchmarks Intel HD Graphics 400 (Braswell) → 100% n=15

Average Benchmarks AMD Radeon R5 (Stoney Ridge) → 239% n=15

Average Benchmarks Intel HD Graphics (Broadwell) → 186% n=15

- Range of benchmark values for this graphics card
red legend - Average benchmark values for this graphics card
* Smaller numbers mean a higher performance
1 This benchmark is not used for the average calculation

Game Benchmarks

The following benchmarks stem from our benchmarks of review laptops. The performance depends on the used graphics memory, clock rate, processor, system settings, drivers, and operating systems. So the results don't have to be representative for all laptops with this GPU. For detailed information on the benchmark results, click on the fps number.

low 1280x720
Radeon R5 (Stoney Ridge):
30.9  fps
med. 1920x1080
Radeon R5 (Stoney Ridge):
9.9  fps
low 1280x720
Radeon R5 (Stoney Ridge):
6  fps
med. 1920x1080
Radeon R5 (Stoney Ridge):
2  fps
low 1280x720
Radeon R5 (Stoney Ridge):
8.4  fps
med. 1920x1080
Radeon R5 (Stoney Ridge):
4.3  fps
low 1280x720
Radeon R5 (Stoney Ridge):
15.4  fps
med. 1920x1080
Radeon R5 (Stoney Ridge):
7  fps
low 1280x720
Radeon R5 (Stoney Ridge):
12.3  fps
med. 1920x1080
Radeon R5 (Stoney Ridge):
7  fps
low 1280x720
Radeon R5 (Stoney Ridge):
22.5  fps
med. 1920x1080
Radeon R5 (Stoney Ridge):
11.8  fps
low 1280x720
100%
HD Graphics 400 (Braswell):
14.1  fps
277%
Radeon R5 (Stoney Ridge):
39  fps
med. 1920x1080
Radeon R5 (Stoney Ridge):
14  fps
Hitman 2

Hitman 2

2018
low 1280x720
Radeon R5 (Stoney Ridge):
7.4  fps
med. 1920x1080
Radeon R5 (Stoney Ridge):
3.5  fps
low 1280x720
Radeon R5 (Stoney Ridge):
10  fps
med. 1920x1080
Radeon R5 (Stoney Ridge):
4  fps
low 1280x720
Radeon R5 (Stoney Ridge):
13  fps
med. 1920x1080
Radeon R5 (Stoney Ridge):
5  fps
low 1280x720
Radeon R5 (Stoney Ridge):
13  fps
med. 1920x1080
Radeon R5 (Stoney Ridge):
4  fps
F1 2018

F1 2018

2018
low 1280x720
Radeon R5 (Stoney Ridge):
12  fps
med. 1920x1080
Radeon R5 (Stoney Ridge):
12  fps
low 1280x720
Radeon R5 (Stoney Ridge):
4  fps
med. 1920x1080
Radeon R5 (Stoney Ridge):
1  fps
Far Cry 5

Far Cry 5

2018
low 1280x720
Radeon R5 (Stoney Ridge):
4  fps
med. 1920x1080
Radeon R5 (Stoney Ridge):
1  fps
low 1280x720
Radeon R5 (Stoney Ridge):
13.7  fps
med. 1920x1080
Radeon R5 (Stoney Ridge):
9.4  fps
low 1280x720
Radeon R5 (Stoney Ridge):
7.5  fps
med. 1920x1080
Radeon R5 (Stoney Ridge):
3  fps
low 1280x720
Radeon R5 (Stoney Ridge):
8.1  fps
med. 1920x1080
Radeon R5 (Stoney Ridge):
4.3  fps
Fortnite

Fortnite

2018
low 1280x720
Radeon R5 (Stoney Ridge):
28  fps
med. 1920x1080
Radeon R5 (Stoney Ridge):
7  fps
Destiny 2

Destiny 2

2017
low 1280x720
Radeon R5 (Stoney Ridge):
10  fps
ELEX

ELEX

2017
low 1280x720
Radeon R5 (Stoney Ridge):
6  fps
low 1280x720
Radeon R5 (Stoney Ridge):
6  fps
low 1280x720
Radeon R5 (Stoney Ridge):
8  fps
FIFA 18

FIFA 18

2017
low 1280x720
Radeon R5 (Stoney Ridge):
42.6  fps
med. 1920x1080
Radeon R5 (Stoney Ridge):
19.4  fps
low 1280x720
Radeon R5 (Stoney Ridge):
15  fps
med. 1920x1080
Radeon R5 (Stoney Ridge):
6.2  fps
F1 2017

F1 2017

2017
low 1280x720
Radeon R5 (Stoney Ridge):
18  fps
med. 1920x1080
Radeon R5 (Stoney Ridge):
13  fps
high 1920x1080
Radeon R5 (Stoney Ridge):
10  fps
low 1280x720
Radeon R5 (Stoney Ridge):
12.1  fps
low 1280x720
100%
HD Graphics 400 (Braswell):
18.5  fps
190%
Radeon R5 (Stoney Ridge):
35.2  fps
med. 1366x768
100%
HD Graphics 400 (Braswell):
16  fps
205%
Radeon R5 (Stoney Ridge):
32.8  fps
Dirt 4

Dirt 4

2017
low 1280x720
Radeon R5 (Stoney Ridge):
32.8  fps
low 1280x720
100%
HD Graphics 400 (Braswell):
12.7  fps
354%
Radeon R5 (Stoney Ridge):
41.4 47.8 ~ 45 fps
med. 1920x1080
Radeon R5 (Stoney Ridge):
19.9 25.6 ~ 23 fps
high 1920x1080
Radeon R5 (Stoney Ridge):
16.3  fps
Prey

Prey

2017
low 1280x720
100%
HD Graphics 400 (Braswell):
6.8  fps
316%
Radeon R5 (Stoney Ridge):
21.5  fps
low 1280x720
Radeon R5 (Stoney Ridge):
12.2  fps
low 1280x720
Radeon R5 (Stoney Ridge):
10.9  fps
med. 1920x1080
Radeon R5 (Stoney Ridge):
5.2  fps
For Honor

For Honor

2017
low 1280x720
Radeon R5 (Stoney Ridge):
19.9  fps
med. 1920x1080
Radeon R5 (Stoney Ridge):
7.3  fps
low 1280x720
100%
HD Graphics 400 (Braswell):
10.7  fps
267%
Radeon R5 (Stoney Ridge):
28.6  fps
med. 1920x1080
Radeon R5 (Stoney Ridge):
13.2  fps
low 1280x720
100%
HD Graphics 400 (Braswell):
20.9  fps
256%
Radeon R5 (Stoney Ridge):
53.4  fps
med. 1366x768
100%
HD Graphics 400 (Braswell):
5.8  fps
622%
Radeon R5 (Stoney Ridge):
36.1  fps
low 1024x768
100%
HD Graphics 400 (Braswell):
9.7  fps
303%
Radeon R5 (Stoney Ridge):
29.4  fps
med. 1366x768
Radeon R5 (Stoney Ridge):
12.1  fps
Overwatch

Overwatch

2016
low 1280x720
100%
HD Graphics 400 (Braswell):
15 15.1 ~ 15 fps
203%
Radeon R5 (Stoney Ridge):
30.4  fps
med. 1366x768
100%
HD Graphics 400 (Braswell):
9.5 9.7 ~ 10 fps
246%
Radeon R5 (Stoney Ridge):
24.6  fps
low 1280x768
Radeon R5 (Stoney Ridge):
7  fps
low 1280x720
Radeon R5 (Stoney Ridge):
4  fps
med. 1366x768
Radeon R5 (Stoney Ridge):
2  fps
low 1280x720
Radeon R5 (Stoney Ridge):
18.2  fps
med. 1366x768
Radeon R5 (Stoney Ridge):
11.3  fps
low 1024x768
100%
HD Graphics 400 (Braswell):
5.3  fps
283%
Radeon R5 (Stoney Ridge):
14 16.1 ~ 15 fps
med. 1366x768
Radeon R5 (Stoney Ridge):
8 10.4 ~ 9 fps
low 1024x768
100%
HD Graphics 400 (Braswell):
7.3  fps
368%
Radeon R5 (Stoney Ridge):
26.9  fps
med. 1366x768
100%
HD Graphics 400 (Braswell):
3.2  fps
675%
Radeon R5 (Stoney Ridge):
21.6  fps
low 1024x768
HD Graphics (Broadwell):
15.3  fps
med. 1366x768
HD Graphics (Broadwell):
8.5  fps
FIFA 16

FIFA 16

2015
low 1280x720
100%
HD Graphics 400 (Braswell):
36.5  fps
104%
HD Graphics (Broadwell):
38.1  fps
high 1366x768
100%
HD Graphics 400 (Braswell):
14.2  fps
145%
HD Graphics (Broadwell):
20.6  fps
ultra 1920x1080
100%
HD Graphics 400 (Braswell):
9  fps
low 1366x768
100%
HD Graphics 400 (Braswell):
13  fps
290%
Radeon R5 (Stoney Ridge):
37.7  fps
223%
HD Graphics (Broadwell):
29  fps
med. 1366x768
100%
HD Graphics 400 (Braswell):
8  fps
360%
Radeon R5 (Stoney Ridge):
28.8  fps
260%
HD Graphics (Broadwell):
20.8  fps
low 1024x768
100%
HD Graphics 400 (Braswell):
13.3  fps
256%
Radeon R5 (Stoney Ridge):
34.1  fps
med. 1366x768
Radeon R5 (Stoney Ridge):
24.9  fps
low 1280x720
100%
HD Graphics 400 (Braswell):
21.3  fps
160%
Radeon R5 (Stoney Ridge):
33.1 35.2 ~ 34 fps
med. 1366x768
100%
HD Graphics 400 (Braswell):
11.4  fps
184%
Radeon R5 (Stoney Ridge):
19.2 23.2 ~ 21 fps
low 1280x720
Radeon R5 (Stoney Ridge):
8  fps
med. 1366x768
Radeon R5 (Stoney Ridge):
5  fps
low 1024x768
100%
HD Graphics 400 (Braswell):
8.5  fps
106%
Radeon R5 (Stoney Ridge):
9  fps
med. 1366x768
100%
HD Graphics 400 (Braswell):
5.6  fps
low 1024x768
100%
HD Graphics 400 (Braswell):
40.1  fps
149%
Radeon R5 (Stoney Ridge):
59.7  fps
125%
HD Graphics (Broadwell):
50  fps
med. 1366x768
100%
HD Graphics 400 (Braswell):
11.7  fps
188%
Radeon R5 (Stoney Ridge):
22  fps
115%
HD Graphics (Broadwell):
13.5  fps
GTA V

GTA V

2015
low 1024x768
100%
HD Graphics 400 (Braswell):
14.3  fps
low 1024x768
HD Graphics (Broadwell):
23.9  fps
med. 1366x768
HD Graphics (Broadwell):
16.4  fps
low 1024x768
100%
HD Graphics 400 (Braswell):
5.4  fps
357%
Radeon R5 (Stoney Ridge):
19.3  fps
257%
HD Graphics (Broadwell):
13.9  fps
med. 1366x768
100%
HD Graphics 400 (Braswell):
2.9  fps
510%
Radeon R5 (Stoney Ridge):
14.8  fps
324%
HD Graphics (Broadwell):
9.4  fps
low 1024x768
Radeon R5 (Stoney Ridge):
12  fps
F1 2014

F1 2014

2014
low 1024x768
100%
HD Graphics 400 (Braswell):
27  fps
144%
Radeon R5 (Stoney Ridge):
39  fps
126%
HD Graphics (Broadwell):
34  fps
med. 1366x768
100%
HD Graphics 400 (Braswell):
16  fps
188%
Radeon R5 (Stoney Ridge):
30  fps
150%
HD Graphics (Broadwell):
24  fps
low 1024x768
100%
HD Graphics 400 (Braswell):
11.5 11.9 ~ 12 fps
225%
Radeon R5 (Stoney Ridge):
27  fps
med. 1366x768
100%
HD Graphics 400 (Braswell):
7  fps
243%
Radeon R5 (Stoney Ridge):
17  fps
low 1280x720
Radeon R5 (Stoney Ridge):
16 22.3 ~ 19 fps
med. 1344x756
Radeon R5 (Stoney Ridge):
11 13.8 ~ 12 fps
Sims 4

Sims 4

2014
low 1024x768
100%
HD Graphics 400 (Braswell):
37  fps
302%
Radeon R5 (Stoney Ridge):
111.9  fps
307%
HD Graphics (Broadwell):
113.6  fps
med. 1366x768
100%
HD Graphics 400 (Braswell):
7.6  fps
451%
Radeon R5 (Stoney Ridge):
34.3  fps
346%
HD Graphics (Broadwell):
26.3  fps
low 1024x768
100%
HD Graphics 400 (Braswell):
6.5  fps
322%
Radeon R5 (Stoney Ridge):
20.9  fps
med. 1366x768
100%
HD Graphics 400 (Braswell):
4.8  fps
269%
Radeon R5 (Stoney Ridge):
12.9  fps
low 1024x768
100%
HD Graphics 400 (Braswell):
28.9  fps
225%
Radeon R5 (Stoney Ridge):
65.1  fps
199%
HD Graphics (Broadwell):
57.6  fps
med. 1366x768
100%
HD Graphics 400 (Braswell):
12.5  fps
238%
Radeon R5 (Stoney Ridge):
29.7  fps
181%
HD Graphics (Broadwell):
22.6  fps
low 1024x768
100%
HD Graphics 400 (Braswell):
11.8  fps
269%
Radeon R5 (Stoney Ridge):
31.7  fps
med. 1366x768
Radeon R5 (Stoney Ridge):
17.7  fps
high 1366x768
Radeon R5 (Stoney Ridge):
9.6  fps
low 1024x768
100%
HD Graphics 400 (Braswell):
16.2  fps
med. 1366x768
100%
HD Graphics 400 (Braswell):
12.3  fps
high 1366x768
100%
HD Graphics 400 (Braswell):
7.9  fps
low 1024x768
Radeon R5 (Stoney Ridge):
44  fps
med. 1366x768
Radeon R5 (Stoney Ridge):
26  fps
high 1366x768
Radeon R5 (Stoney Ridge):
14  fps
Dead Trigger 2

Dead Trigger 2

2013
high
100%
HD Graphics 400 (Braswell):
30  fps
F1 2013

F1 2013

2013
low 1024x768
100%
HD Graphics 400 (Braswell):
28  fps
med. 1366x768
100%
HD Graphics 400 (Braswell):
17  fps
Asphalt 8: Airborne

Asphalt 8: Airborne

2013
low
100%
HD Graphics 400 (Braswell):
30  fps
high
100%
HD Graphics 400 (Braswell):
30  fps
low 1024x768
Radeon R5 (Stoney Ridge):
13  fps
med. 1366x768
Radeon R5 (Stoney Ridge):
10  fps
high 1366x768
Radeon R5 (Stoney Ridge):
5  fps
GRID 2

GRID 2

2013
low 1024x768
100%
HD Graphics 400 (Braswell):
19.9  fps
266%
Radeon R5 (Stoney Ridge):
52.9  fps
med. 1366x768
100%
HD Graphics 400 (Braswell):
12.5  fps
254%
Radeon R5 (Stoney Ridge):
31.8  fps
high 1366x768
Radeon R5 (Stoney Ridge):
26  fps
ultra 1920x1080
Radeon R5 (Stoney Ridge):
12.5  fps
low 1024x768
Radeon R5 (Stoney Ridge):
13  fps
HD Graphics (Broadwell):
13.7  fps
med. 1366x768
Radeon R5 (Stoney Ridge):
10  fps
HD Graphics (Broadwell):
10.7  fps
high 1366x768
Radeon R5 (Stoney Ridge):
6  fps
HD Graphics (Broadwell):
7  fps
low 1280x720
100%
HD Graphics 400 (Braswell):
16.2 16.5 16.9 18.1 18.5 18.7 18.8 19.5 ~ 18 fps
239%
Radeon R5 (Stoney Ridge):
38 43.4 43.5 47.3 ~ 43 fps
141%
HD Graphics (Broadwell):
25.3  fps
med. 1366x768
100%
HD Graphics 400 (Braswell):
7.2 7.8 8.5 8.8 8.9 9.1 9.6 ~ 9 fps
211%
Radeon R5 (Stoney Ridge):
0 (!) 22 26.9 28 ~ 19 fps
157%
HD Graphics (Broadwell):
14.1  fps
high 1366x768
100%
HD Graphics 400 (Braswell):
6.2  fps
257%
Radeon R5 (Stoney Ridge):
0 (!) 18 22.2 23 ~ 16 fps
188%
HD Graphics (Broadwell):
11.7  fps
ultra 1920x1080
100%
HD Graphics 400 (Braswell):
1.8  fps
222%
Radeon R5 (Stoney Ridge):
0 (!) 7.5 ~ 4 fps
low 1024x768
100%
HD Graphics 400 (Braswell):
24.8  fps
209%
Radeon R5 (Stoney Ridge):
51.9  fps
140%
HD Graphics (Broadwell):
34.7  fps
med. 1366x768
100%
HD Graphics 400 (Braswell):
10.2 (!)  fps
252%
Radeon R5 (Stoney Ridge):
25.7  fps
174%
HD Graphics (Broadwell):
17.7  fps
high 1366x768
Radeon R5 (Stoney Ridge):
18.2  fps
HD Graphics (Broadwell):
11.7  fps
low 1024x768
100%
HD Graphics 400 (Braswell):
21.1  fps
303%
Radeon R5 (Stoney Ridge):
63.9  fps
med. 1366x768
100%
HD Graphics 400 (Braswell):
10.8  fps
287%
Radeon R5 (Stoney Ridge):
31  fps
high 1366x768
100%
HD Graphics 400 (Braswell):
8.7  fps
306%
Radeon R5 (Stoney Ridge):
26.6  fps
low 1024x768
HD Graphics (Broadwell):
15.6  fps
med. 1366x768
HD Graphics (Broadwell):
11.4  fps
high 1366x768
HD Graphics (Broadwell):
5.3  fps
low 1024x768
100%
HD Graphics 400 (Braswell):
10.5  fps
373%
Radeon R5 (Stoney Ridge):
39.2  fps
416%
HD Graphics (Broadwell):
43.7  fps
med. 1366x768
Radeon R5 (Stoney Ridge):
28.5  fps
HD Graphics (Broadwell):
31.5  fps
high 1366x768
Radeon R5 (Stoney Ridge):
25  fps
HD Graphics (Broadwell):
23.9  fps
low 1024x768
100%
HD Graphics 400 (Braswell):
18.3  fps
326%
Radeon R5 (Stoney Ridge):
59.6  fps
210%
HD Graphics (Broadwell):
38.4  fps
med. 1366x768
Radeon R5 (Stoney Ridge):
41.8  fps
HD Graphics (Broadwell):
24.9  fps
high 1366x768
Radeon R5 (Stoney Ridge):
33.6  fps
HD Graphics (Broadwell):
19.7  fps
Anno 2070

Anno 2070

2011
low 1024x768
100%
HD Graphics 400 (Braswell):
27.7  fps
low 1280x720
100%
HD Graphics 400 (Braswell):
19.8  fps
165%
Radeon R5 (Stoney Ridge):
32.7  fps
med. 1366x768
100%
HD Graphics 400 (Braswell):
9.5  fps
234%
Radeon R5 (Stoney Ridge):
22.2  fps
high 1366x768
Radeon R5 (Stoney Ridge):
15.4  fps
low 1024x768
Radeon R5 (Stoney Ridge):
35  fps
med. 1366x768
Radeon R5 (Stoney Ridge):
27  fps
high 1366x768
Radeon R5 (Stoney Ridge):
13  fps
low 1024x768
100%
HD Graphics 400 (Braswell):
18.4  fps
339%
Radeon R5 (Stoney Ridge):
62.4  fps
high 1366x768
100%
HD Graphics 400 (Braswell):
11.3  fps
257%
Radeon R5 (Stoney Ridge):
29  fps
Dirt 3

Dirt 3

2011
low 800x600
100%
HD Graphics 400 (Braswell):
29.4  fps
med. 1024x768
100%
HD Graphics 400 (Braswell):
14.3  fps
high 1360x768
100%
HD Graphics 400 (Braswell):
12.5  fps
Mafia 2

Mafia 2

2010
low 800x600
Radeon R5 (Stoney Ridge):
26  fps
med. 1024x768
Radeon R5 (Stoney Ridge):
21  fps
high 1360x768
Radeon R5 (Stoney Ridge):
17  fps
low 1024x768
100%
HD Graphics 400 (Braswell):
34.5  fps
236%
Radeon R5 (Stoney Ridge):
81.4  fps
med. 1360x768
100%
HD Graphics 400 (Braswell):
8.8  fps
276%
Radeon R5 (Stoney Ridge):
24.3  fps
high 1360x768
100%
HD Graphics 400 (Braswell):
5.6  fps
332%
Radeon R5 (Stoney Ridge):
18.6  fps
ultra 1920x1080
Radeon R5 (Stoney Ridge):
12.4  fps
Trackmania Nations Forever

Trackmania Nations Forever

2008
low 640x480
100%
HD Graphics 400 (Braswell):
60 88.5 ~ 74 fps
high 1024x768
100%
HD Graphics 400 (Braswell):
22.6 25.2 ~ 24 fps
ultra 1920x1080
100%
HD Graphics 400 (Braswell):
9.9  fps
World of Warcraft

World of Warcraft

2005
low 800x600
Radeon R5 (Stoney Ridge):
82.6  fps
med. 1024x768
Radeon R5 (Stoney Ridge):
43.7  fps

Average Gaming Intel HD Graphics 400 (Braswell) → 100%

Average Gaming 30-70 fps → 100%

Average Gaming AMD Radeon R5 (Stoney Ridge) → 279%

Average Gaming 30-70 fps → 273%

Average Gaming Intel HD Graphics (Broadwell) → 204%

Average Gaming 30-70 fps → 189%

Intel HD Graphics 400 (Braswell)AMD Radeon R5 (Stoney Ridge)Intel HD Graphics (Broadwell)
lowmed.highultraQHD4Klowmed.highultraQHD4Klowmed.highultraQHD4K
Dirt Rally 2.030.99.9
Far Cry New Dawn62
Metro Exodus8.44.3
Apex Legends15.47
Just Cause 412.37
Darksiders III22.511.8
Farming Simulator 1914.13914
Hitman 27.43.5
Assassin´s Creed Odyssey104
Forza Horizon 4135
Shadow of the Tomb Raider134
F1 20181212
Monster Hunter World41
Far Cry 541
X-Plane 11.1113.79.4
Kingdom Come: Deliverance7.53
Final Fantasy XV Benchmark8.14.3
Fortnite287
Destiny 210
ELEX6
The Evil Within 26
Middle-earth: Shadow of War8
FIFA 1842.619.4
Ark Survival Evolved156.2
F1 2017181310
Playerunknown's Battlegrounds (PUBG)12.1
Team Fortress 218.51635.232.8
Dirt 432.8
Rocket League12.7452316.3
Prey6.821.5
Mass Effect Andromeda12.2
Ghost Recon Wildlands10.95.2
For Honor19.97.3
Resident Evil 710.728.613.2
Farming Simulator 1720.95.853.436.1
Civilization 69.729.412.1
Overwatch151030.424.6
Ashes of the Singularity7
Hitman 201642
The Division18.211.3
Rise of the Tomb Raider5.3159
Rainbow Six Siege7.33.226.921.6
World of Warships13837.728.82920.8
Metal Gear Solid V13.334.124.9
Dota 2 Reborn21.311.43421
Batman: Arkham Knight85
The Witcher 38.55.69
Dirt Rally40.111.759.7225013.5
Dragon Age: Inquisition5.42.919.314.813.99.4
Call of Duty: Advanced Warfare12
F1 2014271639303424
Alien: Isolation1272717
Middle-earth: Shadow of Mordor1912
Sims 4377.6111.934.3113.626.3
Risen 3: Titan Lords6.54.820.912.9
GRID: Autosport28.912.565.129.757.622.6
X-Plane 10.2511.831.717.79.6
Batman: Arkham Origins442614
Company of Heroes 213105
GRID 219.912.552.931.82612.5
Metro: Last Light1310613.710.77
BioShock Infinite1896.231.8431916425.314.111.7
Tomb Raider24.810.251.925.718.234.717.711.7
Dead Space 321.110.88.763.93126.6
Counter-Strike: GO10.539.228.52543.731.523.9
Diablo III18.359.641.833.638.424.919.7
The Elder Scrolls V: Skyrim19.89.532.722.215.4
Batman: Arkham City352713
Deus Ex Human Revolution18.411.362.429
Mafia 2262117
StarCraft 234.58.85.681.424.318.612.4
World of Warcraft82.643.7
Intel HD Graphics 400 (Braswell)AMD Radeon R5 (Stoney Ridge)Intel HD Graphics (Broadwell)
lowmed.highultraQHD4Klowmed.highultraQHD4Klowmed.highultraQHD4K
< 30 fps
< 60 fps
< 120 fps
≥ 120 fps
28
3

20


4


1


< 30 fps
< 60 fps
< 120 fps
≥ 120 fps
44
22
6
52
8

16
1

3


< 30 fps
< 60 fps
< 120 fps
≥ 120 fps
4
6
1
10
1

5


For more games that might be playable and a list of all games and graphics cards visit our Gaming List

v1.33
log 30. 15:13:09

#0 ran 0s before starting gpusingle class +0s ... 0s

#1 checking url part for id 7349 +0s ... 0s

#2 checking url part for id 7447 +0s ... 0s

#3 checking url part for id 5979 +0s ... 0s

#4 redirected to Ajax server, took 1753881189s time from redirect:0 +0s ... 0s

#5 did not recreate cache, as it is less than 5 days old! Created at Mon, 28 Jul 2025 05:18:01 +0200 +0s ... 0s

#6 composed specs +0.022s ... 0.023s

#7 did output specs +0s ... 0.023s

#8 start showIntegratedCPUs +0s ... 0.023s

#9 getting avg benchmarks for device 7349 +0.022s ... 0.044s

#10 got single benchmarks 7349 +0.025s ... 0.069s

#11 getting avg benchmarks for device 7447 +0.004s ... 0.073s

#12 got single benchmarks 7447 +0.009s ... 0.082s

#13 getting avg benchmarks for device 5979 +0.004s ... 0.086s

#14 got single benchmarks 5979 +0.006s ... 0.092s

#15 got avg benchmarks for devices +0s ... 0.092s

#16 min, max, avg, median took s +0.032s ... 0.125s

#17 before gaming benchmark output +0s ... 0.125s

#18 Got 299 rows for game benchmarks. +0.015s ... 0.14s

#19 composed SQL query for gamebenchmarks +0s ... 0.14s

#20 got data and put it in $dataArray +0.003s ... 0.142s

#21 benchmarks composed for output. +0.023s ... 0.165s

#22 calculated avg scores. +0s ... 0.165s

#23 return log +0.001s ... 0.166s

Please share our article, every link counts!
Mail Logo
> Expert Reviews and News on Laptops, Smartphones and Tech Innovations > Benchmarks / Tech > Graphics Card Comparison - Head 2 Head
Redaktion, 2017-09- 8 (Update: 2023-07- 1)