NVIDIA GeForce GTX 1660 Ti Max-Q vs NVIDIA GeForce GTX 1050 Ti (Desktop)
NVIDIA GeForce GTX 1660 Ti Max-Q ► remove from comparison
The Nvidia GeForce GTX 1660 Ti with Max-Q Design is a mobile graphics card for laptops that is based on the Turing architecture (TU116 chip). It is designed for thin and light laptops and about 10-15% slower than a regular GTX 1660 Ti for laptops (depending on the cooling capabilities). According to the specifications, the Max-Q variant clocks 22% slower for the base speed and 16% for the boost speed.
Compared to the faster RTX 2000 GPUs (e.g. RTX 2060 ), the 1660Ti integrates no Raytracing or Tensor cores. The performance is similar to the old GTX 1070 (Max-Q) but at a reduced TGP of 60 Watt (versus 80 of the laptop version 115 Watt of the desktop version).
In April 2020 Nvidia refreshed the GTX 1660 Ti with the new codename N18E-G0-A1 with similar specs and pin compatible to the refreshed RTX chips (e.g., RTX 2070 Super Mobile ).
The Turing generation did not only introduce raytracing for the RTX cards, but also optimized the architecture of the cores and caches. According to Nvidia the CUDA cores offer now a concurrent execution of floating point and integer operations for increased performance in compute-heavy workloads of modern games. Furthermore, the caches were reworked (new unified memory architecture with twice the cache compared to Pascal). This leads to 50% more instructions per clock and a 40% more power efficient usage compared to Pascal.
Nvidia specifies a power consumption of 60 Watt TGP (Total Graphics Power) and therefore 20 Watts lower than a normal (Max-P) 1660Ti for laptops . Therefore, the Max-Q variant is well suited for thin and light gaming laptops. The TU116 chip is manufactured in 12nm FFN at TSMC.
NVIDIA GeForce GTX 1050 Ti (Desktop) ► remove from comparison
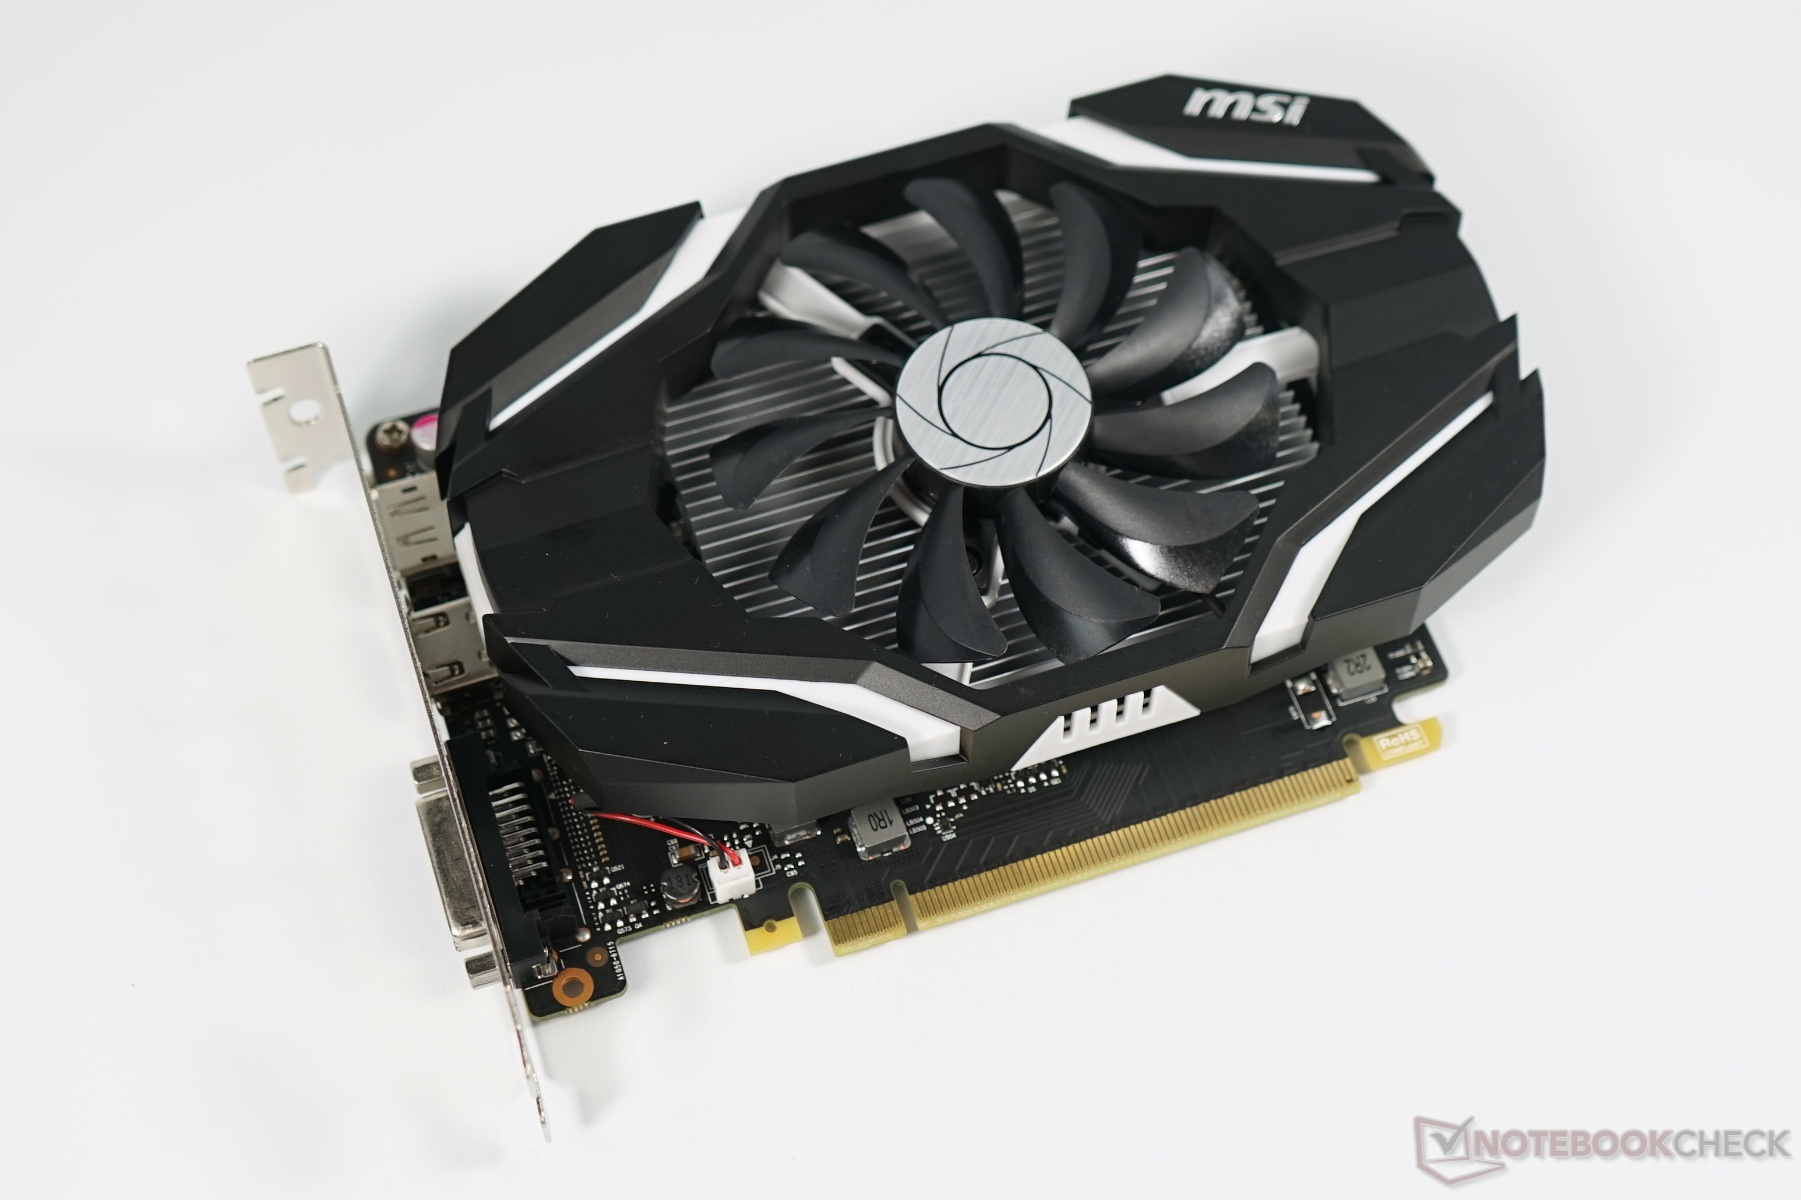
The Nvidia GeForce GTX 1050 Ti (N17P-G1) for desktops is an entry level gaming graphics card that was announced late 2016. It is based on the GP107 chip using the Pascal architecture and manufactured in 14nm FinFET at Samsung (the bigger Pascal chips are manufactured in 16nm at TSMC). Usually it is equipped with 4 GB GDDR5 memory with a 7 Gbps data rate. The mobile GTX 1050 Ti version should be announced later (beginning of 2017) and feature similar specs.
The performance of the GTX 1050 lies between the Radeon RX 460 and the RX 470 on a similar level of the old GeForce GTX 960 (or 970M ). Therefore, the card is most suited for 1080p gaming at high detail settings (but not maximum settings).
See our extensive review of the MSI GeForce GTX 1050 Ti for more information on power consumption, benchmarks and noise level.
NVIDIA GeForce GTX 1660 Ti Max-Q NVIDIA GeForce GTX 1050 Ti (Desktop) GeForce GTX 1000 Series Codename N18E-G0 N17P-G1 Architecture Turing Pascal Pipelines 1536 - unified 768 - unified Core Speed 1140 - 1335 (Boost) MHz 1290 - 1392 (Boost) MHz Memory Speed 12000 MHz 7008 MHz Memory Bus Width 192 Bit 128 Bit Memory Type GDDR6 GDDR5 Max. Amount of Memory 6 GB 4 GB Shared Memory no no API DirectX 12_1, OpenGL 4.6 DirectX 12_1, OpenGL 4.5 Power Consumption 60 Watt technology 12 nm 16 nm Notebook Size medium sized Date of Announcement 23.04.2019 25.10.2016 Link to Manufacturer Page www.nvidia.com Features Multi-Projection, VR Ready, G-SYNC, Vulkan, Multi Monitor
Benchmarks Performance Rating - 3DMark 11 + Fire Strike + Time Spy - GeForce GTX 1660 Ti Max-Q
6.1 pt (18%)
...
NVIDIA GeForce GTX 1660 Ti Max-Q
...
max:
3DMark - 3DMark Time Spy Score
min: 4547 avg: 5197 median: 5072 (15%) max: 6395 Points
min: 2474 avg: 2568 median: 2568 (7%) max: 2662 Points
3DMark - 3DMark Time Spy Graphics
min: 4867 avg: 5089 median: 5084.5 (13%) max: 5440 Points
min: 2277 avg: 2309 median: 2308.5 (6%) max: 2340 Points
3DMark - 3DMark Ice Storm Unlimited Graphics
min: 220799 avg: 314100 median: 306910 (35%) max: 414592 Points
352876 Points (40%)
3DMark - 3DMark Ice Storm Extreme Graphics
min: 76153 avg: 110626 median: 110626 (14%) max: 145099 Points
3DMark - 3DMark Cloud Gate Score
min: 16807 avg: 29350 median: 33027 (35%) max: 39942 Points
24195 Points (26%)
3DMark - 3DMark Cloud Gate Graphics
min: 38321 avg: 63736 median: 63086 (17%) max: 89505 Points
50939 Points (13%)
3DMark - 3DMark Fire Strike Standard Score
min: 10103 avg: 11548 median: 11615 (20%) max: 12739 Points
min: 6644 avg: 6783 median: 6816 (12%) max: 6888 Points
3DMark - 3DMark Fire Strike Standard Graphics
min: 12903 avg: 13356 median: 13355 (15%) max: 13870 Points
min: 7293 avg: 7491 median: 7485 (8%) max: 7696 Points
3DMark - 3DMark Ice Storm Graphics
min: 59373 avg: 104094 median: 86295 (10%) max: 166615 Points
3DMark 11 - 3DM11 Performance Score
min: 12279 avg: 15364 median: 15913 (22%) max: 17377 Points
min: 9151 avg: 9481 median: 9480.5 (13%) max: 9810 Points
3DMark 11 - 3DM11 Performance GPU
min: 17010 avg: 17711 median: 17439 (15%) max: 18653 Points
min: 9212 avg: 9453 median: 9453 (8%) max: 9694 Points
3DMark Vantage + NVIDIA GeForce GTX 1660 Ti Max-Q 3DMark Vantage - 3DM Vant. Perf. total
31845 Points (9%)
3DM Vant. Perf. GPU no PhysX + NVIDIA GeForce GTX 1660 Ti Max-Q 3DMark Vantage - 3DM Vant. Perf. GPU no PhysX
34951 Points (20%)
3DMark 06 3DMark 06 - Standard 1280x1024 + NVIDIA GeForce GTX 1660 Ti Max-Q
min: 24029 avg: 28247 median: 25211 (33%) max: 38536 Points
3DMark 06 - Standard 1280x1024 + NVIDIA GeForce GTX 1050 Ti (Desktop)
min: 36277 avg: 38484 median: 38483.5 (50%) max: 40690 Points
Unigine Valley 1.0 - Unigine Valley 1.0 DX
40.7 fps (13%)
Cinebench R10 Cinebench R10 Shading (32bit) + NVIDIA GeForce GTX 1660 Ti Max-Q Cinebench R10 - Cinebench R10 Shading (32bit)
min: 6820 avg: 9290 median: 8562.5 (6%) max: 13213 Points
Cinebench R11.5 Cinebench R11.5 OpenGL 64 Bit + NVIDIA GeForce GTX 1660 Ti Max-Q Cinebench R11.5 - Cinebench R11.5 OpenGL 64 Bit
min: 49.83 avg: 59.5 median: 59.5 (21%) max: 69.2 fps
Cinebench R15 + NVIDIA GeForce GTX 1660 Ti Max-Q Cinebench R15 - Cinebench R15 OpenGL 64 Bit
min: 78.2 avg: 100.5 median: 96.9 (6%) max: 130.7 fps
Cinebench R15 OpenGL 64 Bit + NVIDIA GeForce GTX 1050 Ti (Desktop)
min: 134.7 avg: 150.4 median: 150.4 (9%) max: 166 fps
Cinebench R15 OpenGL Ref. Match 64 Bit + NVIDIA GeForce GTX 1660 Ti Max-Q Cinebench R15 - Cinebench R15 OpenGL Ref. Match 64 Bit
99.6 % (100%)
Cinebench R15 OpenGL Ref. Match 64 Bit + NVIDIA GeForce GTX 1050 Ti (Desktop)
min: 99.6 avg: 99.8 median: 99.8 (100%) max: 100 %
GFXBench - GFXBench 5.0 Aztec Ruins High Tier Offscreen
110.2 fps (20%)
GFXBench - GFXBench 5.0 Aztec Ruins Normal Tier Offscreen
253.8 fps (19%)
GFXBench - GFXBench Car Chase Offscreen
227.4 fps (26%)
GFXBench 3.1 - GFXBench Manhattan ES 3.1 Offscreen
345.8 fps (7%)
GFXBench 3.0 - GFXBench 3.0 Manhattan Offscreen
360.6 fps (21%)
GFXBench (DX / GLBenchmark) 2.7 + NVIDIA GeForce GTX 1660 Ti Max-Q GFXBench (DX / GLBenchmark) 2.7 - GFXBench T-Rex HD Offscreen C24Z16
943 fps (8%)
LuxMark v2.0 64Bit - LuxMark v2.0 Room GPU
2141 Samples/s (10%)
1175 Samples/s (5%)
LuxMark v2.0 64Bit - LuxMark v2.0 Sala GPU
4254 Samples/s (7%)
2156 Samples/s (4%)
ComputeMark v2.1 - ComputeMark v2.1 Result
10027 Points (11%)
5493 Points (6%)
Power Consumption - Furmark Stress Test Power Consumption - external Monitor *
min: 77.6 avg: 86.3 median: 86.3 (12%) max: 95 Watt
164 Watt (23%)
Power Consumption - The Witcher 3 Power Consumption - external Monitor *
min: 92 avg: 96.6 median: 96.6 (13%) max: 101.2 Watt
155 Watt (22%)
Power Consumption - Witcher 3 Power Consumption *
min: 94.2 avg: 104.8 median: 106.9 (24%) max: 121 Watt
99.5 Watt (22%)
Power Consumption - Witcher 3 ultra Power Efficiency
min: 0.4388 avg: 0.5 median: 0.5 (47%) max: 0.537 fps per Watt
0.2 fps per Watt (24%)
Power Consumption - Witcher 3 ultra Power Efficiency - external Monitor
min: 0.4822 avg: 0.5 median: 0.5 (44%) max: 0.578 fps per Watt
0.2 fps per Watt (15%)
Emissions Witcher 3 Fan Noise + NVIDIA GeForce GTX 1660 Ti Max-Q Emissions - Witcher 3 Fan Noise
min: 34 avg: 43.4 median: 43.7 (70%) max: 53.8 dB(A)
Witcher 3 Fan Noise + NVIDIA GeForce GTX 1050 Ti (Desktop)
42 dB(A) (67%)
Clock Speed - GPU Clock Witcher 3 ultra
1501 MHz (59%)
Clock Speed - GPU Clock Speed Furmark
1062 MHz (42%)
Average Benchmarks NVIDIA GeForce GTX 1660 Ti Max-Q → 100% n=15 Average Benchmarks NVIDIA GeForce GTX 1050 Ti (Desktop) → 77% n=15
- Range of benchmark values for this graphics card
- Average benchmark values for this graphics card
* Smaller numbers mean a higher performance
1 This benchmark is not used for the average calculation
Game Benchmarks The following benchmarks stem from our benchmarks of review laptops. The performance depends on the used graphics memory, clock rate, processor, system settings, drivers, and operating systems. So the results don't have to be representative for all laptops with this GPU. For detailed information on the benchmark results, click on the fps number.
GeForce GTX 1050 Ti (Desktop):
31 [X] Asus Maximum XIII Hero Desktop MSI GTX 1050 Ti Intel Core i9-11900K 3.5GHz
GeForce GTX 1050 Ti (Desktop)
min:
19 fps
fps
GeForce GTX 1050 Ti (Desktop):
18 [X] Asus Maximum XIII Hero Desktop MSI GTX 1050 Ti Intel Core i9-11900K 3.5GHz
GeForce GTX 1050 Ti (Desktop)
min:
8 fps
fps
GeForce GTX 1050 Ti (Desktop):
11 [X] Asus Maximum XIII Hero Desktop MSI GTX 1050 Ti Intel Core i9-11900K 3.5GHz
GeForce GTX 1050 Ti (Desktop)
min:
5 fps
fps
GeForce GTX 1050 Ti (Desktop):
7 [X] Asus Maximum XIII Hero Desktop MSI GTX 1050 Ti Intel Core i9-11900K 3.5GHz
GeForce GTX 1050 Ti (Desktop)
min:
2 fps
fps
GeForce GTX 1050 Ti (Desktop):
86.5 [X] Asus Maximum XIII Hero Desktop MSI GTX 1050 Ti 918016
Intel Core i9-11900K 3.5GHz
GeForce GTX 1050 Ti (Desktop)
min:
74 fps, P1:
72 fps, max:
101 fps
fps
GeForce GTX 1050 Ti (Desktop):
75.3 [X] Asus Maximum XIII Hero Desktop MSI GTX 1050 Ti 918016
Intel Core i9-11900K 3.5GHz
GeForce GTX 1050 Ti (Desktop)
min:
64 fps, P1:
63 fps, max:
86 fps
fps
GeForce GTX 1050 Ti (Desktop):
52.5 [X] Asus Maximum XIII Hero Desktop MSI GTX 1050 Ti 918016
Intel Core i9-11900K 3.5GHz
GeForce GTX 1050 Ti (Desktop)
min:
46 fps, P1:
45 fps, max:
60 fps
fps
GeForce GTX 1050 Ti (Desktop):
65 [X] Asus Maximum XIII Hero Desktop MSI GTX 1050 Ti Intel Core i9-11900K 3.5GHz
GeForce GTX 1050 Ti (Desktop)
min:
40.3 fps, P0.1:
49.9 fps, P1:
53.2 fps, max:
202 fps
fps
GeForce GTX 1050 Ti (Desktop):
23.3 [X] Asus Maximum XIII Hero Desktop MSI GTX 1050 Ti Intel Core i9-11900K 3.5GHz
GeForce GTX 1050 Ti (Desktop)
min:
17.1 fps, P0.1:
17.5 fps, P1:
18.8 fps, max:
33 fps
fps
GeForce GTX 1050 Ti (Desktop):
15.8 [X] Asus Maximum XIII Hero Desktop MSI GTX 1050 Ti Intel Core i9-11900K 3.5GHz
GeForce GTX 1050 Ti (Desktop)
min:
12 fps, P0.1:
12.1 fps, P1:
13 fps, max:
20.3 fps
fps
GeForce GTX 1050 Ti (Desktop):
7.7 [X] Asus Maximum XIII Hero Desktop MSI GTX 1050 Ti Intel Core i9-11900K 3.5GHz
GeForce GTX 1050 Ti (Desktop)
min:
6.08 fps, P0.1:
6.1 fps, P1:
6.17 fps, max:
9.98 fps
fps
GeForce GTX 1050 Ti (Desktop):
55 [X] Asus Maximum XIII Hero Desktop MSI GTX 1050 Ti Intel Core i9-11900K 3.5GHz
GeForce GTX 1050 Ti (Desktop)
min:
14 fps, max:
73 fps
fps
GeForce GTX 1050 Ti (Desktop):
37 [X] Asus Maximum XIII Hero Desktop MSI GTX 1050 Ti Intel Core i9-11900K 3.5GHz
GeForce GTX 1050 Ti (Desktop)
min:
25 fps, max:
46 fps
fps
GeForce GTX 1050 Ti (Desktop):
36 [X] Asus Maximum XIII Hero Desktop MSI GTX 1050 Ti Intel Core i9-11900K 3.5GHz
GeForce GTX 1050 Ti (Desktop)
min:
25 fps, max:
46 fps
fps
GeForce GTX 1050 Ti (Desktop):
35 [X] Asus Maximum XIII Hero Desktop MSI GTX 1050 Ti Intel Core i9-11900K 3.5GHz
GeForce GTX 1050 Ti (Desktop)
min:
24 fps, max:
45 fps
fps
GeForce GTX 1050 Ti (Desktop):
24 [X] Asus Maximum XIII Hero Desktop MSI GTX 1050 Ti Intel Core i9-11900K 3.5GHz
GeForce GTX 1050 Ti (Desktop)
min:
14 fps, max:
29 fps
fps
GeForce GTX 1050 Ti (Desktop):
11 [X] Asus Maximum XIII Hero Desktop MSI GTX 1050 Ti Intel Core i9-11900K 3.5GHz
GeForce GTX 1050 Ti (Desktop)
min:
8 fps, max:
13 fps
fps
GeForce GTX 1050 Ti (Desktop):
185 [X] Aorus Z370 Ultra Gaming Desktop MSI GTX 1050 Ti 797778
Intel Core i7-8086K 3.7GHz
GeForce GTX 1050 Ti (Desktop)
min:
152 fps, P1:
142 fps, max:
230 fps
fps
GeForce GTX 1050 Ti (Desktop):
88.8 [X] Aorus Z370 Ultra Gaming Desktop MSI GTX 1050 Ti 797778
Intel Core i7-8086K 3.7GHz
GeForce GTX 1050 Ti (Desktop)
min:
74 fps, P1:
71 fps, max:
104 fps
fps
GeForce GTX 1050 Ti (Desktop):
71.7 [X] Aorus Z370 Ultra Gaming Desktop MSI GTX 1050 Ti 797778
Intel Core i7-8086K 3.7GHz
GeForce GTX 1050 Ti (Desktop)
min:
59 fps, P1:
56 fps, max:
83 fps
fps
GeForce GTX 1050 Ti (Desktop):
41.3 [X] Aorus Z370 Ultra Gaming Desktop MSI GTX 1050 Ti Intel Core i7-8086K 3.7GHz
GeForce GTX 1050 Ti (Desktop)
min:
17.7 fps, P0.1:
28.4 fps, P1:
32.5 fps, max:
81.3 fps
fps
GeForce GTX 1050 Ti (Desktop):
21.3 [X] Aorus Z370 Ultra Gaming Desktop MSI GTX 1050 Ti Intel Core i7-8086K 3.7GHz
GeForce GTX 1050 Ti (Desktop)
min:
14.9 fps, P0.1:
15.3 fps, P1:
18.1 fps, max:
35.3 fps
fps
GeForce GTX 1050 Ti (Desktop):
17 [X] Aorus Z370 Ultra Gaming Desktop MSI GTX 1050 Ti Intel Core i7-8086K 3.7GHz
GeForce GTX 1050 Ti (Desktop)
min:
12.5 fps, P0.1:
12.6 fps, P1:
13.3 fps, max:
19.3 fps
fps
100%
GeForce GTX 1660 Ti Max-Q:
55.1 fps
102%
GeForce GTX 1050 Ti (Desktop):
56.1 [X] Aorus Z370 Ultra Gaming Desktop MSI GTX 1050 Ti Intel Core i7-8086K 3.7GHz
GeForce GTX 1050 Ti (Desktop)
min:
7 fps, P1:
41.5 fps, max:
81 fps
fps
100%
GeForce GTX 1660 Ti Max-Q:
49.4 fps
52%
GeForce GTX 1050 Ti (Desktop):
25.6 [X] Aorus Z370 Ultra Gaming Desktop MSI GTX 1050 Ti Intel Core i7-8086K 3.7GHz
GeForce GTX 1050 Ti (Desktop)
min:
8 fps, P1:
21.2 fps, max:
55 fps
fps
100%
GeForce GTX 1660 Ti Max-Q:
37.1 fps
49%
GeForce GTX 1050 Ti (Desktop):
18.1 [X] Aorus Z370 Ultra Gaming Desktop MSI GTX 1050 Ti Intel Core i7-8086K 3.7GHz
GeForce GTX 1050 Ti (Desktop)
min:
10 fps, P1:
12.3 fps, max:
47 fps
fps
100%
GeForce GTX 1660 Ti Max-Q:
25.3 fps
48%
GeForce GTX 1050 Ti (Desktop):
12.1 [X] Aorus Z370 Ultra Gaming Desktop MSI GTX 1050 Ti Intel Core i7-8086K 3.7GHz
GeForce GTX 1050 Ti (Desktop)
min:
7 fps, P1:
8.3 fps, max:
26 fps
fps
GeForce GTX 1050 Ti (Desktop):
8.6 [X] Aorus Z370 Ultra Gaming Desktop MSI GTX 1050 Ti Intel Core i7-8086K 3.7GHz
GeForce GTX 1050 Ti (Desktop)
min:
6 fps, P1:
6.4 fps, max:
12 fps
fps
100%
GeForce GTX 1660 Ti Max-Q:
119 fps
100%
GeForce GTX 1660 Ti Max-Q:
78 fps
100%
GeForce GTX 1660 Ti Max-Q:
65 fps
100%
GeForce GTX 1660 Ti Max-Q:
51 fps
100%
GeForce GTX 1660 Ti Max-Q:
136.1 fps
100%
GeForce GTX 1660 Ti Max-Q:
87.7 fps
100%
GeForce GTX 1660 Ti Max-Q:
81.3 fps
100%
GeForce GTX 1660 Ti Max-Q:
78.4 fps
100%
GeForce GTX 1660 Ti Max-Q:
219 fps
100%
GeForce GTX 1660 Ti Max-Q:
130 fps
100%
GeForce GTX 1660 Ti Max-Q:
112 fps
100%
GeForce GTX 1660 Ti Max-Q:
79 fps
57%
GeForce GTX 1050 Ti (Desktop):
44.7 [X] Aorus Z370 Ultra Gaming Desktop MSI GTX 1050 Ti 670054
Intel Core i7-8086K 3.7GHz
GeForce GTX 1050 Ti (Desktop)
min:
34 fps, max:
54 fps
fps
GeForce GTX 1050 Ti (Desktop):
32.3 [X] Aorus Z370 Ultra Gaming Desktop MSI GTX 1050 Ti 670054
Intel Core i7-8086K 3.7GHz
GeForce GTX 1050 Ti (Desktop)
min:
25 fps, max:
38 fps
fps
GeForce GTX 1050 Ti (Desktop):
17.6 [X] Aorus Z370 Ultra Gaming Desktop MSI GTX 1050 Ti 670054
Intel Core i7-8086K 3.7GHz
GeForce GTX 1050 Ti (Desktop)
min:
14 fps, max:
20 fps
fps
100%
GeForce GTX 1660 Ti Max-Q:
214.7 fps
93%
GeForce GTX 1050 Ti (Desktop):
200 [X] Aorus Z370 Ultra Gaming Desktop MSI GTX 1050 Ti Intel Core i7-8086K 3.7GHz
GeForce GTX 1050 Ti (Desktop)
fps
100%
GeForce GTX 1660 Ti Max-Q:
130.2 fps
55%
GeForce GTX 1050 Ti (Desktop):
71.7 [X] Aorus Z370 Ultra Gaming Desktop MSI GTX 1050 Ti Intel Core i7-8086K 3.7GHz
GeForce GTX 1050 Ti (Desktop)
fps
100%
GeForce GTX 1660 Ti Max-Q:
79.9 fps
55%
GeForce GTX 1050 Ti (Desktop):
44.3 □ [X] Aorus Z370 Ultra Gaming Desktop MSI GTX 1050 Ti Intel Core i7-8086K 3.7GHz
GeForce GTX 1050 Ti (Desktop)
fps
100%
GeForce GTX 1660 Ti Max-Q:
56.1 fps
58%
GeForce GTX 1050 Ti (Desktop):
32.6 [X] Aorus Z370 Ultra Gaming Desktop MSI GTX 1050 Ti Intel Core i7-8086K 3.7GHz
GeForce GTX 1050 Ti (Desktop)
fps
GeForce GTX 1050 Ti (Desktop):
20.6 [X] Aorus Z370 Ultra Gaming Desktop MSI GTX 1050 Ti Intel Core i7-8086K 3.7GHz
GeForce GTX 1050 Ti (Desktop)
fps
100%
GeForce GTX 1660 Ti Max-Q:
168.9 fps
60%
GeForce GTX 1050 Ti (Desktop):
101 [X] Aorus Z370 Ultra Gaming Desktop MSI GTX 1050 Ti Intel Core i7-8086K 3.7GHz
GeForce GTX 1050 Ti (Desktop)
P1:
69 fps
fps
100%
GeForce GTX 1660 Ti Max-Q:
101.7 fps
62%
GeForce GTX 1050 Ti (Desktop):
62.9 [X] Aorus Z370 Ultra Gaming Desktop MSI GTX 1050 Ti Intel Core i7-8086K 3.7GHz
GeForce GTX 1050 Ti (Desktop)
P1:
55.2 fps
fps
100%
GeForce GTX 1660 Ti Max-Q:
95.4 fps
58%
GeForce GTX 1050 Ti (Desktop):
55.5 [X] Aorus Z370 Ultra Gaming Desktop MSI GTX 1050 Ti Intel Core i7-8086K 3.7GHz
GeForce GTX 1050 Ti (Desktop)
P1:
36.4 fps
fps
100%
GeForce GTX 1660 Ti Max-Q:
93.4 fps
57%
GeForce GTX 1050 Ti (Desktop):
52.9 [X] Aorus Z370 Ultra Gaming Desktop MSI GTX 1050 Ti Intel Core i7-8086K 3.7GHz
GeForce GTX 1050 Ti (Desktop)
P1:
33.1 fps
fps
GeForce GTX 1050 Ti (Desktop):
39.3 [X] Aorus Z370 Ultra Gaming Desktop MSI GTX 1050 Ti Intel Core i7-8086K 3.7GHz
GeForce GTX 1050 Ti (Desktop)
P1:
25.4 fps
fps
100%
GeForce GTX 1660 Ti Max-Q:
176.8 fps
62%
GeForce GTX 1050 Ti (Desktop):
109 [X] Aorus Z370 Ultra Gaming Desktop MSI GTX 1050 Ti Intel Core i7-8086K 3.7GHz
GeForce GTX 1050 Ti (Desktop)
min:
97 fps, max:
124 fps
fps
100%
GeForce GTX 1660 Ti Max-Q:
81.2 fps
51%
GeForce GTX 1050 Ti (Desktop):
41.6 [X] Aorus Z370 Ultra Gaming Desktop MSI GTX 1050 Ti Intel Core i7-8086K 3.7GHz
GeForce GTX 1050 Ti (Desktop)
min:
39 fps, max:
45 fps
fps
100%
GeForce GTX 1660 Ti Max-Q:
63.3 fps
53%
GeForce GTX 1050 Ti (Desktop):
33.5 [X] Aorus Z370 Ultra Gaming Desktop MSI GTX 1050 Ti Intel Core i7-8086K 3.7GHz
GeForce GTX 1050 Ti (Desktop)
min:
30 fps, max:
36 fps
fps
100%
GeForce GTX 1660 Ti Max-Q:
121.2 fps
100%
GeForce GTX 1660 Ti Max-Q:
98.3 fps
100%
GeForce GTX 1660 Ti Max-Q:
90.5 fps
56%
GeForce GTX 1050 Ti (Desktop):
50.9 [X] Aorus Z370 Ultra Gaming Desktop MSI GTX 1050 Ti Intel Core i7-8086K 3.7GHz
GeForce GTX 1050 Ti (Desktop)
min:
41 fps, max:
56 fps
fps
100%
GeForce GTX 1660 Ti Max-Q:
87.7 fps
46%
GeForce GTX 1050 Ti (Desktop):
40.2 [X] Aorus Z370 Ultra Gaming Desktop MSI GTX 1050 Ti Intel Core i7-8086K 3.7GHz
GeForce GTX 1050 Ti (Desktop)
min:
28 fps, max:
55 fps
fps
GeForce GTX 1050 Ti (Desktop):
32.4 [X] Aorus Z370 Ultra Gaming Desktop MSI GTX 1050 Ti Intel Core i7-8086K 3.7GHz
GeForce GTX 1050 Ti (Desktop)
min:
24 fps, max:
39 fps
fps
100%
GeForce GTX 1660 Ti Max-Q:
115.1 fps
65%
GeForce GTX 1050 Ti (Desktop):
75 [X] MSI GeForce GTX 1050 Ti Intel Core i7-7740X 4.3GHz
GeForce GTX 1050 Ti (Desktop)
min:
13 fps, P1:
66.7 fps, max:
140 fps
fps
100%
GeForce GTX 1660 Ti Max-Q:
71.7 fps
49%
GeForce GTX 1050 Ti (Desktop):
34.8 [X] MSI GeForce GTX 1050 Ti Intel Core i7-7740X 4.3GHz
GeForce GTX 1050 Ti (Desktop)
min:
24 fps, P1:
30.3 fps, max:
135 fps
fps
100%
GeForce GTX 1660 Ti Max-Q:
47.2 fps
47%
GeForce GTX 1050 Ti (Desktop):
22.3 [X] MSI GeForce GTX 1050 Ti Intel Core i7-7740X 4.3GHz
GeForce GTX 1050 Ti (Desktop)
min:
16.7 fps, P1:
17.5 fps, max:
128 fps
fps
100%
GeForce GTX 1660 Ti Max-Q:
29.4 fps
49%
GeForce GTX 1050 Ti (Desktop):
14.3 [X] MSI GeForce GTX 1050 Ti Intel Core i7-7740X 4.3GHz
GeForce GTX 1050 Ti (Desktop)
min:
5.82 fps, P1:
10 fps, max:
128 fps
fps
100%
GeForce GTX 1660 Ti Max-Q:
91.5 fps
100%
GeForce GTX 1660 Ti Max-Q:
78.1 fps
100%
GeForce GTX 1660 Ti Max-Q:
72.4 fps
100%
GeForce GTX 1660 Ti Max-Q:
95.8 fps
100%
GeForce GTX 1660 Ti Max-Q:
83 fps
100%
GeForce GTX 1660 Ti Max-Q:
73.9 fps
100%
GeForce GTX 1660 Ti Max-Q:
66.9 fps
100%
GeForce GTX 1660 Ti Max-Q:
135.2 fps
100%
GeForce GTX 1660 Ti Max-Q:
88 fps
100%
GeForce GTX 1660 Ti Max-Q:
72.6 fps
60%
GeForce GTX 1050 Ti (Desktop):
43.2 [X] MSI GeForce GTX 1050 Ti Intel Core i7-7740X 4.3GHz
GeForce GTX 1050 Ti (Desktop)
P1:
31.4 fps
fps
100%
GeForce GTX 1660 Ti Max-Q:
62.6 fps
54%
GeForce GTX 1050 Ti (Desktop):
33.9 [X] MSI GeForce GTX 1050 Ti Intel Core i7-7740X 4.3GHz
GeForce GTX 1050 Ti (Desktop)
P1:
24.8 fps
fps
GeForce GTX 1050 Ti (Desktop):
24 [X] MSI GeForce GTX 1050 Ti Intel Core i7-7740X 4.3GHz
GeForce GTX 1050 Ti (Desktop)
P1:
16.6 fps
fps
100%
GeForce GTX 1660 Ti Max-Q:
112.9 fps
100%
GeForce GTX 1660 Ti Max-Q:
86.5 fps
100%
GeForce GTX 1660 Ti Max-Q:
72 fps
100%
GeForce GTX 1660 Ti Max-Q:
58.7 fps
100%
GeForce GTX 1660 Ti Max-Q:
83 114 ~ 99 fps
100%
GeForce GTX 1660 Ti Max-Q:
68 72 ~ 70 fps
100%
GeForce GTX 1660 Ti Max-Q:
65 66 ~ 66 fps
100%
GeForce GTX 1660 Ti Max-Q:
48 51 ~ 50 fps
100%
GeForce GTX 1660 Ti Max-Q:
147.9 fps
100%
GeForce GTX 1660 Ti Max-Q:
145.4 fps
100%
GeForce GTX 1660 Ti Max-Q:
141 fps
100%
GeForce GTX 1660 Ti Max-Q:
139.3 fps
101%
GeForce GTX 1050 Ti (Desktop):
141 [X] MSI GeForce GTX 1050 Ti Intel Core i7-7740X 4.3GHz
GeForce GTX 1050 Ti (Desktop)
P1:
103.1 fps
fps
GeForce GTX 1050 Ti (Desktop):
107 [X] MSI GeForce GTX 1050 Ti Intel Core i7-7740X 4.3GHz
GeForce GTX 1050 Ti (Desktop)
P1:
84.7 fps
fps
GeForce GTX 1050 Ti (Desktop):
62 [X] MSI GeForce GTX 1050 Ti Intel Core i7-7740X 4.3GHz
GeForce GTX 1050 Ti (Desktop)
P1:
51.5 fps
fps
100%
GeForce GTX 1660 Ti Max-Q:
87 116.5 ~ 102 fps
113%
GeForce GTX 1050 Ti (Desktop):
115 [X] MSI GeForce GTX 1050 Ti Intel Core i7-7740X 4.3GHz
GeForce GTX 1050 Ti (Desktop)
fps
100%
GeForce GTX 1660 Ti Max-Q:
72.1 81.5 ~ 77 fps
62%
GeForce GTX 1050 Ti (Desktop):
47.5 [X] MSI GeForce GTX 1050 Ti Intel Core i7-7740X 4.3GHz
GeForce GTX 1050 Ti (Desktop)
fps
100%
GeForce GTX 1660 Ti Max-Q:
52.9 54.9 ~ 54 fps
55%
GeForce GTX 1050 Ti (Desktop):
29.6 [X] MSI GeForce GTX 1050 Ti Intel Core i7-7740X 4.3GHz
GeForce GTX 1050 Ti (Desktop)
fps
100%
GeForce GTX 1660 Ti Max-Q:
41.5 42.3 ~ 42 fps
52%
GeForce GTX 1050 Ti (Desktop):
21.8 [X] MSI GeForce GTX 1050 Ti Intel Core i7-7740X 4.3GHz
GeForce GTX 1050 Ti (Desktop)
fps
GeForce GTX 1050 Ti (Desktop):
15 [X] MSI GeForce GTX 1050 Ti Intel Core i7-7740X 4.3GHz
GeForce GTX 1050 Ti (Desktop)
fps
100%
GeForce GTX 1660 Ti Max-Q:
158.3 fps
59%
GeForce GTX 1050 Ti (Desktop):
94 [X] MSI GeForce GTX 1050 Ti Intel Core i7-7740X 4.3GHz
GeForce GTX 1050 Ti (Desktop)
min:
81 fps, max:
107 fps
fps
100%
GeForce GTX 1660 Ti Max-Q:
63.7 fps
47%
GeForce GTX 1050 Ti (Desktop):
29.9 [X] MSI GeForce GTX 1050 Ti Intel Core i7-7740X 4.3GHz
GeForce GTX 1050 Ti (Desktop)
min:
26 fps, max:
34 fps
fps
100%
GeForce GTX 1660 Ti Max-Q:
47.1 fps
45%
GeForce GTX 1050 Ti (Desktop):
21.3 [X] MSI GeForce GTX 1050 Ti Intel Core i7-7740X 4.3GHz
GeForce GTX 1050 Ti (Desktop)
min:
18 fps, max:
24 fps
fps
100%
GeForce GTX 1660 Ti Max-Q:
155 183 ~ 169 fps
97%
GeForce GTX 1050 Ti (Desktop):
164 [X] MSI GeForce GTX 1050 Ti Intel Core i7-7740X 4.3GHz
GeForce GTX 1050 Ti (Desktop)
min:
143 fps, max:
181 fps
fps
100%
GeForce GTX 1660 Ti Max-Q:
119 140 ~ 130 fps
56%
GeForce GTX 1050 Ti (Desktop):
73 [X] MSI GeForce GTX 1050 Ti Intel Core i7-7740X 4.3GHz
GeForce GTX 1050 Ti (Desktop)
min:
65 fps, max:
77 fps
fps
100%
GeForce GTX 1660 Ti Max-Q:
106 117 ~ 112 fps
47%
GeForce GTX 1050 Ti (Desktop):
52.8 [X] MSI GeForce GTX 1050 Ti Intel Core i7-7740X 4.3GHz
GeForce GTX 1050 Ti (Desktop)
min:
49 fps, max:
55 fps
fps
100%
GeForce GTX 1660 Ti Max-Q:
71 77 ~ 74 fps
51%
GeForce GTX 1050 Ti (Desktop):
37.4 [X] MSI GeForce GTX 1050 Ti Intel Core i7-7740X 4.3GHz
GeForce GTX 1050 Ti (Desktop)
min:
34 fps, max:
39 fps
fps
GeForce GTX 1050 Ti (Desktop):
29.3 [X] MSI GeForce GTX 1050 Ti Intel Core i7-7740X 4.3GHz
GeForce GTX 1050 Ti (Desktop)
min:
27 fps, max:
30 fps
fps
GeForce GTX 1050 Ti (Desktop):
18 [X] MSI GeForce GTX 1050 Ti Intel Core i7-7740X 4.3GHz
GeForce GTX 1050 Ti (Desktop)
min:
15 fps, max:
18 fps
fps
100%
GeForce GTX 1660 Ti Max-Q:
144.1 209.4 ~ 177 fps
86%
GeForce GTX 1050 Ti (Desktop):
153 [X] MSI GeForce GTX 1050 Ti Intel Core i7-7740X 4.3GHz
GeForce GTX 1050 Ti (Desktop)
min:
128 fps, max:
183 fps
fps
100%
GeForce GTX 1660 Ti Max-Q:
76.5 93.1 ~ 85 fps
60%
GeForce GTX 1050 Ti (Desktop):
51.4 [X] MSI GeForce GTX 1050 Ti Intel Core i7-7740X 4.3GHz
GeForce GTX 1050 Ti (Desktop)
min:
43 fps, max:
59 fps
fps
100%
GeForce GTX 1660 Ti Max-Q:
54.7 57.1 ~ 56 fps
56%
GeForce GTX 1050 Ti (Desktop):
31.5 [X] MSI GeForce GTX 1050 Ti Intel Core i7-7740X 4.3GHz
GeForce GTX 1050 Ti (Desktop)
min:
27 fps, max:
36 fps
fps
100%
GeForce GTX 1660 Ti Max-Q:
41.1 41.6 ~ 41 fps
52%
GeForce GTX 1050 Ti (Desktop):
21.4 [X] MSI GeForce GTX 1050 Ti Intel Core i7-7740X 4.3GHz
GeForce GTX 1050 Ti (Desktop)
min:
18 fps, max:
26 fps
fps
GeForce GTX 1050 Ti (Desktop):
12.8 [X] MSI GeForce GTX 1050 Ti Intel Core i7-7740X 4.3GHz
GeForce GTX 1050 Ti (Desktop)
min:
11 fps, max:
15 fps
fps
100%
GeForce GTX 1660 Ti Max-Q:
146.4 154.7 ~ 151 fps
100%
GeForce GTX 1660 Ti Max-Q:
70.9 76.2 ~ 74 fps
100%
GeForce GTX 1660 Ti Max-Q:
58.7 65.8 ~ 62 fps
100%
GeForce GTX 1660 Ti Max-Q:
58.2 64.8 ~ 62 fps
100%
GeForce GTX 1660 Ti Max-Q:
59.6 87.9 ~ 74 fps
100%
GeForce GTX 1660 Ti Max-Q:
58.7 83.2 ~ 71 fps
100%
GeForce GTX 1660 Ti Max-Q:
45.3 64.1 ~ 55 fps
100%
GeForce GTX 1660 Ti Max-Q:
26 33.2 ~ 30 fps
100%
GeForce GTX 1660 Ti Max-Q:
110 142 ~ 126 fps
124%
GeForce GTX 1050 Ti (Desktop):
156 [X] MSI GeForce GTX 1050 Ti Intel Core i7-7740X 4.3GHz
GeForce GTX 1050 Ti (Desktop)
min:
64.9351 fps, P1:
104.167 fps, max:
322.581 fps
fps
100%
GeForce GTX 1660 Ti Max-Q:
80 87 ~ 84 fps
64%
GeForce GTX 1050 Ti (Desktop):
53.6 [X] MSI GeForce GTX 1050 Ti Intel Core i7-7740X 4.3GHz
GeForce GTX 1050 Ti (Desktop)
min:
20.3666 fps, P1:
36.6596 fps, max:
86.9565 fps
fps
100%
GeForce GTX 1660 Ti Max-Q:
66 69 ~ 68 fps
61%
GeForce GTX 1050 Ti (Desktop):
41.4 [X] MSI GeForce GTX 1050 Ti Intel Core i7-7740X 4.3GHz
GeForce GTX 1050 Ti (Desktop)
min:
16.8634 fps, P1:
25.3165 fps, max:
83.3333 fps
fps
100%
GeForce GTX 1660 Ti Max-Q:
49 50 ~ 50 fps
63%
GeForce GTX 1050 Ti (Desktop):
31.5 [X] MSI GeForce GTX 1050 Ti Intel Core i7-7740X 4.3GHz
GeForce GTX 1050 Ti (Desktop)
min:
15.9744 fps, P1:
20.6612 fps, max:
59.8802 fps
fps
GeForce GTX 1050 Ti (Desktop):
21.5 [X] MSI GeForce GTX 1050 Ti Intel Core i7-7740X 4.3GHz
GeForce GTX 1050 Ti (Desktop)
min:
12.3609 fps, P1:
16.3319 fps, max:
45.6621 fps
fps
GeForce GTX 1050 Ti (Desktop):
10.2 [X] MSI GeForce GTX 1050 Ti Intel Core i7-7740X 4.3GHz
GeForce GTX 1050 Ti (Desktop)
min:
3.60881 fps, P1:
7.28385 fps, max:
16.7785 fps
fps
100%
GeForce GTX 1660 Ti Max-Q:
181.2 194.2 ~ 188 fps
79%
GeForce GTX 1050 Ti (Desktop):
149 [X] MSI GeForce GTX 1050 Ti Intel Core i7-7740X 4.3GHz
GeForce GTX 1050 Ti (Desktop)
min:
135 fps, max:
177 fps
fps
100%
GeForce GTX 1660 Ti Max-Q:
102.6 139.9 ~ 121 fps
55%
GeForce GTX 1050 Ti (Desktop):
67 [X] MSI GeForce GTX 1050 Ti Intel Core i7-7740X 4.3GHz
GeForce GTX 1050 Ti (Desktop)
min:
59 fps, max:
81 fps
fps
100%
GeForce GTX 1660 Ti Max-Q:
88.7 103.2 ~ 96 fps
54%
GeForce GTX 1050 Ti (Desktop):
52.3 [X] MSI GeForce GTX 1050 Ti Intel Core i7-7740X 4.3GHz
GeForce GTX 1050 Ti (Desktop)
min:
46 fps, max:
63 fps
fps
100%
GeForce GTX 1660 Ti Max-Q:
57.3 59.2 ~ 58 fps
56%
GeForce GTX 1050 Ti (Desktop):
32.3 [X] MSI GeForce GTX 1050 Ti Intel Core i7-7740X 4.3GHz
GeForce GTX 1050 Ti (Desktop)
min:
29 fps, max:
39 fps
fps
GeForce GTX 1050 Ti (Desktop):
23.5 [X] MSI GeForce GTX 1050 Ti Intel Core i7-7740X 4.3GHz
GeForce GTX 1050 Ti (Desktop)
min:
21 fps, max:
27 fps
fps
GeForce GTX 1050 Ti (Desktop):
13.4 [X] MSI GeForce GTX 1050 Ti Intel Core i7-7740X 4.3GHz
GeForce GTX 1050 Ti (Desktop)
min:
12 fps, max:
15 fps
fps
100%
GeForce GTX 1660 Ti Max-Q:
53.6 fps
100%
GeForce GTX 1660 Ti Max-Q:
48.9 fps
100%
GeForce GTX 1660 Ti Max-Q:
48.8 fps
100%
GeForce GTX 1660 Ti Max-Q:
46.4 fps
100%
GeForce GTX 1660 Ti Max-Q:
97 fps
90%
GeForce GTX 1050 Ti (Desktop):
87 [X] MSI GeForce GTX 1050 Ti Intel Core i7-7740X 4.3GHz
GeForce GTX 1050 Ti (Desktop)
min:
65 fps, max:
111 fps
fps
100%
GeForce GTX 1660 Ti Max-Q:
81 fps
59%
GeForce GTX 1050 Ti (Desktop):
48 [X] MSI GeForce GTX 1050 Ti Intel Core i7-7740X 4.3GHz
GeForce GTX 1050 Ti (Desktop)
min:
38 fps, max:
58 fps
fps
100%
GeForce GTX 1660 Ti Max-Q:
78 fps
58%
GeForce GTX 1050 Ti (Desktop):
45 [X] MSI GeForce GTX 1050 Ti Intel Core i7-7740X 4.3GHz
GeForce GTX 1050 Ti (Desktop)
min:
36 fps, max:
54 fps
fps
100%
GeForce GTX 1660 Ti Max-Q:
71 fps
58%
GeForce GTX 1050 Ti (Desktop):
41 [X] MSI GeForce GTX 1050 Ti Intel Core i7-7740X 4.3GHz
GeForce GTX 1050 Ti (Desktop)
min:
31 fps, max:
51 fps
fps
GeForce GTX 1050 Ti (Desktop):
29 [X] MSI GeForce GTX 1050 Ti Intel Core i7-7740X 4.3GHz
GeForce GTX 1050 Ti (Desktop)
min:
23 fps, max:
36 fps
fps
GeForce GTX 1050 Ti (Desktop):
14 [X] MSI GeForce GTX 1050 Ti Intel Core i7-7740X 4.3GHz
GeForce GTX 1050 Ti (Desktop)
min:
11 fps, max:
18 fps
fps
63%
GeForce GTX 1050 Ti (Desktop):
64.7 [X] MSI GeForce GTX 1050 Ti Intel Core i7-7740X 4.3GHz
GeForce GTX 1050 Ti (Desktop)
min:
34 fps, max:
116 fps
fps
100%
GeForce GTX 1660 Ti Max-Q:
53.9 60 66.5 ~ 60 fps
55%
GeForce GTX 1050 Ti (Desktop):
32.8 [X] MSI GeForce GTX 1050 Ti Intel Core i7-7740X 4.3GHz
GeForce GTX 1050 Ti (Desktop)
min:
17 fps, max:
53 fps
fps
51%
GeForce GTX 1050 Ti (Desktop):
24 [X] MSI GeForce GTX 1050 Ti Intel Core i7-7740X 4.3GHz
GeForce GTX 1050 Ti (Desktop)
min:
13 fps, max:
40 fps
fps
54%
GeForce GTX 1050 Ti (Desktop):
19.8 [X] MSI GeForce GTX 1050 Ti Intel Core i7-7740X 4.3GHz
GeForce GTX 1050 Ti (Desktop)
min:
11 fps, max:
32 fps
fps
GeForce GTX 1050 Ti (Desktop):
9.2 [X] MSI GeForce GTX 1050 Ti Intel Core i7-7740X 4.3GHz
GeForce GTX 1050 Ti (Desktop)
min:
6 fps, max:
14 fps
fps
100%
GeForce GTX 1660 Ti Max-Q:
144 144 ~ 144 fps
89%
GeForce GTX 1050 Ti (Desktop):
128 [X] MSI GeForce GTX 1050 Ti Intel Core i7-7740X 4.3GHz
GeForce GTX 1050 Ti (Desktop)
min:
115 fps, max:
144 fps
fps
100%
GeForce GTX 1660 Ti Max-Q:
105.3 133.9 ~ 120 fps
46%
GeForce GTX 1050 Ti (Desktop):
55.6 [X] MSI GeForce GTX 1050 Ti Intel Core i7-7740X 4.3GHz
GeForce GTX 1050 Ti (Desktop)
min:
46 fps, max:
69 fps
fps
100%
GeForce GTX 1660 Ti Max-Q:
90.1 99.6 ~ 95 fps
49%
GeForce GTX 1050 Ti (Desktop):
46.7 [X] MSI GeForce GTX 1050 Ti Intel Core i7-7740X 4.3GHz
GeForce GTX 1050 Ti (Desktop)
min:
41 fps, max:
57 fps
fps
100%
GeForce GTX 1660 Ti Max-Q:
89 99.6 ~ 94 fps
48%
GeForce GTX 1050 Ti (Desktop):
45 [X] MSI GeForce GTX 1050 Ti Intel Core i7-7740X 4.3GHz
GeForce GTX 1050 Ti (Desktop)
min:
33 fps, max:
57 fps
fps
GeForce GTX 1050 Ti (Desktop):
28.8 [X] MSI GeForce GTX 1050 Ti Intel Core i7-7740X 4.3GHz
GeForce GTX 1050 Ti (Desktop)
min:
25 fps, max:
37 fps
fps
GeForce GTX 1050 Ti (Desktop):
14.1 [X] MSI GeForce GTX 1050 Ti Intel Core i7-7740X 4.3GHz
GeForce GTX 1050 Ti (Desktop)
min:
11 fps, max:
18 fps
fps
GeForce GTX 1050 Ti (Desktop):
41.9 [X] MSI GeForce GTX 1050 Ti Intel Core i7-7740X 4.3GHz
GeForce GTX 1050 Ti (Desktop)
min:
38 fps, max:
45 fps
fps
GeForce GTX 1050 Ti (Desktop):
40.1 [X] MSI GeForce GTX 1050 Ti Intel Core i7-7740X 4.3GHz
GeForce GTX 1050 Ti (Desktop)
min:
37 fps, max:
44 fps
fps
100%
GeForce GTX 1660 Ti Max-Q:
135.6 fps
100%
GeForce GTX 1660 Ti Max-Q:
85.8 fps
100%
GeForce GTX 1660 Ti Max-Q:
77.4 fps
66%
GeForce GTX 1050 Ti (Desktop):
50.9 [X] MSI GeForce GTX 1050 Ti Intel Core i7-7740X 4.3GHz
GeForce GTX 1050 Ti (Desktop)
min:
45 fps, max:
58 fps
fps
100%
GeForce GTX 1660 Ti Max-Q:
72.8 fps
59%
GeForce GTX 1050 Ti (Desktop):
43.3 [X] MSI GeForce GTX 1050 Ti Intel Core i7-7740X 4.3GHz
GeForce GTX 1050 Ti (Desktop)
min:
39 fps, max:
49 fps
fps
116%
GeForce GTX 1050 Ti (Desktop):
140 [X] MSI GeForce GTX 1050 Ti Intel Core i7-7740X 4.3GHz
GeForce GTX 1050 Ti (Desktop)
min:
107 fps, max:
186 fps
fps
72%
GeForce GTX 1050 Ti (Desktop):
63 [X] MSI GeForce GTX 1050 Ti Intel Core i7-7740X 4.3GHz
GeForce GTX 1050 Ti (Desktop)
min:
52 fps, max:
92 fps
fps
66%
GeForce GTX 1050 Ti (Desktop):
51.9 [X] MSI GeForce GTX 1050 Ti Intel Core i7-7740X 4.3GHz
GeForce GTX 1050 Ti (Desktop)
min:
42 fps, max:
79 fps
fps
100%
GeForce GTX 1660 Ti Max-Q:
61 73 85 ~ 73 fps
70%
GeForce GTX 1050 Ti (Desktop):
50.9 [X] MSI GeForce GTX 1050 Ti Intel Core i7-7740X 4.3GHz
GeForce GTX 1050 Ti (Desktop)
min:
41 fps, max:
78 fps
fps
GeForce GTX 1050 Ti (Desktop):
35.6 [X] MSI GeForce GTX 1050 Ti Intel Core i7-7740X 4.3GHz
GeForce GTX 1050 Ti (Desktop)
min:
29 fps, max:
55 fps
fps
100%
GeForce GTX 1660 Ti Max-Q:
37.9 fps
46%
GeForce GTX 1050 Ti (Desktop):
17.5 [X] MSI GeForce GTX 1050 Ti Intel Core i7-7740X 4.3GHz
GeForce GTX 1050 Ti (Desktop)
min:
13 fps, max:
29 fps
fps
GeForce GTX 1050 Ti (Desktop):
60 [X] MSI GeForce GTX 1050 Ti Intel Core i7-7740X 4.3GHz
GeForce GTX 1050 Ti (Desktop)
min:
48 fps, max:
93 fps
fps
GeForce GTX 1050 Ti (Desktop):
20.3 [X] MSI GeForce GTX 1050 Ti Intel Core i7-7740X 4.3GHz
GeForce GTX 1050 Ti (Desktop)
min:
16 fps, max:
36 fps
fps
GeForce GTX 1050 Ti (Desktop):
46.4 [X] MSI GeForce GTX 1050 Ti Intel Core i7-7740X 4.3GHz
GeForce GTX 1050 Ti (Desktop)
min:
37 fps, max:
57 fps
fps
GeForce GTX 1050 Ti (Desktop):
30.7 [X] MSI GeForce GTX 1050 Ti Intel Core i7-7740X 4.3GHz
GeForce GTX 1050 Ti (Desktop)
min:
23 fps, max:
36 fps
fps
GeForce GTX 1050 Ti (Desktop):
39.1 [X] MSI GeForce GTX 1050 Ti Intel Core i7-7740X 4.3GHz
GeForce GTX 1050 Ti (Desktop)
min:
32 fps, max:
47 fps
fps
100%
GeForce GTX 1660 Ti Max-Q:
115.2 fps
100%
GeForce GTX 1660 Ti Max-Q:
87.9 fps
60%
GeForce GTX 1050 Ti (Desktop):
53 [X] MSI GeForce GTX 1050 Ti Intel Core i7-7740X 4.3GHz
GeForce GTX 1050 Ti (Desktop)
min:
34 fps, max:
73 fps
fps
100%
GeForce GTX 1660 Ti Max-Q:
84.6 fps
56%
GeForce GTX 1050 Ti (Desktop):
47.3 [X] MSI GeForce GTX 1050 Ti Intel Core i7-7740X 4.3GHz
GeForce GTX 1050 Ti (Desktop)
min:
34 fps, max:
63 fps
fps
100%
GeForce GTX 1660 Ti Max-Q:
83.1 fps
50%
GeForce GTX 1050 Ti (Desktop):
41.6 [X] MSI GeForce GTX 1050 Ti Intel Core i7-7740X 4.3GHz
GeForce GTX 1050 Ti (Desktop)
min:
30 fps, max:
57 fps
fps
100%
GeForce GTX 1660 Ti Max-Q:
48 64 90 ~ 67 fps
100%
GeForce GTX 1660 Ti Max-Q:
43 56 71 ~ 57 fps
84%
GeForce GTX 1050 Ti (Desktop):
48 [X] MSI GeForce GTX 1050 Ti Intel Core i7-7740X 4.3GHz
GeForce GTX 1050 Ti (Desktop)
min:
18 fps, max:
101 fps
fps
100%
GeForce GTX 1660 Ti Max-Q:
39 51 60 ~ 50 fps
80%
GeForce GTX 1050 Ti (Desktop):
40 [X] MSI GeForce GTX 1050 Ti Intel Core i7-7740X 4.3GHz
GeForce GTX 1050 Ti (Desktop)
min:
17 fps, max:
86 fps
fps
100%
GeForce GTX 1660 Ti Max-Q:
33 42 44 ~ 40 fps
60%
GeForce GTX 1050 Ti (Desktop):
24 [X] MSI GeForce GTX 1050 Ti Intel Core i7-7740X 4.3GHz
GeForce GTX 1050 Ti (Desktop)
min:
12 fps, max:
54 fps
fps
GeForce GTX 1050 Ti (Desktop):
133 [X] MSI GeForce GTX 1050 Ti Intel Core i7-7740X 4.3GHz
GeForce GTX 1050 Ti (Desktop)
min:
115 fps, max:
174 fps
fps
GeForce GTX 1050 Ti (Desktop):
69 [X] MSI GeForce GTX 1050 Ti Intel Core i7-7740X 4.3GHz
GeForce GTX 1050 Ti (Desktop)
min:
60 fps, max:
87 fps
fps
GeForce GTX 1050 Ti (Desktop):
64 [X] MSI GeForce GTX 1050 Ti Intel Core i7-7740X 4.3GHz
GeForce GTX 1050 Ti (Desktop)
min:
56 fps, max:
80 fps
fps
GeForce GTX 1050 Ti (Desktop):
45 [X] MSI GeForce GTX 1050 Ti Intel Core i7-7740X 4.3GHz
GeForce GTX 1050 Ti (Desktop)
min:
37 fps, max:
58 fps
fps
GeForce GTX 1050 Ti (Desktop):
20 [X] MSI GeForce GTX 1050 Ti Intel Core i7-7740X 4.3GHz
GeForce GTX 1050 Ti (Desktop)
min:
13.5 fps, max:
25.2 fps
fps
GeForce GTX 1050 Ti (Desktop):
105 [X] MSI GeForce GTX 1050 Ti Intel Core i7-7740X 4.3GHz
GeForce GTX 1050 Ti (Desktop)
min:
86 fps, max:
113 fps
fps
GeForce GTX 1050 Ti (Desktop):
75 [X] MSI GeForce GTX 1050 Ti Intel Core i7-7740X 4.3GHz
GeForce GTX 1050 Ti (Desktop)
min:
60 fps, max:
80 fps
fps
GeForce GTX 1050 Ti (Desktop):
40.1 [X] MSI GeForce GTX 1050 Ti Intel Core i7-7740X 4.3GHz
GeForce GTX 1050 Ti (Desktop)
min:
33 fps, max:
43 fps
fps
100%
GeForce GTX 1660 Ti Max-Q:
62 82 113 126 ~ 96 fps
100%
GeForce GTX 1660 Ti Max-Q:
53 57 83 85 ~ 70 fps
44%
GeForce GTX 1050 Ti (Desktop):
31 [X] MSI GeForce GTX 1050 Ti Intel Core i7-7740X 4.3GHz
GeForce GTX 1050 Ti (Desktop)
min:
23 fps, max:
61 fps
fps
100%
GeForce GTX 1660 Ti Max-Q:
52 53 74 75 ~ 64 fps
45%
GeForce GTX 1050 Ti (Desktop):
29 [X] MSI GeForce GTX 1050 Ti Intel Core i7-7740X 4.3GHz
GeForce GTX 1050 Ti (Desktop)
min:
23 fps, max:
55 fps
fps
100%
GeForce GTX 1660 Ti Max-Q:
49 49 64 67 ~ 57 fps
44%
GeForce GTX 1050 Ti (Desktop):
25 [X] MSI GeForce GTX 1050 Ti Intel Core i7-7740X 4.3GHz
GeForce GTX 1050 Ti (Desktop)
min:
17 fps, max:
47 fps
fps
GeForce GTX 1050 Ti (Desktop):
169 [X] Aorus Z370 Ultra Gaming Desktop MSI GTX 1050 Ti 1.47.22.14 D3D12
Intel Core i7-8086K 3.7GHz
GeForce GTX 1050 Ti (Desktop)
min:
133 fps, P1:
138 fps, max:
237 fps
fps
GeForce GTX 1050 Ti (Desktop):
66.6 [X] Aorus Z370 Ultra Gaming Desktop MSI GTX 1050 Ti 1.47.22.14 D3D12
Intel Core i7-8086K 3.7GHz
GeForce GTX 1050 Ti (Desktop)
min:
56.2 fps, P1:
57.3 fps, max:
82.7 fps
fps
GeForce GTX 1050 Ti (Desktop):
49.8 [X] Aorus Z370 Ultra Gaming Desktop MSI GTX 1050 Ti 1.47.22.14 D3D12
Intel Core i7-8086K 3.7GHz
GeForce GTX 1050 Ti (Desktop)
min:
39.1 fps, P1:
39.7 fps, max:
71.6 fps
fps
GeForce GTX 1050 Ti (Desktop):
42.5 [X] Aorus Z370 Ultra Gaming Desktop MSI GTX 1050 Ti 1.47.22.14 D3D12
Intel Core i7-8086K 3.7GHz
GeForce GTX 1050 Ti (Desktop)
min:
33.5 fps, P1:
34.4 fps, max:
60 fps
fps
GeForce GTX 1050 Ti (Desktop):
30.2 [X] Aorus Z370 Ultra Gaming Desktop MSI GTX 1050 Ti 1.47.22.14 D3D12
Intel Core i7-8086K 3.7GHz
GeForce GTX 1050 Ti (Desktop)
min:
25.3 fps, P1:
25.6 fps, max:
40.6 fps
fps
GeForce GTX 1050 Ti (Desktop):
17 [X] Aorus Z370 Ultra Gaming Desktop MSI GTX 1050 Ti 1.47.22.14 D3D12
Intel Core i7-8086K 3.7GHz
GeForce GTX 1050 Ti (Desktop)
min:
14.3 fps, P1:
14.7 fps, max:
22.8 fps
fps
GeForce GTX 1050 Ti (Desktop):
136 [X] MSI GeForce GTX 1050 Ti Intel Core i7-7740X 4.3GHz
GeForce GTX 1050 Ti (Desktop)
min:
105 fps, max:
159 fps
fps
GeForce GTX 1050 Ti (Desktop):
80 [X] MSI GeForce GTX 1050 Ti Intel Core i7-7740X 4.3GHz
GeForce GTX 1050 Ti (Desktop)
min:
67 fps, max:
90 fps
fps
GeForce GTX 1050 Ti (Desktop):
63 [X] MSI GeForce GTX 1050 Ti Intel Core i7-7740X 4.3GHz
GeForce GTX 1050 Ti (Desktop)
min:
55 fps, max:
67 fps
fps
GeForce GTX 1050 Ti (Desktop):
42.4 [X] MSI GeForce GTX 1050 Ti Intel Core i7-7740X 4.3GHz
GeForce GTX 1050 Ti (Desktop)
min:
36 fps, max:
46 fps
fps
GeForce GTX 1050 Ti (Desktop):
29.5 [X] MSI GeForce GTX 1050 Ti Intel Core i7-7740X 4.3GHz
GeForce GTX 1050 Ti (Desktop)
min:
26 fps, max:
31 fps
fps
GeForce GTX 1050 Ti (Desktop):
18.3 [X] MSI GeForce GTX 1050 Ti Intel Core i7-7740X 4.3GHz
GeForce GTX 1050 Ti (Desktop)
min:
16 fps, max:
19 fps
fps
100%
GeForce GTX 1660 Ti Max-Q:
66.9 fps
100%
GeForce GTX 1660 Ti Max-Q:
59.3 fps
100%
GeForce GTX 1660 Ti Max-Q:
59.5 fps
100%
GeForce GTX 1660 Ti Max-Q:
50.8 fps
100%
GeForce GTX 1660 Ti Max-Q:
68 103 ~ 86 fps
100%
GeForce GTX 1660 Ti Max-Q:
54 84 ~ 69 fps
100%
GeForce GTX 1660 Ti Max-Q:
53 79 ~ 66 fps
100%
GeForce GTX 1660 Ti Max-Q:
50 74 ~ 62 fps
58%
GeForce GTX 1050 Ti (Desktop):
36 [X] MSI GeForce GTX 1050 Ti Intel Core i7-7740X 4.3GHz
GeForce GTX 1050 Ti (Desktop)
min:
32 fps, max:
42 fps
fps
100%
GeForce GTX 1660 Ti Max-Q:
30 fps
100%
GeForce GTX 1660 Ti Max-Q:
376.8 fps
100%
GeForce GTX 1660 Ti Max-Q:
215.9 fps
100%
GeForce GTX 1660 Ti Max-Q:
117.3 fps
121%
GeForce GTX 1050 Ti (Desktop):
94 [X] Asus Prime X299 Deluxe XMP OC Intel Core i9-9980XE @4.4GHz
GeForce GTX 1050 Ti (Desktop)
102 [X] MSI GeForce GTX 1050 Ti Intel Core i7-7740X 4.3GHz
GeForce GTX 1050 Ti (Desktop)
~ 98 fps
125%
GeForce GTX 1050 Ti (Desktop):
86 [X] Asus Prime X299 Deluxe XMP OC Intel Core i9-9980XE @4.4GHz
GeForce GTX 1050 Ti (Desktop)
92 [X] MSI GeForce GTX 1050 Ti Intel Core i7-7740X 4.3GHz
GeForce GTX 1050 Ti (Desktop)
~ 89 fps
124%
GeForce GTX 1050 Ti (Desktop):
74 [X] Asus Prime X299 Deluxe XMP OC Intel Core i9-9980XE @4.4GHz
GeForce GTX 1050 Ti (Desktop)
79 [X] MSI GeForce GTX 1050 Ti Intel Core i7-7740X 4.3GHz
GeForce GTX 1050 Ti (Desktop)
~ 77 fps
GeForce GTX 1050 Ti (Desktop):
41.7 [X] MSI GeForce GTX 1050 Ti Intel Core i7-7740X 4.3GHz
GeForce GTX 1050 Ti (Desktop)
fps
100%
GeForce GTX 1660 Ti Max-Q:
125.6 fps
100%
GeForce GTX 1660 Ti Max-Q:
91.7 fps
100%
GeForce GTX 1660 Ti Max-Q:
77.3 fps
46%
GeForce GTX 1050 Ti (Desktop):
35.2 [X] Intel Core i7-4790K 4GHz
GeForce GTX 1050 Ti (Desktop)
min:
28 fps, max:
41 fps
fps
100%
GeForce GTX 1660 Ti Max-Q:
53.7 fps
50%
GeForce GTX 1050 Ti (Desktop):
26.6 [X] Intel Core i7-4790K 4GHz
GeForce GTX 1050 Ti (Desktop)
min:
20 fps, max:
32 fps
fps
59%
GeForce GTX 1050 Ti (Desktop):
62 [X] Intel Core i7-4790K 4GHz
GeForce GTX 1050 Ti (Desktop)
min:
41 fps, max:
78 fps
fps
49%
GeForce GTX 1050 Ti (Desktop):
33.3 [X] Intel Core i7-4790K 4GHz
GeForce GTX 1050 Ti (Desktop)
min:
26 fps, max:
45 fps
fps
100%
GeForce GTX 1660 Ti Max-Q:
44.9 50 54.6 ~ 50 fps
45%
GeForce GTX 1050 Ti (Desktop):
22.7 [X] Intel Core i7-4790K 4GHz
GeForce GTX 1050 Ti (Desktop)
max:
36 fps
fps
100%
GeForce GTX 1660 Ti Max-Q:
138 fps
100%
GeForce GTX 1660 Ti Max-Q:
92.2 fps
100%
GeForce GTX 1660 Ti Max-Q:
89.5 fps
73%
GeForce GTX 1050 Ti (Desktop):
65 [X] Intel Core i7-4790K 4GHz
GeForce GTX 1050 Ti (Desktop)
min:
53 fps, max:
78 fps
fps
100%
GeForce GTX 1660 Ti Max-Q:
78.6 fps
57%
GeForce GTX 1050 Ti (Desktop):
44.8 [X] Intel Core i7-4790K 4GHz
GeForce GTX 1050 Ti (Desktop)
min:
36 fps, max:
55 fps
fps
GeForce GTX 1050 Ti (Desktop):
12.5 [X] Intel Core i7-4790K 4GHz
GeForce GTX 1050 Ti (Desktop)
min:
9 fps, max:
15 fps
fps
100%
GeForce GTX 1660 Ti Max-Q:
91 fps
100%
GeForce GTX 1660 Ti Max-Q:
82 fps
100%
GeForce GTX 1660 Ti Max-Q:
72 fps
100%
GeForce GTX 1660 Ti Max-Q:
61 fps
GeForce GTX 1050 Ti (Desktop):
127 [X] Intel Core i7-4790K 4GHz
GeForce GTX 1050 Ti (Desktop)
min:
85 fps, max:
144 fps
fps
GeForce GTX 1050 Ti (Desktop):
55.1 [X] Intel Core i7-4790K 4GHz
GeForce GTX 1050 Ti (Desktop)
min:
43 fps, max:
64 fps
fps
GeForce GTX 1050 Ti (Desktop):
49.5 [X] Intel Core i7-4790K 4GHz
GeForce GTX 1050 Ti (Desktop)
min:
38 fps, max:
57 fps
fps
GeForce GTX 1050 Ti (Desktop):
35.5 [X] Intel Core i7-4790K 4GHz
GeForce GTX 1050 Ti (Desktop)
min:
25 fps, max:
40 fps
fps
GeForce GTX 1050 Ti (Desktop):
11.4 [X] Intel Core i7-4790K 4GHz
GeForce GTX 1050 Ti (Desktop)
min:
8 fps, max:
13 fps
fps
100%
GeForce GTX 1660 Ti Max-Q:
206.7 247.4 ~ 227 fps
100%
GeForce GTX 1660 Ti Max-Q:
160.8 212.1 ~ 186 fps
100%
GeForce GTX 1660 Ti Max-Q:
141.7 173.7 ~ 158 fps
33%
GeForce GTX 1050 Ti (Desktop):
52.2 [X] MSI GeForce GTX 1050 Ti Intel Core i7-7740X 4.3GHz
GeForce GTX 1050 Ti (Desktop)
min:
38 fps, max:
74 fps
fps
GeForce GTX 1050 Ti (Desktop):
30.7 [X] MSI GeForce GTX 1050 Ti Intel Core i7-7740X 4.3GHz
GeForce GTX 1050 Ti (Desktop)
min:
24 fps, max:
43 fps
fps
GeForce GTX 1050 Ti (Desktop):
143 [X] Intel Core i7-4790K 4GHz
GeForce GTX 1050 Ti (Desktop)
fps
GeForce GTX 1050 Ti (Desktop):
82 [X] Intel Core i7-4790K 4GHz
GeForce GTX 1050 Ti (Desktop)
min:
66 fps, max:
105 fps
fps
GeForce GTX 1050 Ti (Desktop):
66.6 [X] Intel Core i7-4790K 4GHz
GeForce GTX 1050 Ti (Desktop)
min:
56 fps, max:
84 fps
fps
GeForce GTX 1050 Ti (Desktop):
23 [X] Intel Core i7-4790K 4GHz
GeForce GTX 1050 Ti (Desktop)
min:
19 fps, max:
29 fps
fps
GeForce GTX 1050 Ti (Desktop):
30 [X] Intel Core i7-4790K 4GHz
GeForce GTX 1050 Ti (Desktop)
min:
23 fps, max:
43 fps
fps
GeForce GTX 1050 Ti (Desktop):
25.9 [X] Intel Core i7-4790K 4GHz
GeForce GTX 1050 Ti (Desktop)
min:
20 fps, max:
37 fps
fps
GeForce GTX 1050 Ti (Desktop):
52.7 [X] Intel Core i7-4790K 4GHz
GeForce GTX 1050 Ti (Desktop)
min:
40 fps, max:
71 fps
fps
GeForce GTX 1050 Ti (Desktop):
34.8 [X] Intel Core i7-4790K 4GHz
GeForce GTX 1050 Ti (Desktop)
min:
30 fps, max:
46 fps
fps
GeForce GTX 1050 Ti (Desktop):
31.4 [X] Intel Core i7-4790K 4GHz
GeForce GTX 1050 Ti (Desktop)
min:
28 fps, max:
40 fps
fps
GeForce GTX 1050 Ti (Desktop):
13.2 [X] Intel Core i7-4790K 4GHz
GeForce GTX 1050 Ti (Desktop)
min:
12 fps, max:
16 fps
fps
100%
GeForce GTX 1660 Ti Max-Q:
130.4 fps
100%
GeForce GTX 1660 Ti Max-Q:
78.1 fps
100%
GeForce GTX 1660 Ti Max-Q:
72.4 fps
100%
GeForce GTX 1660 Ti Max-Q:
41.5 fps
GeForce GTX 1050 Ti (Desktop):
198 [X] Intel Core i7-4790K 4GHz
GeForce GTX 1050 Ti (Desktop)
min:
152 fps, max:
257 fps
fps
GeForce GTX 1050 Ti (Desktop):
71.4 [X] Intel Core i7-4790K 4GHz
GeForce GTX 1050 Ti (Desktop)
min:
58 fps, max:
83 fps
fps
GeForce GTX 1050 Ti (Desktop):
68 [X] Intel Core i7-4790K 4GHz
GeForce GTX 1050 Ti (Desktop)
min:
54 fps, max:
81 fps
fps
GeForce GTX 1050 Ti (Desktop):
48.9 [X] Intel Core i7-4790K 4GHz
GeForce GTX 1050 Ti (Desktop)
min:
35 fps, max:
67 fps
fps
GeForce GTX 1050 Ti (Desktop):
19.7 [X] Intel Core i7-4790K 4GHz
GeForce GTX 1050 Ti (Desktop)
min:
15 fps, max:
43 fps
fps
GeForce GTX 1050 Ti (Desktop):
70 [X] Intel Core i7-4790K 4GHz
GeForce GTX 1050 Ti (Desktop)
min:
56 fps, max:
81 fps
fps
GeForce GTX 1050 Ti (Desktop):
58.4 [X] Intel Core i7-4790K 4GHz
GeForce GTX 1050 Ti (Desktop)
min:
48 fps, max:
68 fps
fps
GeForce GTX 1050 Ti (Desktop):
18.6 [X] Intel Core i7-4790K 4GHz
GeForce GTX 1050 Ti (Desktop)
min:
15 fps, max:
23 fps
fps
GeForce GTX 1050 Ti (Desktop):
45.4 [X] Intel Core i7-4790K 4GHz
GeForce GTX 1050 Ti (Desktop)
min:
40 fps, max:
51 fps
fps
GeForce GTX 1050 Ti (Desktop):
28.5 [X] Intel Core i7-4790K 4GHz
GeForce GTX 1050 Ti (Desktop)
min:
22 fps, max:
34 fps
fps
GeForce GTX 1050 Ti (Desktop):
15.2 [X] Intel Core i7-4790K 4GHz
GeForce GTX 1050 Ti (Desktop)
min:
13 fps, max:
19 fps
fps
GeForce GTX 1050 Ti (Desktop):
82 [X] Intel Core i7-4790K 4GHz
GeForce GTX 1050 Ti (Desktop)
min:
70 fps, max:
99 fps
fps
GeForce GTX 1050 Ti (Desktop):
73 [X] Intel Core i7-4790K 4GHz
GeForce GTX 1050 Ti (Desktop)
min:
64 fps, max:
88 fps
fps
GeForce GTX 1050 Ti (Desktop):
41.1 [X] Intel Core i7-4790K 4GHz
GeForce GTX 1050 Ti (Desktop)
min:
32 fps, max:
50 fps
fps
GeForce GTX 1050 Ti (Desktop):
38.7 [X] Intel Core i7-4790K 4GHz
GeForce GTX 1050 Ti (Desktop)
min:
32 fps, max:
48 fps
fps
GeForce GTX 1050 Ti (Desktop):
21.9 [X] Intel Core i7-4790K 4GHz
GeForce GTX 1050 Ti (Desktop)
min:
17 fps, max:
27 fps
fps
GeForce GTX 1050 Ti (Desktop):
60.5 [X] Intel Core i7-4790K 4GHz
GeForce GTX 1050 Ti (Desktop)
min:
43 fps, max:
98 fps
fps
GeForce GTX 1050 Ti (Desktop):
26.1 [X] Intel Core i7-4790K 4GHz
GeForce GTX 1050 Ti (Desktop)
min:
19 fps, max:
40 fps
fps
GeForce GTX 1050 Ti (Desktop):
62 [X] Intel Core i7-4790K 4GHz
GeForce GTX 1050 Ti (Desktop)
min:
51 fps, max:
80 fps
fps
GeForce GTX 1050 Ti (Desktop):
56.6 [X] Intel Core i7-4790K 4GHz
GeForce GTX 1050 Ti (Desktop)
min:
46 fps, max:
72 fps
fps
GeForce GTX 1050 Ti (Desktop):
18.5 [X] Intel Core i7-4790K 4GHz
GeForce GTX 1050 Ti (Desktop)
min:
15 fps, max:
23 fps
fps
GeForce GTX 1050 Ti (Desktop):
113 [X] Intel Core i7-4790K 4GHz
GeForce GTX 1050 Ti (Desktop)
min:
105 fps, max:
141 fps
fps
GeForce GTX 1050 Ti (Desktop):
51.1 [X] Intel Core i7-4790K 4GHz
GeForce GTX 1050 Ti (Desktop)
min:
47 fps, max:
63 fps
fps
GeForce GTX 1050 Ti (Desktop):
199 [X] Intel Core i7-4790K 4GHz
GeForce GTX 1050 Ti (Desktop)
min:
195 fps, max:
201 fps
fps
GeForce GTX 1050 Ti (Desktop):
144 [X] Intel Core i7-4790K 4GHz
GeForce GTX 1050 Ti (Desktop)
min:
137 fps, max:
159 fps
fps
GeForce GTX 1050 Ti (Desktop):
69 [X] Intel Core i7-4790K 4GHz
GeForce GTX 1050 Ti (Desktop)
min:
62 fps, max:
73 fps
fps
GeForce GTX 1050 Ti (Desktop):
62.4 [X] Intel Core i7-4790K 4GHz
GeForce GTX 1050 Ti (Desktop)
min:
53 fps, max:
68 fps
fps
GeForce GTX 1050 Ti (Desktop):
25.2 [X] Intel Core i7-4790K 4GHz
GeForce GTX 1050 Ti (Desktop)
min:
21 fps, max:
27 fps
fps
GeForce GTX 1050 Ti (Desktop):
57.5 [X] Intel Core i7-4790K 4GHz
GeForce GTX 1050 Ti (Desktop)
min:
42 fps, max:
86 fps
fps
GeForce GTX 1050 Ti (Desktop):
47.3 [X] Intel Core i7-4790K 4GHz
GeForce GTX 1050 Ti (Desktop)
min:
36 fps, max:
71 fps
fps
GeForce GTX 1050 Ti (Desktop):
36.3 [X] Intel Core i7-4790K 4GHz
GeForce GTX 1050 Ti (Desktop)
min:
29 fps, max:
53 fps
fps
GeForce GTX 1050 Ti (Desktop):
68.2 [X] Intel Core i7-4790K 4GHz
GeForce GTX 1050 Ti (Desktop)
min:
61 fps, max:
79 fps
fps
GeForce GTX 1050 Ti (Desktop):
41.8 [X] Intel Core i7-4790K 4GHz
GeForce GTX 1050 Ti (Desktop)
min:
37 fps, max:
49 fps
fps
GeForce GTX 1050 Ti (Desktop):
22.1 [X] Intel Core i7-4790K 4GHz
GeForce GTX 1050 Ti (Desktop)
min:
19 fps, max:
25 fps
fps
GeForce GTX 1050 Ti (Desktop):
187 [X] Intel Core i7-4790K 4GHz
GeForce GTX 1050 Ti (Desktop)
min:
135 fps, max:
215 fps
fps
GeForce GTX 1050 Ti (Desktop):
72 [X] Intel Core i7-4790K 4GHz
GeForce GTX 1050 Ti (Desktop)
min:
55 fps, max:
78 fps
fps
GeForce GTX 1050 Ti (Desktop):
61.4 [X] Intel Core i7-4790K 4GHz
GeForce GTX 1050 Ti (Desktop)
min:
49 fps, max:
78 fps
fps
GeForce GTX 1050 Ti (Desktop):
32.7 [X] Intel Core i7-4790K 4GHz
GeForce GTX 1050 Ti (Desktop)
min:
27 fps, max:
39 fps
fps
GeForce GTX 1050 Ti (Desktop):
22.8 [X] Intel Core i7-4790K 4GHz
GeForce GTX 1050 Ti (Desktop)
min:
18 fps, max:
28 fps
fps
GeForce GTX 1050 Ti (Desktop):
79 [X] Intel Core i7-4790K 4GHz
GeForce GTX 1050 Ti (Desktop)
min:
51 fps, max:
104 fps
fps
GeForce GTX 1050 Ti (Desktop):
44.6 [X] Intel Core i7-4790K 4GHz
GeForce GTX 1050 Ti (Desktop)
min:
36 fps, max:
53 fps
fps
GeForce GTX 1050 Ti (Desktop):
20.7 [X] Intel Core i7-4790K 4GHz
GeForce GTX 1050 Ti (Desktop)
min:
15 fps, max:
25 fps
fps
GeForce GTX 1050 Ti (Desktop):
46.5 [X] Intel Core i7-4790K 4GHz
GeForce GTX 1050 Ti (Desktop)
min:
43 fps, max:
50 fps
fps
100%
GeForce GTX 1660 Ti Max-Q:
193.7 fps
100%
GeForce GTX 1660 Ti Max-Q:
140.7 fps
81%
GeForce GTX 1050 Ti (Desktop):
114 [X] Intel Core i7-4790K 4GHz
GeForce GTX 1050 Ti (Desktop)
min:
94 fps, max:
132 fps
fps
100%
GeForce GTX 1660 Ti Max-Q:
116 fps
59%
GeForce GTX 1050 Ti (Desktop):
68 [X] Intel Core i7-4790K 4GHz
GeForce GTX 1050 Ti (Desktop)
min:
58 fps, max:
82 fps
fps
GeForce GTX 1050 Ti (Desktop):
35.6 [X] Intel Core i7-4790K 4GHz
GeForce GTX 1050 Ti (Desktop)
min:
31 fps, max:
42 fps
fps
GeForce GTX 1050 Ti (Desktop):
69 [X] Intel Core i7-4790K 4GHz
GeForce GTX 1050 Ti (Desktop)
min:
58 fps, max:
94 fps
fps
GeForce GTX 1050 Ti (Desktop):
23.3 [X] OGL
Intel Core i7-4790K 4GHz
GeForce GTX 1050 Ti (Desktop)
min:
19 fps, max:
31 fps
fps
100%
GeForce GTX 1660 Ti Max-Q:
42.4 fps
99%
GeForce GTX 1050 Ti (Desktop):
40.4 [X] DX12
Intel Core i7-4790K 4GHz
GeForce GTX 1050 Ti (Desktop)
42.9 [X] DX11
Intel Core i7-4790K 4GHz
GeForce GTX 1050 Ti (Desktop)
43.9 ~ 42 fps
100%
GeForce GTX 1660 Ti Max-Q:
40.7 fps
96%
GeForce GTX 1050 Ti (Desktop):
37.9 [X] DX11
Intel Core i7-4790K 4GHz
GeForce GTX 1050 Ti (Desktop)
39.1 ~ 39 fps
GeForce GTX 1050 Ti (Desktop):
12.8 [X] DX12
Intel Core i7-4790K 4GHz
GeForce GTX 1050 Ti (Desktop)
fps
GeForce GTX 1050 Ti (Desktop):
88 [X] Intel Core i7-4790K 4GHz
GeForce GTX 1050 Ti (Desktop)
min:
61 fps, max:
107 fps
fps
GeForce GTX 1050 Ti (Desktop):
34.5 [X] DX11
Intel Core i7-4790K 4GHz
GeForce GTX 1050 Ti (Desktop)
min:
25 fps, max:
44 fps
fps
GeForce GTX 1050 Ti (Desktop):
32.7 [X] DX11
Intel Core i7-4790K 4GHz
GeForce GTX 1050 Ti (Desktop)
min:
23 fps, max:
42 fps
fps
GeForce GTX 1050 Ti (Desktop):
135 [X] Intel Core i7-4790K 4GHz
GeForce GTX 1050 Ti (Desktop)
min:
118 fps, max:
151 fps
fps
GeForce GTX 1050 Ti (Desktop):
61 [X] Intel Core i7-4790K 4GHz
GeForce GTX 1050 Ti (Desktop)
min:
56 fps, max:
68 fps
fps
GeForce GTX 1050 Ti (Desktop):
54 [X] Intel Core i7-4790K 4GHz
GeForce GTX 1050 Ti (Desktop)
min:
49 fps, max:
60 fps
fps
GeForce GTX 1050 Ti (Desktop):
41 [X] Intel Core i7-4790K 4GHz
GeForce GTX 1050 Ti (Desktop)
min:
32 fps, max:
49 fps
fps
100%
GeForce GTX 1660 Ti Max-Q:
93.7 fps
100%
GeForce GTX 1660 Ti Max-Q:
72.7 fps
67%
GeForce GTX 1050 Ti (Desktop):
48.9 [X] Intel Core i7-4790K 4GHz
GeForce GTX 1050 Ti (Desktop)
min:
45 fps, max:
53 fps
fps
100%
GeForce GTX 1660 Ti Max-Q:
64.5 fps
63%
GeForce GTX 1050 Ti (Desktop):
40.7 [X] Intel Core i7-4790K 4GHz
GeForce GTX 1050 Ti (Desktop)
min:
37 fps, max:
45 fps
fps
100%
GeForce GTX 1660 Ti Max-Q:
232.8 fps
117%
GeForce GTX 1050 Ti (Desktop):
272 [X] Intel Core i7-4790K 4GHz
GeForce GTX 1050 Ti (Desktop)
fps
100%
GeForce GTX 1660 Ti Max-Q:
200.1 fps
90%
GeForce GTX 1050 Ti (Desktop):
181 [X] Intel Core i7-4790K 4GHz
GeForce GTX 1050 Ti (Desktop)
min:
103 fps, max:
275 fps
fps
100%
GeForce GTX 1660 Ti Max-Q:
163.6 fps
58%
GeForce GTX 1050 Ti (Desktop):
95 [X] Intel Core i7-4790K 4GHz
GeForce GTX 1050 Ti (Desktop)
min:
63 fps, max:
148 fps
fps
100%
GeForce GTX 1660 Ti Max-Q:
148.8 fps
53%
GeForce GTX 1050 Ti (Desktop):
79 [X] Intel Core i7-4790K 4GHz
GeForce GTX 1050 Ti (Desktop)
min:
56 fps, max:
104 fps
fps
GeForce GTX 1050 Ti (Desktop):
61 [X] Intel Core i7-4790K 4GHz
GeForce GTX 1050 Ti (Desktop)
min:
52 fps, max:
74 fps
fps
GeForce GTX 1050 Ti (Desktop):
21.6 [X] Intel Core i7-4790K 4GHz
GeForce GTX 1050 Ti (Desktop)
min:
18 fps, max:
26 fps
fps
GeForce GTX 1050 Ti (Desktop):
52.6 [X] Intel Core i7-4790K 4GHz
GeForce GTX 1050 Ti (Desktop)
min:
48 fps, max:
58 fps
fps
GeForce GTX 1050 Ti (Desktop):
22.9 [X] Intel Core i7-4790K 4GHz
GeForce GTX 1050 Ti (Desktop)
min:
18 fps, max:
27 fps
fps
GeForce GTX 1050 Ti (Desktop):
46.4 [X] Intel Core i7-4790K 4GHz
GeForce GTX 1050 Ti (Desktop)
min:
38 fps, max:
58 fps
fps
GeForce GTX 1050 Ti (Desktop):
61.8 [X] Intel Core i7-4790K 4GHz
GeForce GTX 1050 Ti (Desktop)
min:
56 fps, max:
66 fps
fps
GeForce GTX 1050 Ti (Desktop):
20.7 [X] Intel Core i7-4790K 4GHz
GeForce GTX 1050 Ti (Desktop)
min:
17 fps, max:
23 fps
fps
GeForce GTX 1050 Ti (Desktop):
113 [X] Intel Core i7-4790K 4GHz
GeForce GTX 1050 Ti (Desktop)
min:
86 fps, max:
152 fps
fps
GeForce GTX 1050 Ti (Desktop):
35.7 [X] Intel Core i7-4790K 4GHz
GeForce GTX 1050 Ti (Desktop)
min:
22 fps, max:
54 fps
fps
100%
GeForce GTX 1660 Ti Max-Q:
60 fps
100%
GeForce GTX 1660 Ti Max-Q:
60 fps
100%
GeForce GTX 1660 Ti Max-Q:
60 fps
GeForce GTX 1050 Ti (Desktop):
79 [X] Intel Core i7-4790K 4GHz
GeForce GTX 1050 Ti (Desktop)
min:
72 fps, max:
87 fps
fps
GeForce GTX 1050 Ti (Desktop):
26.9 [X] Intel Core i7-4790K 4GHz
GeForce GTX 1050 Ti (Desktop)
min:
24 fps, max:
30 fps
fps
100%
GeForce GTX 1660 Ti Max-Q:
93.3 113 119 ~ 108 fps
165%
GeForce GTX 1050 Ti (Desktop):
178 [X] Asus Prime X299 Deluxe XMP OC Intel Core i9-9980XE @4.4GHz
GeForce GTX 1050 Ti (Desktop)
min:
153.9 fps
fps
159%
GeForce GTX 1050 Ti (Desktop):
161 [X] Asus Prime X299 Deluxe XMP OC Intel Core i9-9980XE @4.4GHz
GeForce GTX 1050 Ti (Desktop)
min:
141.3 fps
fps
150%
GeForce GTX 1050 Ti (Desktop):
141 [X] Asus Prime X299 Deluxe XMP OC Intel Core i9-9980XE @4.4GHz
GeForce GTX 1050 Ti (Desktop)
min:
123.3 fps
fps
142%
GeForce GTX 1050 Ti (Desktop):
125 [X] Asus Prime X299 Deluxe XMP OC Intel Core i9-9980XE @4.4GHz
GeForce GTX 1050 Ti (Desktop)
min:
107.3 fps
fps
GeForce GTX 1050 Ti (Desktop):
63 [X] Intel Core i7-4790K 4GHz
GeForce GTX 1050 Ti (Desktop)
min:
58 fps
fps
100%
GeForce GTX 1660 Ti Max-Q:
89 fps
100%
GeForce GTX 1660 Ti Max-Q:
69 fps
100%
GeForce GTX 1660 Ti Max-Q:
51 fps
56%
GeForce GTX 1050 Ti (Desktop):
49.4 [X] Intel Core i7-4790K 4GHz
GeForce GTX 1050 Ti (Desktop)
min:
41 fps, max:
54 fps
fps
52%
GeForce GTX 1050 Ti (Desktop):
24 27.5 [X] Intel Core i7-4790K 4GHz
GeForce GTX 1050 Ti (Desktop)
min:
22 fps, max:
32 fps
~ 26 fps
100%
GeForce GTX 1660 Ti Max-Q:
30.9 fps
GeForce GTX 1050 Ti (Desktop):
62.1 [X] Intel Core i7-4790K 4GHz
GeForce GTX 1050 Ti (Desktop)
min:
51 fps, max:
75 fps
fps
GeForce GTX 1050 Ti (Desktop):
52.7 [X] Intel Core i7-4790K 4GHz
GeForce GTX 1050 Ti (Desktop)
min:
46 fps, max:
67 fps
fps
100%
GeForce GTX 1660 Ti Max-Q:
161.3 fps
109%
GeForce GTX 1050 Ti (Desktop):
176 [X] Aorus Z370 Ultra Gaming Desktop MSI GTX 1050 Ti Intel Core i7-8086K 3.7GHz
GeForce GTX 1050 Ti (Desktop)
min:
3.93 fps, P1:
125 fps, max:
337 fps
fps
100%
GeForce GTX 1660 Ti Max-Q:
151.5 fps
112%
GeForce GTX 1050 Ti (Desktop):
169 [X] Aorus Z370 Ultra Gaming Desktop MSI GTX 1050 Ti Intel Core i7-8086K 3.7GHz
GeForce GTX 1050 Ti (Desktop)
min:
20.6 fps, P1:
125 fps, max:
258 fps
fps
100%
GeForce GTX 1660 Ti Max-Q:
114.6 fps
77%
GeForce GTX 1050 Ti (Desktop):
88.8 [X] Aorus Z370 Ultra Gaming Desktop MSI GTX 1050 Ti Intel Core i7-8086K 3.7GHz
GeForce GTX 1050 Ti (Desktop)
min:
10.1 fps, P1:
62.5 fps, max:
163 fps
fps
100%
GeForce GTX 1660 Ti Max-Q:
59.6 fps
65%
GeForce GTX 1050 Ti (Desktop):
36.4 [X] Intel Core i7-4790K 4GHz
GeForce GTX 1050 Ti (Desktop)
min:
22.1 fps, max:
102 fps
41.2 [X] Aorus Z370 Ultra Gaming Desktop MSI GTX 1050 Ti Intel Core i7-8086K 3.7GHz
GeForce GTX 1050 Ti (Desktop)
min:
6.32 fps, P1:
27.8 fps, max:
110 fps
~ 39 fps
GeForce GTX 1050 Ti (Desktop):
29.4 [X] Aorus Z370 Ultra Gaming Desktop MSI GTX 1050 Ti Intel Core i7-8086K 3.7GHz
GeForce GTX 1050 Ti (Desktop)
min:
5.25 fps, P1:
20.8 fps, max:
79.5 fps
fps
GeForce GTX 1050 Ti (Desktop):
27.8 [X] Aorus Z370 Ultra Gaming Desktop MSI GTX 1050 Ti Intel Core i7-8086K 3.7GHz
GeForce GTX 1050 Ti (Desktop)
min:
6.34 fps, P1:
20.8 fps, max:
126 fps
fps
GeForce GTX 1050 Ti (Desktop):
39.9 [X] Intel Core i7-4790K 4GHz
GeForce GTX 1050 Ti (Desktop)
min:
29 fps
fps
GeForce GTX 1050 Ti (Desktop):
84 [X] Intel Core i7-4790K 4GHz
GeForce GTX 1050 Ti (Desktop)
fps
GeForce GTX 1050 Ti (Desktop):
58.2 [X] Intel Core i7-4790K 4GHz
GeForce GTX 1050 Ti (Desktop)
min:
25 fps, max:
165 fps
fps
GeForce GTX 1050 Ti (Desktop):
66 [X] Intel Core i7-4790K 4GHz
GeForce GTX 1050 Ti (Desktop)
min:
58 fps, max:
81 fps
fps
GeForce GTX 1050 Ti (Desktop):
30.2 [X] Intel Core i7-4790K 4GHz
GeForce GTX 1050 Ti (Desktop)
min:
27 fps, max:
36 fps
fps
117%
GeForce GTX 1050 Ti (Desktop):
303.5 fps
91%
GeForce GTX 1050 Ti (Desktop):
208 [X] Intel Core i7-4790K 4GHz
GeForce GTX 1050 Ti (Desktop)
min:
58 fps, max:
311 fps
fps
67%
GeForce GTX 1050 Ti (Desktop):
77.2 79 [X] Intel Core i7-4790K 4GHz
GeForce GTX 1050 Ti (Desktop)
min:
45 fps, max:
130 fps
~ 78 fps
100%
GeForce GTX 1660 Ti Max-Q:
343.8 fps
100%
GeForce GTX 1660 Ti Max-Q:
322.9 fps
100%
GeForce GTX 1660 Ti Max-Q:
296.9 fps
100%
GeForce GTX 1660 Ti Max-Q:
166.1 fps
GeForce GTX 1050 Ti (Desktop):
35.8 [X] Intel Core i7-4790K 4GHz
GeForce GTX 1050 Ti (Desktop)
min:
29 fps, max:
54 fps
fps
GeForce GTX 1050 Ti (Desktop):
55.1 [X] Intel Core i7-4790K 4GHz
GeForce GTX 1050 Ti (Desktop)
min:
22 fps, max:
93 fps
fps
Average Gaming NVIDIA GeForce GTX 1660 Ti Max-Q → 100% Average Gaming 30-70 fps → 100%
Average Gaming NVIDIA GeForce GTX 1050 Ti (Desktop) → 70% Average Gaming 30-70 fps → 60%
For more games that might be playable and a list of all games and graphics cards visit our Gaming List
v1.26
log 03. 03:46:28
#0 checking url part for id 9832 +0s ... 0s
#1 checking url part for id 7582 +0s ... 0s
#2 not redirecting to Ajax server +0s ... 0s
#3 did not recreate cache, as it is less than 5 days old! Created at Wed, 01 May 2024 05:36:19 +0200 +0.001s ... 0.001s
#4 composed specs +0.1s ... 0.101s
#5 did output specs +0s ... 0.101s
#6 start showIntegratedCPUs +0s ... 0.101s
#7 getting avg benchmarks for device 9832 +0.041s ... 0.142s
#8 got single benchmarks 9832 +0.034s ... 0.176s
#9 getting avg benchmarks for device 7582 +0.002s ... 0.178s
#10 got single benchmarks 7582 +0.014s ... 0.191s
#11 got avg benchmarks for devices +0s ... 0.191s
#12 min, max, avg, median took s +0.262s ... 0.453s
#13 before gaming benchmark output +0s ... 0.453s
#14 Got 629 rows for game benchmarks. +0.053s ... 0.506s
#15 composed SQL query for gamebenchmarks +0s ... 0.506s
#16 got data and put it in $dataArray +0.072s ... 0.578s
#17 benchmarks composed for output. +0.219s ... 0.797s
#18 calculated avg scores. +0s ... 0.797s
#19 return log +0.055s ... 0.852s
Please share our article, every link counts!
Redaktion, 2017-09- 8 (Update: 2023-07- 1)
 Deutsch
 English
 Español
 Français
 Italiano
 Nederlands
 Polski
 Português
 Русский
 Türkçe
 Svenska
 Chinese
 Magyar