Intel UHD Graphics 605 vs Intel Iris Graphics 540 vs Intel HD Graphics 505
Intel UHD Graphics 605 ► remove from comparison
The Intel UHD Graphics 605 is an integrated processor graphics unit from the Gemini Lake generation (e. g. Pentium Silver N5000), which was announced late 2017. The GPU can convince with low consumption figures, but the performance is only in the low-end segment and is rarely sufficient for modern games. Being the maximum configuration of the Gemini Lake GPU, the UHD Graphics 605 is equipped with 18 Execution Units (EUs) running at up to 750 MHz. The technical specifications of the GPU are based on Intel's Gen9 architecture, which is also used for the more expensive Skylake series and also in the predecessor HD Graphics 505.
Due to its lack of dedicated graphics memory or eDRAM cache, the UHD 605 has to access the main memory via processor (2x 64bit DDR4/LPDDR4-2400).
Performance
The UHD Graphics 605 offers a similar performance as the Intel HD Graphics 505 in the Apollo Lake SoCs (same Gen 9 architecture). Therefore, the GPU is only suited for some very low demanding games like Dirt Rally or Sims 4.
Features
The video engine decodes H.265/HEVC (8b and 10b) and VP9 completely in hardware. Up to three displays can be connected via DP 1.2a/eDP 1.3 or HDMI 2.0a (including HDCP 2.2).
Power Consumption
The TDP of the whole Pentium Silver N5000 chip is 6 Watts by default, so the GPU is primarily used for (often passively cooled) netbooks or thin notebooks. The TDP can also be reduced to 4.9 Watts, but this will obviously affect the performance.
Intel Iris Graphics 540 ► remove from comparison
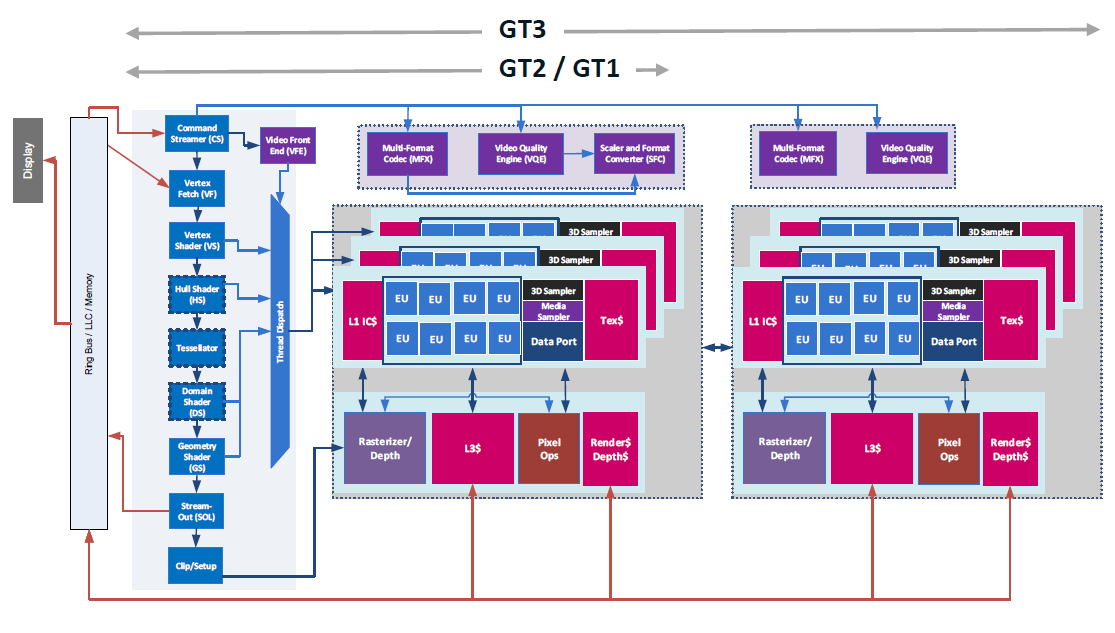
The Intel Iris Graphics 540 (GT3e) is an integrated graphics unit of the Skylake generation. As successors of the HD Graphics 6000 (Broadwell), the Iris Graphics 540 can be found in CPUs of 15-watt series and offers 64 MB of dedicated eDRAM memory. Furthermore, the so-called GT3e-version features 48 Execution Units (EUs) clocked at up to 1050 MHz (depending on the CPU model). Besides the eDRAM cache, the Iris 540 is able to access the main memory (2x 64bit DDR3L-1600 / DDR4-2133).
Compared to the Iris Graphics 550 of the 28-watt series, the Iris Graphics 540 differs only by its slightly lower maximum clock and a nearly halved TDP, which limits the utilization of the Turbo Boost in certain situations.
Performance
The exact performance of the Iris Graphics 540 depends on various factors like memory configuration (DDR3/DDR4) and maximum clock rate of the specific model. The fastest versions (Core i7-6650U ) should be slightly ahead of a dedicated GeForce 920M and will handle modern games (as of 2015) in low or medium settings.
Features
The revised video engine now decodes H.265/HEVC completely in hardware and thereby much more efficiently than before. Displays can be connected via DP 1.2 / eDP 1.3 (max. 3840 x 2160 @ 60 Hz), whereas HDMI is limited to the older version 1.4a (max. 3840 x 2160 @ 30 Hz). However, HDMI 2.0 can be added using a DisplayPort converter. Up to three displays can be controlled simultaneously.
Power Consumption
The Iris Graphics 540 can be found in mobile processors specified at 15 W TDP and is therefore suited for compact laptops and ultrabooks.
Intel HD Graphics 505 ► remove from comparison
The Intel HD Graphics 505 is an integrated processor graphics unit from the Apollo Lake generation (e. g. Pentium N4200), which was announced mid 2016. The GPU can convince with low consumption figures, but the performance is only in the low-end segment and is rarely sufficient for modern games. Being the maximum configuration of the Apollo Lake GPU, the HD Graphics 505 is equipped with 18 Execution Units (EUs) running at up to 750 MHz. The technical specifications of the GPU are based on Intel's Gen9 architecture, which is also used for the more expensive Skylake series.
Due to its lack of dedicated graphics memory or eDRAM cache, the HD 505 has to access the main memory via processor (2x 64bit DDR3L-/LPDDR3-1866, LPDDR4-2400).
Performance
The HD Graphics 505 should be slightly slower than the older Core-M GPU HD Graphics 5300 , so modern games (as of 2016) will rarely run smoothly even at the lowest settings.
Features
The revised video engine now decodes H.265/HEVC completely in hardware and thereby much more efficiently than before. Up to three displays can be connected via DP/eDP or HDMI (4K probably only at 30 Hz via HDMI 1.4).
Power Consumption
The TDP of the whole Pentium N4200 chip is 6 Watts by default, so the GPU is primarily used for (often passively cooled) netbooks or thin notebooks. The TDP can also be reduced to 4 Watts, but this will obviously affect the performance.
Intel UHD Graphics 605 Intel Iris Graphics 540 Intel HD Graphics 505 Gen. 9 Series Codename Gemini Lake Skylake GT3e Apollo Lake Architecture Gen. 9 Apollo Lake Gen. 9 Skylake Gen. 9 Apollo Lake Pipelines 18 - unified 48 - unified 18 - unified Core Speed 300 - 750 (Boost) MHz 300 - 1050 (Boost) MHz 300 - 750 (Boost) MHz Memory Bus Width 64/128 Bit eDRAM + 64/128 Bit 64/128 Bit Memory Type DDR4 / LPDDR4 eDRAM Shared Memory yes yes yes API DirectX 12_1, OpenGL 4.4 DirectX 12_1, OpenGL 4.4 DirectX 12_1, OpenGL 4.4 technology 14 nm 14 nm 14 nm Features QuickSync QuickSync QuickSync Date of Announcement 11.12.2017 01.09.2015 01.09.2016 Link to Manufacturer Page ark.intel.com Max. Amount of Memory 64 MB
Benchmarks Performance Rating - 3DMark 11 + Fire Strike + Time Spy - UHD Graphics 605
0.2 pt (1%)
...
...
max:
Performance Rating - 3DMark 11 + Fire Strike + Time Spy - Iris Graphics 540
0.7 pt (2%)
...
...
max:
Performance Rating - 3DMark 11 + Fire Strike + Time Spy - HD Graphics 505
0.2 pt (1%)
...
...
max:
3DMark - 3DMark Time Spy Score
129 Points (0%)
min: 87 avg: 115.8 median: 107.5 (0%) max: 161 Points
3DMark - 3DMark Time Spy Graphics
113 Points (0%)
min: 76 avg: 101.5 median: 94 (0%) max: 142 Points
3DMark - 3DMark Ice Storm Unlimited Graphics
min: 32770 avg: 43574 median: 45008 (5%) max: 55453 Points
min: 116490 avg: 126223 median: 126078 (14%) max: 136248 Points
min: 27199 avg: 32979 median: 32480.5 (4%) max: 41454 Points
3DMark - 3DMark Ice Storm Extreme Graphics
min: 13350 avg: 16118 median: 16553.5 (2%) max: 18016 Points
min: 45185 avg: 56792 median: 56791.5 (7%) max: 68398 Points
min: 8531 avg: 19014 median: 18860 (2%) max: 28843 Points
3DMark - 3DMark Cloud Gate Score
min: 2670 avg: 3247 median: 3154 (3%) max: 4294 Points
min: 6730 avg: 7255 median: 7235 (8%) max: 7822 Points
min: 2411 avg: 2877 median: 2837.5 (3%) max: 3558 Points
3DMark - 3DMark Cloud Gate Graphics
min: 2874 avg: 3518 median: 3359.5 (1%) max: 4485 Points
min: 9392 avg: 10896 median: 11327 (3%) max: 11893 Points
min: 2844 avg: 3609 median: 3413.5 (1%) max: 4738 Points
3DMark - 3DMark Fire Strike Standard Score
min: 376 avg: 450.1 median: 419 (1%) max: 620 Points
min: 1106 avg: 1268 median: 1354 (2%) max: 1395 Points
min: 324 avg: 417.3 median: 383 (1%) max: 565 Points
3DMark - 3DMark Fire Strike Standard Graphics
min: 411 avg: 473.4 median: 454 (1%) max: 576 Points
min: 1193 avg: 1358 median: 1448 (2%) max: 1479 Points
min: 344 avg: 448.6 median: 408 (0%) max: 606 Points
3DMark - 3DMark Ice Storm Graphics
min: 20859 avg: 25930 median: 26031 (3%) max: 30797 Points
min: 67714 avg: 81160 median: 82680.5 (10%) max: 91565 Points
min: 26964 avg: 33899 median: 36228 (4%) max: 39766 Points
3DMark - 3DMark Sling Shot (ES 3.0) Unlimited
2870 Points (12%)
3DMark - 3DMark Sling Shot (ES 3.0) Unlimited Graphics
2805 Points (6%)
3DMark - 3DMark Sling Shot Extreme (ES 3.1) Unlimited
1628 Points (8%)
3DMark - 3DMark Sling Shot Extreme (ES 3.1) Unlimited Graphics
1450 Points (4%)
3DMark - 3DMark Wild Life Unlimited
882 Points (0%)
3DMark - 3DMark Wild Life Extreme Unlimited
281 Points (0%)
3DMark - 3DMark Night Raid
min: 1614 avg: 1751 median: 1619 (2%) max: 2019 Points
3DMark - 3DMark Night Raid Graphics Score
min: 1849 avg: 2059 median: 1893 (1%) max: 2434 Points
3DMark 11 - 3DM11 Performance Score
min: 655 avg: 795 median: 748 (1%) max: 1009 Points
min: 2039 avg: 2340 median: 2364 (3%) max: 2624 Points
min: 476 avg: 692 median: 679 (1%) max: 899 Points
3DMark 11 - 3DM11 Performance GPU
min: 588 avg: 701 median: 648 (1%) max: 902 Points
min: 1898 avg: 2187 median: 2211.5 (2%) max: 2450 Points
min: 424 avg: 632 median: 620 (1%) max: 825 Points
3DMark Vantage 3DM Vant. Perf. total + Intel UHD Graphics 605 3DMark Vantage - 3DM Vant. Perf. total
2162 Points (1%)
3DM Vant. Perf. total + Intel Iris Graphics 540
min: 8647 avg: 8828 median: 8828 (3%) max: 9009 Points
3DM Vant. Perf. total + Intel HD Graphics 505
min: 1957 avg: 2351 median: 2350.5 (1%) max: 2744 Points
3DM Vant. Perf. GPU no PhysX + Intel UHD Graphics 605 3DMark Vantage - 3DM Vant. Perf. GPU no PhysX
1785 Points (1%)
3DM Vant. Perf. GPU no PhysX + Intel Iris Graphics 540
min: 8052 avg: 8220 median: 8219.5 (5%) max: 8387 Points
3DM Vant. Perf. GPU no PhysX + Intel HD Graphics 505
min: 1656 avg: 2073 median: 2072.5 (1%) max: 2489 Points
3DMark 03 - 3DMark 03 - Standard
8388 Points (4%)
3DMark 05 - 3DMark 05 - Standard
5802 Points (6%)
3DMark 06 3DMark 06 - Standard 1280x1024 + Intel UHD Graphics 605
min: 2882 avg: 4208 median: 4171 (5%) max: 5570 Points
3DMark 06 - Standard 1280x1024 + Intel Iris Graphics 540
min: 13403 avg: 13569 median: 13568.5 (18%) max: 13734 Points
3DMark 06 - Standard 1280x1024 + Intel HD Graphics 505
min: 3721 avg: 4303 median: 4302.5 (6%) max: 4884 Points
Unigine Valley 1.0 - Unigine Valley 1.0 DX
1.7 fps (1%)
6.5 fps (2%)
Unigine Heaven 3.0 - Unigine Heaven 3.0 DX 11
6.5 fps (2%)
Unigine Heaven 3.0 - Unigine Heaven 3.0 OpenGL
7.2 fps (3%)
Unigine Heaven 2.1 - Heaven 2.1 high
9 fps (2%)
8.9 fps (2%)
SPECviewperf 11 specvp11 snx-01 + Intel HD Graphics 505 SPECviewperf 11 - specvp11 snx-01
0.9 fps (1%)
specvp11 tcvis-02 + Intel HD Graphics 505 SPECviewperf 11 - specvp11 tcvis-02
1.2 fps (1%)
specvp11 sw-02 + Intel HD Graphics 505 SPECviewperf 11 - specvp11 sw-02
6.6 fps (5%)
specvp11 proe-05 + Intel HD Graphics 505 SPECviewperf 11 - specvp11 proe-05
0.8 fps (1%)
specvp11 maya-03 + Intel HD Graphics 505 SPECviewperf 11 - specvp11 maya-03
5.6 fps (4%)
specvp11 lightwave-01 + Intel HD Graphics 505 SPECviewperf 11 - specvp11 lightwave-01
8.7 fps (9%)
specvp11 ensight-04 + Intel HD Graphics 505 SPECviewperf 11 - specvp11 ensight-04
1.3 fps (1%)
SPECviewperf 12 specvp12 sw-03 + Intel Iris Graphics 540 SPECviewperf 12 - specvp12 sw-03
min: 26.2 avg: 26.3 median: 26.3 (7%) max: 26.3 fps
specvp12 snx-02 + Intel Iris Graphics 540 SPECviewperf 12 - specvp12 snx-02
min: 2.6 avg: 2.8 median: 2.8 (0%) max: 2.9 fps
specvp12 showcase-01 + Intel Iris Graphics 540 SPECviewperf 12 - specvp12 showcase-01
min: 8.2 avg: 8.5 median: 8.5 (2%) max: 8.8 fps
specvp12 mediacal-01 + Intel Iris Graphics 540 SPECviewperf 12 - specvp12 mediacal-01
min: 2.7 avg: 3.9 median: 3.9 (1%) max: 5.1 fps
specvp12 maya-04 + Intel Iris Graphics 540 SPECviewperf 12 - specvp12 maya-04
min: 16.5 avg: 16.8 median: 16.8 (5%) max: 17 fps
specvp12 energy-01 + Intel Iris Graphics 540 SPECviewperf 12 - specvp12 energy-01
min: 0.08 avg: 0.2 median: 0.2 (0%) max: 0.33 fps
specvp12 creo-01 + Intel Iris Graphics 540 SPECviewperf 12 - specvp12 creo-01
10.8 fps (4%)
specvp12 catia-04 + Intel Iris Graphics 540 SPECviewperf 12 - specvp12 catia-04
min: 15.2 avg: 15.4 median: 15.4 (3%) max: 15.5 fps
specvp12 3dsmax-05 + Intel Iris Graphics 540 SPECviewperf 12 - specvp12 3dsmax-05
14.6 fps (3%)
Cinebench R10 Cinebench R10 Shading (32bit) + Intel UHD Graphics 605 Cinebench R10 - Cinebench R10 Shading (32bit)
min: 3505 avg: 3812 median: 3773 (3%) max: 4366 Points
Cinebench R10 Shading (32bit) + Intel Iris Graphics 540
min: 7271 avg: 8395 median: 8277.5 (6%) max: 9755 Points
Cinebench R10 Shading (32bit) + Intel HD Graphics 505
min: 32.61 avg: 2776 median: 3155 (2%) max: 3331 Points
Cinebench R11.5 Cinebench R11.5 OpenGL 64 Bit + Intel UHD Graphics 605 Cinebench R11.5 - Cinebench R11.5 OpenGL 64 Bit
min: 15.24 avg: 17.9 median: 17.9 (6%) max: 20.5 fps
Cinebench R11.5 OpenGL 64 Bit + Intel Iris Graphics 540
min: 41.07 avg: 46.9 median: 47.9 (17%) max: 50.6 fps
Cinebench R11.5 OpenGL 64 Bit + Intel HD Graphics 505
min: 9.78 avg: 12.1 median: 12.5 (4%) max: 13.53 fps
Cinebench R15 Cinebench R15 OpenGL 64 Bit + Intel UHD Graphics 605 Cinebench R15 - Cinebench R15 OpenGL 64 Bit
min: 13.37 avg: 18.2 median: 18.1 (1%) max: 25.6 fps
Cinebench R15 OpenGL 64 Bit + Intel Iris Graphics 540
min: 35.34 avg: 52.5 median: 55.3 (3%) max: 62.1 fps
Cinebench R15 OpenGL 64 Bit + Intel HD Graphics 505
min: 11.3 avg: 16.1 median: 16.6 (1%) max: 19.87 fps
Cinebench R15 OpenGL Ref. Match 64 Bit + Intel UHD Graphics 605 Cinebench R15 - Cinebench R15 OpenGL Ref. Match 64 Bit
97.8 % (98%)
Cinebench R15 OpenGL Ref. Match 64 Bit + Intel Iris Graphics 540
min: 97.8 avg: 98.1 median: 97.8 (98%) max: 99.3 %
Cinebench R15 OpenGL Ref. Match 64 Bit + Intel HD Graphics 505
min: 97.7 avg: 97.8 median: 97.8 (98%) max: 97.8 %
GFXBench - GFXBench 5.0 Aztec Ruins High Tier Offscreen
min: 5.9 avg: 6.4 median: 6.4 (1%) max: 6.8 fps
4.8 fps (1%)
GFXBench - GFXBench 5.0 Aztec Ruins Normal Tier Offscreen
min: 9.9 avg: 12.8 median: 12.8 (1%) max: 15.7 fps
12 fps (1%)
GFXBench - GFXBench Car Chase Offscreen
min: 7.1 avg: 11 median: 11.3 (1%) max: 14.6 fps
42 fps (5%)
min: 10 avg: 10.2 median: 10.2 (1%) max: 10.3 fps
GFXBench 3.1 - GFXBench Manhattan ES 3.1 Offscreen
min: 13 avg: 17.6 median: 16.5 (0%) max: 23.3 fps
60.4 fps (1%)
14.1 fps (0%)
GFXBench 3.0 - GFXBench 3.0 Manhattan Offscreen
min: 16 avg: 23.8 median: 22.1 (1%) max: 33.4 fps
86 fps (5%)
18.9 fps (1%)
GFXBench (DX / GLBenchmark) 2.7 GFXBench T-Rex HD Offscreen C24Z16 + Intel UHD Graphics 605 GFXBench (DX / GLBenchmark) 2.7 - GFXBench T-Rex HD Offscreen C24Z16
min: 32 avg: 43.1 median: 45.5 (0%) max: 51.9 fps
GFXBench T-Rex HD Offscreen C24Z16 + Intel Iris Graphics 540
183 fps (1%)
GFXBench T-Rex HD Offscreen C24Z16 + Intel HD Graphics 505 47.2 fps (0%)
Basemark GPU 1.2 - Basemark GPU 1.2 Vulkan Official Medium Offscreen 1080
23.3 fps (0%)
Basemark GPU 1.2 - Basemark GPU 1.2 Vulkan Official High Offscreen 2160
2 fps (0%)
LuxMark v2.0 64Bit - LuxMark v2.0 Room GPU
min: 67 avg: 93.5 median: 93.5 (0%) max: 120 Samples/s
min: 258 avg: 291.8 median: 301.5 (1%) max: 306 Samples/s
min: 62 avg: 87 median: 87 (0%) max: 112 Samples/s
LuxMark v2.0 64Bit - LuxMark v2.0 Sala GPU
min: 96 avg: 142 median: 142 (0%) max: 188 Samples/s
min: 614 avg: 700 median: 712.5 (1%) max: 762 Samples/s
min: 93 avg: 141.5 median: 141.5 (0%) max: 190 Samples/s
ComputeMark v2.1 - ComputeMark v2.1 Result
min: 432 avg: 490.5 median: 490.5 (1%) max: 549 Points
min: 1257 avg: 1483 median: 1525.5 (2%) max: 1625 Points
382 Points (0%)
Power Consumption - Furmark Stress Test Power Consumption - external Monitor *
min: 10.3 avg: 11 median: 11 (2%) max: 11.6 Watt
19 Watt (3%)
Power Consumption - Witcher 3 Power Consumption *
11.8 Watt (3%)
Power Consumption - Witcher 3 ultra Power Efficiency
0.1 fps per Watt (10%)
Clock Speed - GPU Clock Speed Furmark
515 MHz (20%)
Average Benchmarks Intel UHD Graphics 605 → 100% n=23 Average Benchmarks Intel Iris Graphics 540 → 329% n=23 Average Benchmarks Intel HD Graphics 505 → 95% n=23
- Range of benchmark values for this graphics card
- Average benchmark values for this graphics card
* Smaller numbers mean a higher performance
1 This benchmark is not used for the average calculation
Game Benchmarks The following benchmarks stem from our benchmarks of review laptops. The performance depends on the used graphics memory, clock rate, processor, system settings, drivers, and operating systems. So the results don't have to be representative for all laptops with this GPU. For detailed information on the benchmark results, click on the fps number.
100%
UHD Graphics 605:
31.1 [X] Topjoy Falcon Intel Pentium Silver N5000 1.1GHz
UHD Graphics 605
min:
26 fps, max:
58 fps
fps
100%
UHD Graphics 605:
7 8.2 [X] Topjoy Falcon Intel Pentium Silver N5000 1.1GHz
UHD Graphics 605
min:
6 fps, max:
11 fps
~ 8 fps
100%
UHD Graphics 605:
49.8 [X] Topjoy Falcon Intel Pentium Silver N5000 1.1GHz
UHD Graphics 605
min:
41 fps, max:
60 fps
fps
229%
Iris Graphics 540:
114 fps
100%
UHD Graphics 605:
39 [X] Topjoy Falcon Intel Pentium Silver N5000 1.1GHz
UHD Graphics 605
min:
24 fps, max:
50 fps
fps
241%
Iris Graphics 540:
94 fps
100%
UHD Graphics 605:
26.6 [X] Topjoy Falcon Intel Pentium Silver N5000 1.1GHz
UHD Graphics 605
min:
18 fps, max:
34 fps
fps
278%
Iris Graphics 540:
74 fps
100%
UHD Graphics 605:
24.9 [X] Topjoy Falcon Intel Pentium Silver N5000 1.1GHz
UHD Graphics 605
min:
17 fps, max:
32 fps
fps
285%
Iris Graphics 540:
71 fps
100%
UHD Graphics 605:
23.6 [X] Topjoy Falcon Intel Pentium Silver N5000 1.1GHz
UHD Graphics 605
min:
11 fps, max:
33 fps
fps
100%
UHD Graphics 605:
15 [X] Topjoy Falcon Intel Pentium Silver N5000 1.1GHz
UHD Graphics 605
min:
8 fps, max:
22 fps
fps
100%
UHD Graphics 605:
6.5 10.9 ~ 9 fps
100%
UHD Graphics 605:
5.8 fps
100%
UHD Graphics 605:
1 fps
100%
UHD Graphics 605:
11.7 (!) [X] Topjoy Falcon Intel Pentium Silver N5000 1.1GHz
UHD Graphics 605
Problem during benchmarking occured: too slowmin:
9 fps, max:
15 fps
17.6 ~ 15 fps
100%
UHD Graphics 605:
1 fps
100%
UHD Graphics 605:
7.2 fps
100%
UHD Graphics 605:
4 fps
25%
HD Graphics 505:
1 fps
100%
UHD Graphics 605:
4 fps
100%
UHD Graphics 605:
4 fps
50%
HD Graphics 505:
2 fps
100%
UHD Graphics 605:
8.5 fps
100%
UHD Graphics 605:
12 fps
100%
UHD Graphics 605:
4.6 fps
80%
HD Graphics 505:
3.7 fps
100%
UHD Graphics 605:
8.8 fps
100%
UHD Graphics 605:
3 fps
100%
HD Graphics 505:
3 fps
100%
UHD Graphics 605:
53 fps
328%
Iris Graphics 540:
174 fps
100%
UHD Graphics 605:
8.9 fps
274%
Iris Graphics 540:
24.4 fps
Iris Graphics 540:
9.5 fps
100%
UHD Graphics 605:
5 6.4 7.2 8.6 [X] Intel NUC7PJYHN Intel Pentium Silver J5040 2GHz
UHD Graphics 605
9.1 ~ 7 fps
337%
Iris Graphics 540:
23.6 fps
79%
HD Graphics 505:
5.5 fps
100%
UHD Graphics 605:
3.5 5.9 6 6.1 [X] Intel NUC7PJYHN Intel Pentium Silver J5040 2GHz
UHD Graphics 605
~ 5 fps
338%
Iris Graphics 540:
16.9 fps
100%
UHD Graphics 605:
3.1 5.3 5.5 5.5 [X] Intel NUC7PJYHN Intel Pentium Silver J5040 2GHz
UHD Graphics 605
~ 5 fps
272%
Iris Graphics 540:
13.6 fps
100%
UHD Graphics 605:
5.5 fps
100%
UHD Graphics 605:
3.4 4.2 4.4 5.2 7.5 [X] Intel NUC7PJYHN 1.3
Intel Pentium Silver J5040 2GHz
UHD Graphics 605
~ 5 fps
100%
UHD Graphics 605:
3.3 [X] Intel NUC7PJYHN 1.3
Intel Pentium Silver J5040 2GHz
UHD Graphics 605
fps
100%
UHD Graphics 605:
5.2 fps
88%
HD Graphics 505:
4.6 fps
100%
UHD Graphics 605:
7 fps
100%
UHD Graphics 605:
13 fps
100%
HD Graphics 505:
13 fps
100%
UHD Graphics 605:
38 41.4 ~ 40 fps
70%
HD Graphics 505:
28 fps
100%
UHD Graphics 605:
34.5 36.5 ~ 36 fps
70%
HD Graphics 505:
25.2 fps
100%
UHD Graphics 605:
17 18.4 ~ 18 fps
100%
UHD Graphics 605:
18.8 fps
78%
HD Graphics 505:
14.7 fps
100%
UHD Graphics 605:
9.9 10 ~ 10 fps
153%
HD Graphics 505:
15.3 fps
100%
UHD Graphics 605:
5.5 fps
98%
HD Graphics 505:
5.4 fps
100%
UHD Graphics 605:
3.2 fps
184%
HD Graphics 505:
5.9 fps
100%
UHD Graphics 605:
9 fps
134%
HD Graphics 505:
12.1 fps
100%
UHD Graphics 605:
7.9 fps
182%
HD Graphics 505:
14.4 fps
Iris Graphics 540:
17.3 fps
Iris Graphics 540:
27.3 fps
Iris Graphics 540:
55.3 fps
Iris Graphics 540:
38.6 fps
Iris Graphics 540:
14.3 fps
Iris Graphics 540:
112 fps
Iris Graphics 540:
30.6 fps
Iris Graphics 540:
19.1 fps
Iris Graphics 540:
43.4 fps
Iris Graphics 540:
25.3 fps
Iris Graphics 540:
12.6 fps
100%
UHD Graphics 605:
12.7 fps
76%
HD Graphics 505:
9.7 fps
100%
UHD Graphics 605:
5.5 fps
Iris Graphics 540:
11.3 fps
Iris Graphics 540:
61 (!) [X] Apple MacBook Pro 13 2016 Intel Core i5-6360U 2GHz
Iris Graphics 540
Problem during benchmarking occured: small graphical problems min:
51 fps, max:
75 fps
fps
Iris Graphics 540:
72 (!) [X] Apple MacBook Pro 13 2016 Intel Core i5-6360U 2GHz
Iris Graphics 540
Problem during benchmarking occured: small graphical problems min:
61 fps, max:
80 fps
fps
Iris Graphics 540:
0 (!) fps
Iris Graphics 540:
20.5 fps
100%
UHD Graphics 605:
11.4 fps
553%
Iris Graphics 540:
58.2 68 ~ 63 fps
62%
HD Graphics 505:
7.1 fps
100%
UHD Graphics 605:
8.3 fps
530%
Iris Graphics 540:
40 47.6 ~ 44 fps
Iris Graphics 540:
31.5 fps
Iris Graphics 540:
13.3 fps
Iris Graphics 540:
17.3 fps
Iris Graphics 540:
13.8 fps
Iris Graphics 540:
7.6 fps
100%
UHD Graphics 605:
4.3 fps
581%
Iris Graphics 540:
21.7 27.9 (!) [X] Intel NUC6i5SYH Intel Core i5-6260U 1.8GHz
Iris Graphics 540
Problem during benchmarking occured: small graphical problems some missing textures in benchmarkmin:
20 fps, max:
35 fps
~ 25 fps
121%
HD Graphics 505:
5.2 fps
Iris Graphics 540:
12.9 fps
Iris Graphics 540:
22 22 23 ~ 22 fps
Iris Graphics 540:
10 11 12 ~ 11 fps
Iris Graphics 540:
18 27.6 ~ 23 fps
Iris Graphics 540:
6.7 8.9 ~ 8 fps
100%
UHD Graphics 605:
6.9 fps
333%
Iris Graphics 540:
21.5 23.7 24.9 (!) [X] Apple MacBook Pro 13 2016 Intel Core i5-6360U 2GHz
Iris Graphics 540
Problem during benchmarking occured: small graphical problems wrong cloudsmin:
23 fps, max:
27 fps
~ 23 fps
101%
HD Graphics 505:
5.6 6.1 6.2 8.8 [X] Acer Swift 1 SF113-31-P2CP Intel Pentium N4200 1.1GHz
HD Graphics 505
~ 7 fps
HD Graphics 505:
4 4 4.1 4.5 [X] Acer Swift 1 SF113-31-P2CP Intel Pentium N4200 1.1GHz
HD Graphics 505
~ 4 fps
Iris Graphics 540:
0 (!) fps
100%
UHD Graphics 605:
12.3 fps
341%
Iris Graphics 540:
39.1 44.3 ~ 42 fps
122%
HD Graphics 505:
15 fps
Iris Graphics 540:
11 13.6 ~ 12 fps
Iris Graphics 540:
35.9 fps
Iris Graphics 540:
28.6 fps
Iris Graphics 540:
15.5 fps
Iris Graphics 540:
14.2 fps
Iris Graphics 540:
40.2 fps
Iris Graphics 540:
22.9 fps
Iris Graphics 540:
0 (!) fps
Iris Graphics 540:
4.9 5.2 ~ 5 fps
Iris Graphics 540:
23.2 fps
Iris Graphics 540:
65 (!) [X] Intel NUC6i5SYH Intel Core i5-6260U 1.8GHz
Iris Graphics 540
Problem during benchmarking occured: slight slowdownsmin:
56 fps, max:
72 fps
fps
Iris Graphics 540:
38.8 (!) [X] Intel NUC6i5SYH Intel Core i5-6260U 1.8GHz
Iris Graphics 540
Problem during benchmarking occured: slow gameplaymin:
33 fps, max:
43 fps
fps
100%
UHD Graphics 605:
22.7 24.7 [X] Topjoy Falcon Intel Pentium Silver N5000 1.1GHz
UHD Graphics 605
min:
11 fps, max:
35 fps
~ 24 fps
413%
Iris Graphics 540:
78.7 120 ~ 99 fps
105%
HD Graphics 505:
25.2 fps
100%
UHD Graphics 605:
14.3 fps
115%
HD Graphics 505:
16.4 fps
100%
UHD Graphics 605:
21.6 fps
245%
Iris Graphics 540:
48.6 58 ~ 53 fps
96%
HD Graphics 505:
20.7 fps
100%
UHD Graphics 605:
15.8 fps
228%
Iris Graphics 540:
28.9 43.3 ~ 36 fps
87%
HD Graphics 505:
13.8 fps
100%
UHD Graphics 605:
32.5 33.7 35 35.9 36.5 49.5 [X] Intel NUC7PJYHN Intel Pentium Silver J5040 2GHz
UHD Graphics 605
min:
42.8 fps, max:
-1 fps
~ 37 fps
86%
HD Graphics 505:
32 fps
100%
UHD Graphics 605:
11.5 14 14.3 14.3 15.1 18.6 [X] Intel NUC7PJYHN Intel Pentium Silver J5040 2GHz
UHD Graphics 605
min:
13.1 fps, max:
-1 fps
~ 15 fps
147%
HD Graphics 505:
22 fps
100%
UHD Graphics 605:
5.9 6.7 7.4 7.8 10.6 [X] Intel NUC7PJYHN Intel Pentium Silver J5040 2GHz
UHD Graphics 605
min:
8.7 fps, max:
-1 fps
~ 8 fps
100%
UHD Graphics 605:
5.9 6.7 10 [X] Intel NUC7PJYHN Intel Pentium Silver J5040 2GHz
UHD Graphics 605
min:
8.2 fps, max:
-1 fps
~ 8 fps
338%
Iris Graphics 540:
19.1 34.6 ~ 27 fps
Iris Graphics 540:
0 (!) fps
100%
UHD Graphics 605:
1.2 fps
100%
UHD Graphics 605:
42 fps
352%
Iris Graphics 540:
119.2 149 177 (!) [X] Intel NUC6i5SYH Intel Core i5-6260U 1.8GHz
Iris Graphics 540
Problem during benchmarking occured: small graphical problems reflections on hood too muchmin:
156 fps, max:
206 fps
~ 148 fps
87%
HD Graphics 505:
36.5 fps
100%
UHD Graphics 605:
12.5 fps
102%
HD Graphics 505:
12.7 fps
100%
UHD Graphics 605:
9.5 11.6 11.7 [X] Topjoy Falcon Intel Pentium Silver N5000 1.1GHz
UHD Graphics 605
min:
0.501 fps, P1:
5.85 fps, max:
33.2 fps
~ 11 fps
86%
HD Graphics 505:
9.5 fps
100%
UHD Graphics 605:
9.3 [X] Topjoy Falcon Intel Pentium Silver N5000 1.1GHz
UHD Graphics 605
min:
0.3784 fps, P1:
4.59 fps, max:
34.4 fps
fps
46%
HD Graphics 505:
4.3 fps
100%
UHD Graphics 605:
10.9 fps
541%
Iris Graphics 540:
59 fps
67%
HD Graphics 505:
7.3 fps
100%
UHD Graphics 605:
9.5 fps
526%
Iris Graphics 540:
50 fps
73%
HD Graphics 505:
6.9 fps
100%
UHD Graphics 605:
4 fps
488%
Iris Graphics 540:
19.5 fps
Iris Graphics 540:
10.4 fps
100%
UHD Graphics 605:
7.8 fps
671%
Iris Graphics 540:
52.3 fps
136%
HD Graphics 505:
10.6 fps
100%
UHD Graphics 605:
6.2 fps
568%
Iris Graphics 540:
35.2 fps
121%
HD Graphics 505:
7.5 fps
Iris Graphics 540:
11.6 fps
100%
UHD Graphics 605:
31 fps
90%
HD Graphics 505:
28 fps
100%
UHD Graphics 605:
20 fps
70%
HD Graphics 505:
14 fps
100%
UHD Graphics 605:
13 fps
100%
UHD Graphics 605:
17.5 fps
105%
HD Graphics 505:
18.3 fps
100%
UHD Graphics 605:
13.1 fps
108%
HD Graphics 505:
14.1 fps
100%
UHD Graphics 605:
14.4 fps
86%
HD Graphics 505:
12.4 fps
100%
UHD Graphics 605:
9.3 fps
83%
HD Graphics 505:
7.7 fps
100%
UHD Graphics 605:
96.9 fps
78%
HD Graphics 505:
75.2 fps
100%
UHD Graphics 605:
21.8 fps
84%
HD Graphics 505:
18.4 fps
100%
UHD Graphics 605:
10.5 fps
Iris Graphics 540:
32.2 fps
100%
UHD Graphics 605:
14.3 fps
99%
HD Graphics 505:
14.2 fps
100%
UHD Graphics 605:
9.5 fps
98%
HD Graphics 505:
9.3 fps
100%
UHD Graphics 605:
58.5 fps
88%
HD Graphics 505:
51.5 fps
100%
UHD Graphics 605:
16.5 fps
115%
HD Graphics 505:
19 fps
100%
UHD Graphics 605:
12.5 fps
Iris Graphics 540:
23.3 fps
HD Graphics 505:
6.5 [X] Acer Swift 1 SF113-31-P2CP Intel Pentium N4200 1.1GHz
HD Graphics 505
7.8 ~ 7 fps
Iris Graphics 540:
15.7 fps
HD Graphics 505:
4.2 [X] Acer Swift 1 SF113-31-P2CP Intel Pentium N4200 1.1GHz
HD Graphics 505
5.1 ~ 5 fps
Iris Graphics 540:
13.7 fps
HD Graphics 505:
3.5 [X] Acer Swift 1 SF113-31-P2CP Intel Pentium N4200 1.1GHz
HD Graphics 505
fps
Iris Graphics 540:
29.8 (!) 65 (!) [X] Intel NUC6i5SYH Intel Core i5-6260U 1.8GHz
Iris Graphics 540
Problem during benchmarking occured: small graphical problems street textures wrongmin:
59 fps, max:
87 fps
~ 47 fps
Iris Graphics 540:
18.4 (!) 45.1 (!) [X] Intel NUC6i5SYH Intel Core i5-6260U 1.8GHz
Iris Graphics 540
Problem during benchmarking occured: small graphical problems street textures wrongmin:
39 fps, max:
56 fps
~ 32 fps
Iris Graphics 540:
11.4 31.3 (!) [X] Intel NUC6i5SYH Intel Core i5-6260U 1.8GHz
Iris Graphics 540
Problem during benchmarking occured: small graphical problems street textures wrongmin:
29 fps, max:
41 fps
~ 21 fps
HD Graphics 505:
8.3 9.5 ~ 9 fps
Iris Graphics 540:
10.4 fps
100%
UHD Graphics 605:
34.7 fps
106%
HD Graphics 505:
36.8 fps
100%
UHD Graphics 605:
17.1 fps
113%
HD Graphics 505:
19.4 fps
Iris Graphics 540:
9.5 11 ~ 10 fps
75%
HD Graphics 505:
2.5 3.1 [X] Acer Swift 1 SF113-31-P2CP Intel Pentium N4200 1.1GHz
HD Graphics 505
~ 3 fps
100%
UHD Graphics 605:
31.6 fps
351%
Iris Graphics 540:
85 137 ~ 111 fps
117%
HD Graphics 505:
31.2 42.9 [X] Dell Latitude 3189 N002L318911EMEA Intel Pentium N4200 1.1GHz
HD Graphics 505
~ 37 fps
100%
UHD Graphics 605:
18.5 fps
324%
Iris Graphics 540:
49.2 70 ~ 60 fps
108%
HD Graphics 505:
17.4 21.6 [X] Dell Latitude 3189 N002L318911EMEA Intel Pentium N4200 1.1GHz
HD Graphics 505
~ 20 fps
100%
UHD Graphics 605:
12.5 fps
320%
Iris Graphics 540:
33.3 46.4 ~ 40 fps
90%
HD Graphics 505:
11.2 fps
Iris Graphics 540:
20.6 fps
Iris Graphics 540:
19.6 20 ~ 20 fps
Iris Graphics 540:
6.6 fps
100%
UHD Graphics 605:
32.3 fps
107%
HD Graphics 505:
34.6 fps
100%
UHD Graphics 605:
17.1 fps
99%
HD Graphics 505:
16.9 fps
100%
UHD Graphics 605:
14.1 fps
96%
HD Graphics 505:
13.5 fps
100%
UHD Graphics 605:
44.4 48.4 ~ 46 fps
78%
HD Graphics 505:
35 36.7 ~ 36 fps
100%
UHD Graphics 605:
26.4 27.5 ~ 27 fps
115%
HD Graphics 505:
30.9 31 ~ 31 fps
100%
UHD Graphics 605:
16.4 17.1 ~ 17 fps
125%
HD Graphics 505:
21.2 fps
100%
UHD Graphics 605:
28.8 fps
105%
HD Graphics 505:
30.1 fps
100%
UHD Graphics 605:
21.1 fps
93%
HD Graphics 505:
19.6 fps
100%
UHD Graphics 605:
18.6 fps
91%
HD Graphics 505:
17 fps
100%
UHD Graphics 605:
12.5 fps
456%
Iris Graphics 540:
57 fps
100%
UHD Graphics 605:
35 fps
89%
HD Graphics 505:
31.1 fps
100%
UHD Graphics 605:
18 fps
82%
HD Graphics 505:
14.8 fps
100%
UHD Graphics 605:
11.4 fps
82%
HD Graphics 505:
9.3 fps
100%
UHD Graphics 605:
19.9 fps
106%
HD Graphics 505:
21.1 fps
100%
UHD Graphics 605:
12.3 fps
94%
HD Graphics 505:
11.6 fps
100%
UHD Graphics 605:
7.5 fps
95%
HD Graphics 505:
7.1 fps
100%
UHD Graphics 605:
27.4 fps
114%
HD Graphics 505:
31.3 fps
100%
UHD Graphics 605:
21.2 fps
89%
HD Graphics 505:
18.9 fps
100%
UHD Graphics 605:
6.7 fps
100%
UHD Graphics 605:
55.6 fps
85%
HD Graphics 505:
47.2 fps
100%
UHD Graphics 605:
22.7 fps
111%
HD Graphics 505:
25.2 fps
100%
UHD Graphics 605:
15.2 fps
103%
HD Graphics 505:
15.7 fps
100%
UHD Graphics 605:
12.5 fps
100%
UHD Graphics 605:
78.7 fps
89%
HD Graphics 505:
69.7 fps
100%
UHD Graphics 605:
17.4 fps
91%
HD Graphics 505:
15.9 fps
100%
UHD Graphics 605:
10 fps
97%
HD Graphics 505:
9.7 fps
100%
UHD Graphics 605:
3.9 fps
Average Gaming Intel UHD Graphics 605 → 100% Average Gaming 30-70 fps → 100%
Average Gaming Intel Iris Graphics 540 → 369% Average Gaming 30-70 fps → 415%
Average Gaming Intel HD Graphics 505 → 97% Average Gaming 30-70 fps → 97%
For more games that might be playable and a list of all games and graphics cards visit our Gaming List
v1.26
log 29. 14:29:17
#0 checking url part for id 8270 +0s ... 0s
#1 checking url part for id 6472 +0s ... 0s
#2 checking url part for id 7542 +0s ... 0s
#3 not redirecting to Ajax server +0s ... 0s
#4 did not recreate cache, as it is less than 5 days old! Created at Thu, 28 Mar 2024 05:37:00 +0100 +0.001s ... 0.001s
#5 composed specs +0.13s ... 0.131s
#6 did output specs +0s ... 0.131s
#7 start showIntegratedCPUs +0s ... 0.131s
#8 getting avg benchmarks for device 8270 +0.051s ... 0.182s
#9 got single benchmarks 8270 +0.049s ... 0.231s
#10 getting avg benchmarks for device 6472 +0.02s ... 0.25s
#11 got single benchmarks 6472 +0.029s ... 0.279s
#12 getting avg benchmarks for device 7542 +0.013s ... 0.292s
#13 got single benchmarks 7542 +0.058s ... 0.35s
#14 got avg benchmarks for devices +0s ... 0.35s
#15 min, max, avg, median took s +0.479s ... 0.829s
#16 before gaming benchmark output +0s ... 0.829s
#17 Got 549 rows for game benchmarks. +0.045s ... 0.874s
#18 composed SQL query for gamebenchmarks +0s ... 0.874s
#19 got data and put it in $dataArray +0.071s ... 0.945s
#20 benchmarks composed for output. +0.213s ... 1.158s
#21 calculated avg scores. +0s ... 1.158s
#22 return log +0.004s ... 1.162s
Please share our article, every link counts!
Redaktion, 2017-09- 8 (Update: 2023-07- 1)