NVIDIA GeForce MX230 vs Intel HD Graphics P630 vs Intel HD Graphics 615
NVIDIA GeForce MX230 ► remove from comparison
The Nvidia GeForce MX230 is an entry-level dedicated laptop graphics card with DirectX 12 support (FL 12_1) based (most likely) on the Pascal architecture (and not Maxwell as the older MX130). Similar to the faster MX250 , the MX230 is based on the GP108 chip.
Features
The GP108 chip is manufactured in a 14 nm FinFET process at Samsung (LPP) and offers a number of new features, including support for DisplayPort 1.4 (ready), HDMI 2.0b, HDR and improved H.265 video de- and encoding (PlayReady 3.0). 4K HDR with Netflix, however, wont run due to the minimum 3 GB graphics memory that is required. Compared to the bigger Pascal chips, the small GP108 does not support Simultaneous Multi-Projection (SMP) for VR and G-Sync. A full list of improvements and the new Pascal desktop GPUs is available in our dedicated Pascal architecture article
Performance
Thanks to the newer Pascal architecture, the MX230 is significantly faster than the old GeForce MX130 (Maxwell based). Demanding games of 2019 run only in lowest resolution and detail settings and may stutter (e.g. Anno 1800 or Rage 2 ran with under 30fps in our benchmarks). Less demanding games like Overwatch, Fifa 19 or Rocket League, however, can be played in higher detail and resolution settings without stuttering (see benchmarks below).
Power Consumption
The MX230 is manufactured in 14nm at Samsung and due to the low shader count and 64 Bit memory bus, the power consumption is rather low. Therefore, the chip can be also used for small and thin laptops. In our power tests, the faster MX250 needed 22% more power (Furmark load) and the old MX130 even 38% more. The integrated UHD Graphics 620 needed on average only 17% less power at a much lower performance.
Intel HD Graphics P630 ► remove from comparison
The Intel HD Graphics P630 (GT2) is an integrated graphics unit, which can be found in various Xeon workstation processors of the Kaby Lake generation. The "GT2" version of the Skylake GPU offers 24 Execution Units (EUs) clocked at up to 1050 MHz (depending on the CPU model). Due to its lack of dedicated graphics memory or eDRAM cache, the P630 has to access the main memory (2x 64bit DDR3L-1600 / DDR4-2133). It uses the same silicon as the consumer HD Graphics 630 in Kaby-Lake-H processors but features optimized drivers for workstaion and CAD software. According to Intel it is certified for 15 applications (see list ).
Performance
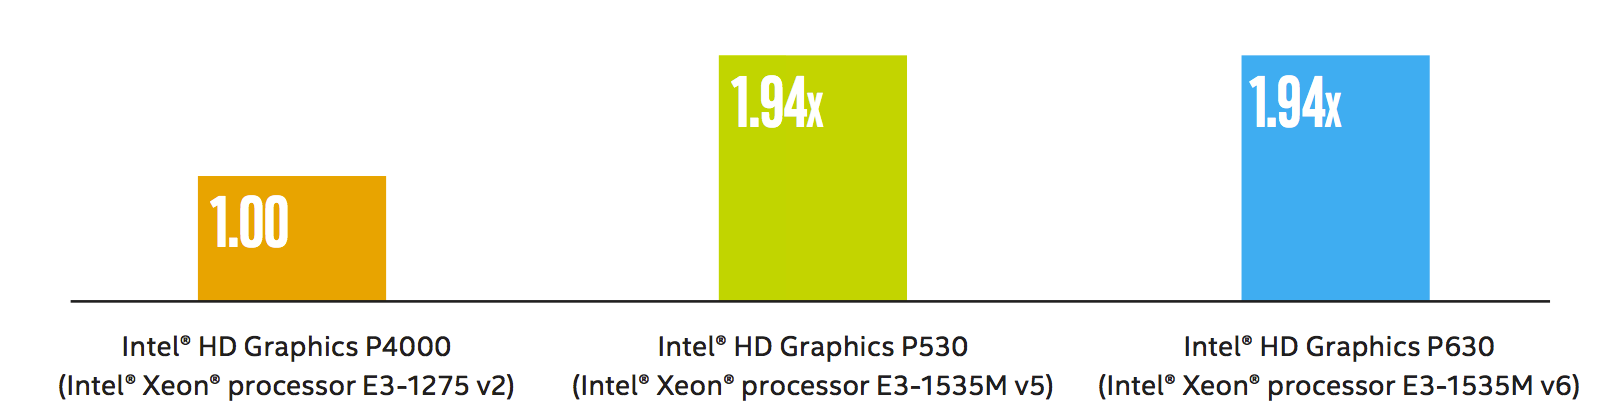
According to Intel, the performance of the P630 is identical to the Intel HD Graphis P530 (Skylake predecessor) processor graphics card and 1.94x faster than the old Intel HD Graphics P4000. Compared to consumer cards, the gaming performance should be on a similar level to the dedicated GeForce 920M and will handle old games (as of 2015) in low or medium settings.
Features
The revised video engine in the Kaby Lake chips now supports H.265/HEVC Main10 profile at 10-bit color depth and also the VP9 codec in hardware. Furthermore, HDCP 2.2 is also supported in all chips, which allows Netflix 4K videos, for instance.
Power Consumption
The HD Graphics P630 can be found in mobile quad-core Xeon processors with 45 W TDP and also desktop processors of the Xeon range with higher TDPs.
Source : http://www.intel.com/content/dam/www/public/us/en/documents/guides/hd-graphics-performance-guide.pdf
Intel HD Graphics 615 ► remove from comparison
The Intel HD Graphics 615 (GT2) is a low-end integrated graphics unit, which can be found in the Y-series of the Kaby Lake generation. This "GT2" version offers 24 Execution Units (EUs) clocked at up to 1050 MHz (depending on the CPU model). Due to its lack of dedicated graphics memory or eDRAM cache, the HD 615 has to access the main memory (2x 64bit DDR3L/LPDDR3).
Performance
The 3D performance of the HD 615 depends on the CPU model and the cooling / TDP-setting of the laptop. Furthermore, the used main memory (single channel, DDR3(L), amount) is influencing performance. On average the HD graphics 615 should be around 20 to 30 percent faster than the previous generation, the HD Graphics 615. Therefore, it may even reach the performance of the HD Graphics 520. Some low demanding games should therefore be playable with the chip.
Features
The revised video engine now supports H.265/HEVC Main10 profile in hardware with 10 bit colors. Furthermore, Googles VP9 codec can also be hardware decoded. The first models do not support HDCP 2.2 and therefore Netflix 4K. This was added with the new models in 2017 and beginning of May 2017 also the older CPU models like the m3-7Y30 are now shipped with a new S-Spec Code that supports HDCP 2.2. HDMI 2.0 however is still only supported with an external converter chip (LSPCon).
Power Consumption
The HD Graphics 615 can be found in Y processors with 4.5 W TDP (can be manipulated by the laptop manufacturers) and is therefore suited for very thin, mostly passively cooled 2-in-1 notebooks and tablets.
NVIDIA GeForce MX230 Intel HD Graphics P630 Intel HD Graphics 615 Gen. 9.5 Series GeForce MX250 384 @ 1.52 - 1.58 GHz 64 Bit @ 7000 MHz GeForce MX230 256 @ 1.52 - 1.53 GHz 64 Bit @ 7000 MHz
Codename N17S-G0 Kaby-Lake-H-GT2 Kaby-Lake GT2 Architecture Pascal Gen. 9.5 Kaby Lake Gen. 9 Kaby Lake Pipelines 256 - unified 24 - unified 24 - unified Core Speed 1519 - 1531 (Boost) MHz 300 - 1050 (Boost) MHz Memory Speed 7000 MHz Memory Bus Width 64 Bit 64/128 Bit 64/128 Bit Memory Type GDDR5 DDR3L/LPDDR3 Max. Amount of Memory 4 GB Shared Memory no yes yes API DirectX 12_1, Shader 5.0, OpenGL 4.5 DirectX 12_1, OpenGL 4.4 DirectX 12_1, OpenGL 4.4 Transistors 1.8 Billion technology 14 nm 14 nm 14 nm Features Vulcan 1.1, GPU Boost 3.0, Optimus, PhysX, CUDA, GeForce Experience, GameWorks QuickSync QuickSync Notebook Size medium sized Date of Announcement 20.02.2019 05.08.2015 30.08.2016 Link to Manufacturer Page www.geforce.com
CPU in HD Graphics P630 GPU Base Speed GPU Boost / Turbo Intel Xeon E3-1535M v6 4 x 3100 MHz, 45 W 300 MHz 1150 MHz Intel Xeon E3-1505M v6 4 x 3000 MHz, 45 W 300 MHz 1150 MHz min. - max. 300 MHz 1150 MHz
CPU in HD Graphics 615 GPU Base Speed GPU Boost / Turbo Intel Core i7-7Y75 2 x 1300 MHz, 4.5 W 300 MHz 1050 MHz Intel Core i5-7Y57 2 x 1200 MHz, 4.5 W 300 MHz 950 MHz Intel Core i5-7Y54 2 x 1200 MHz, 4.5 W 300 MHz 950 MHz » show 5 more Intel Core m3-7Y32 2 x 1000 MHz, 4.5 W 300 MHz 900 MHz Intel Core m3-7Y30 2 x 1000 MHz, 4.5 W 300 MHz 900 MHz Intel Pentium Gold 4415Y 2 x 1600 MHz, 6 W 300 MHz 850 MHz Intel Pentium Gold 4410Y 2 x 1500 MHz, 6 W 300 MHz 850 MHz Intel Celeron 3965Y 2 x 1500 MHz, 6 W 300 MHz 850 MHz min. - max. 300 MHz 850 - 1150 MHz
Benchmarks Performance Rating - 3DMark 11 + Fire Strike + Time Spy - GeForce MX230
1.1 pt (3%)
...
...
max:
Performance Rating - 3DMark 11 + Fire Strike + Time Spy - HD Graphics 615
0.4 pt (1%)
...
...
max:
3DMark - 3DMark Time Spy Score
min: 786 avg: 851 median: 839.5 (2%) max: 937 Points
400 Points (1%)
min: 180 avg: 277.2 median: 296.5 (1%) max: 327 Points
3DMark - 3DMark Time Spy Graphics
min: 698 avg: 758 median: 748 (2%) max: 837 Points
min: 157 avg: 243.7 median: 261 (1%) max: 288 Points
3DMark - 3DMark Ice Storm Unlimited Graphics
min: 163728 avg: 178637 median: 183041 (21%) max: 189141 Points
min: 55271 avg: 69892 median: 70743 (8%) max: 79719 Points
3DMark - 3DMark Ice Storm Extreme Graphics
min: 35141 avg: 61903 median: 74932 (10%) max: 75636 Points
min: 28302 avg: 34366 median: 33200.5 (4%) max: 42163 Points
3DMark - 3DMark Cloud Gate Score
min: 8886 avg: 10432 median: 10529.5 (11%) max: 11659 Points
8280 Points (9%)
min: 4050 avg: 4904 median: 4893 (5%) max: 5828 Points
3DMark - 3DMark Cloud Gate Graphics
min: 13376 avg: 15921 median: 15796.5 (4%) max: 17999 Points
min: 5478 avg: 6502 median: 6387 (2%) max: 7839 Points
3DMark - 3DMark Fire Strike Standard Score
min: 2041 avg: 2300 median: 2298.5 (4%) max: 2531 Points
1040 Points (2%)
min: 582 avg: 750 median: 762 (1%) max: 861 Points
3DMark - 3DMark Fire Strike Standard Graphics
min: 2168 avg: 2479 median: 2467.5 (3%) max: 2755 Points
min: 647 avg: 830 median: 853 (1%) max: 965 Points
3DMark - 3DMark Ice Storm Graphics
min: 49120 avg: 78716 median: 84971 (10%) max: 95803 Points
min: 45589 avg: 54672 median: 50760 (6%) max: 69035 Points
3DMark - 3DMark Night Raid
2461 Points (2%)
3DMark - 3DMark Night Raid Graphics Score
2800 Points (1%)
3DMark 11 - 3DM11 Performance Score
min: 3316 avg: 3590 median: 3621.5 (5%) max: 3720 Points
min: 1141 avg: 1350 median: 1362.5 (2%) max: 1514 Points
3DMark 11 - 3DM11 Performance GPU
min: 3180 avg: 3392 median: 3363.5 (3%) max: 3582 Points
min: 1032 avg: 1233 median: 1242.5 (1%) max: 1384 Points
3DMark Vantage + Intel HD Graphics 615 3DMark Vantage - 3DM Vant. Perf. total
min: 4081 avg: 4102 median: 4102 (1%) max: 4123 Points
3DM Vant. Perf. GPU no PhysX + Intel HD Graphics 615 3DMark Vantage - 3DM Vant. Perf. GPU no PhysX
min: 3514 avg: 3538 median: 3537.5 (2%) max: 3561 Points
3DMark 2001SE - 3DMark 2001 - Standard
19381 Points (20%)
3DMark 03 - 3DMark 03 - Standard
16620 Points (9%)
3DMark 05 - 3DMark 05 - Standard
8649 Points (9%)
3DMark 06 3DMark 06 - Standard 1280x1024 + NVIDIA GeForce MX230
18399 Points (24%)
Model CPU GPU RAM Value 3DMark 06 - Standard 1280x1024 Asus VivoBook 14 F412FJ-EB119T (3DMark 06 - Standard 1280x1024) i5-8265U GeForce MX230 2 GB 18399
3DMark 06 - Standard 1280x1024 + Intel HD Graphics 615
min: 6299 avg: 7294 median: 7399 (10%) max: 7991 Points
3DMark 06 - Standard 1280x768 + Intel HD Graphics 615
6524 Points (9%)
Unigine Heaven 2.1 - Heaven 2.1 high
17.4 fps (3%)
Cinebench R10 Cinebench R10 Shading (32bit) + NVIDIA GeForce MX230 Cinebench R10 - Cinebench R10 Shading (32bit)
min: 4095 avg: 5887 median: 6353 (5%) max: 6748 Points
Cinebench R10 Shading (32bit) + Intel HD Graphics 615
min: 5363 avg: 6543 median: 6470 (5%) max: 7323 Points
Cinebench R11.5 Cinebench R11.5 OpenGL 64 Bit + NVIDIA GeForce MX230 Cinebench R11.5 - Cinebench R11.5 OpenGL 64 Bit
64.7 fps (22%)
Cinebench R11.5 OpenGL 64 Bit + Intel HD Graphics 615
min: 23.45 avg: 28.6 median: 27.8 (10%) max: 32.97 fps
Cinebench R15 + NVIDIA GeForce MX230 Cinebench R15 - Cinebench R15 OpenGL 64 Bit
min: 79.7 avg: 84.3 median: 83.4 (5%) max: 92.5 fps
Cinebench R15 OpenGL 64 Bit + Intel HD Graphics 615
min: 24.79 avg: 33.1 median: 35 (2%) max: 37.62 fps
Cinebench R15 OpenGL Ref. Match 64 Bit + NVIDIA GeForce MX230 Cinebench R15 - Cinebench R15 OpenGL Ref. Match 64 Bit
99.6 % (100%)
Cinebench R15 OpenGL Ref. Match 64 Bit + Intel HD Graphics 615
min: 97.7 avg: 97.9 median: 97.8 (98%) max: 99.3 %
GFXBench - GFXBench Car Chase Offscreen
45 fps (5%)
GFXBench 3.1 - GFXBench Manhattan ES 3.1 Offscreen
65 fps (1%)
42.7 fps (1%)
GFXBench 3.0 - GFXBench 3.0 Manhattan Offscreen
91 fps (5%)
GFXBench (DX / GLBenchmark) 2.7 + NVIDIA GeForce MX230 GFXBench (DX / GLBenchmark) 2.7 - GFXBench T-Rex HD Offscreen C24Z16
176 fps (1%)
GFXBench T-Rex HD Offscreen C24Z16 + Intel HD Graphics 615
76.3 fps (1%)
Basemark ES 2.0 - Basemark ES 2.0
59.8 fps (99%)
Basemark X 1.1 - Basemark X 1.1 High Quality
33662 Points (76%)
Basemark X 1.1 - Basemark X 1.1 Medium Quality
42892 Points (95%)
Basemark GPU 1.2 - Basemark GPU 1.2 Vulkan Official Medium Offscreen 1080
38.3 fps (0%)
Basemark GPU 1.2 - Basemark GPU 1.2 Vulkan Official High Offscreen 2160
3.4 fps (1%)
LuxMark v2.0 64Bit - LuxMark v2.0 Room GPU
583 Samples/s (3%)
min: 145 avg: 181 median: 185 (1%) max: 213 Samples/s
LuxMark v2.0 64Bit - LuxMark v2.0 Sala GPU
1069 Samples/s (2%)
min: 281 avg: 365.3 median: 369 (1%) max: 446 Samples/s
ComputeMark v2.1 - ComputeMark v2.1 Result
2018 Points (2%)
min: 447 avg: 654 median: 693 (1%) max: 783 Points
PassMark PerformanceTest Mobile V1 - PerformanceTest Mobile V1 2D Graphics Tests
18536 Points (19%)
PassMark PerformanceTest Mobile V1 - PerformanceTest Mobile V1 3D Graphics Tests
2667 Points (5%)
Power Consumption - Furmark Stress Test Power Consumption - external Monitor *
33.8 Watt (5%)
17.8 Watt (3%)
Clock Speed - GPU Clock Speed Furmark
1300 MHz (52%)
630 MHz (25%)
Average Benchmarks NVIDIA GeForce MX230 → 100% n=3 Average Benchmarks Intel HD Graphics P630 → 57% n=3 Average Benchmarks Intel HD Graphics 615 → 38% n=3
- Range of benchmark values for this graphics card
- Average benchmark values for this graphics card
* Smaller numbers mean a higher performance
1 This benchmark is not used for the average calculation
Game Benchmarks The following benchmarks stem from our benchmarks of review laptops. The performance depends on the used graphics memory, clock rate, processor, system settings, drivers, and operating systems. So the results don't have to be representative for all laptops with this GPU. For detailed information on the benchmark results, click on the fps number.
HD Graphics 615:
12.4 [X] Eve-Tech Eve V i7 Intel Core i7-7Y75 1.3GHz
HD Graphics 615
min:
1.279 fps, P0.1:
1.412 fps, P1:
4.02 fps, max:
38.7 fps
fps
HD Graphics 615:
34.2 [X] Eve-Tech Eve V i7 Intel Core i7-7Y75 1.3GHz
HD Graphics 615
min:
3.05 fps, P0.1:
13.5 fps, P1:
20.4 fps, max:
121 fps
fps
HD Graphics 615:
15.8 [X] Eve-Tech Eve V i7 Intel Core i7-7Y75 1.3GHz
HD Graphics 615
min:
8.65 fps, P0.1:
8.9 fps, P1:
10.7 fps, max:
34.6 fps
fps
100%
GeForce MX230:
46.8 fps
100%
GeForce MX230:
19.2 fps
100%
GeForce MX230:
12.4 fps
100%
GeForce MX230:
28 fps
100%
GeForce MX230:
14 fps
100%
GeForce MX230:
13 fps
100%
GeForce MX230:
73.1 fps
0%
HD Graphics 615:
0 (!) [X] Eve-Tech Eve V i7 Intel Core i7-7Y75 1.3GHz
HD Graphics 615
fps
100%
GeForce MX230:
62.4 fps
0%
HD Graphics 615:
0 (!) [X] Eve-Tech Eve V i7 Intel Core i7-7Y75 1.3GHz
HD Graphics 615
fps
100%
GeForce MX230:
55.6 fps
100%
GeForce MX230:
46.4 fps
100%
GeForce MX230:
39.6 fps
100%
GeForce MX230:
16 fps
100%
GeForce MX230:
10.1 fps
100%
GeForce MX230:
7.4 fps
100%
GeForce MX230:
34.8 fps
100%
GeForce MX230:
11 fps
100%
GeForce MX230:
7.5 fps
100%
GeForce MX230:
62 fps
29%
HD Graphics 615:
18.1 fps
100%
GeForce MX230:
25 fps
100%
GeForce MX230:
20 fps
100%
GeForce MX230:
12 fps
36%
HD Graphics 615:
21.7 fps
41%
HD Graphics 615:
6.5 fps
100%
GeForce MX230:
5.8 7.9 9 ~ 8 fps
100%
GeForce MX230:
24.5 fps
100%
GeForce MX230:
10.2 fps
100%
GeForce MX230:
4.1 fps
100%
GeForce MX230:
24.4 fps
100%
GeForce MX230:
8.1 fps
100%
GeForce MX230:
4.9 fps
100%
GeForce MX230:
2.1 fps
100%
GeForce MX230:
43 fps
100%
GeForce MX230:
13 fps
100%
GeForce MX230:
10 fps
100%
GeForce MX230:
71 fps
100%
GeForce MX230:
22.9 fps
100%
GeForce MX230:
17.5 fps
100%
GeForce MX230:
10.4 fps
100%
GeForce MX230:
22.7 fps
100%
GeForce MX230:
12.3 fps
100%
GeForce MX230:
11.1 fps
100%
GeForce MX230:
9.8 fps
100%
GeForce MX230:
32 fps
100%
GeForce MX230:
15 fps
100%
GeForce MX230:
13 fps
100%
GeForce MX230:
12 fps
100%
GeForce MX230:
25.9 fps
100%
GeForce MX230:
4.8 fps
100%
GeForce MX230:
3.3 fps
100%
GeForce MX230:
4.5 fps
100%
GeForce MX230:
45.8 fps
100%
GeForce MX230:
17.8 fps
100%
GeForce MX230:
14.4 fps
100%
GeForce MX230:
12.4 fps
100%
GeForce MX230:
30.9 fps
100%
GeForce MX230:
17.4 fps
100%
GeForce MX230:
12.7 fps
100%
GeForce MX230:
10.9 fps
100%
GeForce MX230:
69.3 fps
100%
GeForce MX230:
19.8 fps
100%
GeForce MX230:
15.9 fps
100%
GeForce MX230:
13.4 fps
100%
GeForce MX230:
38.3 fps
100%
GeForce MX230:
20.2 fps
100%
GeForce MX230:
16 fps
100%
GeForce MX230:
12 fps
100%
GeForce MX230:
122.3 fps
100%
GeForce MX230:
48.6 fps
100%
GeForce MX230:
23.8 fps
100%
GeForce MX230:
17.6 fps
100%
GeForce MX230:
29.3 fps
100%
GeForce MX230:
13.4 fps
100%
GeForce MX230:
10.7 fps
100%
GeForce MX230:
9.9 fps
100%
GeForce MX230:
36.8 fps
100%
GeForce MX230:
18.9 fps
100%
GeForce MX230:
13.8 fps
100%
GeForce MX230:
11.7 fps
100%
GeForce MX230:
26 fps
100%
GeForce MX230:
13 fps
100%
GeForce MX230:
10 fps
100%
GeForce MX230:
46 fps
100%
GeForce MX230:
21 fps
100%
GeForce MX230:
16 fps
100%
GeForce MX230:
12 fps
100%
GeForce MX230:
80.5 fps
100%
GeForce MX230:
58.6 fps
100%
GeForce MX230:
52.6 fps
100%
GeForce MX230:
52.2 fps
100%
GeForce MX230:
32 fps
100%
GeForce MX230:
10 fps
100%
GeForce MX230:
7 (!) fps
HD Graphics 615:
18.2 [X] Eve-Tech Eve V i7 1.47.22.14 D3D12
Intel Core i7-7Y75 1.3GHz
HD Graphics 615
min:
5 fps, P1:
7.54 fps, max:
165 fps
fps
HD Graphics 615:
8 [X] Eve-Tech Eve V i7 1.47.22.14 D3D12
Intel Core i7-7Y75 1.3GHz
HD Graphics 615
min:
5 fps, P1:
5 fps, max:
116 fps
fps
HD Graphics 615:
8.8 [X] Eve-Tech Eve V i7 1.47.22.14 D3D12
Intel Core i7-7Y75 1.3GHz
HD Graphics 615
min:
5 fps, P1:
5 fps, max:
126 fps
fps
HD Graphics 615:
12.1 [X] Eve-Tech Eve V i7 1.47.22.14 D3D12
Intel Core i7-7Y75 1.3GHz
HD Graphics 615
min:
5 fps, P1:
5 fps, max:
108 fps
fps
100%
GeForce MX230:
48 fps
100%
GeForce MX230:
23 fps
100%
GeForce MX230:
18 fps
100%
GeForce MX230:
12 fps
100%
GeForce MX230:
34.1 fps
100%
GeForce MX230:
12.9 fps
100%
GeForce MX230:
10.9 fps
100%
GeForce MX230:
8.3 fps
100%
GeForce MX230:
31 fps
29%
HD Graphics 615:
9 fps
100%
GeForce MX230:
15 fps
100%
GeForce MX230:
13 fps
100%
GeForce MX230:
12 fps
100%
GeForce MX230:
235 fps
45%
HD Graphics 615:
106 fps
100%
GeForce MX230:
54.4 fps
25%
HD Graphics 615:
13.4 fps
100%
GeForce MX230:
17.9 fps
32%
HD Graphics 615:
5.8 fps
100%
GeForce MX230:
48.4 fps
39%
HD Graphics 615:
18.8 fps
100%
GeForce MX230:
36.3 fps
33%
HD Graphics 615:
12 fps
100%
GeForce MX230:
32.9 fps
33%
HD Graphics 615:
11 fps
100%
GeForce MX230:
31.5 fps
26%
HD Graphics 615:
8.3 fps
100%
GeForce MX230:
13.8 fps
100%
GeForce MX230:
11.6 fps
100%
GeForce MX230:
26 fps
100%
GeForce MX230:
11.4 fps
100%
GeForce MX230:
7.4 fps
100%
GeForce MX230:
84.7 fps
42%
HD Graphics 615:
35.3 fps
100%
GeForce MX230:
33.2 fps
100%
GeForce MX230:
19.5 fps
100%
GeForce MX230:
15.6 fps
100%
GeForce MX230:
44.9 fps
25%
HD Graphics 615:
11.2 fps
100%
GeForce MX230:
23.9 fps
100%
GeForce MX230:
22 fps
100%
GeForce MX230:
17.5 fps
100%
GeForce MX230:
50 fps
30%
HD Graphics 615:
15 fps
100%
GeForce MX230:
18 fps
100%
GeForce MX230:
12 fps
100%
GeForce MX230:
58.5 fps
100%
GeForce MX230:
23.8 fps
100%
GeForce MX230:
21 fps
100%
GeForce MX230:
17.3 fps
100%
GeForce MX230:
96 fps
100%
GeForce MX230:
91.4 fps
100%
GeForce MX230:
68.8 fps
100%
GeForce MX230:
62.9 fps
100%
GeForce MX230:
152.6 fps
100%
GeForce MX230:
77.7 fps
25%
HD Graphics 615:
19.4 fps
100%
GeForce MX230:
72.7 fps
100%
GeForce MX230:
90.9 fps
16%
HD Graphics 615:
14.3 fps
100%
GeForce MX230:
34.7 fps
19%
HD Graphics 615:
6.6 fps
100%
GeForce MX230:
25.3 fps
100%
GeForce MX230:
21.3 fps
100%
GeForce MX230:
35.5 fps
28%
HD Graphics 615:
9.8 fps
100%
GeForce MX230:
15.2 fps
26%
HD Graphics 615:
4 fps
100%
GeForce MX230:
13 fps
100%
GeForce MX230:
3.5 fps
100%
GeForce MX230:
63 fps
27%
HD Graphics 615:
16.8 fps
100%
GeForce MX230:
21 fps
30%
HD Graphics 615:
6.2 fps
100%
GeForce MX230:
18.7 fps
100%
GeForce MX230:
15 fps
100%
GeForce MX230:
86 fps
24%
HD Graphics 615:
20.6 fps
100%
GeForce MX230:
45.6 fps
20%
HD Graphics 615:
9.2 fps
100%
GeForce MX230:
14.7 fps
100%
GeForce MX230:
10.6 fps
100%
GeForce MX230:
90 101 ~ 96 fps
29%
HD Graphics 615:
28.2 fps
100%
GeForce MX230:
78.3 83 ~ 81 fps
27%
HD Graphics 615:
21.9 fps
100%
GeForce MX230:
16.6 23 ~ 20 fps
100%
GeForce MX230:
56.4 fps
23%
HD Graphics 615:
12.9 fps
100%
GeForce MX230:
45.9 fps
22%
HD Graphics 615:
10.1 fps
100%
GeForce MX230:
19.3 fps
100%
GeForce MX230:
15.6 fps
100%
GeForce MX230:
18.4 fps
45%
HD Graphics 615:
8.2 fps
100%
GeForce MX230:
10.6 fps
100%
GeForce MX230:
85.9 fps
29%
HD Graphics 615:
24.6 fps
100%
GeForce MX230:
61.9 fps
26%
HD Graphics 615:
16.2 fps
100%
GeForce MX230:
32.2 fps
100%
GeForce MX230:
22.5 fps
100%
GeForce MX230:
101.2 fps
49%
HD Graphics 615:
49.9 fps
100%
GeForce MX230:
84.1 fps
36%
HD Graphics 615:
30.2 fps
100%
GeForce MX230:
52.8 fps
100%
GeForce MX230:
33.2 fps
100%
GeForce MX230:
126.7 fps
100%
GeForce MX230:
113 fps
100%
GeForce MX230:
58 fps
100%
GeForce MX230:
43.2 fps
100%
GeForce MX230:
44 fps
100%
GeForce MX230:
38 fps
100%
GeForce MX230:
16 fps
100%
GeForce MX230:
11 fps
25%
HD Graphics 615:
11.9 fps
100%
GeForce MX230:
7.7 9.9 ~ 9 fps
100%
GeForce MX230:
71.5 fps
31%
HD Graphics 615:
19.9 24.2 [X] Eve-Tech Eve V i7 Intel Core i7-7Y75 1.3GHz
HD Graphics 615
min:
0.569 fps, P1:
8.13 fps, max:
41.3 fps
~ 22 fps
100%
GeForce MX230:
64.5 fps
31%
HD Graphics 615:
16.7 23.7 [X] Eve-Tech Eve V i7 Intel Core i7-7Y75 1.3GHz
HD Graphics 615
min:
3.75 fps, P1:
12.7 fps, max:
44.4 fps
~ 20 fps
100%
GeForce MX230:
26.9 fps
23%
HD Graphics 615:
6.1 [X] Eve-Tech Eve V i7 Intel Core i7-7Y75 1.3GHz
HD Graphics 615
min:
1.81 fps, P1:
4.13 fps, max:
23.5 fps
fps
100%
GeForce MX230:
10.6 fps
100%
GeForce MX230:
171.9 fps
100%
GeForce MX230:
110 fps
84%
HD Graphics 615:
90 94.2 ~ 92 fps
100%
GeForce MX230:
60.5 fps
100%
GeForce MX230:
48.7 fps
100%
GeForce MX230:
58.7 fps
24%
HD Graphics 615:
13.9 fps
100%
GeForce MX230:
39.4 fps
23%
HD Graphics 615:
9.2 fps
100%
GeForce MX230:
35.6 fps
100%
GeForce MX230:
18.3 fps
100%
GeForce MX230:
150.8 fps
100%
GeForce MX230:
74.4 fps
100%
GeForce MX230:
55.4 fps
31%
HD Graphics 615:
16 18.4 ~ 17 fps
100%
GeForce MX230:
26.1 fps
100%
GeForce MX230:
178.1 fps
56%
HD Graphics 615:
99.9 fps
100%
GeForce MX230:
127.1 fps
45%
HD Graphics 615:
57.3 fps
100%
GeForce MX230:
90.7 fps
44%
HD Graphics 615:
39.5 fps
100%
GeForce MX230:
64.9 fps
34%
HD Graphics 615:
21.9 fps
100%
GeForce MX230:
142.6 fps
39%
HD Graphics 615:
55.8 fps
100%
GeForce MX230:
114.2 fps
32%
HD Graphics 615:
36.3 fps
100%
GeForce MX230:
96.1 fps
31%
HD Graphics 615:
30.1 fps
100%
GeForce MX230:
52.6 fps
34%
HD Graphics 615:
17.8 fps
100%
GeForce MX230:
234.3 fps
100%
GeForce MX230:
111.7 fps
100%
GeForce MX230:
85.9 fps
100%
GeForce MX230:
41.4 fps
Average Gaming NVIDIA GeForce MX230 → 100% Average Gaming 30-70 fps → 100%
Average Gaming Intel HD Graphics 615 → 33% Average Gaming 30-70 fps → 39%
 Deutsch
 English
 Español
 Français
 Italiano
 Nederlands
 Polski
 Português
 Русский
 Türkçe
 Svenska
 Chinese
 Magyar