Notebookcheck Logo

AMD Ryzen 5 3500U vs Intel Core i7-8550U

AMD Ryzen 5 3500U

► remove from comparison AMD R5 3500U

The AMD Ryzen 5 3500U is a mobile SoC that was announced in January 2019. It combines four Zen+ cores (8 threads) clocked at 2.1 GHz to 3.7 GHz with a Radeon RX Vega 8 iGPU with 8 CUs (512 Shaders) clocked at up to 1200 MHz. Specified at 15 Watt TDP, the SoC is intended for thin mid-range laptops. In Chromebooks, AMD calles the APU AMD Ryzen 5 3500C, but the specifications (and performance) are the same.

The Picasso SoC uses the Zen+ microarchitecture with slight improvements that should lead to a 3% IPS (performance per clock) improvements. Furthermore, the 12 nm process allows for higher clocks at similar power consumption.

The integrated dual-channel memory controller supports up to DDR4-2400 memory. As the features of the Picasso APUs are the same compared to the Raven Ridge predecessors, we point to our Raven Ridge launch article.

Performance

The average 3500U in our database matches the Intel Core i7-1065G7 in multi-thread performance to be an OK lower mid-range option, as of early 2021.

The Honor MagicBook 14 is among the fastest laptops powered by the 3500U that we know of. It can be up to 50% faster in CPU-bound workloads than the slowest system featuring the same chip in our database, as of August 2023.

Power consumption

This Ryzen 5 series chip has a default TDP (also known as the long-term power limit) of 15 W, a value that laptop makers are free to set to anything between 12 W and 35 W with clock speeds and performance changing accordingly as a result. Either way, this is a tad too high to allow for passively cooled designs.

The chip is manufactured on a 12 nm process for subpar, as of late 2022, energy efficiency.

Intel Core i7-8550U

► remove from comparison Intel i5-8550U

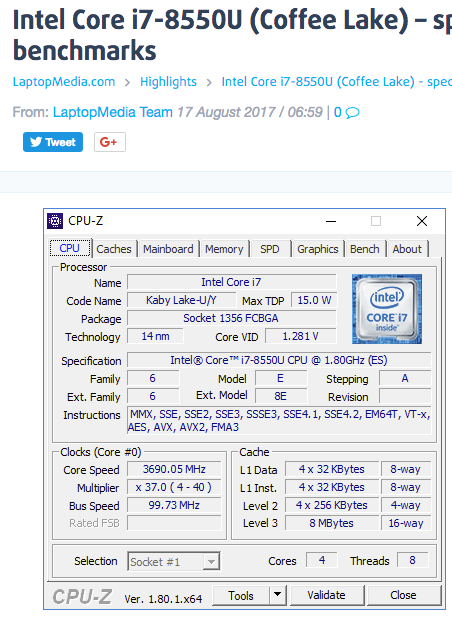
The Intel Core i7-8550U is a power efficient quad-core SoC for notebooks and Ultrabooks based on the Kaby Lake Refresh generation and was announced in August 2017. Contrary to its direct predecessors Core i7-7500U and i5-7260U, respectively, which were still dual-cores, the i7-8550U is equipped with four cores but at a lower base frequency of 1.8 GHz. The Turbo Boost is not specified yet, but should be at least 3.7 - 4 GHz and therefore also offer good short term single core speeds. The GPU is now named Intel UHD Graphics 620 but otherwise identical to the Intel HD Graphics 620. The integrated memory controller supports DDR4-2400 / LPDDR3-2133 and dual channel memory.

Architecture

Intel basically uses the same micro architecture compared to Skylake, so the per-MHz performance does not differ. The manufacturer only reworked the Speed Shift technology for faster dynamic adjustments of voltages and clocks, and the improved 14nm process allows much higher frequencies combined with better efficiency than before.

Performance

The performance of the i7-8550U depends on the cooling solution of the laptop and the defined TDP limits for short and long term performance. This leads to big differences in our benchmark scores ranging from the 15 Watt reference by Intel up to the 23% higher score of the Inspiron 17-7773 in the Cinebench R15 Multi benchmark. Especially when taxing the CPU for longer periods, these differences can be even higher.

In our usual benchmarks, the average i7-8550U is as fast as the 35 Watt rated Core i5-7440HQ. For single thread performance, the high Turbo Boost frequency helps achieving one of the highest scores for mobile CPUs.

Graphics

The integrated Intel UHD Graphics 620 (Intel Gen 9.5) is untouched from the 8th Gen Kaby Lake chips. With fast dual-channel memory it can reach the performance of a dedicated GeForce 920M.

Contrary to Skylake, Kaby lake now also supports H.265/HEVC Main 10 with a 10-bit color depth as well as Google's VP9 codec. The dual-core Kaby Lake processors announced in January should also support HDCP 2.2.

Power Consumption

The chip is manufactured in an improved 14nm process with FinFET transistors (14nm+), the same as the 7th Gen Kaby Lake processors. Intel still specifies the TDP with 15 Watts, which is typical for ULV chips. Depending on the usage scenario, the TDP can vary between 7.5 (cTDP Down) and 25 Watts.

ModelAMD Ryzen 5 3500UIntel Core i7-8550U
CodenamePicasso-U (Zen+)Kaby Lake Refresh
SeriesAMD Picasso (Ryzen 3000 APU)Intel Kaby Lake Refresh
Series: Kaby Lake Refresh Kaby Lake Refresh
AMD Ryzen 7 3780U compare2.3 - 4 GHz4 / 8 cores4 MB L3
AMD Ryzen 7 3700U compare2.3 - 4 GHz4 / 8 cores4 MB L3
AMD Ryzen 5 3550H compare2.1 - 3.7 GHz4 / 8 cores4 MB L3
AMD Ryzen 5 3500U « 2.1 - 3.7 GHz4 / 8 cores4 MB L3
AMD Ryzen 5 3450U compare2.1 - 3.5 GHz4 / 8 cores4 MB L3
AMD Ryzen 5 3580U compare2.1 - 3.7 GHz4 / 8 cores4 MB L3
Intel Core i7-8650U compare1.9 - 4.2 GHz4 / 8 cores8 MB L3
Intel Core i7-8550U « 1.8 - 4 GHz4 / 8 cores8 MB L3
Intel Core i5-8350U compare1.7 - 3.6 GHz4 / 8 cores6 MB L3
Intel Core i5-8250U compare1.6 - 3.4 GHz4 / 8 cores6 MB L3
Intel Core i3-8130U compare2.2 - 3.4 GHz2 / 4 cores4 MB L3
Intel Pentium Gold 4417U compare2.3 GHz2 / 4 cores2 MB L3
Clock2100 - 3700 MHz1800 - 4000 MHz
L1 Cache384 KB256 KB
L2 Cache2 MB1 MB
L3 Cache4 MB8 MB
Cores / Threads4 / 84 / 8
TDP15 Watt15 Watt
Transistors4500 Million
Technology12 nm14 nm
max. Temp.105 °C
SocketFP5BGA1356
FeaturesDDR4-2400 RAM, PCIe 3, MMX, SSE, SSE2, SSE3, SSSE3, SSE4A, SSE4.1, SSE4.2, AVX, AVX2, BMI2, ABM, FMA, ADX, SMEP, SMAP, SMT, CPB, AES-NI, RDRAND, RDSEED, SHA, SMEDual-Channel DDR4 Memory Controller, HyperThreading, AVX, AVX2, Quick Sync, Virtualization, AES-NI
iGPUAMD Radeon RX Vega 8 (Ryzen 2000/3000) ( - 1200 MHz)Intel UHD Graphics 620 (300 - 1150 MHz)
Architecturex86x86
Announced
Manufacturerwww.amd.com
$409 U.S.

Benchmarks

Performance Rating - CB R15 + R20 + 7-Zip + X265 + Blender + 3DM11 CPU - R5 3500U
25 pt (42%)
Restrict / Search: Model: Max. age: years
Performance Rating - CB R15 + R20 + 7-Zip + X265 + Blender + 3DM11 CPU - i5-8550U
26.6 pt (44%)
Restrict / Search: Model: Max. age: years
Cinebench 2024 - Cinebench 2024 CPU Single Core
55.5 Points (31%)
Cinebench 2024 - Cinebench 2024 CPU Multi Core
206 Points (4%)
Cinebench R23 - Cinebench R23 Multi Core
2914 Points (3%)
Cinebench R23 - Cinebench R23 Single Core
1021 Points (43%)
Cinebench R20 - Cinebench R20 CPU (Single Core)
min: 317     avg: 354.3     median: 364 (40%)     max: 372 Points
min: 383     avg: 388.5     median: 388.5 (42%)     max: 394 Points
Cinebench R20 - Cinebench R20 CPU (Multi Core)
min: 1063     avg: 1436     median: 1477 (4%)     max: 1540 Points
min: 1118     avg: 1128     median: 1128 (3%)     max: 1138 Points
Cinebench R15 - Cinebench R15 CPU Multi 64 Bit
min: 482     avg: 642     median: 650 (4%)     max: 682 Points
min: 301     avg: 576     median: 553 (3%)     max: 761 Points
Cinebench R15 - Cinebench R15 CPU Single 64 Bit
min: 131     avg: 142.4     median: 143 (40%)     max: 147 Points
min: 108     avg: 159.5     median: 163 (45%)     max: 172 Points
Cinebench R11.5 - Cinebench R11.5 CPU Multi 64 Bit
7.6 Points (10%)
min: 4.38     avg: 6.3     median: 6.1 (8%)     max: 8.56 Points
Cinebench R11.5 - Cinebench R11.5 CPU Single 64 Bit
1.7 Points (39%)
min: 1.43     avg: 1.8     median: 1.9 (45%)     max: 1.95 Points
Cinebench R10 - Cinebench R10 Rend. Single (32bit)
min: 4542     avg: 4556     median: 4557.5 (28%)     max: 4565 Points
min: 4202     avg: 6333     median: 6423 (39%)     max: 8211 Points
Cinebench R10 - Cinebench R10 Rend. Multi (32bit)
min: 13249     avg: 16322     median: 17230.5 (12%)     max: 17578 Points
min: 11694     avg: 17867     median: 17321.5 (13%)     max: 24180 Points
Cinebench R10 - Cinebench R10 Rend. Multi (64bit)
min: 12279     avg: 23153     median: 22717 (15%)     max: 31667 Points
Cinebench R10 - Cinebench R10 Rend. Single (64bit)
min: 6737     avg: 8065     median: 8370.5 (10%)     max: 8436 Points
wPrime 2.10 - wPrime 2.0 1024m *
368.2 s (4%)
min: 257.5     avg: 352     median: 366.7 (4%)     max: 435 s
wPrime 2.10 - wPrime 2.0 32m *
12.9 s (3%)
min: 7.047     avg: 9.8     median: 9.9 (2%)     max: 12.7 s
wPrime 1.55 - wPrime 1.55 1024m *
847 s (3%)
wPrime 1.55 - wPrime 1.55 32m *
26.3 s (14%)
WinRAR - WinRAR 4.0
2455 Points (4%)
min: 3847     avg: 4487     median: 4374 (7%)     max: 5287 Points
7-Zip 18.03 - 7-Zip 18.03 Multi Thread 4 runs
min: 15825     avg: 16929     median: 17024.5 (10%)     max: 17508 MIPS
15613 MIPS (9%)
7-Zip 18.03 - 7-Zip 18.03 Single Thread 4 runs
min: 3502     avg: 3541     median: 3538 (42%)     max: 3580 MIPS
4337 MIPS (51%)
X264 HD Benchmark 4.0 - x264 Pass 2
39.2 fps (13%)
min: 32     avg: 35.3     median: 33.1 (11%)     max: 41 fps
X264 HD Benchmark 4.0 - x264 Pass 1
134.8 fps (31%)
min: 143.6     avg: 153.9     median: 147.9 (34%)     max: 178 fps
HWBOT x265 Benchmark v2.2 - HWBOT x265 4k Preset
min: 3.35     avg: 3.9     median: 4 (7%)     max: 4.15 fps
min: 3.77     avg: 4     median: 3.9 (7%)     max: 4.43 fps
TrueCrypt - TrueCrypt Serpent
0.4 GB/s (13%)
min: 0.357     avg: 0.4     median: 0.4 (13%)     max: 0.469 GB/s
TrueCrypt - TrueCrypt Twofish
0.7 GB/s (12%)
min: 0.583     avg: 0.7     median: 0.7 (13%)     max: 0.793 GB/s
TrueCrypt - TrueCrypt AES
4.4 GB/s (11%)
min: 3.3     avg: 4.2     median: 4.3 (11%)     max: 4.6 GB/s
Blender - Blender 2.79 BMW27 CPU *
min: 680     avg: 704     median: 694 (5%)     max: 796 Seconds
min: 841     avg: 897     median: 913 (6%)     max: 937 Seconds
R Benchmark 2.5 - R Benchmark 2.5 *
min: 0.734     avg: 0.7     median: 0.7 (16%)     max: 0.804 sec
0.7 sec (15%)
3DMark 06 - CPU - 3DMark 06 - CPU
min: 5044     avg: 5951     median: 5950.5 (13%)     max: 6857 Points
Super Pi mod 1.5 XS 1M - Super Pi mod 1.5 XS 1M *
12 s (3%)
min: 9     avg: 10.5     median: 9.3 (2%)     max: 17.45 s
Super Pi mod 1.5 XS 2M - Super Pi mod 1.5 XS 2M *
27.8 s (1%)
min: 20     avg: 23     median: 21.2 (1%)     max: 32.72 s
Super Pi Mod 1.5 XS 32M - Super Pi mod 1.5 XS 32M *
697 s (3%)
min: 510     avg: 575     median: 536 (2%)     max: 740 s
3DMark Vantage - 3DM Vant. Perf. CPU no Physx
18229 Points (14%)
21623 Points (17%)
3DMark 11 - 3DM11 Performance Physics
min: 5213     avg: 6267     median: 6402.5 (16%)     max: 6967 Points
min: 3961     avg: 6653     median: 6649 (16%)     max: 9527 Points
3DMark - 3DMark Ice Storm Physics
min: 29562     avg: 32942     median: 30254 (25%)     max: 48997 Points
min: 16314     avg: 42803     median: 44682 (36%)     max: 55226 Points
3DMark - 3DMark Ice Storm Extreme Physics
min: 30656     avg: 34184     median: 31241.5 (25%)     max: 49067 Points
min: 16312     avg: 37536     median: 36876 (30%)     max: 51937 Points
3DMark - 3DMark Ice Storm Unlimited Physics
min: 26201     avg: 36686     median: 32088 (27%)     max: 54995 Points
min: 27917     avg: 50269     median: 52842 (44%)     max: 58213 Points
3DMark - 3DMark Cloud Gate Physics
min: 5217     avg: 6435     median: 6613 (17%)     max: 7132 Points
min: 3437     avg: 5739     median: 5695 (14%)     max: 7725 Points
3DMark - 3DMark Fire Strike Standard Physics
min: 7496     avg: 9199     median: 9380 (17%)     max: 10054 Points
min: 3961     avg: 8228     median: 8306 (15%)     max: 11110 Points
3DMark - 3DMark Time Spy CPU
min: 2450     avg: 2660     median: 2696 (11%)     max: 2880 Points
min: 2463     avg: 2898     median: 2875 (12%)     max: 3865 Points
Geekbench 6.4 - Geekbench 6.4 Single-Core
1101 Points (27%)
Geekbench 6.4 - Geekbench 6.4 Multi-Core
3324 Points (13%)
Geekbench 5.5 - Geekbench 5.1 - 5.5 64 Bit Single-Core
min: 777     avg: 886     median: 902 (35%)     max: 909 Points
Geekbench 5.5 - Geekbench 5.1 - 5.5 64 Bit Multi-Core
min: 2543     avg: 3097     median: 3157 (6%)     max: 3269 Points
Geekbench 5.0 - Geekbench 5.0 64 Bit Single-Core
min: 772     avg: 880     median: 896 (4%)     max: 913 Points
1081 Points (5%)
Geekbench 5.0 - Geekbench 5.0 64 Bit Multi-Core
min: 2599     avg: 3035     median: 3118.5 (10%)     max: 3244 Points
3141 Points (10%)
Geekbench 4.4 - Geekbench 4.1 - 4.4 64 Bit Single-Core
min: 3400     avg: 3785     median: 3893 (39%)     max: 3924 Points
min: 4555     avg: 4858     median: 4900 (49%)     max: 4997 Points
Geekbench 4.4 - Geekbench 4.1 - 4.4 64 Bit Multi-Core
min: 10099     avg: 11388     median: 11783 (12%)     max: 12171 Points
min: 10869     avg: 14247     median: 15117 (15%)     max: 16294 Points
Geekbench 4.0 - Geekbench 4.0 64 Bit Single-Core
3669 Points (41%)
min: 4439     avg: 4686     median: 4699 (52%)     max: 4858 Points
Geekbench 4.0 - Geekbench 4.0 64 Bit Multi-Core
10597 Points (14%)
min: 10747     avg: 13316     median: 13251 (17%)     max: 15294 Points
Geekbench 3 - Geekbench 3 32 Bit Multi-Core
min: 9503     avg: 12182     median: 13040 (23%)     max: 13145 Points
min: 8918     avg: 12315     median: 12327.5 (22%)     max: 14144 Points
Geekbench 3 - Geekbench 3 32 Bit Single-Core
min: 3258     avg: 3405     median: 3442.5 (45%)     max: 3478 Points
min: 2471     avg: 3671     median: 3770 (49%)     max: 4020 Points
Geekbench 3 - Geekbench 3 64 Bit Multi-Core
13873 Points (22%)
min: 11637     avg: 12834     median: 12833.5 (20%)     max: 14030 Points
Geekbench 3 - Geekbench 3 64 Bit Single-Core
3682 Points (55%)
min: 3784     avg: 3949     median: 3948.5 (59%)     max: 4113 Points
Geekbench 2 - 32 Bit - Geekbench Stream
6193 Points (33%)
Geekbench 2 - 32 Bit - Geekbench Memory
6118 Points (42%)
Geekbench 2 - 32 Bit - Geekbench Floating Point
16467 Points (32%)
Geekbench 2 - 32 Bit - Geekbench Integer
12317 Points (25%)
Geekbench 2 - 32 Bit - Geekbench Total Score
11917 Points (31%)
Mozilla Kraken 1.1 - Kraken 1.1 Total Score *
min: 1101     avg: 1272     median: 1274.5 (1%)     max: 1693 ms
min: 877     avg: 1087     median: 1107 (1%)     max: 2114 ms
Sunspider - Sunspider 1.0 Total Score *
128.8 ms (1%)
min: 63.2     avg: 80.3     median: 71.3 (1%)     max: 122.7 ms
Octane V2 - Octane V2 Total Score
min: 19083     avg: 26794     median: 27809 (20%)     max: 32938 Points
min: 17296     avg: 33448     median: 33496 (25%)     max: 42043 Points
WebXPRT 3 - WebXPRT 3 Score
min: 145     avg: 154     median: 148 (27%)     max: 172 Points
182 Points (33%)
Power Consumption - Prime95 Power Consumption - external Monitor *
min: 24     avg: 33.7     median: 34.7 (6%)     max: 42.5 Watt
min: 25.3     avg: 40.1     median: 33.7 (6%)     max: 61.4 Watt
Power Consumption - Cinebench R15 Multi Power Consumption - external Monitor *
min: 34.5     avg: 37     median: 38 (7%)     max: 38.5 Watt
min: 28.2     avg: 38.1     median: 30.4 (6%)     max: 63.2 Watt
Power Consumption - Power Efficiency - Cinebench R15 Multi external Monitor
min: 17.2     avg: 18.1     median: 18.1 (13%)     max: 18.9 Points per Watt
min: 10.4     avg: 15.6     median: 17.3 (13%)     max: 17.5 Points per Watt

Average Benchmarks AMD Ryzen 5 3500U → 100% n=47

Average Benchmarks Intel Core i7-8550U → 113% n=47

- Range of benchmark values for this graphics card
red legend - Average benchmark values for this graphics card
* Smaller numbers mean a higher performance
1 This benchmark is not used for the average calculation

Add one or more devices and compare

In the following list you can select (and also search for) devices that should be added to the comparison. You can select more than one device.

restrict list:
v1.33
log 07. 15:14:47

#0 ran 0s before starting gpusingle class +0s ... 0s

#1 checking url part for id 11161 +0s ... 0s

#2 checking url part for id 9208 +0s ... 0s

#3 redirected to Ajax server, took 1754572487s time from redirect:0 +0s ... 0s

#4 did not recreate cache, as it is less than 5 days old! Created at Thu, 07 Aug 2025 05:18:16 +0200 +0s ... 0s

#5 composed specs +0.006s ... 0.006s

#6 did output specs +0s ... 0.006s

#7 getting avg benchmarks for device 11161 +0.005s ... 0.011s

#8 got single benchmarks 11161 +0.026s ... 0.036s

#9 getting avg benchmarks for device 9208 +0.004s ... 0.041s

#10 got single benchmarks 9208 +0.069s ... 0.11s

#11 got avg benchmarks for devices +0s ... 0.11s

#12 min, max, avg, median took s +0.069s ... 0.179s

#13 return log +0.001s ... 0.18s

Please share our article, every link counts!
Mail Logo
> Expert Reviews and News on Laptops, Smartphones and Tech Innovations > Benchmarks / Tech > Processor Comparison - Head 2 Head
Redaktion, 2017-09- 8 (Update: 2023-07- 1)