Intel Core Ultra 9 185H ► remove from comparison The Intel Core Ultra 9 185H is the top-of-the-line Meteor Lake family chip that debuted in December 2023. This 1st Gen Core Ultra processor has come to replace 13th generation Core chips; it has 16 cores (6 + 8 + 2) and 22 threads at its disposal. Its P erformance cores, of which there are 6, are SMT-enabled and run at up to 5.1 GHz while its E fficient cores, of which there are 10 (8 main cores plus 2 extra ones found in the Low Power Island) run at up to 3.8 GHz. The 8-core Arc GPU , just out of the oven, serves as the integrated graphics adapter - this runs at up to 2.35 GHz - and there is a bevy of other brand-new technologies on offer as well, such as the integrated AI Boost NPU with two Gen 3 engines for hardware AI workload acceleration.
Architecture and Features
With Meteor Lake, Intel intends to deliver higher CPU performance, higher GPU performance and at the same time, longer battery life than what Raptor Lake chips were capable of. The company also wants a large piece of the AI cake and is working with Microsoft and other partners to make that happen. As a result, Windows Defender is now AI-enabled, meaning it can use the Intel NPU to take some of the load off the main CPU cores. We also get this new Intel Device Discovery technology that is designed to give us a better hardware-based remote laptop management than ever before; and, to make things even better, Intel now offers a dedicated Arc Pro graphics driver for workstations.
This generation of Intel Core processors features Redwood architecture P-cores and Crestmont architecture E-cores. Both come with slight architectural improvements over Raptor Cove and Gracemont respectively for slightly higher performance-per-clock figures; the interesting thing is that of the 10 E-cores, two are actually a separate cluster located on what Intel calls a "Low Power Island ". Essentially, the latter is an SoC within an SoC that can stay active while the rest of the chip is turned off to save power. The low-power E-cores run at up to 2.5 GHz. Intel hopes that this approach will let it deliver unprecedentedly low power consumption figures when under low load, boosting battery life of laptops and tablets powered by Meteor Lake.
To build its Meteor Lake processors, Intel uses the Foveros technology (stacking several chips on top of each other). This is a cost-cutting measure more than anything else, as manufacturing several small dies on several different processes is so much cheaper than making a huge single die and hoping that there are no defects in it that will require disabling some parts of it.
Elsewhere, the Core Ultra 9 185H comes with 24 MB of L3 cache and a very healthy number of PCIe 5 and PCIe 4 lanes for NVMe SSD speeds up to 15.7 GB/s. vPro Enterprise and business-centric features such as the Remote Platform Erase are onboard as well. It supports RAM running at up to 7467 MHz (DDR5-5600, LPDDR5-7467, LPDDR5x-7467, to be specific - which is about as good as what 8040 series Ryzen chips have). Naturally, the chip also features built-in Thunderbolt 4 support and Intel CNVi Wi-Fi support; fascinatingly enough, Intel chose to keep native SATA III support that AMD had removed from its Ryzen processors quite a while ago.
The 185H is compatible with 64-bit Windows 10, 64-bit Windows 11 and with many Linux distros.
Performance
If one chooses to trust the official Intel performance data, then the 185H is not a whole lot faster than the Ryzen 9 6900HX (Zen 3 Plus, 8 cores, 16 threads, up to 4.9 GHz), as far as multi-thread performance is concerned. This isn't a ground-breaking result but let's just wait for our in-house testing results instead of jumping to conclusions.
Either way, real-world performance of the chip may vary significantly depending on how high the CPU power limits are and how competent the cooling solution of the system is.
Graphics
The 8-core Arc GPU running at up to 2.35 GHz is slated to be a proper alternative to the mighty Radeon 780M . The thing is about as fast as the GTX 1650 (Laptop) and the RTX 2050 (Laptop) to represent some seriously solid performance gains over aging Xe-series integrated GPUs . If one chooses to take Intel's word for it, that is.
A proper DX12 Ultimate graphics adapter, the Arc is no stranger to ray tracing and other modern technologies including AI frame generation (XeSS). It will let you connect up to four SUHD 4320p monitors and it will both HW-encode and HW-encode the most widely used video codecs including AVC, HEVC and AV1 in a fast and efficient manner.
Your mileage may vary depending on how high the CPU power limits are, how competent the cooling solution of your system is, how fast the RAM of your system is. The latter is really important; Intel stresses that for the Arc to deliver the best results possible, multi-channel RAM configuration is a must.
Power consumption
This mighty Core Ultra 9 series processor has a "base" power consumption of 45 W, while its Turbo power consumption is not supposed to exceed 115 W. A powerful cooling solution will be needed to sort out this chip's hot temper.
The 185H is comprised of five small chips ("tiles") that are connected using Intel's Foveros technology. The tile containing main CPU cores is produced on the modern 7 nm Intel process marketed as Intel 4 while most other tiles (the iGPU, the I/O die, ...) are built with TSMC's N5 and N6 processes. The base tile is built with the old Intel 22FFL process.
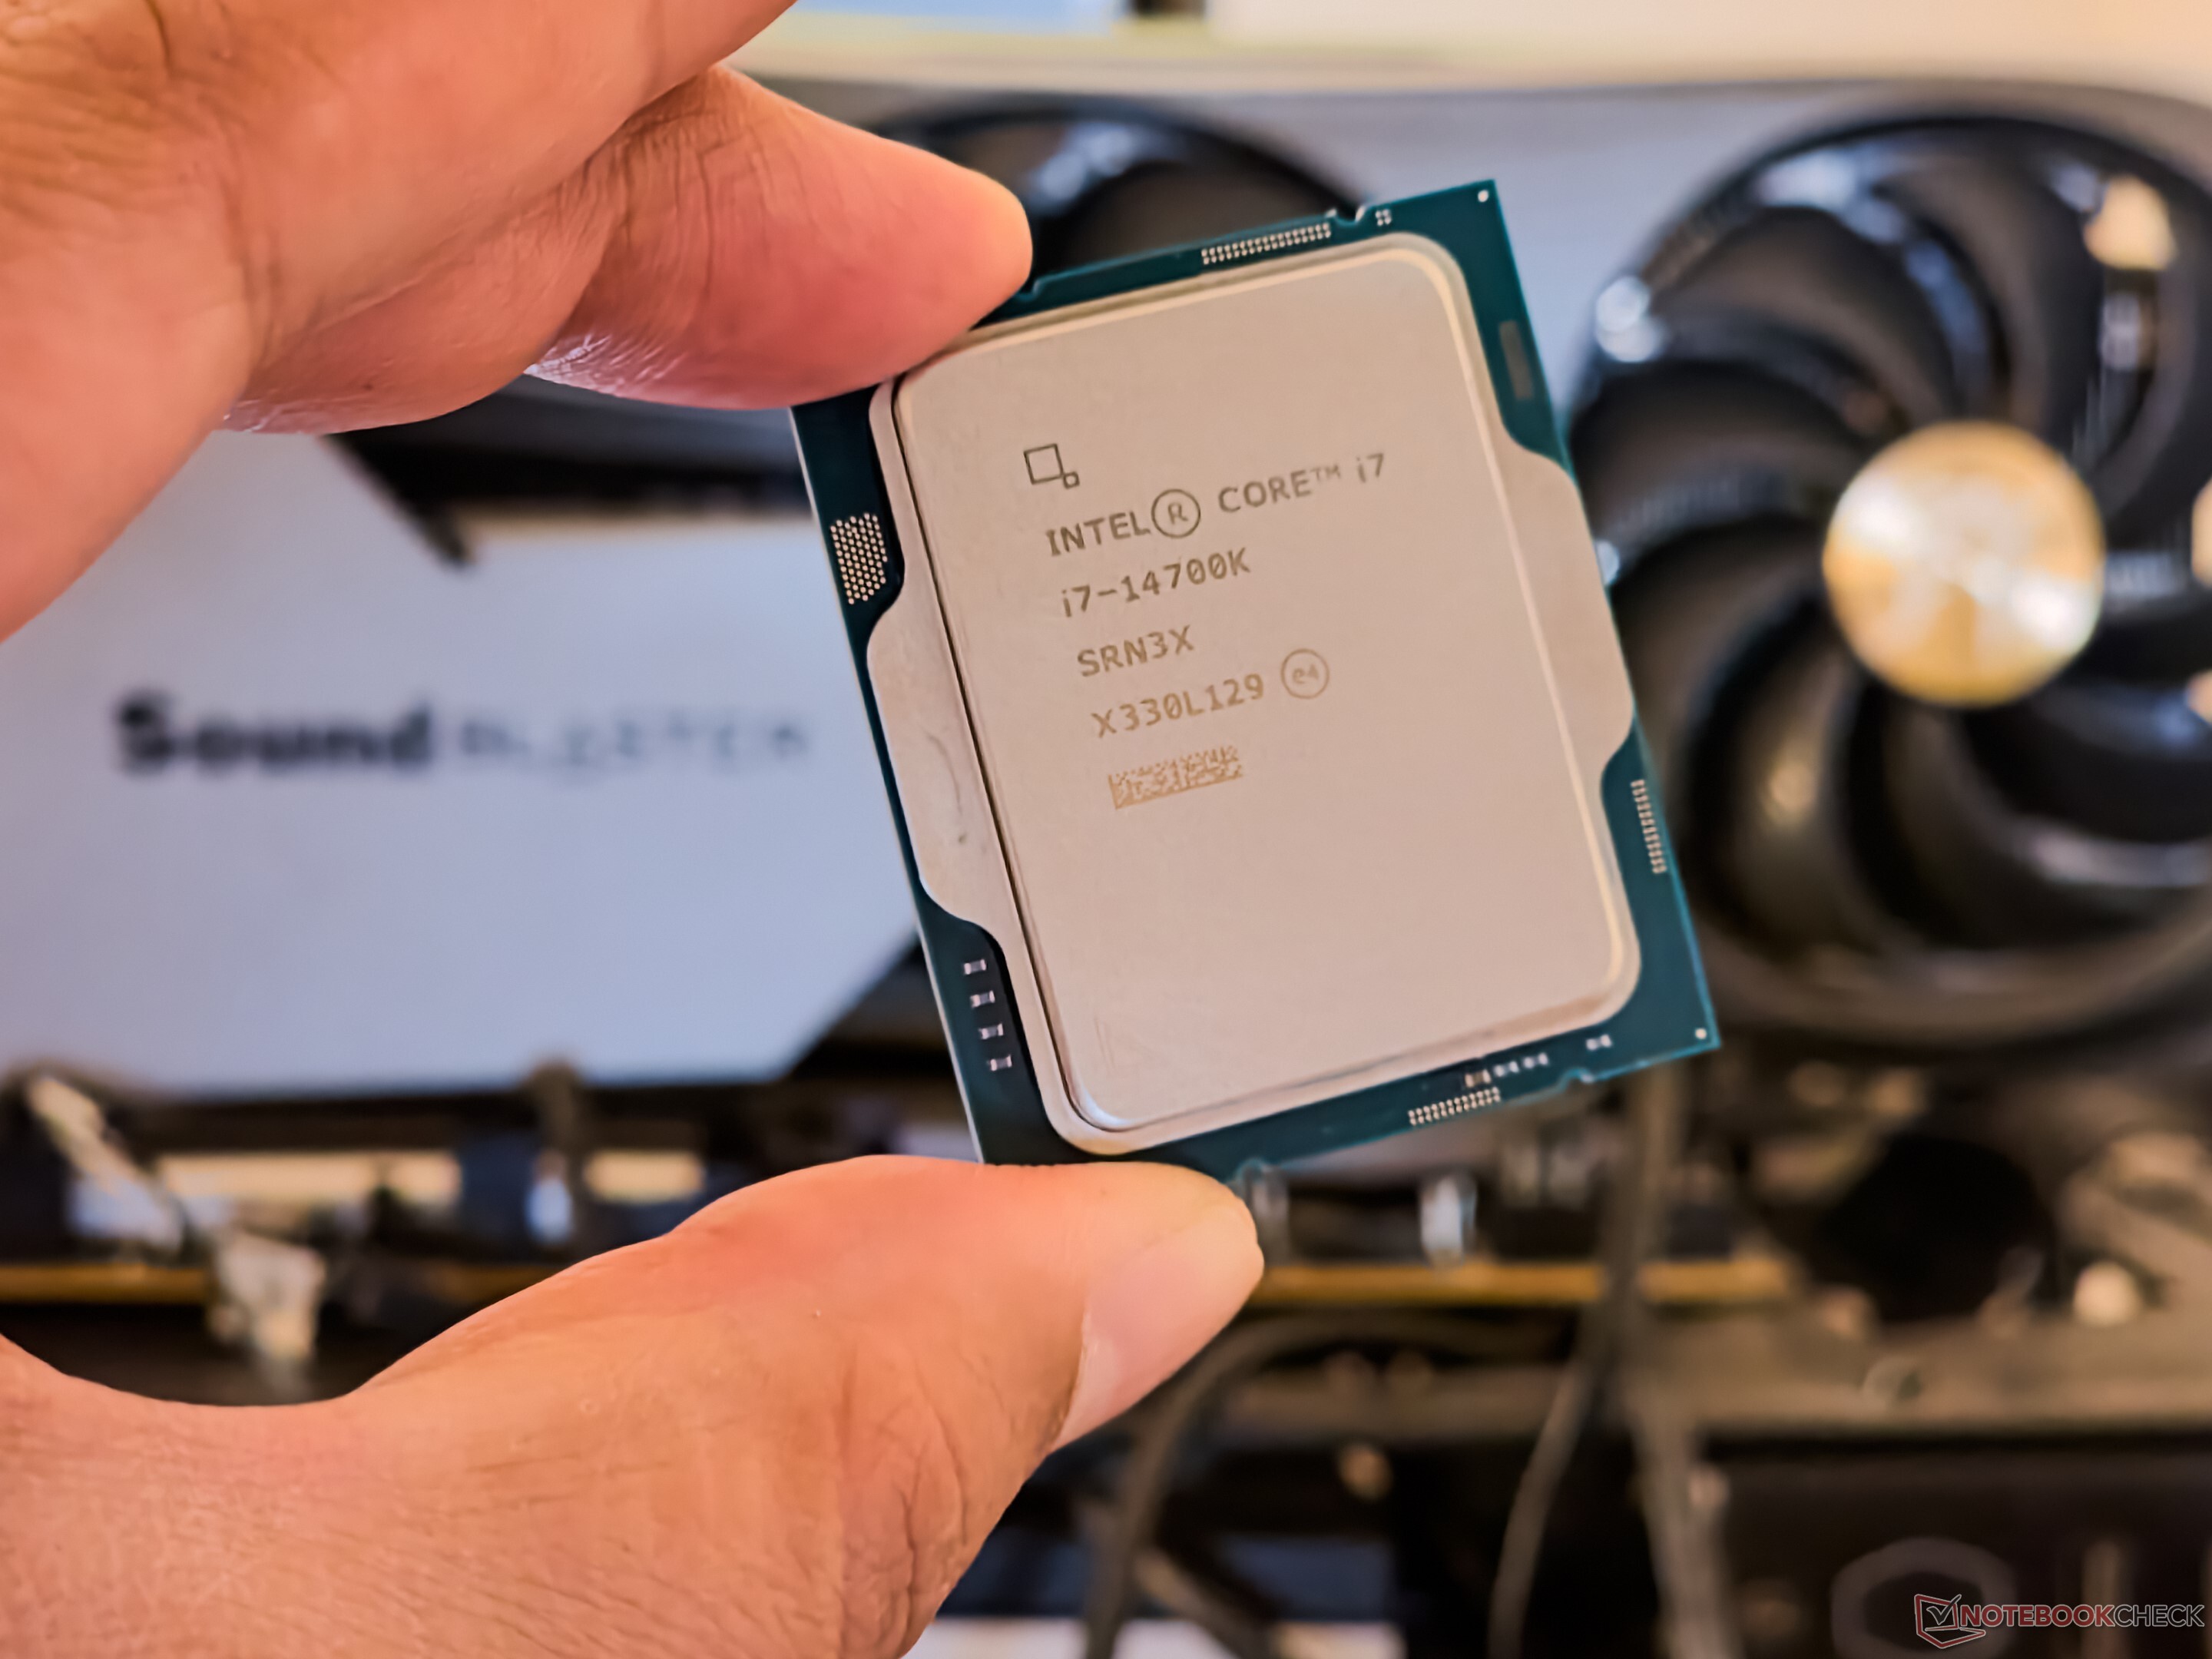
Intel Core i7-14700K ► remove from comparison The Intel Core i7-14700K is a desktop processor based on the Raptor Lake architecture, which inherits the 13th generation of Intel Core processors with minor improvements. The processor offers a base clock of 2.5 GHz or 3.4 GHz and reaches up to 5.6 GHz in Turbo. The basic CPU structure remains unchanged. The Intel Core i7-14700K features 8 P-cores and 12 E-cores, allowing up to 28 threads to be processed in parallel. The Intel Core i7-14700K still offers a freely selectable multiplier, which makes overclocking much easier. It is also based on the LGA 1700 socket, which was already introduced with Alder Lake.
Performance
Compared to the Intel Core i7-13700K , the IPC of the new Core i7-14700K has only been increased slightly. This means that the difference in performance is only due to the higher number of efficiency cores (12 vs. 8) and higher clock rates.
Graphics unit
Like the Intel Core i7-13700K, the Intel Core i7-14700K also has an integrated graphics unit. The Intel Iris Xe architecture continues to serve as the basis. In terms of performance, however, nothing has changed with the Intel UHD Graphics 770.
Power consumption
The TDP of the Intel Core i7-14700K is 125 Watts, with the option of consuming up to 253 watts in Turbo mode.
Intel Core i9-14900K ► remove from comparison The Intel Core i9-14900K is a high-end processor based on the Raptor Lake architecture, similar to the Intel Core i9-13900K last year. The base clock is 3.2 GHz and can reach up to 6 GHz under optimal conditions. The total of 32 threads are still divided into 8 P and 16 E cores. The 8 performance cores (P-cores) also offer hyperthreading, which means that a total of 32 threads can be processed simultaneously in conjunction with the 16 energy-efficient E-cores. As before, the K models continue to offer a freely selectable multiplier, which simplifies overclocking. The Intel Core i9-14900K uses the same CPU socket (LGA 1700) as the Intel Core i9-13900K. This means you don't necessarily need a new motherboard, as the 600 series chipsets support the new processors after a BIOS update. There is also still the option of using DDR4 for the RAM.
Performance
Compared to the Intel Core i9-13900K , the Core i9-14900K still offers 8 P-cores, which are relieved by 16 additional E-cores for demanding applications and thus ensure very high multi-thread performance. In comparison, however, the Intel Core i9-14900K can only gain a slight lead. The e-cores primarily take care of background applications. The hybrid architecture relies on the Intel Thread Director, which is responsible for the correct allocation of tasks. Meanwhile, the IPC could only be increased slightly. As an innovation with the Intel Core i9-14900K, the manufacturer is increasingly relying on AI, which is also used for overclocking. With one click in the Intel Extreme Utility, the tool checks the entire system and makes the necessary settings.
Graphics unit
Like the Intel Core i9-13900K, the Intel Core i9-14900K offers an integrated graphics unit. The Intel Iris Xe architecture continues to serve as the basis. In terms of performance, however, nothing has changed with the Intel UHD Graphics 770 .
Power consumption
The Intel Core i9-14900K is specified with a TDP of 125 watts, which corresponds to the PL1 value. In Boost mode, the processor's performance can increase to up to 253 watts (PL2). However, this requires very good cooling. Compared to the Intel Core i9-13900K, the specified power consumption does not increase if the limits are adhered to. The situation is different if the limits are deactivated. As this value depends on the overall system, we cannot make an exact statement on this.
Model Intel Core Ultra 9 185H Intel Core i7-14700K Intel Core i9-14900K Codename Meteor Lake-H Raptor Lake Raptor Lake Series Intel Meteor Lake-H Intel Raptor Lake-R Intel Raptor Lake-R Series: Raptor Lake-R Raptor Lake Clock 3800 - 5100 MHz 2500 - 5600 MHz 3200 - 6000 MHz L3 Cache 24 MB 33 MB 36 MB Cores / Threads 16 / 22 20 / 28 24 / 32 TDP 45 Watt 125 Watt 125 Watt Technology 7 nm 10 nm 10 nm max. Temp. 110 °C 100 °C 100 °C Socket BGA2049 LGA 1700 LGA 1700 Features DDR5-5600/LPDDR5-7467/LPDDR5x-7467 RAM, PCIe 5, Thr. Director, DL Boost, AI Boost, vPro Enterprise, RPE, MMX, SSE, SSE2, SSE3, SSSE3, SSE4.1, SSE4.2, AES, AVX, AVX2, AVX-VNNI, FMA3, SHA Intel UHD Graphics 770, DDR5 5600 MT/s, DDR4 3200 MT/s Intel UHD Graphics 770, DDR5 5600 MT/s, DDR4 3200 MT/s iGPU Intel Arc 8-Core iGPU ( - 2350 MHz)Intel UHD Graphics 770 (300 - 1600 MHz)Intel UHD Graphics 770 (300 - 1650 MHz)Architecture x86 x86 x86 Announced Manufacturer ark.intel.com ark.intel.com ark.intel.com L2 Cache 28 MB 32 MB TDP Turbo PL2 253 Watt $409 U.S. $589 U.S. Die Size 257 mm2
Performance Rating - CB R15 + R20 + 7-Zip + X265 + Blender + 3DM11 CPU - Ultra 9 185H
Performance Rating - CB R15 + R20 + 7-Zip + X265 + Blender + 3DM11 CPU - i7-14700K
Performance Rating - CB R15 + R20 + 7-Zip + X265 + Blender + 3DM11 CPU - i9-14900K
Cinebench 2024 - Cinebench 2024 CPU Single Core
min: 103 avg: 108.2 median: 108.1 (61%) max: 112.2 Points
CPU TDP 45 W TDP 58 W TDP 65 W TDP 90 W TDP 100 W TDP 115 W 97% 97% 100% 95% 98% 96%
min: 126 avg: 127 median: 127 (71%) max: 127.9 Points
CPU TDP ? TDP 45 W TDP 58 W TDP 65 W TDP 90 W TDP 100 W TDP 115 W 100% 84% 85% 87% 88% 85% 84%
min: 134 avg: 136.5 median: 137 (77%) max: 138 Points
CPU TDP ? TDP 45 W TDP 58 W TDP 65 W TDP 90 W TDP 100 W TDP 115 W TDP 253 W 97% 79% 79% 81% 82% 80% 78% 100%
Cinebench 2024 - Cinebench 2024 CPU Multi Core
min: 828 avg: 1003 median: 1021 (19%) max: 1096 Points
CPU TDP 45 W TDP 58 W TDP 65 W TDP 90 W TDP 100 W TDP 115 W 83% 93% 99% 100% 96% 94%
min: 1559 avg: 1771 median: 1770.5 (33%) max: 1982 Points
CPU TDP ? TDP 45 W TDP 58 W TDP 65 W TDP 90 W TDP 100 W TDP 115 W 100% 44% 50% 53% 62% 52% 50%
min: 2112 avg: 2189 median: 2146.5 (40%) max: 2352 Points
CPU TDP ? TDP 45 W TDP 58 W TDP 65 W TDP 90 W TDP 100 W TDP 115 W TDP 253 W 100% 40% 46% 49% 57% 47% 46% 99%
Cinebench R23 - Cinebench R23 Multi Core
min: 12688 avg: 18030 median: 18338 (17%) max: 19851 Points
CPU TDP ? TDP 20 W TDP 45 W TDP 55 W TDP 58 W TDP 65 W TDP 70 W TDP 73 W TDP 80 W TDP 83 W TDP 90 W TDP 100 W TDP 105 W TDP 115 W 96% 64% 85% 86% 90% 95% 78% 97% 100% 97% 93% 90% 92% 89%
min: 30989 avg: 33441 median: 33440.5 (31%) max: 35892 Points
CPU TDP ? TDP 20 W TDP 45 W TDP 55 W TDP 58 W TDP 65 W TDP 70 W TDP 73 W TDP 80 W TDP 83 W TDP 90 W TDP 100 W TDP 105 W TDP 115 W 100% 46% 62% 62% 65% 69% 56% 70% 72% 70% 82% 65% 67% 64%
min: 37606 avg: 39400 median: 39399.5 (37%) max: 41193 Points
CPU TDP ? TDP 20 W TDP 45 W TDP 55 W TDP 58 W TDP 65 W TDP 70 W TDP 73 W TDP 80 W TDP 83 W TDP 90 W TDP 100 W TDP 105 W TDP 115 W 100% 38% 51% 51% 54% 57% 46% 57% 59% 58% 68% 53% 55% 53%
Cinebench R23 - Cinebench R23 Single Core
min: 1620 avg: 1818 median: 1812 (76%) max: 1912 Points
CPU TDP ? TDP 20 W TDP 45 W TDP 55 W TDP 58 W TDP 65 W TDP 70 W TDP 73 W TDP 80 W TDP 83 W TDP 90 W TDP 100 W TDP 105 W TDP 115 W 98% 95% 94% 93% 95% 96% 80% 97% 100% 94% 97% 100% 85% 92%
min: 2153 avg: 2160 median: 2160 (91%) max: 2167 Points
CPU TDP ? TDP 20 W TDP 45 W TDP 55 W TDP 58 W TDP 65 W TDP 70 W TDP 73 W TDP 80 W TDP 83 W TDP 90 W TDP 100 W TDP 105 W TDP 115 W 100% 90% 89% 88% 90% 91% 75% 92% 95% 89% 97% 95% 80% 88%
min: 2174 avg: 2263 median: 2262.5 (95%) max: 2351 Points
CPU TDP ? TDP 20 W TDP 45 W TDP 55 W TDP 58 W TDP 65 W TDP 70 W TDP 73 W TDP 80 W TDP 83 W TDP 90 W TDP 100 W TDP 105 W TDP 115 W 100% 85% 84% 83% 85% 86% 71% 87% 89% 84% 92% 89% 76% 82%
Cinebench R20 - Cinebench R20 CPU (Single Core)
min: 622 avg: 701 median: 702 (76%) max: 735 Points
CPU TDP ? TDP 20 W TDP 45 W TDP 55 W TDP 58 W TDP 65 W TDP 70 W TDP 73 W TDP 80 W TDP 83 W TDP 90 W TDP 100 W TDP 105 W TDP 115 W 98% 94% 94% 93% 94% 96% 80% 96% 100% 97% 97% 100% 85% 96%
min: 832 avg: 836 median: 836 (91%) max: 840 Points
CPU TDP ? TDP 20 W TDP 45 W TDP 55 W TDP 58 W TDP 65 W TDP 70 W TDP 73 W TDP 80 W TDP 83 W TDP 90 W TDP 100 W TDP 105 W TDP 115 W 100% 89% 89% 88% 89% 91% 75% 91% 95% 92% 98% 95% 80% 91%
CPU TDP ? TDP 20 W TDP 45 W TDP 55 W TDP 58 W TDP 65 W TDP 70 W TDP 73 W TDP 80 W TDP 83 W TDP 90 W TDP 100 W TDP 105 W TDP 115 W 100% 85% 85% 83% 85% 86% 72% 87% 90% 87% 93% 90% 76% 86%
Cinebench R20 - Cinebench R20 CPU (Multi Core)
min: 4843 avg: 6957 median: 7192 (18%) max: 7651 Points
CPU TDP ? TDP 20 W TDP 45 W TDP 55 W TDP 58 W TDP 65 W TDP 70 W TDP 73 W TDP 80 W TDP 83 W TDP 90 W TDP 100 W TDP 105 W TDP 115 W 95% 63% 84% 84% 91% 97% 79% 97% 100% 97% 94% 88% 93% 91%
min: 11814 avg: 12743 median: 12743 (31%) max: 13672 Points
CPU TDP ? TDP 20 W TDP 45 W TDP 55 W TDP 58 W TDP 65 W TDP 70 W TDP 73 W TDP 80 W TDP 83 W TDP 90 W TDP 100 W TDP 105 W TDP 115 W 100% 46% 61% 61% 66% 70% 58% 70% 73% 71% 83% 64% 68% 67%
CPU TDP ? TDP 20 W TDP 45 W TDP 55 W TDP 58 W TDP 65 W TDP 70 W TDP 73 W TDP 80 W TDP 83 W TDP 90 W TDP 100 W TDP 105 W TDP 115 W 100% 40% 53% 53% 57% 61% 50% 61% 63% 61% 72% 56% 58% 58%
Cinebench R15 - Cinebench R15 CPU Multi 64 Bit
min: 1581.9 avg: 2762 median: 2853 (18%) max: 3165 Points
CPU TDP ? TDP 20 W TDP 45 W TDP 55 W TDP 58 W TDP 65 W TDP 70 W TDP 73 W TDP 80 W TDP 83 W TDP 90 W TDP 100 W TDP 105 W TDP 115 W 75% 73% 87% 89% 90% 90% 76% 100% 95% 94% 90% 86% 90% 90%
min: 4611 avg: 5035 median: 5035 (32%) max: 5459 Points
CPU TDP ? TDP 20 W TDP 45 W TDP 55 W TDP 58 W TDP 65 W TDP 70 W TDP 73 W TDP 80 W TDP 83 W TDP 90 W TDP 100 W TDP 105 W TDP 115 W 92% 67% 80% 82% 83% 83% 70% 92% 87% 87% 100% 80% 83% 83%
min: 5924 avg: 6103 median: 6103 (39%) max: 6282 Points
CPU TDP ? TDP 20 W TDP 45 W TDP 55 W TDP 58 W TDP 65 W TDP 70 W TDP 73 W TDP 80 W TDP 83 W TDP 90 W TDP 100 W TDP 105 W TDP 115 W 100% 56% 66% 68% 69% 69% 58% 77% 73% 72% 83% 66% 69% 69%
Cinebench R15 - Cinebench R15 CPU Single 64 Bit
min: 238 avg: 267.1 median: 268 (74%) max: 281 Points
CPU TDP ? TDP 20 W TDP 45 W TDP 55 W TDP 58 W TDP 65 W TDP 70 W TDP 73 W TDP 80 W TDP 83 W TDP 90 W TDP 100 W TDP 105 W TDP 115 W 98% 93% 93% 91% 94% 97% 84% 96% 100% 95% 97% 100% 85% 93%
min: 313 avg: 313.5 median: 313.5 (87%) max: 314 Points
CPU TDP ? TDP 20 W TDP 45 W TDP 55 W TDP 58 W TDP 65 W TDP 70 W TDP 73 W TDP 80 W TDP 83 W TDP 90 W TDP 100 W TDP 105 W TDP 115 W 100% 88% 89% 87% 89% 93% 80% 92% 95% 91% 97% 95% 81% 89%
min: 317 avg: 324.5 median: 324.5 (90%) max: 332 Points
CPU TDP ? TDP 20 W TDP 45 W TDP 55 W TDP 58 W TDP 65 W TDP 70 W TDP 73 W TDP 80 W TDP 83 W TDP 90 W TDP 100 W TDP 105 W TDP 115 W 100% 84% 84% 83% 85% 88% 76% 87% 90% 87% 92% 91% 77% 85%
Cinebench R11.5 - Cinebench R11.5 CPU Multi 64 Bit
min: 33.95 avg: 34.7 median: 34.6 (45%) max: 35.55 Points
CPU TDP 45 W TDP 65 W TDP 90 W TDP 115 W 97% 95% 100% 98%
min: 54.22 avg: 57.8 median: 57.8 (75%) max: 61.44 Points
CPU TDP ? TDP 45 W TDP 65 W TDP 90 W TDP 115 W 100% 56% 55% 73% 57%
CPU TDP ? TDP 45 W TDP 65 W TDP 90 W TDP 115 W 100% 51% 51% 67% 52%
Cinebench R11.5 - Cinebench R11.5 CPU Single 64 Bit
min: 3.11 avg: 3.2 median: 3.1 (75%) max: 3.27 Points
CPU TDP 45 W TDP 65 W TDP 90 W TDP 115 W 96% 100% 95% 96%
min: 3.7 avg: 3.7 median: 3.7 (89%) max: 3.77 Points
CPU TDP ? TDP 45 W TDP 65 W TDP 90 W TDP 115 W 100% 85% 88% 93% 85%
min: 4.02 avg: 4 median: 4 (95%) max: 4.21 Points
CPU TDP ? TDP 45 W TDP 65 W TDP 90 W TDP 115 W 100% 81% 85% 89% 82%
Cinebench R10 - Cinebench R10 Rend. Single (32bit)
min: 9719 avg: 9994 median: 9977.5 (60%) max: 10300 Points
CPU TDP 45 W TDP 65 W TDP 90 W TDP 115 W 94% 100% 99% 95%
min: 11745 avg: 11886 median: 11886 (72%) max: 12027 Points
CPU TDP ? TDP 45 W TDP 65 W TDP 90 W TDP 115 W 100% 81% 86% 91% 81%
CPU TDP ? TDP 45 W TDP 65 W TDP 90 W TDP 115 W 100% 79% 84% 89% 79%
Cinebench R10 - Cinebench R10 Rend. Multi (32bit)
min: 59935 avg: 63422 median: 63273.5 (46%) max: 67204 Points
CPU TDP 45 W TDP 65 W TDP 90 W TDP 115 W 92% 89% 96% 100%
min: 91081 avg: 91124 median: 91123.5 (66%) max: 91166 Points
CPU TDP ? TDP 45 W TDP 65 W TDP 90 W TDP 115 W 100% 68% 66% 86% 74%
CPU TDP ? TDP 45 W TDP 65 W TDP 90 W TDP 115 W 100% 67% 64% 84% 72%
Cinebench R10 - Cinebench R10 Rend. Multi (64bit)
min: 88902 avg: 90904 median: 91265.5 (58%) max: 92183 Points
CPU TDP 45 W TDP 65 W TDP 90 W TDP 115 W 99% 96% 99% 100%
min: 124651 avg: 130357 median: 130356 (83%) max: 136062 Points
CPU TDP ? TDP 45 W TDP 65 W TDP 90 W TDP 115 W 100% 67% 65% 79% 68%
CPU TDP ? TDP 45 W TDP 65 W TDP 90 W TDP 115 W 100% 65% 63% 77% 66%
Cinebench R10 - Cinebench R10 Rend. Single (64bit)
min: 13892 avg: 14147 median: 14161 (17%) max: 14374 Points
CPU TDP 45 W TDP 65 W TDP 90 W TDP 115 W 97% 100% 100% 97%
min: 17400 avg: 17429 median: 17429 (21%) max: 17458 Points
CPU TDP ? TDP 45 W TDP 65 W TDP 90 W TDP 115 W 100% 80% 82% 91% 80%
CPU TDP ? TDP 45 W TDP 65 W TDP 90 W TDP 115 W 100% 78% 80% 88% 77%
wPrime 2.10 - wPrime 2.0 1024m *
min: 87.408 avg: 215.6 median: 165.1 (2%) max: 441.275 s
CPU TDP 20 W TDP 45 W TDP 65 W TDP 90 W TDP 115 W 102% 103% 100% 104% 104%
min: 50.891 avg: 80.3 median: 80.3 (1%) max: 109.801 s
CPU TDP ? TDP 20 W TDP 45 W TDP 65 W TDP 90 W TDP 115 W 104% 102% 103% 100% 105% 104%
CPU TDP ? TDP 20 W TDP 45 W TDP 65 W TDP 90 W TDP 115 W 104% 102% 103% 100% 105% 104%
wPrime 2.10 - wPrime 2.0 32m *
min: 3.254 avg: 4.3 median: 3.4 (1%) max: 8.1 s
CPU TDP 20 W TDP 45 W TDP 65 W TDP 90 W TDP 115 W 100% 101% 101% 101% 101%
min: 2.147 avg: 2.2 median: 2.2 (0%) max: 2.252 s
CPU TDP ? TDP 20 W TDP 45 W TDP 65 W TDP 90 W TDP 115 W 101% 100% 101% 101% 101% 101%
CPU TDP ? TDP 20 W TDP 45 W TDP 65 W TDP 90 W TDP 115 W 101% 100% 101% 101% 101% 101%
WinRAR - WinRAR 4.0
min: 6724 avg: 9769 median: 7940 (13%) max: 17856 Points
CPU TDP 20 W TDP 45 W TDP 65 W TDP 90 W TDP 115 W 100% 48% 44% 38% 43%
min: 12800 avg: 12813 median: 12812.5 (20%) max: 12825 Points
CPU TDP ? TDP 20 W TDP 45 W TDP 65 W TDP 90 W TDP 115 W 72% 100% 48% 44% 55% 43%
CPU TDP ? TDP 20 W TDP 45 W TDP 65 W TDP 90 W TDP 115 W 81% 100% 48% 44% 55% 43%
7-Zip 18.03 - 7-Zip 18.03 Multi Thread 4 runs
min: 52522 avg: 70203 median: 71934 (41%) max: 76331 MIPS
CPU TDP ? TDP 20 W TDP 45 W TDP 55 W TDP 58 W TDP 65 W TDP 70 W TDP 73 W TDP 80 W TDP 83 W TDP 90 W TDP 100 W TDP 105 W TDP 115 W 95% 69% 84% 89% 97% 96% 81% 97% 100% 99% 95% 93% 88% 91%
min: 117224 avg: 126436 median: 126436 (73%) max: 135648 MIPS
CPU TDP ? TDP 20 W TDP 45 W TDP 55 W TDP 58 W TDP 65 W TDP 70 W TDP 73 W TDP 80 W TDP 83 W TDP 90 W TDP 100 W TDP 105 W TDP 115 W 100% 50% 62% 65% 71% 70% 59% 71% 73% 72% 84% 68% 65% 67%
min: 145144 avg: 146282 median: 145207 (83%) max: 149570 MIPS
CPU TDP ? TDP 20 W TDP 45 W TDP 55 W TDP 58 W TDP 65 W TDP 70 W TDP 73 W TDP 80 W TDP 83 W TDP 90 W TDP 100 W TDP 105 W TDP 115 W TDP 253 W 82% 36% 44% 47% 51% 50% 43% 51% 53% 52% 60% 49% 46% 48% 100%
7-Zip 18.03 - 7-Zip 18.03 Single Thread 4 runs
min: 4502 avg: 5480 median: 5560 (66%) max: 5781 MIPS
CPU TDP ? TDP 20 W TDP 45 W TDP 55 W TDP 58 W TDP 65 W TDP 70 W TDP 73 W TDP 80 W TDP 83 W TDP 90 W TDP 100 W TDP 105 W TDP 115 W 98% 97% 98% 95% 95% 97% 86% 86% 100% 95% 94% 94% 78% 99%
min: 7040 avg: 7196 median: 7195.5 (85%) max: 7351 MIPS
CPU TDP ? TDP 20 W TDP 45 W TDP 55 W TDP 58 W TDP 65 W TDP 70 W TDP 73 W TDP 80 W TDP 83 W TDP 90 W TDP 100 W TDP 105 W TDP 115 W 100% 86% 87% 84% 84% 87% 77% 77% 89% 84% 92% 84% 69% 88%
min: 7772 avg: 7893 median: 7932 (93%) max: 7934 MIPS
CPU TDP ? TDP 20 W TDP 45 W TDP 55 W TDP 58 W TDP 65 W TDP 70 W TDP 73 W TDP 80 W TDP 83 W TDP 90 W TDP 100 W TDP 105 W TDP 115 W TDP 253 W 87% 71% 71% 69% 69% 71% 63% 63% 73% 69% 75% 69% 57% 72% 100%
X264 HD Benchmark 4.0 - x264 Pass 2
min: 153.6 avg: 159.7 median: 159.9 (53%) max: 165.6 fps
CPU TDP 45 W TDP 65 W TDP 90 W TDP 115 W 98% 96% 100% 93%
min: 225.5 avg: 243.3 median: 243.3 (81%) max: 261 fps
CPU TDP ? TDP 45 W TDP 65 W TDP 90 W TDP 115 W 100% 62% 61% 75% 59%
min: 75.9 avg: 181.2 median: 181.2 (61%) max: 286.5 fps
CPU TDP ? TDP 45 W TDP 65 W TDP 90 W TDP 115 W TDP 253 W 100% 59% 58% 71% 56% 28%
X264 HD Benchmark 4.0 - x264 Pass 1
min: 300.5 avg: 322.4 median: 326.3 (75%) max: 336.5 fps
CPU TDP 45 W TDP 65 W TDP 90 W TDP 115 W 100% 100% 89% 94%
min: 393.5 avg: 406.3 median: 406.3 (94%) max: 419 fps
CPU TDP ? TDP 45 W TDP 65 W TDP 90 W TDP 115 W 100% 80% 80% 83% 76%
min: 257.5 avg: 345.5 median: 345.5 (80%) max: 433.5 fps
CPU TDP ? TDP 45 W TDP 65 W TDP 90 W TDP 115 W TDP 253 W 100% 79% 79% 81% 74% 60%
HWBOT x265 Benchmark v2.2 - HWBOT x265 4k Preset
min: 14.1 avg: 20.1 median: 20.6 (36%) max: 22.7 fps
CPU TDP ? TDP 20 W TDP 45 W TDP 55 W TDP 58 W TDP 65 W TDP 70 W TDP 73 W TDP 80 W TDP 83 W TDP 90 W TDP 100 W TDP 105 W TDP 115 W 94% 62% 79% 76% 90% 93% 80% 97% 100% 98% 92% 91% 91% 87%
min: 32.3 avg: 34.6 median: 34.6 (61%) max: 36.8 fps
CPU TDP ? TDP 20 W TDP 45 W TDP 55 W TDP 58 W TDP 65 W TDP 70 W TDP 73 W TDP 80 W TDP 83 W TDP 90 W TDP 100 W TDP 105 W TDP 115 W 100% 49% 62% 59% 71% 73% 62% 76% 78% 77% 85% 71% 71% 68%
min: 40.8 avg: 41.4 median: 41.1 (72%) max: 42.8 fps
CPU TDP ? TDP 20 W TDP 45 W TDP 55 W TDP 58 W TDP 65 W TDP 70 W TDP 73 W TDP 80 W TDP 83 W TDP 90 W TDP 100 W TDP 105 W TDP 115 W TDP 253 W 82% 34% 44% 42% 50% 52% 44% 54% 55% 54% 60% 50% 51% 48% 100%
TrueCrypt - TrueCrypt Serpent
min: 0.96 avg: 1.1 median: 1.1 (32%) max: 1.3 GB/s
CPU TDP 20 W TDP 45 W TDP 65 W TDP 90 W TDP 115 W 74% 85% 85% 85% 100%
min: 2.2 avg: 2.4 median: 2.4 (71%) max: 2.6 GB/s
CPU TDP ? TDP 20 W TDP 45 W TDP 65 W TDP 90 W TDP 115 W 100% 37% 42% 42% 63% 50%
CPU TDP ? TDP 20 W TDP 45 W TDP 65 W TDP 90 W TDP 115 W 100% 36% 41% 41% 61% 48%
TrueCrypt - TrueCrypt Twofish
min: 1.4 avg: 1.8 median: 1.8 (31%) max: 2.3 GB/s
CPU TDP 20 W TDP 45 W TDP 65 W TDP 90 W TDP 115 W 61% 83% 78% 78% 100%
min: 4.4 avg: 4.5 median: 4.5 (78%) max: 4.6 GB/s
CPU TDP ? TDP 20 W TDP 45 W TDP 65 W TDP 90 W TDP 115 W 100% 30% 41% 39% 67% 50%
CPU TDP ? TDP 20 W TDP 45 W TDP 65 W TDP 90 W TDP 115 W 100% 27% 37% 35% 60% 44%
TrueCrypt - TrueCrypt AES
min: 7.9 avg: 10.8 median: 11.3 (29%) max: 12.1 GB/s
CPU TDP 20 W TDP 45 W TDP 65 W TDP 90 W TDP 115 W 65% 91% 93% 96% 100%
min: 18 avg: 21.8 median: 21.8 (57%) max: 25.6 GB/s
CPU TDP ? TDP 20 W TDP 45 W TDP 65 W TDP 90 W TDP 115 W 100% 31% 43% 44% 58% 47%
CPU TDP ? TDP 20 W TDP 45 W TDP 65 W TDP 90 W TDP 115 W 100% 30% 42% 43% 57% 46%
Blender - Blender 3.3 Classroom CPU *
min: 280 avg: 331.7 median: 309 (4%) max: 538 Seconds
CPU TDP ? TDP 20 W TDP 45 W TDP 55 W TDP 58 W TDP 65 W TDP 70 W TDP 73 W TDP 80 W TDP 83 W TDP 90 W TDP 100 W TDP 105 W TDP 115 W 103% 100% 102% 103% 103% 103% 102% 102% 103% 103% 103% 103% 103% 103%
min: 155 avg: 181.5 median: 181.5 (2%) max: 208 Seconds
CPU TDP ? TDP 20 W TDP 45 W TDP 55 W TDP 58 W TDP 65 W TDP 70 W TDP 73 W TDP 80 W TDP 83 W TDP 90 W TDP 100 W TDP 105 W TDP 115 W 104% 100% 102% 103% 103% 103% 102% 102% 103% 103% 104% 103% 103% 103%
min: 135 avg: 143 median: 144.5 (2%) max: 147 Seconds
CPU TDP ? TDP 20 W TDP 45 W TDP 55 W TDP 58 W TDP 65 W TDP 70 W TDP 73 W TDP 80 W TDP 83 W TDP 90 W TDP 100 W TDP 105 W TDP 115 W TDP 253 W 105% 100% 102% 103% 103% 103% 102% 102% 103% 103% 104% 103% 103% 103% 105%
Blender - Blender 2.79 BMW27 CPU *
min: 163 avg: 188.6 median: 177 (1%) max: 285 Seconds
CPU TDP ? TDP 20 W TDP 45 W TDP 55 W TDP 58 W TDP 65 W TDP 70 W TDP 73 W TDP 80 W TDP 83 W TDP 90 W TDP 100 W TDP 105 W TDP 115 W 101% 100% 101% 101% 101% 101% 101% 101% 101% 101% 101% 101% 101% 101%
min: 91 avg: 100 median: 100 (1%) max: 109 Seconds
CPU TDP ? TDP 20 W TDP 45 W TDP 55 W TDP 58 W TDP 65 W TDP 70 W TDP 73 W TDP 80 W TDP 83 W TDP 90 W TDP 100 W TDP 105 W TDP 115 W 101% 100% 101% 101% 101% 101% 101% 101% 101% 101% 101% 101% 101% 101%
min: 80 avg: 84.6 median: 85 (1%) max: 87 Seconds
CPU TDP ? TDP 20 W TDP 45 W TDP 55 W TDP 58 W TDP 65 W TDP 70 W TDP 73 W TDP 80 W TDP 83 W TDP 90 W TDP 100 W TDP 105 W TDP 115 W TDP 253 W 101% 100% 101% 101% 101% 101% 101% 101% 101% 101% 101% 101% 101% 101% 101%
R Benchmark 2.5 - R Benchmark 2.5 *
min: 0.4313 avg: 0.5 median: 0.5 (10%) max: 0.503 sec
CPU TDP ? TDP 20 W TDP 45 W TDP 55 W TDP 58 W TDP 65 W TDP 70 W TDP 73 W TDP 80 W TDP 83 W TDP 90 W TDP 100 W TDP 105 W TDP 115 W 104% 104% 104% 103% 104% 104% 100% 104% 104% 104% 104% 104% 103% 104%
min: 0.3788 avg: 0.4 median: 0.4 (8%) max: 0.3826 sec
CPU TDP ? TDP 20 W TDP 45 W TDP 55 W TDP 58 W TDP 65 W TDP 70 W TDP 73 W TDP 80 W TDP 83 W TDP 90 W TDP 100 W TDP 105 W TDP 115 W 105% 104% 104% 103% 104% 104% 100% 104% 104% 104% 105% 104% 103% 104%
min: 0.3425 avg: 0.3 median: 0.3 (7%) max: 0.3504 sec
CPU TDP ? TDP 20 W TDP 45 W TDP 55 W TDP 58 W TDP 65 W TDP 70 W TDP 73 W TDP 80 W TDP 83 W TDP 90 W TDP 100 W TDP 105 W TDP 115 W TDP 253 W 105% 104% 104% 103% 104% 104% 100% 104% 104% 104% 105% 104% 103% 104% 106%
3DMark 06 - CPU - 3DMark 06 - CPU
min: 9854 avg: 13153 median: 13074 (28%) max: 15529 Points
CPU TDP ? TDP 45 W TDP 65 W TDP 90 W TDP 115 W 85% 87% 75% 100% 82%
min: 11741 avg: 16203 median: 16203 (34%) max: 20665 Points
CPU TDP ? TDP 45 W TDP 65 W TDP 90 W TDP 115 W 100% 86% 73% 91% 80%
min: 20532 avg: 22354 median: 22657.5 (48%) max: 22928 Points
CPU TDP ? TDP 45 W TDP 65 W TDP 90 W TDP 115 W TDP 253 W 75% 59% 51% 63% 56% 100%
Super Pi mod 1.5 XS 1M - Super Pi mod 1.5 XS 1M *
min: 6.6 avg: 6.8 median: 6.8 (1%) max: 7.256 s
CPU TDP 20 W TDP 45 W TDP 65 W TDP 90 W TDP 115 W 100% 100% 100% 100% 100%
min: 5.953 avg: 6 median: 6 (1%) max: 5.98 s
CPU TDP ? TDP 20 W TDP 45 W TDP 65 W TDP 90 W TDP 115 W 100% 100% 100% 100% 100% 100%
CPU TDP ? TDP 20 W TDP 45 W TDP 65 W TDP 90 W TDP 115 W 100% 100% 100% 100% 100% 100%
Super Pi mod 1.5 XS 2M - Super Pi mod 1.5 XS 2M *
min: 14.786 avg: 14.9 median: 14.9 (1%) max: 15.15 s
CPU TDP 45 W TDP 65 W TDP 90 W TDP 115 W 100% 100% 100% 100%
min: 12.844 avg: 12.9 median: 12.9 (1%) max: 12.894 s
CPU TDP ? TDP 45 W TDP 65 W TDP 90 W TDP 115 W 100% 100% 100% 100% 100%
CPU TDP ? TDP 45 W TDP 65 W TDP 90 W TDP 115 W 100% 100% 100% 100% 100%
Super Pi Mod 1.5 XS 32M - Super Pi mod 1.5 XS 32M *
min: 304.446 avg: 358 median: 366.9 (2%) max: 402.742 s
CPU TDP 45 W TDP 65 W TDP 90 W 100% 100% 100%
min: 305.942 avg: 311 median: 311 (1%) max: 316.148 s
CPU TDP ? TDP 45 W TDP 65 W TDP 90 W 100% 100% 100% 100%
CPU TDP ? TDP 45 W TDP 65 W TDP 90 W 100% 100% 100% 100%
3DMark Vantage - 3DM Vant. Perf. CPU no Physx
min: 73186 avg: 76512 median: 75742.5 (58%) max: 80494 Points
CPU TDP ? TDP 45 W TDP 65 W TDP 90 W TDP 115 W 94% 92% 100% 99% 91%
CPU TDP ? TDP 45 W TDP 65 W TDP 90 W TDP 115 W 86% 84% 91% 100% 83%
min: 11403 avg: 101267 median: 111512 (86%) max: 114209 Points
CPU TDP ? TDP 45 W TDP 65 W TDP 90 W TDP 115 W TDP 253 W 80% 73% 79% 86% 72% 100%
3DMark 11 - 3DM11 Performance Physics
min: 12693 avg: 21337 median: 22169.5 (55%) max: 24629 Points
CPU TDP ? TDP 20 W TDP 45 W TDP 55 W TDP 58 W TDP 65 W TDP 73 W TDP 80 W TDP 83 W TDP 90 W TDP 100 W TDP 105 W TDP 115 W 89% 52% 73% 80% 92% 92% 98% 100% 98% 84% 81% 90% 92%
min: 28739 avg: 30538 median: 30537.5 (75%) max: 32336 Points
CPU TDP ? TDP 20 W TDP 45 W TDP 55 W TDP 58 W TDP 65 W TDP 73 W TDP 80 W TDP 83 W TDP 90 W TDP 100 W TDP 105 W TDP 115 W 99% 52% 73% 80% 92% 92% 98% 100% 98% 95% 81% 90% 92%
min: 28497 avg: 31204 median: 31391 (77%) max: 32853 Points
CPU TDP ? TDP 20 W TDP 45 W TDP 55 W TDP 58 W TDP 65 W TDP 73 W TDP 80 W TDP 83 W TDP 90 W TDP 100 W TDP 105 W TDP 115 W TDP 253 W 84% 41% 58% 64% 73% 73% 77% 79% 77% 75% 64% 71% 73% 100%
3DMark - 3DMark Ice Storm Physics
min: 74638 avg: 81658 median: 76996.5 (63%) max: 100241 Points
CPU TDP ? TDP 45 W TDP 65 W TDP 90 W TDP 115 W 80% 74% 76% 100% 88%
CPU TDP ? TDP 45 W TDP 65 W TDP 90 W TDP 115 W 88% 82% 84% 100% 97%
min: 89084 avg: 104553 median: 105332 (86%) max: 111347 Points
CPU TDP ? TDP 45 W TDP 65 W TDP 90 W TDP 115 W TDP 253 W 86% 72% 73% 87% 85% 100%
3DMark - 3DMark Ice Storm Extreme Physics
min: 73618 avg: 82055 median: 75494 (61%) max: 100192 Points
CPU TDP ? TDP 45 W TDP 65 W TDP 90 W TDP 115 W 80% 74% 75% 100% 89%
CPU TDP ? TDP 45 W TDP 65 W TDP 90 W TDP 115 W 88% 82% 83% 100% 98%
min: 88682 avg: 104672 median: 105402 (86%) max: 110989 Points
CPU TDP ? TDP 45 W TDP 65 W TDP 90 W TDP 115 W TDP 253 W 87% 71% 72% 87% 85% 100%
3DMark - 3DMark Ice Storm Unlimited Physics
min: 78677 avg: 89559 median: 91059 (76%) max: 102469 Points
CPU TDP ? TDP 45 W TDP 65 W TDP 90 W TDP 115 W 82% 89% 83% 100% 92%
CPU TDP ? TDP 45 W TDP 65 W TDP 90 W TDP 115 W 89% 97% 90% 99% 100%
min: 90865 avg: 104818 median: 105098 (87%) max: 110670 Points
CPU TDP ? TDP 45 W TDP 65 W TDP 90 W TDP 115 W TDP 253 W 89% 88% 81% 90% 91% 100%
3DMark - 3DMark Cloud Gate Physics
min: 14341 avg: 18938 median: 18896 (48%) max: 21425 Points
CPU TDP ? TDP 45 W TDP 55 W TDP 58 W TDP 65 W TDP 90 W TDP 115 W 94% 79% 86% 69% 97% 100% 96%
CPU TDP ? TDP 45 W TDP 55 W TDP 58 W TDP 65 W TDP 90 W TDP 115 W 88% 74% 81% 65% 91% 100% 90%
min: 27678 avg: 28978 median: 29112 (74%) max: 30462 Points
CPU TDP ? TDP 45 W TDP 55 W TDP 58 W TDP 65 W TDP 90 W TDP 115 W TDP 253 W 79% 57% 62% 50% 69% 76% 69% 100%
3DMark - 3DMark Fire Strike Standard Physics
min: 21106 avg: 28071 median: 28964.5 (52%) max: 30623 Points
CPU TDP ? TDP 20 W TDP 45 W TDP 55 W TDP 58 W TDP 65 W TDP 70 W TDP 73 W TDP 80 W TDP 83 W TDP 90 W TDP 100 W TDP 105 W TDP 115 W 95% 69% 79% 87% 96% 93% 82% 99% 96% 100% 95% 89% 95% 99%
min: 40312 avg: 44727 median: 44727 (80%) max: 49142 Points
CPU TDP ? TDP 20 W TDP 45 W TDP 55 W TDP 58 W TDP 65 W TDP 70 W TDP 73 W TDP 80 W TDP 83 W TDP 90 W TDP 100 W TDP 105 W TDP 115 W 100% 62% 71% 78% 86% 84% 73% 89% 86% 90% 96% 80% 85% 89%
min: 48193 avg: 52120 median: 52422.5 (93%) max: 56087 Points
CPU TDP ? TDP 20 W TDP 45 W TDP 55 W TDP 58 W TDP 65 W TDP 70 W TDP 73 W TDP 80 W TDP 83 W TDP 90 W TDP 100 W TDP 105 W TDP 115 W TDP 253 W 87% 40% 45% 50% 55% 54% 47% 57% 55% 57% 61% 51% 55% 57% 100%
3DMark - 3DMark Time Spy CPU
min: 6307 avg: 10957 median: 11454.5 (48%) max: 12209 Points
CPU TDP ? TDP 20 W TDP 45 W TDP 55 W TDP 58 W TDP 65 W TDP 70 W TDP 73 W TDP 80 W TDP 83 W TDP 90 W TDP 100 W TDP 105 W TDP 115 W 92% 52% 78% 86% 98% 96% 78% 99% 96% 100% 89% 82% 97% 94%
min: 15951 avg: 18746 median: 18746 (79%) max: 21541 Points
CPU TDP ? TDP 20 W TDP 45 W TDP 55 W TDP 58 W TDP 65 W TDP 70 W TDP 73 W TDP 80 W TDP 83 W TDP 90 W TDP 100 W TDP 105 W TDP 115 W 100% 46% 69% 76% 87% 85% 69% 87% 85% 88% 91% 72% 86% 83%
min: 19418 avg: 22303 median: 22575 (95%) max: 23721 Points
CPU TDP ? TDP 20 W TDP 45 W TDP 55 W TDP 58 W TDP 65 W TDP 70 W TDP 73 W TDP 80 W TDP 83 W TDP 90 W TDP 100 W TDP 105 W TDP 115 W TDP 253 W 93% 28% 43% 47% 54% 53% 43% 54% 53% 55% 57% 45% 54% 52% 100%
Geekbench 6.4 - Geekbench 6.4 Single-Core
min: 2199 avg: 2483 median: 2495 (62%) max: 2573 Points
CPU TDP ? TDP 20 W TDP 45 W TDP 55 W TDP 58 W TDP 65 W TDP 70 W TDP 73 W TDP 80 W TDP 83 W TDP 90 W TDP 100 W TDP 105 W TDP 115 W 99% 97% 97% 93% 97% 97% 77% 98% 100% 97% 97% 100% 85% 96%
min: 2902 avg: 2922 median: 2922 (73%) max: 2942 Points
CPU TDP ? TDP 20 W TDP 45 W TDP 55 W TDP 58 W TDP 65 W TDP 70 W TDP 73 W TDP 80 W TDP 83 W TDP 90 W TDP 100 W TDP 105 W TDP 115 W 100% 91% 92% 87% 91% 91% 72% 93% 94% 92% 97% 94% 81% 90%
min: 3108 avg: 3214 median: 3243 (81%) max: 3294 Points
CPU TDP ? TDP 20 W TDP 45 W TDP 55 W TDP 58 W TDP 65 W TDP 70 W TDP 73 W TDP 80 W TDP 83 W TDP 90 W TDP 100 W TDP 105 W TDP 115 W TDP 253 W 90% 77% 78% 74% 78% 77% 62% 79% 80% 78% 82% 80% 68% 77% 100%
Geekbench 6.4 - Geekbench 6.4 Multi-Core
min: 12825 avg: 13823 median: 13974 (54%) max: 14540 Points
CPU TDP ? TDP 20 W TDP 45 W TDP 55 W TDP 58 W TDP 65 W TDP 70 W TDP 73 W TDP 80 W TDP 83 W TDP 90 W TDP 100 W TDP 105 W TDP 115 W 100% 92% 95% 96% 96% 94% 81% 97% 96% 97% 94% 98% 88% 95%
min: 18504 avg: 19147 median: 19147 (74%) max: 19790 Points
CPU TDP ? TDP 20 W TDP 45 W TDP 55 W TDP 58 W TDP 65 W TDP 70 W TDP 73 W TDP 80 W TDP 83 W TDP 90 W TDP 100 W TDP 105 W TDP 115 W 100% 78% 81% 81% 82% 80% 68% 82% 82% 82% 89% 83% 75% 81%
min: 20435 avg: 21326 median: 21397 (83%) max: 21790 Points
CPU TDP ? TDP 20 W TDP 45 W TDP 55 W TDP 58 W TDP 65 W TDP 70 W TDP 73 W TDP 80 W TDP 83 W TDP 90 W TDP 100 W TDP 105 W TDP 115 W TDP 253 W 88% 63% 65% 66% 66% 64% 55% 67% 66% 66% 72% 67% 60% 65% 100%
Geekbench 6.0 - Geekbench 6.0 Single-Core
min: 2410 avg: 2931 median: 3105 (99%) max: 3105 Points
CPU TDP 45 W TDP 65 W TDP 90 W TDP 115 W 100% 78% 100% 100%
CPU TDP 45 W TDP 65 W TDP 90 W TDP 115 W 100% 78% 100% 100%
min: 2985 avg: 3078 median: 3104 (99%) max: 3150 Points
CPU TDP ? TDP 45 W TDP 65 W TDP 90 W TDP 115 W TDP 253 W 100% 100% 78% 100% 100% 99%
Geekbench 6.0 - Geekbench 6.0 Multi-Core
min: 12735 avg: 18936 median: 21003 (86%) max: 21003 Points
CPU TDP 45 W TDP 65 W TDP 90 W TDP 115 W 100% 61% 100% 100%
CPU TDP 45 W TDP 65 W TDP 90 W TDP 115 W 100% 61% 100% 100%
min: 19463 avg: 20452 median: 20693 (85%) max: 20754 Points
CPU TDP ? TDP 45 W TDP 65 W TDP 90 W TDP 115 W TDP 253 W 99% 100% 61% 100% 100% 97%
Geekbench 5.5 - Geekbench 5.1 - 5.5 64 Bit Single-Core
min: 1700 avg: 1828 median: 1852 (72%) max: 1902 Points
CPU TDP ? TDP 20 W TDP 45 W TDP 55 W TDP 58 W TDP 65 W TDP 70 W TDP 73 W TDP 80 W TDP 83 W TDP 90 W TDP 100 W TDP 105 W TDP 115 W 97% 95% 97% 92% 97% 96% 72% 98% 100% 98% 98% 98% 89% 92%
min: 2092 avg: 2107 median: 2106.5 (82%) max: 2121 Points
CPU TDP ? TDP 20 W TDP 45 W TDP 55 W TDP 58 W TDP 65 W TDP 70 W TDP 73 W TDP 80 W TDP 83 W TDP 90 W TDP 100 W TDP 105 W TDP 115 W 100% 91% 93% 89% 93% 92% 69% 94% 96% 94% 98% 94% 86% 88%
min: 2243 avg: 2347 median: 2369 (93%) max: 2370 Points
CPU TDP ? TDP 20 W TDP 45 W TDP 55 W TDP 58 W TDP 65 W TDP 70 W TDP 73 W TDP 80 W TDP 83 W TDP 90 W TDP 100 W TDP 105 W TDP 115 W TDP 253 W 88% 77% 78% 75% 78% 77% 58% 79% 81% 79% 82% 79% 72% 74% 100%
Geekbench 5.5 - Geekbench 5.1 - 5.5 64 Bit Multi-Core
min: 10441 avg: 13368 median: 13566 (24%) max: 14230 Points
CPU TDP ? TDP 20 W TDP 45 W TDP 55 W TDP 58 W TDP 65 W TDP 70 W TDP 73 W TDP 80 W TDP 83 W TDP 90 W TDP 100 W TDP 105 W TDP 115 W 99% 73% 93% 90% 97% 96% 81% 100% 98% 97% 95% 93% 90% 95%
min: 19971 avg: 21565 median: 21565 (39%) max: 23159 Points
CPU TDP ? TDP 20 W TDP 45 W TDP 55 W TDP 58 W TDP 65 W TDP 70 W TDP 73 W TDP 80 W TDP 83 W TDP 90 W TDP 100 W TDP 105 W TDP 115 W 100% 56% 71% 69% 74% 73% 62% 76% 75% 74% 84% 71% 68% 73%
min: 24552 avg: 25148 median: 25199 (45%) max: 25867 Points
CPU TDP ? TDP 20 W TDP 45 W TDP 55 W TDP 58 W TDP 65 W TDP 70 W TDP 73 W TDP 80 W TDP 83 W TDP 90 W TDP 100 W TDP 105 W TDP 115 W TDP 253 W 84% 42% 53% 51% 55% 54% 46% 57% 56% 55% 62% 53% 51% 54% 100%
Geekbench 5.0 - Geekbench 5.0 64 Bit Single-Core
min: 1695 avg: 1788 median: 1799 (8%) max: 1830 Points
CPU TDP 45 W TDP 65 W TDP 83 W TDP 90 W TDP 115 W 98% 100% 100% 98% 93%
min: 2039 avg: 2042 median: 2042 (9%) max: 2045 Points
CPU TDP ? TDP 45 W TDP 65 W TDP 83 W TDP 90 W TDP 115 W 100% 88% 89% 89% 94% 83%
min: 2177 avg: 2237 median: 2247 (10%) max: 2280 Points
CPU TDP ? TDP 45 W TDP 65 W TDP 83 W TDP 90 W TDP 115 W TDP 253 W 97% 81% 82% 82% 86% 76% 100%
Geekbench 5.0 - Geekbench 5.0 64 Bit Multi-Core
min: 13228 avg: 13612 median: 13736 (43%) max: 13972 Points
CPU TDP 45 W TDP 65 W TDP 83 W TDP 90 W TDP 115 W 99% 95% 100% 95% 98%
min: 19766 avg: 21261 median: 21261 (67%) max: 22756 Points
CPU TDP ? TDP 45 W TDP 65 W TDP 83 W TDP 90 W TDP 115 W 100% 61% 58% 61% 73% 60%
min: 23151 avg: 24582 median: 24467 (77%) max: 25496 Points
CPU TDP ? TDP 45 W TDP 65 W TDP 83 W TDP 90 W TDP 115 W TDP 253 W 99% 56% 54% 57% 68% 56% 100%
Geekbench 4.4 - Geekbench 4.1 - 4.4 64 Bit Single-Core
min: 7040 avg: 7372 median: 7422 (74%) max: 7602 Points
CPU TDP 45 W TDP 65 W TDP 90 W TDP 115 W 99% 100% 96% 93%
min: 8874 avg: 9089 median: 9089 (91%) max: 9304 Points
CPU TDP ? TDP 45 W TDP 65 W TDP 90 W TDP 115 W 100% 81% 82% 87% 76%
min: 9620 avg: 9873 median: 9872.5 (99%) max: 10009 Points
CPU TDP ? TDP 45 W TDP 65 W TDP 90 W TDP 115 W TDP 253 W 97% 76% 77% 82% 71% 100%
Geekbench 4.4 - Geekbench 4.1 - 4.4 64 Bit Multi-Core
min: 47960 avg: 49362 median: 49781.5 (50%) max: 49924 Points
CPU TDP 45 W TDP 65 W TDP 90 W TDP 115 W 100% 96% 100% 100%
min: 72062 avg: 75782 median: 75781.5 (76%) max: 79501 Points
CPU TDP ? TDP 45 W TDP 65 W TDP 90 W TDP 115 W 100% 63% 60% 77% 63%
min: 82660 avg: 87853 median: 88108.5 (88%) max: 91119 Points
CPU TDP ? TDP 45 W TDP 65 W TDP 90 W TDP 115 W TDP 253 W 96% 57% 55% 69% 57% 100%
Mozilla Kraken 1.1 - Kraken 1.1 Total Score *
min: 494 avg: 524 median: 522 (1%) max: 594 ms
CPU TDP ? TDP 20 W TDP 45 W TDP 55 W TDP 58 W TDP 65 W TDP 73 W TDP 80 W TDP 83 W TDP 90 W TDP 105 W TDP 115 W 100% 100% 100% 100% 100% 100% 100% 100% 100% 100% 100% 100%
min: 439 avg: 439.5 median: 439.5 (1%) max: 440 ms
CPU TDP ? TDP 20 W TDP 45 W TDP 55 W TDP 58 W TDP 65 W TDP 73 W TDP 80 W TDP 83 W TDP 90 W TDP 105 W TDP 115 W 100% 100% 100% 100% 100% 100% 100% 100% 100% 100% 100% 100%
min: 413 avg: 415 median: 414 (0%) max: 418 ms
CPU TDP ? TDP 20 W TDP 45 W TDP 55 W TDP 58 W TDP 65 W TDP 73 W TDP 80 W TDP 83 W TDP 90 W TDP 105 W TDP 115 W TDP 253 W 100% 100% 100% 100% 100% 100% 100% 100% 100% 100% 100% 100% 100%
Octane V2 - Octane V2 Total Score
min: 90543 avg: 95362 median: 96090 (73%) max: 98144 Points
CPU TDP ? TDP 20 W TDP 45 W TDP 80 W TDP 90 W 100% 92% 96% 100% 98%
WebXPRT 4 - WebXPRT 4 Score
min: 237 avg: 258.7 median: 260 (71%) max: 271 Points
CPU TDP ? TDP 20 W TDP 45 W TDP 55 W TDP 58 W TDP 65 W TDP 73 W TDP 80 W TDP 83 W TDP 90 W TDP 105 W TDP 115 W 100% 96% 98% 100% 97% 95% 100% 100% 100% 94% 88% 92%
min: 303 avg: 308.5 median: 308.5 (85%) max: 314 Points
CPU TDP ? TDP 20 W TDP 45 W TDP 55 W TDP 58 W TDP 65 W TDP 73 W TDP 80 W TDP 83 W TDP 90 W TDP 105 W TDP 115 W 100% 88% 90% 92% 90% 87% 92% 92% 92% 93% 81% 85%
min: 332 avg: 334.7 median: 334 (92%) max: 338 Points
CPU TDP ? TDP 20 W TDP 45 W TDP 55 W TDP 58 W TDP 65 W TDP 73 W TDP 80 W TDP 83 W TDP 90 W TDP 105 W TDP 115 W TDP 253 W 87% 77% 79% 80% 78% 76% 80% 80% 80% 81% 71% 74% 100%
WebXPRT 3 - WebXPRT 3 Score
min: 237 avg: 279.4 median: 286 (51%) max: 301 Points
CPU TDP ? TDP 20 W TDP 45 W TDP 55 W TDP 58 W TDP 65 W TDP 73 W TDP 80 W TDP 83 W TDP 90 W TDP 105 W TDP 115 W 95% 99% 98% 97% 100% 94% 99% 100% 99% 89% 80% 91%
min: 311 avg: 325 median: 325 (58%) max: 339 Points
CPU TDP ? TDP 20 W TDP 45 W TDP 55 W TDP 58 W TDP 65 W TDP 73 W TDP 80 W TDP 83 W TDP 90 W TDP 105 W TDP 115 W 100% 94% 93% 92% 95% 89% 95% 95% 95% 90% 76% 86%
min: 371 avg: 388.3 median: 386 (69%) max: 410 Points
CPU TDP ? TDP 20 W TDP 45 W TDP 55 W TDP 58 W TDP 65 W TDP 73 W TDP 80 W TDP 83 W TDP 90 W TDP 105 W TDP 115 W TDP 253 W 86% 75% 74% 73% 76% 71% 75% 76% 75% 72% 61% 69% 100%
CrossMark - CrossMark Overall
min: 1589 avg: 1774 median: 1770 (66%) max: 1971 Points
CPU TDP ? TDP 20 W TDP 45 W TDP 55 W TDP 58 W TDP 65 W TDP 73 W TDP 80 W TDP 83 W TDP 90 W TDP 105 W TDP 115 W 94% 89% 100% 91% 92% 90% 94% 89% 94% 93% 82% 89%
min: 2194 avg: 2241 median: 2241 (84%) max: 2288 Points
CPU TDP ? TDP 20 W TDP 45 W TDP 55 W TDP 58 W TDP 65 W TDP 73 W TDP 80 W TDP 83 W TDP 90 W TDP 105 W TDP 115 W 100% 83% 94% 85% 86% 84% 89% 84% 88% 94% 77% 83%
min: 2490 avg: 2566 median: 2584 (97%) max: 2611 Points
CPU TDP ? TDP 20 W TDP 45 W TDP 55 W TDP 58 W TDP 65 W TDP 73 W TDP 80 W TDP 83 W TDP 90 W TDP 105 W TDP 115 W TDP 253 W 88% 67% 76% 69% 69% 68% 71% 67% 71% 75% 62% 67% 100%
Power Consumption - Prime95 Power Consumption - external Monitor *
min: 44.4 avg: 113.4 median: 123.8 (21%) max: 176.1 Watt
CPU TDP ? TDP 20 W TDP 45 W TDP 58 W TDP 65 W TDP 73 W TDP 80 W TDP 83 W TDP 90 W TDP 105 W TDP 115 W 110% 133% 126% 113% 120% 112% 111% 106% 109% 100% 118%
min: 191.9 avg: 296 median: 296 (51%) max: 400 Watt
CPU TDP ? TDP 20 W TDP 45 W TDP 58 W TDP 65 W TDP 73 W TDP 80 W TDP 83 W TDP 90 W TDP 105 W TDP 115 W 100% 172% 164% 146% 155% 146% 144% 137% 136% 130% 153%
CPU TDP ? TDP 20 W TDP 45 W TDP 58 W TDP 65 W TDP 73 W TDP 80 W TDP 83 W TDP 90 W TDP 105 W TDP 115 W 100% 241% 230% 206% 218% 205% 203% 192% 190% 182% 214%
Power Consumption - Cinebench R15 Multi Power Consumption - external Monitor *
min: 88 avg: 129.5 median: 124.6 (23%) max: 171.8 Watt
CPU TDP ? TDP 45 W TDP 58 W TDP 65 W TDP 73 W TDP 80 W TDP 83 W TDP 90 W TDP 105 W TDP 115 W 107% 121% 112% 119% 100% 104% 101% 113% 105% 114%
min: 287 avg: 357.5 median: 357.5 (65%) max: 428 Watt
CPU TDP ? TDP 45 W TDP 58 W TDP 65 W TDP 73 W TDP 80 W TDP 83 W TDP 90 W TDP 105 W TDP 115 W 100% 174% 161% 171% 144% 150% 146% 132% 151% 165%
CPU TDP ? TDP 45 W TDP 58 W TDP 65 W TDP 73 W TDP 80 W TDP 83 W TDP 90 W TDP 105 W TDP 115 W 100% 261% 242% 257% 216% 225% 218% 197% 227% 247%
Power Consumption - Idle Power Consumption - external Monitor *
min: 5.1 avg: 12.4 median: 11.7 (8%) max: 21.4 Watt
CPU TDP ? TDP 20 W TDP 45 W TDP 58 W TDP 65 W TDP 73 W TDP 80 W TDP 83 W TDP 90 W TDP 105 W TDP 115 W 100% 112% 109% 105% 108% 102% 111% 109% 102% 108% 111%
min: 22.4 avg: 63.6 median: 63.6 (42%) max: 104.8 Watt
CPU TDP ? TDP 20 W TDP 45 W TDP 58 W TDP 65 W TDP 73 W TDP 80 W TDP 83 W TDP 90 W TDP 105 W TDP 115 W 100% 165% 161% 155% 159% 150% 163% 160% 149% 159% 163%
min: 64.1 avg: 83.8 median: 77.6 (51%) max: 151.2 Watt
CPU TDP ? TDP 20 W TDP 45 W TDP 58 W TDP 65 W TDP 73 W TDP 80 W TDP 83 W TDP 90 W TDP 105 W TDP 115 W TDP 253 W 105% 216% 211% 203% 209% 196% 214% 210% 196% 208% 214% 100%
Power Consumption - Idle Power Consumption 150cd 1min *
min: 5.18 avg: 13.7 median: 11.9 (13%) max: 28.8 Watt
CPU TDP ? TDP 20 W TDP 45 W TDP 58 W TDP 65 W TDP 73 W TDP 80 W TDP 83 W TDP 90 W TDP 105 W 131% 128% 124% 120% 130% 100% 124% 127% 128% 128%
Power Consumption - Power Efficiency - Cinebench R15 Multi external Monitor
min: 17.8 avg: 27.4 median: 24.2 (18%) max: 67 Points per Watt
CPU TDP ? TDP 20 W TDP 45 W TDP 58 W TDP 65 W TDP 73 W TDP 80 W TDP 83 W TDP 90 W TDP 115 W 31% 100% 44% 34% 42% 27% 29% 27% 36% 36%
min: 12.8 avg: 14.5 median: 14.5 (11%) max: 16.1 Points per Watt
CPU TDP ? TDP 20 W TDP 45 W TDP 58 W TDP 65 W TDP 73 W TDP 80 W TDP 83 W TDP 90 W TDP 115 W 25% 100% 44% 34% 42% 27% 29% 27% 30% 36%
11.5 Points per Watt (9%)
CPU TDP ? TDP 20 W TDP 45 W TDP 58 W TDP 65 W TDP 73 W TDP 80 W TDP 83 W TDP 90 W TDP 115 W 22% 100% 44% 34% 42% 27% 29% 27% 30% 36%
Average Benchmarks Intel Core Ultra 9 185H → 100% n=54 Average Benchmarks Intel Core i7-14700K → 141% n=54 Average Benchmarks Intel Core i9-14900K → 161% n=54
- Range of benchmark values for this graphics card
- Average benchmark values for this graphics card
* Smaller numbers mean a higher performance
1 This benchmark is not used for the average calculation
log 15. 15:58:11
#0 ran 0s before starting gpusingle class +0s ... 0s
#1 checking url part for id 16921 +0s ... 0s
#2 checking url part for id 16391 +0s ... 0s
#3 checking url part for id 15092 +0s ... 0s
#4 redirected to Ajax server, took 1752587891s time from redirect:0 +0s ... 0s
#5 did not recreate cache, as it is less than 5 days old! Created at Sun, 13 Jul 2025 05:20:07 +0200 +0s ... 0s
#6 composed specs +0.008s ... 0.008s
#7 did output specs +0s ... 0.008s
#8 getting avg benchmarks for device 16921 +0.004s ... 0.012s
#9 got single benchmarks 16921 +0.03s ... 0.043s
#10 getting avg benchmarks for device 16391 +0.005s ... 0.047s
#11 got single benchmarks 16391 +0.006s ... 0.053s
#12 getting avg benchmarks for device 15092 +0.003s ... 0.057s
#13 got single benchmarks 15092 +0.045s ... 0.102s
#14 got avg benchmarks for devices +0s ... 0.102s
#15 min, max, avg, median took s +0.101s ... 0.203s
#16 return log +0s ... 0.203s