Notebookcheck Logo

AMD Radeon R5 (Bristol Ridge) vs Intel HD Graphics 510 vs Intel UHD Graphics 610

AMD Radeon R5 (Bristol Ridge)

► remove from comparison AMD Radeon R5 (Bristol Ridge)

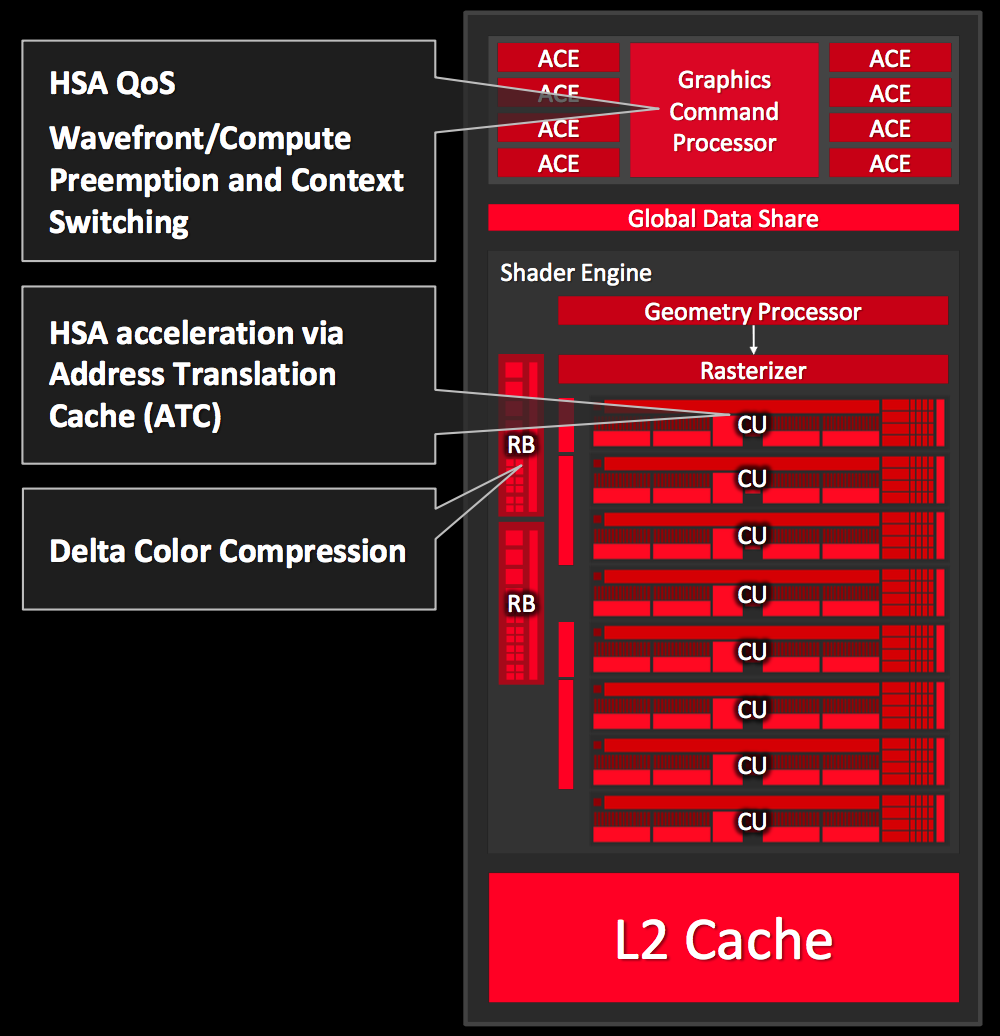
The AMD Radeon R5 (Bristol Ridge) is an integrated graphics card for a number of mid-range mobile Bristol-Ridge-based APUs, such as those from the A10 series. It features 384 shader cores clocked at 720 MHz (15 Watt APUs) or 800 MHz (35 Watt APUs). Depending on the configurable TDP (set per laptop model) and the used main memory, the performance can also differ.

Architecture and Features

The Radeon R5 utilizes the third generation GCN architecture (sometimes referred to as GCN 1.2) similar to the desktop Tonga chip. As a result, it supports DirectX 12 (FL 12_0) with advanced color compression that leads to a 5-7% improvement in games. Furthermore, its shaders can be used with Mantle, OpenGL and OpenCL. HSA 1.0 is supported for running code on both CPU and GPU cores simultaneously. The improved video decoder UVD 6 (Unified Video Decoder) is now able to decode HVEC / H.265 up to 4K in hardware. Furthermore, the VCE (Video Codec Engine) has been improved for faster transcoding of H.264. More information on architecture and features of the Bristol Ridge architecture can be found in our launch article.

Performance

Gaming performance of the integrated R5 GPU depends on the configured TDP, model and main memory of the system. A typical ULV version with a TDP of 15 Watt paired with fast dual channel main memory is nearly on a level with the dedicated GeForce 920M or Radeon R7 M260 (see gaming benchmarks below). Therefore, demanding games of 2015 and 2016 may only run in the lowest detail settings fluently (and some not at all).

Power Consumption

Depending on the configured TDP, the still in 28 nm produced chip may be used in thin-and-light (12 - 20 Watt range) to standard-sized laptops (35 Watt TDP).

Intel HD Graphics 510

► remove from comparison Intel HD Graphics 510

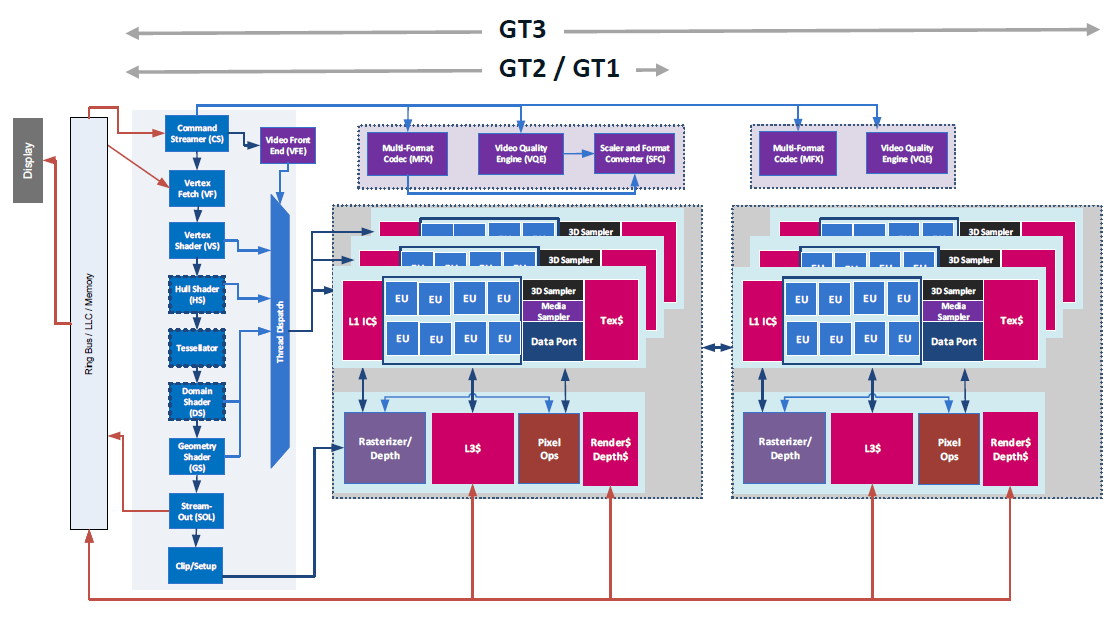
The Intel HD Graphics 510 (GT1) is an integrated graphics unit, which can be found in low-end ULV (Ultra Low Voltage) processors of the Skylake generation. This "GT1" version of the Skylake GPU offers 12 Execution Units (EUs) clocked at up to 950 MHz (depending on the CPU model). Due to its lack of dedicated graphics memory or eDRAM cache, the HD 510 has to access the main memory (2x 64bit DDR3L-1600 / DDR4-2133).

Performance

Depending on various factors like memory configuration, the HD Graphics 510 should perform sligthly below the older HD Graphics 4400 and will handle modern games (as of 2015) only in lowest settings (if it does at all).

Features

The revised video engine now decodes H.265/HEVC completely in hardware and thereby much more efficiently than before. Displays can be connected via DP 1.2 / eDP 1.3 (max. 3840 x 2160 @ 60 Hz), whereas HDMI is limited to the older version 1.4a (max. 3840 x 2160 @ 30 Hz). However, HDMI 2.0 can be added using a DisplayPort converter. Up to three displays can be controlled simultaneously.

Power Consumption

The HD Graphics 510 can be found in mobile processors specified at 15 W TDP and is therefore suited for compact laptops and ultrabooks.

Intel UHD Graphics 610

► remove from comparison Intel UHD Graphics 610

The Intel UHD Graphics 610 (GT1) is an integrated graphics unit, which can be found in low-end ULV (Ultra Low Voltage) processors of the Whisky-Lake generation. This "GT1" version of the Skylake GPU offers 12 Execution Units (EUs) clocked at up to 950 MHz (depending on the CPU model). Due to its lack of dedicated graphics memory or eDRAM cache, the HD 610 has to access the main memory (2x 64bit DDR3L-1600 / DDR4-2133).

Performance

Depending on various factors like memory configuration, the UHD Graphics 610 should offer a similar performance as the similar Intel HD Graphics 610 and the old Skylake HD Graphics 510 and therefore can only handle non demanding games. E.g. Farming Simulator 17, World of Warships or Dota 2 Reborn can be played on low settings.

Features

The revised video engine now supports H.265/HEVC Main10 profile in hardware with 10 bit colors. Furthermore, Googles VP9 codec can also be hardware decoded. The Pentium chips should already support HDCP 2.2 and therefore Netflix 4K. HDMI 2.0 however is still only supported with an external converter chip (LSPCon).

Power Consumption

The UHD Graphics 610 can be found in mobile processors specified at 15 W TDP and is therefore suited for compact laptops and ultrabooks.

AMD Radeon R5 (Bristol Ridge)Intel HD Graphics 510Intel UHD Graphics 610
Gen. 9 Series
Radeon R7 (Bristol Ridge) 512 @ 0.9 GHz64/128 Bit
Radeon R5 (Bristol Ridge) 384 @ 0.8 GHz64/128 Bit
Radeon R5 (Stoney Ridge) 192 @ 0.8 GHz64 Bit
Radeon R4 (Stoney Ridge) 192 @ 0.6 GHz64 Bit
Radeon R2 (Stoney Ridge) 128 @ 0.6 GHz64 Bit
Iris Pro Graphics P580 72 @ 0.35 - 1.1 GHzeDRAM + 64/128 Bit
Iris Pro Graphics 580 72 @ 0.35 - 1.05 GHzeDRAM + 64/128 Bit
Iris Graphics 550 48 @ 0.3 - 1.1 GHzeDRAM + 64/128 Bit
Iris Graphics 540 48 @ 0.3 - 1.05 GHzeDRAM + 64/128 Bit
HD Graphics 530 24 @ 0.35 - 1.15 GHz64/128 Bit
HD Graphics 520 24 @ 0.3 - 1.05 GHz64/128 Bit
HD Graphics 515 24 @ 0.3 - 1 GHz64/128 Bit
UHD Graphics 610 12 @ 0.3 - 0.95 GHz64/128 Bit
HD Graphics 610 12 @ 0.3 - 0.95 GHz64/128 Bit
HD Graphics 510 12 @ 0.3 - 0.95 GHz64/128 Bit
UHD Graphics 605 18 @ 0.3 - 0.75 GHz64/128 Bit
HD Graphics 505 18 @ 0.3 - 0.75 GHz64/128 Bit
UHD Graphics 600 12 @ 0.3 - 0.7 GHz64/128 Bit
HD Graphics 500 12 @ 0.3 - 0.7 GHz64/128 Bit
CodenameBristol RidgeSkylake GT1Kaby Lake GT1
ArchitectureGCN 1.2/2.0Gen. 9 SkylakeGen. 9 Kaby Lake
Pipelines384 - unified12 - unified12 - unified
Core Speed800 (Boost) MHz300 - 950 (Boost) MHz300 - 950 (Boost) MHz
Memory Bus Width64/128 Bit64/128 Bit64/128 Bit
Shared Memoryyesyesyes
APIDirectX 12 (FL 12_0), OpenGL 4.4DirectX 12_1, OpenGL 4.4DirectX 12_1, OpenGL 4.4
Power Consumption12-45 Watt
Transistors3.1 Billion
technology28 nm14 nm14 nm
FeaturesUVD 6, VCEQuickSyncQuickSync
Notebook Sizemedium sized
Date of Announcement01.06.2016 01.09.2015 01.01.2019
Memory TypeDDR3/DDR4DDR3/DDR4
CPU in Radeon R5 (Bristol Ridge)GPU Base SpeedGPU Boost / Turbo
AMD A10-9620P4 x 2500 MHz, 15 W? MHz758 MHz
AMD A10-9600P4 x 2400 MHz, 15 W? MHz720 MHz
AMD PRO A8-9600B4 x 2400 MHz, 15 W? MHz720 MHz
min. - max.? MHz720 - 758 MHz
CPU in HD Graphics 510GPU Base SpeedGPU Boost / Turbo
Intel Core i5-6198DU2 x 2300 MHz, 15 W300 MHz1000 MHz
Intel Pentium 4405U2 x 2100 MHz, 15 W300 MHz950 MHz
min. - max.300 MHz950 - 1000 MHz
CPU in UHD Graphics 610GPU Base SpeedGPU Boost / Turbo
Intel Core i5-10200H4 x 2400 MHz, 45 W350 MHz1050 MHz
Intel Pentium Gold 6405U2 x 2400 MHz, 15 W300 MHz900 MHz
Intel Pentium Gold 5405U2 x 2300 MHz, 15 W300 MHz950 MHz
min. - max.300 - 350 MHz900 - 1050 MHz

Benchmarks

Performance Rating - 3DMark 11 + Fire Strike + Time Spy - Radeon R5 (Bristol Ridge)
0.5 pt (1%)
Restrict / Search: Model: Max. age: years
Performance Rating - 3DMark 11 + Fire Strike + Time Spy - HD Graphics 510
0.2 pt (1%)
Restrict / Search: Model: Max. age: years
Performance Rating - 3DMark 11 + Fire Strike + Time Spy - UHD Graphics 610
0.2 pt (1%)
Restrict / Search: Model: Max. age: years
3DMark - 3DMark Time Spy Score
222 Points (1%)
3DMark - 3DMark Time Spy Graphics
194 Points (0%)
3DMark - 3DMark Ice Storm Unlimited Graphics
min: 54723     avg: 58018     median: 58018 (6%)     max: 61313 Points
43274 Points (4%)
min: 41521     avg: 42713     median: 42712.5 (4%)     max: 43904 Points
3DMark - 3DMark Ice Storm Extreme Graphics
min: 36785     avg: 36979     median: 36979 (4%)     max: 37173 Points
26846 Points (3%)
20443 Points (2%)
3DMark - 3DMark Cloud Gate Score
min: 4797     avg: 4981     median: 4980.5 (5%)     max: 5164 Points
4721 Points (4%)
min: 4244     avg: 4334     median: 4333.5 (4%)     max: 4423 Points
3DMark - 3DMark Cloud Gate Graphics
min: 7689     avg: 8256     median: 8255.5 (2%)     max: 8822 Points
5664 Points (1%)
min: 5139     avg: 5277     median: 5276.5 (1%)     max: 5414 Points
3DMark - 3DMark Fire Strike Standard Score
min: 994     avg: 1054     median: 1053.5 (2%)     max: 1113 Points
570 Points (1%)
min: 597     avg: 616     median: 616 (1%)     max: 635 Points
3DMark - 3DMark Fire Strike Standard Graphics
min: 1230     avg: 1284     median: 1283.5 (1%)     max: 1337 Points
621 Points (1%)
min: 634     avg: 664     median: 663.5 (1%)     max: 693 Points
3DMark - 3DMark Ice Storm Graphics
min: 50152     avg: 51420     median: 51419.5 (6%)     max: 52687 Points
62653 Points (7%)
min: 33154     avg: 36325     median: 36325 (4%)     max: 39496 Points
3DMark - 3DMark Night Raid
2629 Points (2%)
3DMark - 3DMark Night Raid Graphics Score
2850 Points (1%)
3DMark 11 - 3DM11 Performance Score
min: 1672     avg: 1820     median: 1874 (2%)     max: 1913 Points
985 Points (1%)
min: 1026     avg: 1046     median: 1045.5 (1%)     max: 1065 Points
3DMark 11 - 3DM11 Performance GPU
min: 1482     avg: 1708     median: 1720 (1%)     max: 1921 Points
847 Points (1%)
min: 915     avg: 923     median: 922.5 (1%)     max: 930 Points
3DMark Vantage
3DM Vant. Perf. total + Intel HD Graphics 510
3DMark Vantage - 3DM Vant. Perf. total
3798 Points (1%)
3DM Vant. Perf. total + Intel UHD Graphics 610
3996 Points (1%)
3DM Vant. Perf. GPU no PhysX + Intel HD Graphics 510
3DMark Vantage - 3DM Vant. Perf. GPU no PhysX
3125 Points (2%)
3DM Vant. Perf. GPU no PhysX + Intel UHD Graphics 610
3375 Points (2%)
3DMark 05 - 3DMark 05 - Standard
12054 Points (13%)
3DMark 06 3DMark 06 - Standard 1280x1024 + AMD Radeon R5 (Bristol Ridge)
3DMark 06
min: 6431     avg: 6817     median: 6816.5 (9%)     max: 7202 Points
3DMark 06 - Standard 1280x1024 + Intel HD Graphics 510
7253 Points (9%)
3DMark 06 - Standard 1280x1024 + Intel UHD Graphics 610
min: 6026     avg: 6902     median: 6902 (9%)     max: 7778 Points
Unigine Valley 1.0 - Unigine Valley 1.0 DX
min: 3     avg: 3.4     median: 3.4 (1%)     max: 3.7 fps
Unigine Heaven 3.0 - Unigine Heaven 3.0 DX 11
9.3 fps (3%)
Unigine Heaven 3.0 - Unigine Heaven 3.0 OpenGL
10.8 fps (5%)
Unigine Heaven 2.1 - Heaven 2.1 high
13.5 fps (3%)
Cinebench R10 Cinebench R10 Shading (32bit) + AMD Radeon R5 (Bristol Ridge)
Cinebench R10 - Cinebench R10 Shading (32bit)
min: 5016     avg: 5133     median: 5132.5 (4%)     max: 5249 Points
Cinebench R10 Shading (32bit) + Intel HD Graphics 510
7348 Points (5%)
Cinebench R10 Shading (32bit) + Intel UHD Graphics 610
min: 4516     avg: 5210     median: 5209.5 (4%)     max: 5903 Points
Cinebench R11.5 Cinebench R11.5 OpenGL 64 Bit + AMD Radeon R5 (Bristol Ridge)
Cinebench R11.5 - Cinebench R11.5 OpenGL 64 Bit
23.6 fps (8%)
Cinebench R11.5 OpenGL 64 Bit + Intel HD Graphics 510
17.2 fps (6%)
Cinebench R11.5 OpenGL 64 Bit + Intel UHD Graphics 610
17.3 fps (6%)
Cinebench R15
Cinebench R15 OpenGL 64 Bit + AMD Radeon R5 (Bristol Ridge)
Cinebench R15 - Cinebench R15 OpenGL 64 Bit
min: 28.25     avg: 30     median: 30 (2%)     max: 31.76 fps
Cinebench R15 OpenGL 64 Bit + Intel HD Graphics 510
28 fps (2%)
Cinebench R15 OpenGL 64 Bit + Intel UHD Graphics 610
min: 27.5     avg: 28.4     median: 28.4 (2%)     max: 29.24 fps
Cinebench R15 OpenGL Ref. Match 64 Bit + AMD Radeon R5 (Bristol Ridge)
Cinebench R15 - Cinebench R15 OpenGL Ref. Match 64 Bit
98 % (98%)
Cinebench R15 OpenGL Ref. Match 64 Bit + Intel UHD Graphics 610
GFXBench - GFXBench 5.0 Aztec Ruins High Tier Offscreen
5.4 fps (1%)
GFXBench - GFXBench 5.0 Aztec Ruins Normal Tier Offscreen
15.3 fps (1%)
GFXBench - GFXBench Car Chase Offscreen
35.9 fps (3%)
GFXBench 3.1 - GFXBench Manhattan ES 3.1 Offscreen
51.7 fps (1%)
GFXBench 3.0 - GFXBench 3.0 Manhattan Offscreen
31.6 fps (1%)
64.6 fps (3%)
GFXBench (DX / GLBenchmark) 2.7
GFXBench T-Rex HD Offscreen C24Z16 + AMD Radeon R5 (Bristol Ridge)
GFXBench (DX / GLBenchmark) 2.7 - GFXBench T-Rex HD Offscreen C24Z16
107 fps (1%)
GFXBench T-Rex HD Offscreen C24Z16 + Intel HD Graphics 510
121.9 fps (1%)
GFXBench T-Rex HD Offscreen C24Z16 + Intel UHD Graphics 610
Basemark GPU 1.2 - Basemark GPU 1.2 Vulkan Official Medium Offscreen 1080
25.5 fps (1%)
LuxMark v2.0 64Bit - LuxMark v2.0 Room GPU
174 Samples/s (1%)
167 Samples/s (1%)
min: 144     avg: 157     median: 157 (1%)     max: 170 Samples/s
LuxMark v2.0 64Bit - LuxMark v2.0 Sala GPU
331 Samples/s (1%)
302 Samples/s (1%)
min: 295     avg: 304.5     median: 304.5 (1%)     max: 314 Samples/s
ComputeMark v2.1 - ComputeMark v2.1 Result
1127 Points (1%)
500 Points (0%)
min: 480     avg: 481.5     median: 481.5 (0%)     max: 483 Points
Power Consumption - Furmark Stress Test Power Consumption - external Monitor *
min: 18     avg: 23.1     median: 23.1 (3%)     max: 28.2 Watt
Power Consumption - Witcher 3 Power Consumption *
25.6 Watt (6%)
Clock Speed - GPU Clock Speed Furmark
948 MHz (38%)

Average Benchmarks AMD Radeon R5 (Bristol Ridge) → 100% n=18

Average Benchmarks Intel HD Graphics 510 → 89% n=18

Average Benchmarks Intel UHD Graphics 610 → 74% n=18

- Range of benchmark values for this graphics card
red legend - Average benchmark values for this graphics card
* Smaller numbers mean a higher performance
1 This benchmark is not used for the average calculation

Game Benchmarks

The following benchmarks stem from our benchmarks of review laptops. The performance depends on the used graphics memory, clock rate, processor, system settings, drivers, and operating systems. So the results don't have to be representative for all laptops with this GPU. For detailed information on the benchmark results, click on the fps number.

F1 2021

F1 2021

2021
low 1280x720
UHD Graphics 610:
19.7  fps
med. 1920x1080
UHD Graphics 610:
7.9  fps
high 1920x1080
UHD Graphics 610:
6.3  fps
F1 2020

F1 2020

2020
low 1280x720
UHD Graphics 610:
17.6  fps
med. 1920x1080
UHD Graphics 610:
7.5  fps
high 1920x1080
UHD Graphics 610:
5.5  fps
low 1280x720
UHD Graphics 610:
15.5  fps
low 1280x720
UHD Graphics 610:
0 (!)  fps
low 1280x720
100%
Radeon R5 (Bristol Ridge):
10.1  fps
85%
UHD Graphics 610:
8.6  fps
low 1280x720
100%
Radeon R5 (Bristol Ridge):
12.4  fps
med. 1920x1080
UHD Graphics 610:
30.4  fps
high 1920x1080
UHD Graphics 610:
21.9  fps
low 1280x720
100%
Radeon R5 (Bristol Ridge):
6.6  fps
med. 1920x1080
100%
Radeon R5 (Bristol Ridge):
6.5  fps
119%
UHD Graphics 610:
7.7  fps
low 1280x720
100%
Radeon R5 (Bristol Ridge):
9.6  fps
83%
UHD Graphics 610:
8  fps
GRID 2019

GRID 2019

2019
low 1280x720
100%
Radeon R5 (Bristol Ridge):
7  fps
low 1280x720
100%
Radeon R5 (Bristol Ridge):
6  fps
100%
UHD Graphics 610:
6  fps
FIFA 20

FIFA 20

2019
low 1280x720
100%
Radeon R5 (Bristol Ridge):
31.1  fps
88%
UHD Graphics 610:
27.5 (!)  fps
low 1280x720
100%
Radeon R5 (Bristol Ridge):
10.2  fps
Control

Control

2019
low 1280x720
100%
Radeon R5 (Bristol Ridge):
10.2  fps
F1 2019

F1 2019

2019
low 1280x720
100%
Radeon R5 (Bristol Ridge):
17  fps
98%
UHD Graphics 610:
16.6  fps
low 1280x720
100%
Radeon R5 (Bristol Ridge):
12.8  fps
132%
UHD Graphics 610:
16.9  fps
med. 1920x1080
UHD Graphics 610:
5  fps
Anno 1800

Anno 1800

2019
low 1280x720
100%
Radeon R5 (Bristol Ridge):
12.7  fps
82%
UHD Graphics 610:
10.4  fps
low 1280x720
100%
Radeon R5 (Bristol Ridge):
6  fps
low 1280x720
100%
Radeon R5 (Bristol Ridge):
29.1  fps
82%
UHD Graphics 610:
23.6 24.7 ~ 24 fps
Anthem

Anthem

2019
low 1280x720
100%
Radeon R5 (Bristol Ridge):
3  fps
low 1280x720
100%
Radeon R5 (Bristol Ridge):
8  fps
100%
UHD Graphics 610:
7 8 ~ 8 fps
med. 1920x1080
UHD Graphics 610:
4  fps
high 1920x1080
UHD Graphics 610:
4  fps
low 1280x720
100%
Radeon R5 (Bristol Ridge):
7.9  fps
low 1280x720
100%
Radeon R5 (Bristol Ridge):
14.4  fps
low 1280x720
100%
Radeon R5 (Bristol Ridge):
11.9  fps
low 1280x720
100%
Radeon R5 (Bristol Ridge):
21  fps
low 1280x720
100%
Radeon R5 (Bristol Ridge):
9.5  fps
72%
UHD Graphics 610:
6.8  fps
low 1280x720
100%
Radeon R5 (Bristol Ridge):
30.7  fps
low 1280x720
100%
Radeon R5 (Bristol Ridge):
10.4  fps
Hitman 2

Hitman 2

2018
low 1280x720
100%
Radeon R5 (Bristol Ridge):
9.1  fps
low 1280x720
100%
Radeon R5 (Bristol Ridge):
8.9  fps
low 1280x720
100%
Radeon R5 (Bristol Ridge):
9  fps
low 1280x720
100%
Radeon R5 (Bristol Ridge):
16  fps
med. 1920x1080
100%
Radeon R5 (Bristol Ridge):
11  fps
low 1280x720
100%
Radeon R5 (Bristol Ridge):
11  fps
82%
UHD Graphics 610:
9  fps
Strange Brigade

Strange Brigade

2018
low 1280x720
UHD Graphics 610:
18.3  fps
med. 1920x1080
UHD Graphics 610:
7.7  fps
high 1920x1080
UHD Graphics 610:
10  fps
ultra 1920x1080
UHD Graphics 610:
13.6  fps
F1 2018

F1 2018

2018
low 1280x720
100%
Radeon R5 (Bristol Ridge):
15  fps
low 1280x720
100%
Radeon R5 (Bristol Ridge):
8.6  fps
low 1280x720
100%
Radeon R5 (Bristol Ridge):
9.2  fps
Far Cry 5

Far Cry 5

2018
low 1280x720
100%
Radeon R5 (Bristol Ridge):
5  fps
160%
UHD Graphics 610:
7 8 ~ 8 fps
med. 1920x1080
UHD Graphics 610:
4  fps
high 1920x1080
UHD Graphics 610:
3  fps
World of Tanks enCore

World of Tanks enCore

2018
low 1366x768
100%
Radeon R5 (Bristol Ridge):
88.2  fps
med. 1920x1080
100%
Radeon R5 (Bristol Ridge):
12.6  fps
low 1280x720
100%
Radeon R5 (Bristol Ridge):
12.7  fps
79%
UHD Graphics 610:
9.6 10.9 ~ 10 fps
med. 1920x1080
100%
Radeon R5 (Bristol Ridge):
8.6  fps
105%
UHD Graphics 610:
7.5 10.5 ~ 9 fps
high 1920x1080
UHD Graphics 610:
6.9 7.3 ~ 7 fps
low 1280x720
100%
Radeon R5 (Bristol Ridge):
9.4  fps
med. 1920x1080
100%
Radeon R5 (Bristol Ridge):
4.4  fps
low 1280x720
100%
Radeon R5 (Bristol Ridge):
8  fps
97%
UHD Graphics 610:
7.7  fps
med. 1920x1080
100%
Radeon R5 (Bristol Ridge):
4  fps
88%
UHD Graphics 610:
3.5  fps
high 1920x1080
UHD Graphics 610:
3.5  fps
Fortnite

Fortnite

2018
low 1280x720
100%
Radeon R5 (Bristol Ridge):
29.4  fps
81%
UHD Graphics 610:
23.8 (!)  fps
med. 1920x1080
100%
Radeon R5 (Bristol Ridge):
9  fps
low 1280x720
100%
Radeon R5 (Bristol Ridge):
9  fps
med. 1920x1080
100%
Radeon R5 (Bristol Ridge):
6.3  fps
low 1280x720
100%
Radeon R5 (Bristol Ridge):
11.2  fps
med. 1920x1080
100%
Radeon R5 (Bristol Ridge):
7.9  fps
low 1280x720
100%
Radeon R5 (Bristol Ridge):
20.7  fps
med. 1920x1080
100%
Radeon R5 (Bristol Ridge):
14.2  fps
low 1280x720
100%
Radeon R5 (Bristol Ridge):
10  fps
med. 1920x1080
100%
Radeon R5 (Bristol Ridge):
6  fps
Destiny 2

Destiny 2

2017
low 1280x720
100%
Radeon R5 (Bristol Ridge):
15.3  fps
ELEX

ELEX

2017
low 1280x720
100%
Radeon R5 (Bristol Ridge):
10.7  fps
med. 1920x1080
100%
Radeon R5 (Bristol Ridge):
5.8  fps
low 1280x720
100%
Radeon R5 (Bristol Ridge):
16  fps
88%
UHD Graphics 610:
14  fps
med. 1920x1080
100%
Radeon R5 (Bristol Ridge):
7  fps
F1 2017

F1 2017

2017
low 1280x720
100%
Radeon R5 (Bristol Ridge):
18  fps
med. 1920x1080
100%
Radeon R5 (Bristol Ridge):
14  fps
low 1280x720
100%
Radeon R5 (Bristol Ridge):
38.5  fps
med. 1366x768
100%
Radeon R5 (Bristol Ridge):
38.3  fps
high 1920x1080
100%
Radeon R5 (Bristol Ridge):
31.1  fps
ultra 1920x1080
100%
Radeon R5 (Bristol Ridge):
21.9  fps
Dirt 4

Dirt 4

2017
low 1280x720
100%
Radeon R5 (Bristol Ridge):
39.2  fps
med. 1920x1080
100%
Radeon R5 (Bristol Ridge):
12.1  fps
low 1280x720
100%
Radeon R5 (Bristol Ridge):
61.3  fps
33%
UHD Graphics 610:
20.3  fps
med. 1920x1080
100%
Radeon R5 (Bristol Ridge):
22.8  fps
high 1920x1080
100%
Radeon R5 (Bristol Ridge):
14.3  fps
Prey

Prey

2017
low 1280x720
100%
Radeon R5 (Bristol Ridge):
21  fps
med. 1920x1080
100%
Radeon R5 (Bristol Ridge):
10.8  fps
high 1920x1080
100%
Radeon R5 (Bristol Ridge):
8.8  fps
ultra 1920x1080
100%
Radeon R5 (Bristol Ridge):
5.3  fps
low 1280x720
100%
Radeon R5 (Bristol Ridge):
13  fps
med. 1920x1080
100%
Radeon R5 (Bristol Ridge):
6  fps
low 1280x720
100%
Radeon R5 (Bristol Ridge):
12.7  fps
med. 1920x1080
100%
Radeon R5 (Bristol Ridge):
5.6  fps
For Honor

For Honor

2017
low 1280x720
100%
Radeon R5 (Bristol Ridge):
20.8  fps
med. 1920x1080
100%
Radeon R5 (Bristol Ridge):
6.8  fps
low 1280x720
100%
Radeon R5 (Bristol Ridge):
38.8  fps
47%
HD Graphics 510:
18.3  fps
med. 1920x1080
100%
Radeon R5 (Bristol Ridge):
29.1  fps
low 1280x720
100%
Radeon R5 (Bristol Ridge):
27.9  fps
71%
HD Graphics 510:
19.9  fps
med. 1366x768
100%
Radeon R5 (Bristol Ridge):
23.4  fps
66%
HD Graphics 510:
15.4  fps
low 1280x720
100%
Radeon R5 (Bristol Ridge):
60.3  fps
117%
HD Graphics 510:
70.6  fps
med. 1366x768
100%
Radeon R5 (Bristol Ridge):
38.4  fps
108%
HD Graphics 510:
41.3  fps
low 1280x720
100%
Radeon R5 (Bristol Ridge):
16.5  fps
med. 1366x768
100%
Radeon R5 (Bristol Ridge):
12.1  fps
low 1024x768
100%
Radeon R5 (Bristol Ridge):
30.5  fps
80%
HD Graphics 510:
24.5  fps
med. 1366x768
100%
Radeon R5 (Bristol Ridge):
13.9  fps
68%
HD Graphics 510:
9.4  fps
low 1280x720
100%
Radeon R5 (Bristol Ridge):
13.9  fps
med. 1366x768
100%
Radeon R5 (Bristol Ridge):
10.1  fps
low 1280x720
100%
Radeon R5 (Bristol Ridge):
21.1  fps
med. 1366x768
100%
Radeon R5 (Bristol Ridge):
13.6  fps
Overwatch

Overwatch

2016
low 1280x720
100%
Radeon R5 (Bristol Ridge):
32.5  fps
76%
UHD Graphics 610:
24.8  fps
med. 1366x768
100%
Radeon R5 (Bristol Ridge):
29  fps
61%
UHD Graphics 610:
17.7  fps
high 1920x1080
100%
Radeon R5 (Bristol Ridge):
16  fps
ultra 1920x1080
100%
Radeon R5 (Bristol Ridge):
11.6  fps
low 1280x768
100%
Radeon R5 (Bristol Ridge):
8  fps
med. 1920x1080
100%
Radeon R5 (Bristol Ridge):
5  fps
low 1280x720
100%
Radeon R5 (Bristol Ridge):
18.6  fps
med. 1366x768
100%
Radeon R5 (Bristol Ridge):
15  fps
low 1280x720
100%
Radeon R5 (Bristol Ridge):
9.4  fps
med. 1366x768
100%
Radeon R5 (Bristol Ridge):
6.1  fps
low 1280x720
100%
Radeon R5 (Bristol Ridge):
19.6  fps
68%
HD Graphics 510:
13.4  fps
med. 1366x768
100%
Radeon R5 (Bristol Ridge):
11.5  fps
67%
HD Graphics 510:
7.7  fps
low 1280x720
100%
Radeon R5 (Bristol Ridge):
13  fps
med. 1920x1080
100%
Radeon R5 (Bristol Ridge):
8  fps
XCOM 2

XCOM 2

2016
low 1280x720
100%
Radeon R5 (Bristol Ridge):
15.9  fps
med. 1920x1080
100%
Radeon R5 (Bristol Ridge):
6.1  fps
low 1024x768
100%
Radeon R5 (Bristol Ridge):
20.6  fps
54%
HD Graphics 510:
11.1  fps
med. 1366x768
100%
Radeon R5 (Bristol Ridge):
11.2  fps
63%
HD Graphics 510:
7  fps
high 1920x1080
100%
Radeon R5 (Bristol Ridge):
6.2  fps
low 1024x768
100%
Radeon R5 (Bristol Ridge):
36.3  fps
69%
HD Graphics 510:
25  fps
67%
UHD Graphics 610:
24.2  fps
med. 1366x768
100%
Radeon R5 (Bristol Ridge):
24.3  fps
65%
HD Graphics 510:
15.9  fps
62%
UHD Graphics 610:
15.1  fps
low 1024x768
100%
Radeon R5 (Bristol Ridge):
13.3  fps
med. 1366x768
100%
Radeon R5 (Bristol Ridge):
12.4  fps
high 1920x1080
100%
Radeon R5 (Bristol Ridge):
8.3  fps
low 1024x768
100%
Radeon R5 (Bristol Ridge):
22.9  fps
med. 1366x768
100%
Radeon R5 (Bristol Ridge):
12.7  fps
high 1920x1080
100%
Radeon R5 (Bristol Ridge):
7.8  fps
Fallout 4

Fallout 4

2015
low 1280x720
100%
Radeon R5 (Bristol Ridge):
22.1  fps
med. 1366x768
100%
Radeon R5 (Bristol Ridge):
15.2  fps
high 1920x1080
100%
Radeon R5 (Bristol Ridge):
6.5  fps
Anno 2205

Anno 2205

2015
low 1024x768
100%
Radeon R5 (Bristol Ridge):
17.4  fps
114%
HD Graphics 510:
19.9  fps
med. 1366x768
100%
Radeon R5 (Bristol Ridge):
11  fps
100%
HD Graphics 510:
11  fps
low 1366x768
100%
Radeon R5 (Bristol Ridge):
41.2  fps
118%
HD Graphics 510:
48.7  fps
med. 1366x768
100%
Radeon R5 (Bristol Ridge):
29.1  fps
100%
HD Graphics 510:
29.2  fps
high 1920x1080
100%
Radeon R5 (Bristol Ridge):
16.9  fps
ultra 1920x1080
100%
Radeon R5 (Bristol Ridge):
14  fps
low 1024x768
100%
Radeon R5 (Bristol Ridge):
46.1  fps
84%
HD Graphics 510:
38.9  fps
med. 1366x768
100%
Radeon R5 (Bristol Ridge):
30  fps
84%
HD Graphics 510:
25.2  fps
Mad Max

Mad Max

2015
med. 1366x768
100%
Radeon R5 (Bristol Ridge):
19  fps
high 1920x1080
100%
Radeon R5 (Bristol Ridge):
9.4  fps
low 1280x720
100%
Radeon R5 (Bristol Ridge):
37.9  fps
175%
HD Graphics 510:
66.2  fps
156%
UHD Graphics 610:
54.4 63.1 ~ 59 fps
med. 1366x768
100%
Radeon R5 (Bristol Ridge):
24.1  fps
173%
HD Graphics 510:
41.8  fps
112%
UHD Graphics 610:
23.1 31.7 ~ 27 fps
high 1920x1080
100%
Radeon R5 (Bristol Ridge):
17.7  fps
68%
UHD Graphics 610:
10.6 12.8 ~ 12 fps
ultra 1920x1080
100%
Radeon R5 (Bristol Ridge):
16.7  fps
66%
UHD Graphics 610:
9.7 11.6 ~ 11 fps
low 1024x768
100%
Radeon R5 (Bristol Ridge):
20.2  fps
50%
UHD Graphics 610:
9.2 11.3 ~ 10 fps
med. 1366x768
100%
Radeon R5 (Bristol Ridge):
11  fps
70%
UHD Graphics 610:
7.7  fps
high 1920x1080
100%
Radeon R5 (Bristol Ridge):
5.9  fps
71%
UHD Graphics 610:
4.2  fps
low 1024x768
100%
Radeon R5 (Bristol Ridge):
65.3  fps
169%
HD Graphics 510:
110.4  fps
med. 1366x768
100%
Radeon R5 (Bristol Ridge):
20.6  fps
94%
HD Graphics 510:
19.3  fps
high 1920x1080
100%
Radeon R5 (Bristol Ridge):
13.1  fps
GTA V

GTA V

2015
low 1024x768
100%
Radeon R5 (Bristol Ridge):
38  fps
81%
HD Graphics 510:
30.9  fps
61%
UHD Graphics 610:
17.9 28.5 ~ 23 fps
med. 1366x768
100%
Radeon R5 (Bristol Ridge):
35.2  fps
76%
HD Graphics 510:
26.8  fps
60%
UHD Graphics 610:
16.7 25.4 ~ 21 fps
high 1920x1080
UHD Graphics 610:
6  fps
low 1024x768
100%
Radeon R5 (Bristol Ridge):
22.8  fps
138%
HD Graphics 510:
31.5  fps
med. 1366x768
100%
Radeon R5 (Bristol Ridge):
12.8  fps
173%
HD Graphics 510:
22.2  fps
low 1024x768
100%
Radeon R5 (Bristol Ridge):
25.7  fps
med. 1366x768
100%
Radeon R5 (Bristol Ridge):
18.2  fps
F1 2014

F1 2014

2014
low 1024x768
100%
Radeon R5 (Bristol Ridge):
54  fps
133%
HD Graphics 510:
72  fps
med. 1366x768
100%
Radeon R5 (Bristol Ridge):
34  fps
138%
HD Graphics 510:
47  fps
low 1024x768
100%
Radeon R5 (Bristol Ridge):
42.9  fps
med. 1366x768
100%
Radeon R5 (Bristol Ridge):
22.9  fps
high 1920x1080
100%
Radeon R5 (Bristol Ridge):
11.7  fps
ultra 1920x1080
100%
Radeon R5 (Bristol Ridge):
11.5  fps
low 1280x720
100%
Radeon R5 (Bristol Ridge):
34.6  fps
med. 1344x756
100%
Radeon R5 (Bristol Ridge):
18.3  fps
Sims 4

Sims 4

2014
low 1024x768
100%
Radeon R5 (Bristol Ridge):
99.6  fps
174%
HD Graphics 510:
173.7  fps
med. 1366x768
100%
Radeon R5 (Bristol Ridge):
35.4  fps
91%
HD Graphics 510:
32.2  fps
high 1920x1080
100%
Radeon R5 (Bristol Ridge):
19.4  fps
ultra 1920x1080
100%
Radeon R5 (Bristol Ridge):
15.8  fps
low 1024x768
100%
Radeon R5 (Bristol Ridge):
70.1  fps
193%
HD Graphics 510:
135.5  fps
med. 1366x768
100%
Radeon R5 (Bristol Ridge):
27.3  fps
120%
HD Graphics 510:
32.8  fps
high 1920x1080
100%
Radeon R5 (Bristol Ridge):
15.5  fps
ultra 1920x1080
100%
Radeon R5 (Bristol Ridge):
12.5  fps
low 1024x768
100%
Radeon R5 (Bristol Ridge):
35.8  fps
93%
HD Graphics 510:
33.4  fps
med. 1366x768
100%
Radeon R5 (Bristol Ridge):
24.3  fps
93%
HD Graphics 510:
22.5  fps
high 1366x768
100%
Radeon R5 (Bristol Ridge):
18.2  fps
87%
HD Graphics 510:
15.9  fps
ultra 1920x1080
100%
Radeon R5 (Bristol Ridge):
7  fps
low 1024x768
100%
Radeon R5 (Bristol Ridge):
26.5  fps
med. 1366x768
100%
Radeon R5 (Bristol Ridge):
18.2  fps
high 1366x768
100%
Radeon R5 (Bristol Ridge):
12.4  fps
ultra 1920x1080
100%
Radeon R5 (Bristol Ridge):
6.9  fps
low 1280x720
100%
Radeon R5 (Bristol Ridge):
61.1 63.9 66.1 ~ 64 fps
61%
HD Graphics 510:
39  fps
med. 1366x768
100%
Radeon R5 (Bristol Ridge):
32.7 36.3 40.5 ~ 37 fps
54%
HD Graphics 510:
20.1  fps
high 1366x768
100%
Radeon R5 (Bristol Ridge):
25.5 31.2 32.1 ~ 30 fps
59%
HD Graphics 510:
17.7  fps
ultra 1920x1080
100%
Radeon R5 (Bristol Ridge):
10.2 11 ~ 11 fps
low 1024x768
100%
Radeon R5 (Bristol Ridge):
67.4  fps
78%
HD Graphics 510:
52.7  fps
med. 1366x768
100%
Radeon R5 (Bristol Ridge):
37.4  fps
64%
HD Graphics 510:
23.9  fps
high 1366x768
100%
Radeon R5 (Bristol Ridge):
21.1  fps
77%
HD Graphics 510:
16.2  fps
ultra 1920x1080
100%
Radeon R5 (Bristol Ridge):
9.9  fps
Crysis 3

Crysis 3

2013
low 1024x768
100%
Radeon R5 (Bristol Ridge):
25.6  fps
med. 1366x768
100%
Radeon R5 (Bristol Ridge):
20.5  fps
high 1366x768
100%
Radeon R5 (Bristol Ridge):
11.5  fps
ultra 1920x1080
100%
Radeon R5 (Bristol Ridge):
4.2  fps
low 1024x768
100%
Radeon R5 (Bristol Ridge):
50.9  fps
med. 1366x768
100%
Radeon R5 (Bristol Ridge):
29.3  fps
high 1366x768
100%
Radeon R5 (Bristol Ridge):
24.6  fps
ultra 1920x1080
100%
Radeon R5 (Bristol Ridge):
16.9  fps
low 1024x768
UHD Graphics 610:
57.9  fps
med. 1366x768
UHD Graphics 610:
42.1  fps
low 1024x768
100%
Radeon R5 (Bristol Ridge):
50.7  fps
77%
UHD Graphics 610:
38.9  fps
med. 1366x768
100%
Radeon R5 (Bristol Ridge):
36.6  fps
72%
UHD Graphics 610:
26.2  fps
high 1366x768
100%
Radeon R5 (Bristol Ridge):
32.9  fps
ultra 1920x1080
100%
Radeon R5 (Bristol Ridge):
23.6  fps
Anno 2070

Anno 2070

2011
low 1024x768
100%
Radeon R5 (Bristol Ridge):
62.9  fps
med. 1366x768
100%
Radeon R5 (Bristol Ridge):
33.5  fps
high 1366x768
100%
Radeon R5 (Bristol Ridge):
21.5  fps
ultra 1920x1080
100%
Radeon R5 (Bristol Ridge):
9.4  fps
low 1280x720
100%
Radeon R5 (Bristol Ridge):
36.2  fps
med. 1366x768
100%
Radeon R5 (Bristol Ridge):
25.9  fps
high 1366x768
100%
Radeon R5 (Bristol Ridge):
18.8  fps
low 1024x768
100%
Radeon R5 (Bristol Ridge):
64.1  fps
high 1366x768
100%
Radeon R5 (Bristol Ridge):
41.4  fps
ultra 1920x1080
100%
Radeon R5 (Bristol Ridge):
16.2  fps
low 1024x768
100%
Radeon R5 (Bristol Ridge):
105.8  fps
med. 1360x768
100%
Radeon R5 (Bristol Ridge):
32.1  fps
high 1360x768
100%
Radeon R5 (Bristol Ridge):
26.2  fps
ultra 1920x1080
100%
Radeon R5 (Bristol Ridge):
17.2  fps

Average Gaming AMD Radeon R5 (Bristol Ridge) → 100%

Average Gaming 30-70 fps → 100%

Average Gaming Intel HD Graphics 510 → 99%

Average Gaming 30-70 fps → 112%

Average Gaming Intel UHD Graphics 610 → 85%

Average Gaming 30-70 fps → 116%

AMD Radeon R5 (Bristol Ridge)Intel HD Graphics 510Intel UHD Graphics 610
lowmed.highultraQHD4Klowmed.highultraQHD4Klowmed.highultraQHD4K
F1 202119.77.886.26
F1 202017.67.545.5
Gears Tactics15.5
Doom Eternal
Hunt Showdown10.18.59
Hearthstone30.421.9
Star Wars Jedi Fallen Order6.57.74
Need for Speed Heat9.68
Ghost Recon Breakpoint66
FIFA 2031.127.5
F1 20191716.6
Total War: Three Kingdoms12.816.95
Anno 180012.710.4
Dirt Rally 2.029.124
Far Cry New Dawn8844
Battlefield V9.56.82
Shadow of the Tomb Raider119
Strange Brigade18.37.71013.6
Far Cry 55843
X-Plane 11.1112.78.61097
Final Fantasy XV Benchmark847.733.533.53
Fortnite29.4923.8
Middle-earth: Shadow of War16714
Rocket League61.322.814.320.3
Overwatch32.5291611.624.817.7
Rainbow Six Siege36.324.32515.924.215.1
Dota 2 Reborn37.924.117.716.766.241.859271211
The Witcher 320.2115.9107.684.18
GTA V3835.230.926.823215.97
Counter-Strike: GO57.942.1
Diablo III50.736.632.923.638.926.2
AMD Radeon R5 (Bristol Ridge)Intel HD Graphics 510Intel UHD Graphics 610
lowmed.highultraQHD4Klowmed.highultraQHD4Klowmed.highultraQHD4K
< 30 fps
< 60 fps
< 120 fps
≥ 120 fps
16
6
1
10
2

4
1

3


< 30 fps
< 60 fps
< 120 fps
≥ 120 fps
1
1
1
2
1


< 30 fps
< 60 fps
< 120 fps
≥ 120 fps
25
3

15
2

11


2


For more games that might be playable and a list of all games and graphics cards visit our Gaming List

v1.33
log 07. 16:19:40

#0 ran 0s before starting gpusingle class +0s ... 0s

#1 checking url part for id 7340 +0s ... 0s

#2 checking url part for id 6475 +0s ... 0s

#3 checking url part for id 10401 +0s ... 0s

#4 redirected to Ajax server, took 1751897980s time from redirect:0 +0s ... 0s

#5 did not recreate cache, as it is less than 5 days old! Created at Mon, 07 Jul 2025 05:22:05 +0200 +0s ... 0s

#6 composed specs +0.034s ... 0.035s

#7 did output specs +0s ... 0.035s

#8 start showIntegratedCPUs +0s ... 0.035s

#9 getting avg benchmarks for device 7340 +0.026s ... 0.06s

#10 got single benchmarks 7340 +0.005s ... 0.065s

#11 getting avg benchmarks for device 6475 +0.004s ... 0.069s

#12 got single benchmarks 6475 +0.006s ... 0.075s

#13 getting avg benchmarks for device 10401 +0.004s ... 0.079s

#14 got single benchmarks 10401 +0.005s ... 0.084s

#15 got avg benchmarks for devices +0s ... 0.084s

#16 min, max, avg, median took s +0.034s ... 0.118s

#17 before gaming benchmark output +0s ... 0.118s

#18 Got 327 rows for game benchmarks. +0.009s ... 0.126s

#19 composed SQL query for gamebenchmarks +0s ... 0.126s

#20 got data and put it in $dataArray +0.004s ... 0.13s

#21 benchmarks composed for output. +0.031s ... 0.162s

#22 calculated avg scores. +0s ... 0.162s

#23 return log +0.001s ... 0.163s

Please share our article, every link counts!
Mail Logo
> Expert Reviews and News on Laptops, Smartphones and Tech Innovations > Benchmarks / Tech > Graphics Card Comparison - Head 2 Head
Redaktion, 2017-09- 8 (Update: 2023-07- 1)