Lenovo V340-17IWL 81RG001YGE Review - Solid Entry-Level Business Device with a 17-inch IPS Display
Lenovo is marketing the V340 (17") series as a powerful and responsive business laptop. This mostly applies to the top configuration with a dedicated Nvidia GeForce MX230 GPU, an Intel Core i7-8565U and 16 GB of RAM. Within Lenovo's portfolio, V340 devices appear to belong to the budget entry-level category. The similarly priced IdeaPad 3 (soon to be available with the newer Pentium Gold 6405U) omits a DVD drive and the USB Type-C port. Instead, there is an integrated card reader.
We consider our test device a reasonable starting point. With a Full HD IPS display, 256-GB SSD and 8 GB of RAM, it is suitable for office use. The base configuration is a significant downgrade and includes only 4 GB of RAM, a weak 1600x900 TN display and a slow HDD. The lowest-end configuration will suffer from delays even when performing the simplest of tasks and here, "powerful" and "responsive" are no longer accurate descriptions. At the opposite end of the spectrum, there are models with faster processors: Core i3-8145U, i5-8265U, and i7-8565U options as well as the dedicated graphics card GeForce MX230 are available.
Rating | Date | Model | Weight | Height | Size | Resolution | Price |
|---|---|---|---|---|---|---|---|
| 77.1 % v7 (old) | 07 / 2020 | Lenovo V340-17IWL 81RG001YGE Pentium 5405U, UHD Graphics 610 | 2.8 kg | 27 mm | 17.30" | 1920x1080 | |
| 75.2 % v7 (old) | 05 / 2020 | HP 17-by2437ng i3-10110U, UHD Graphics 620 | 2.4 kg | 24.5 mm | 17.30" | 1600x900 | |
v (old) | 03 / 2020 | Acer Aspire 3 A317-51-58S7 i5-10210U, UHD Graphics 620 | 2.7 kg | 24.6 mm | 17.30" | 1920x1080 | |
| 80.8 % v6 (old) | 08 / 2019 | Lenovo Ideapad L340-17API-81LY0004GE R5 3500U, Vega 8 | 2.8 kg | 24.3 mm | 17.30" | 1600x900 | |
| 78.9 % v6 (old) | 05 / 2019 | Dell Inspiron 17 3780 i7-8565U, Radeon 520 | 2.8 kg | 25 mm | 17.30" | 1920x1080 | |
| 75.8 % v6 (old) | 03 / 2019 | Lenovo IdeaPad 330-17IKB 81DM i5-8550U, GeForce MX150 | 2.8 kg | 24.9 mm | 17.30" | 1600x900 | |
| 72 % v7 (old) | 12 / 2018 | Acer Aspire ES1-732-P7YA Pentium N4200, HD Graphics 505 | 2.8 kg | 27.3 mm | 17.30" | 1600x900 | |
| 79 % v6 (old) | 10 / 2018 | HP 17-ca0013ng R5 2500U, Vega 8 | 2.5 kg | 25 mm | 17.30" | 1920x1080 | |
| 84.7 % v6 (old) | 03 / 2018 | HP Envy 17-ae143ng i5-8250U, GeForce MX150 | 3 kg | 23.3 mm | 17.30" | 1920x1080 |
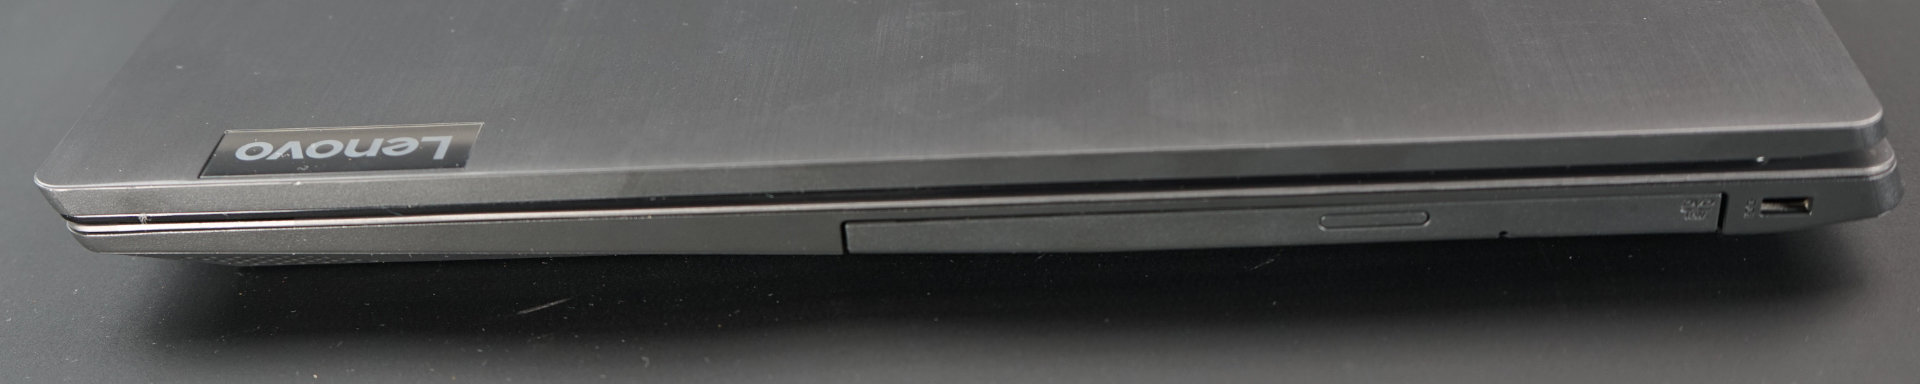
Case
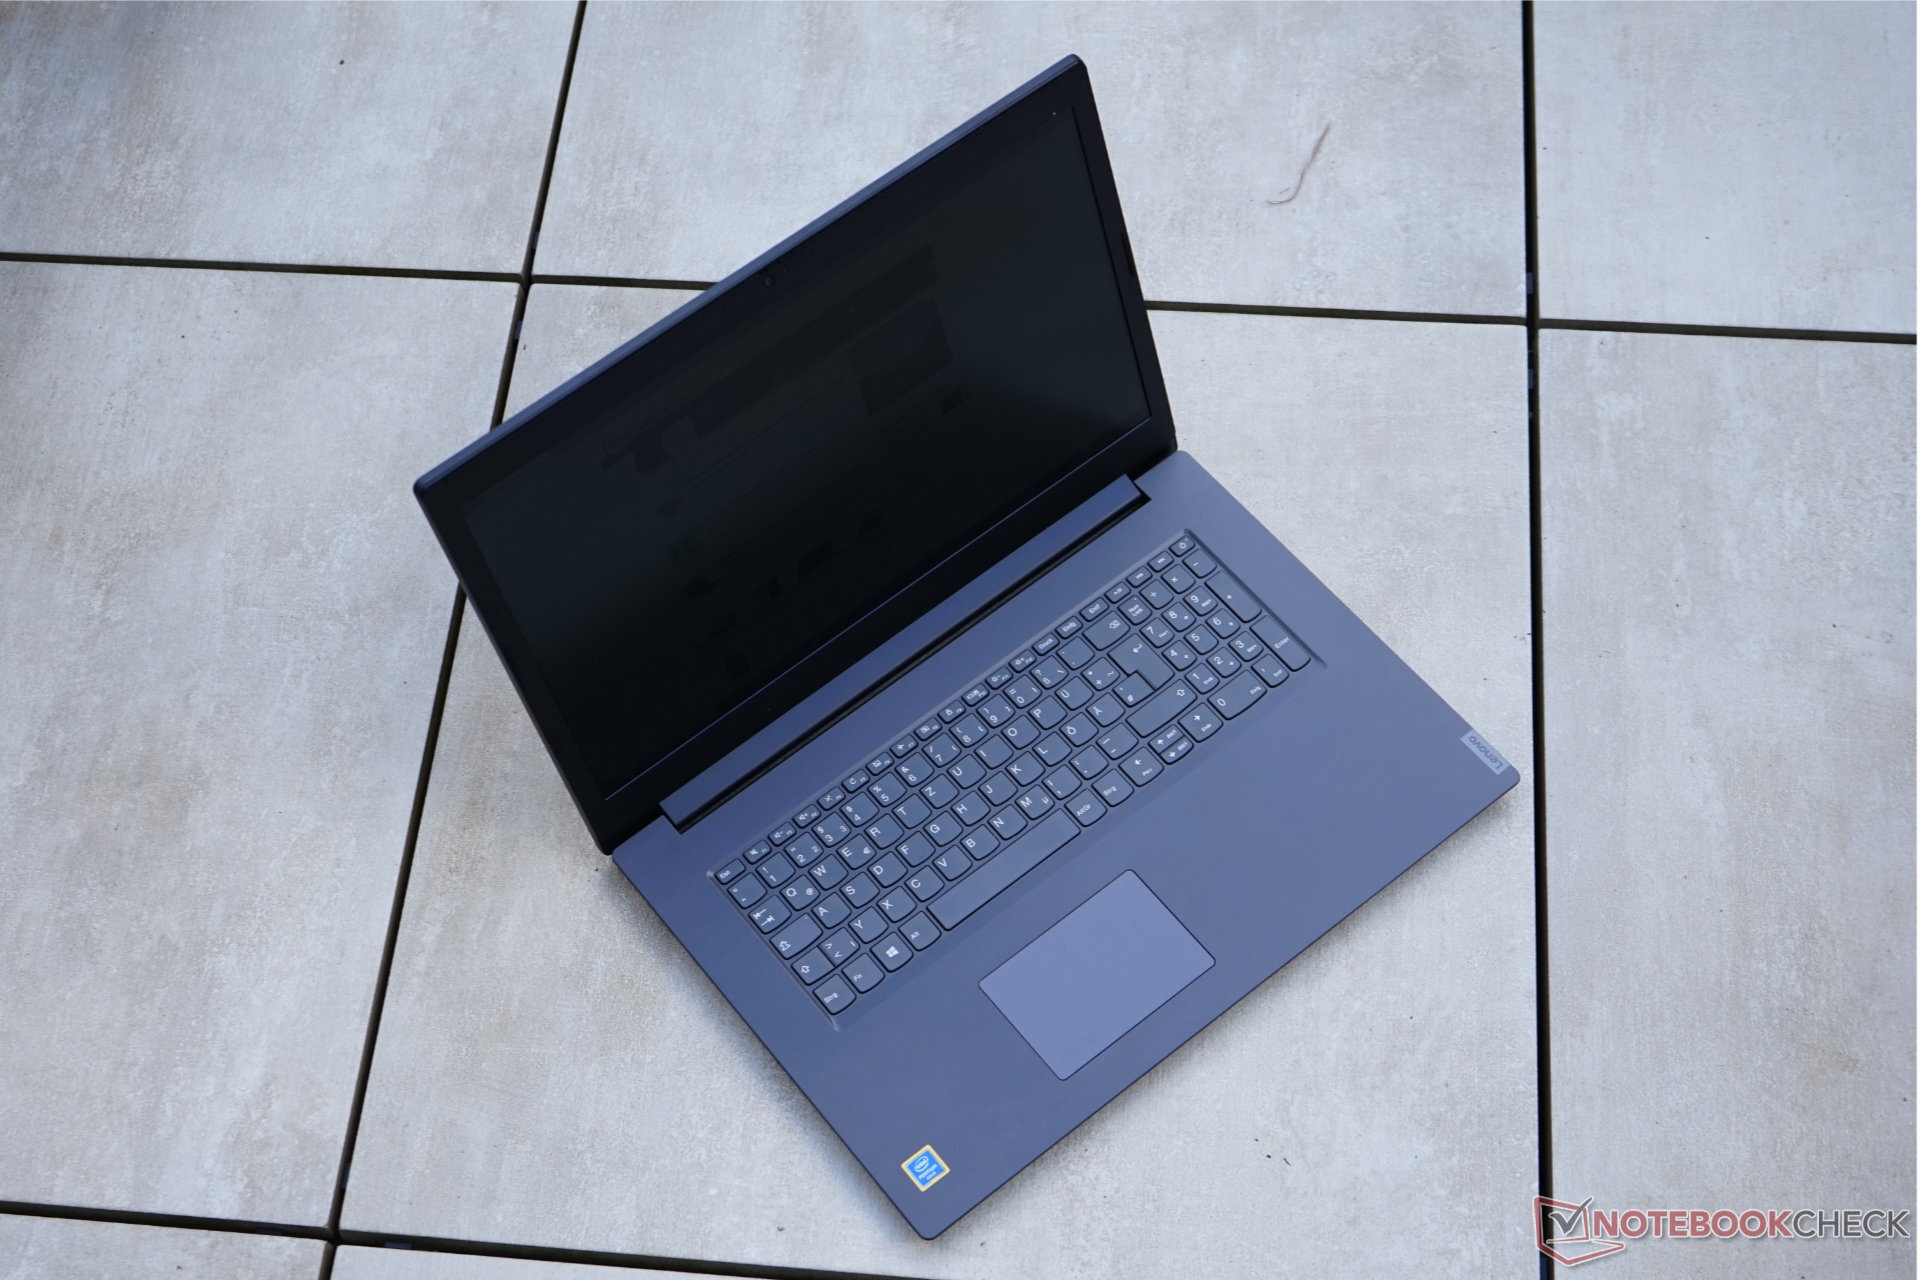
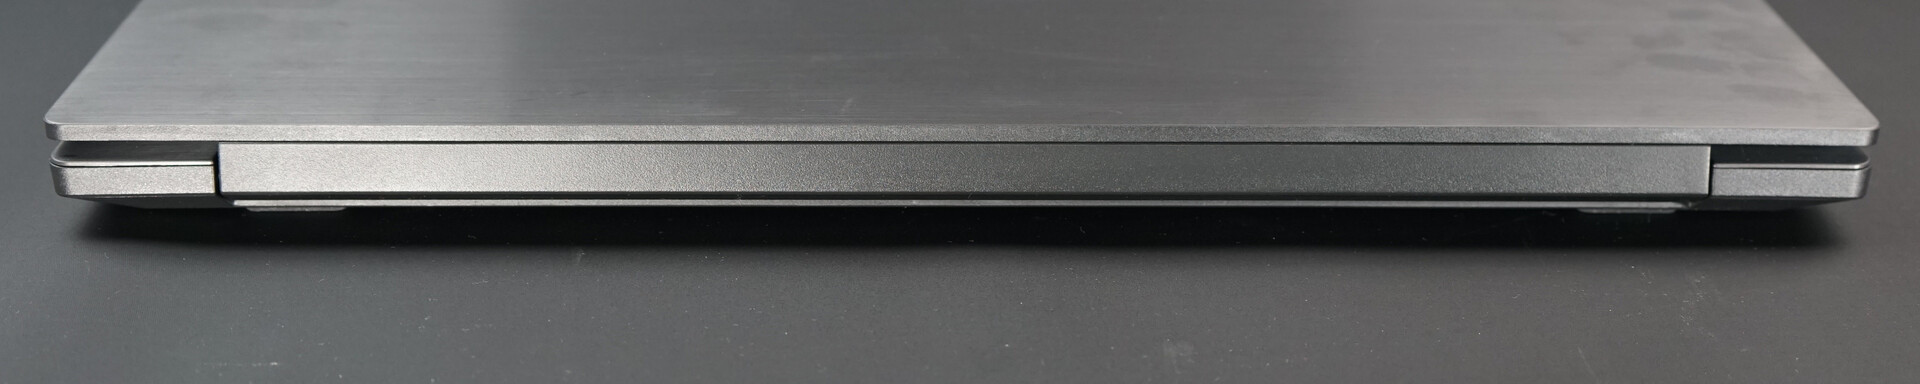
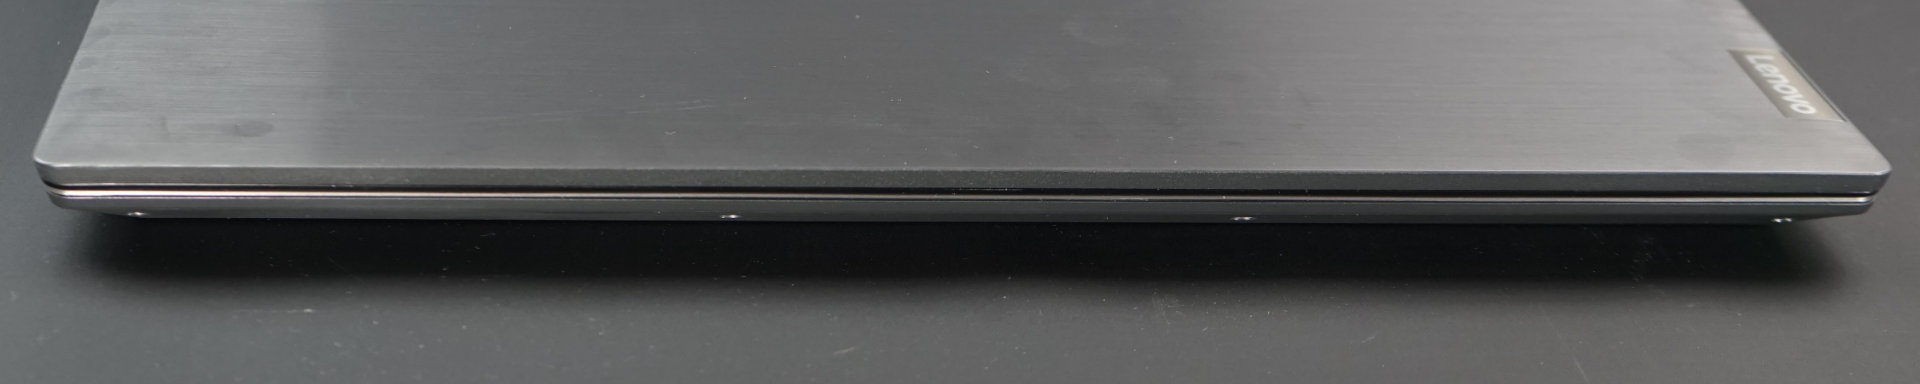
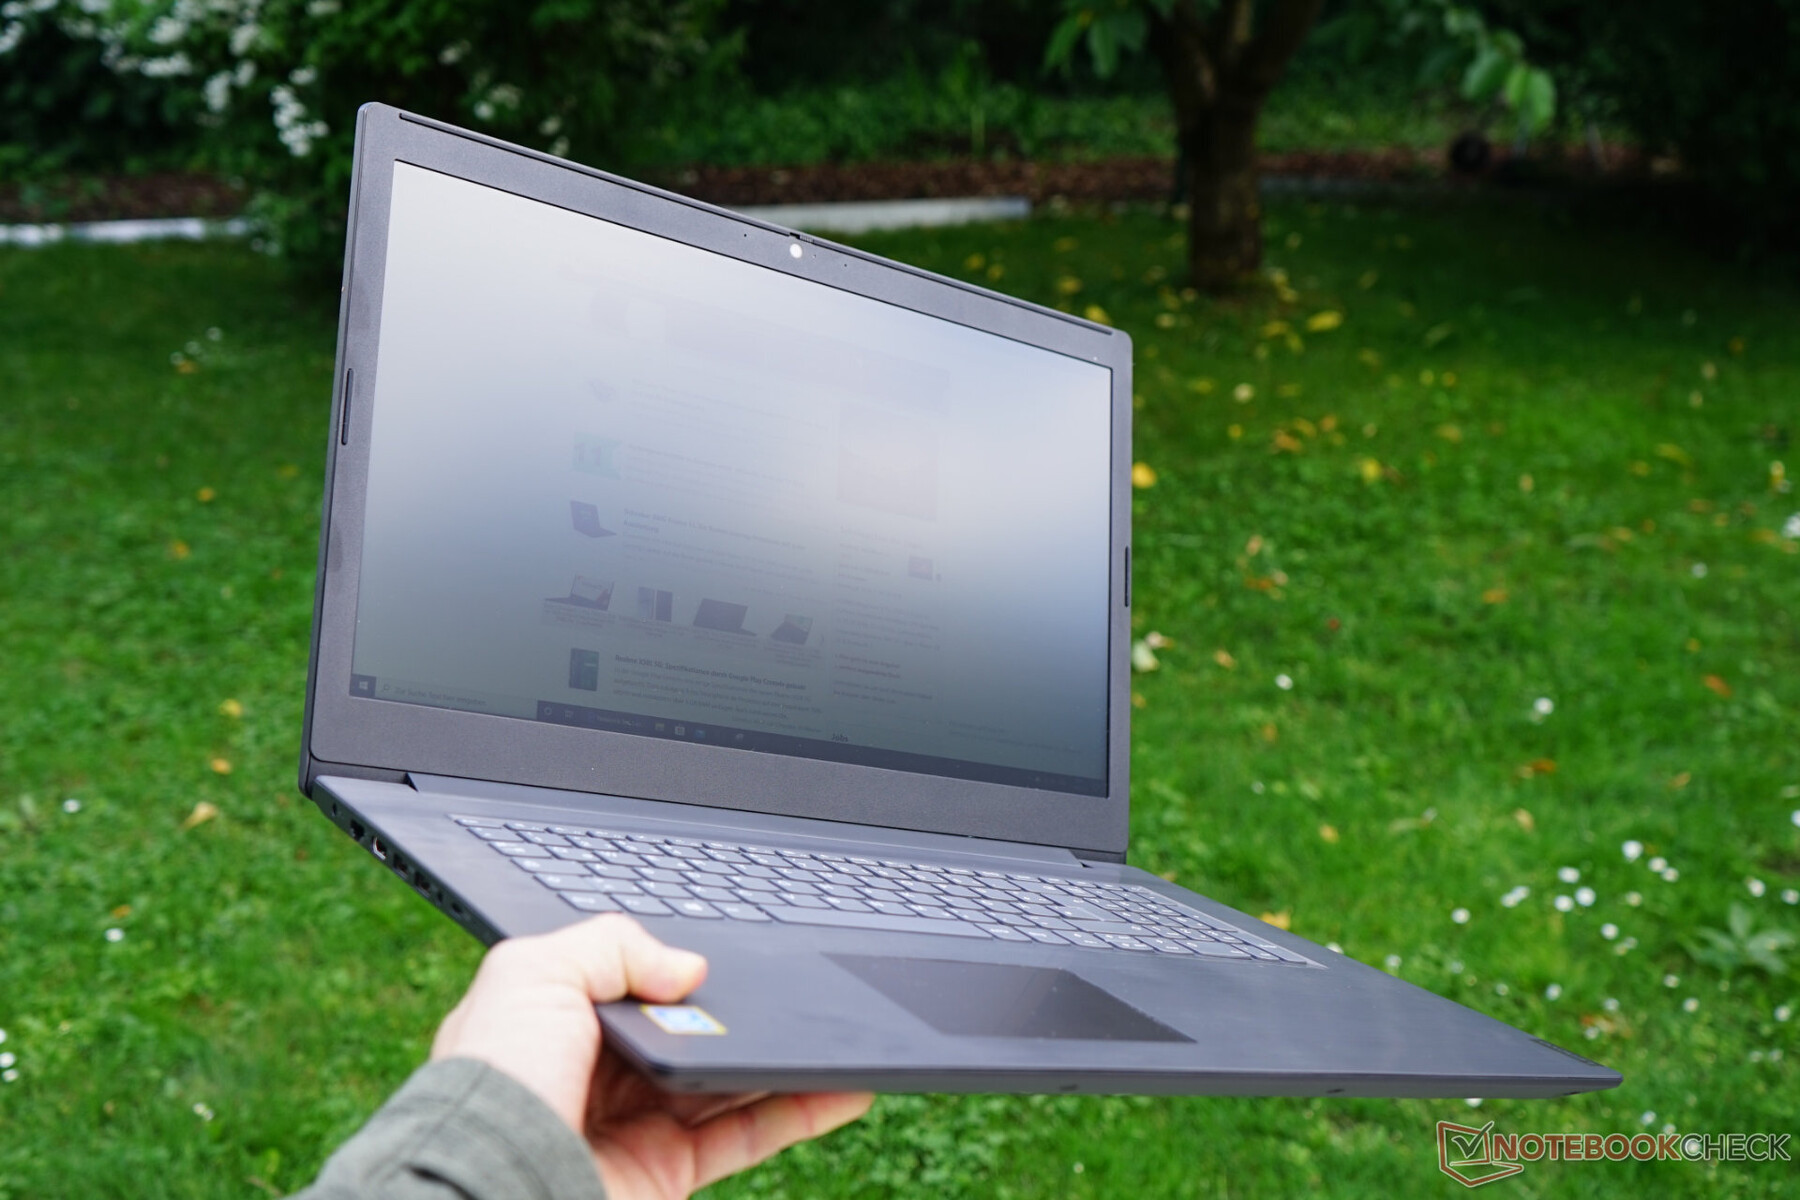
Lenovo has opted to use cheap plastic surfaces, which is common in this price range. While the feel of the base unit and the palm rests is good, the other surfaces make a cheap impression. The huge bezels are particularly noticeable. Lenovo has taken a plain approach when it comes to the design. The lid and the top of the base unit are supposed to imitate brushed aluminum. The result looks quite good. The tapered edges make the laptop appear thinner than it really is. While the chassis does not yield too easily under pressure, the lid is fairly susceptible to twisting. There is also some creaking when handling the device, although this should not come as a surprise considering the dimensions and the materials used.
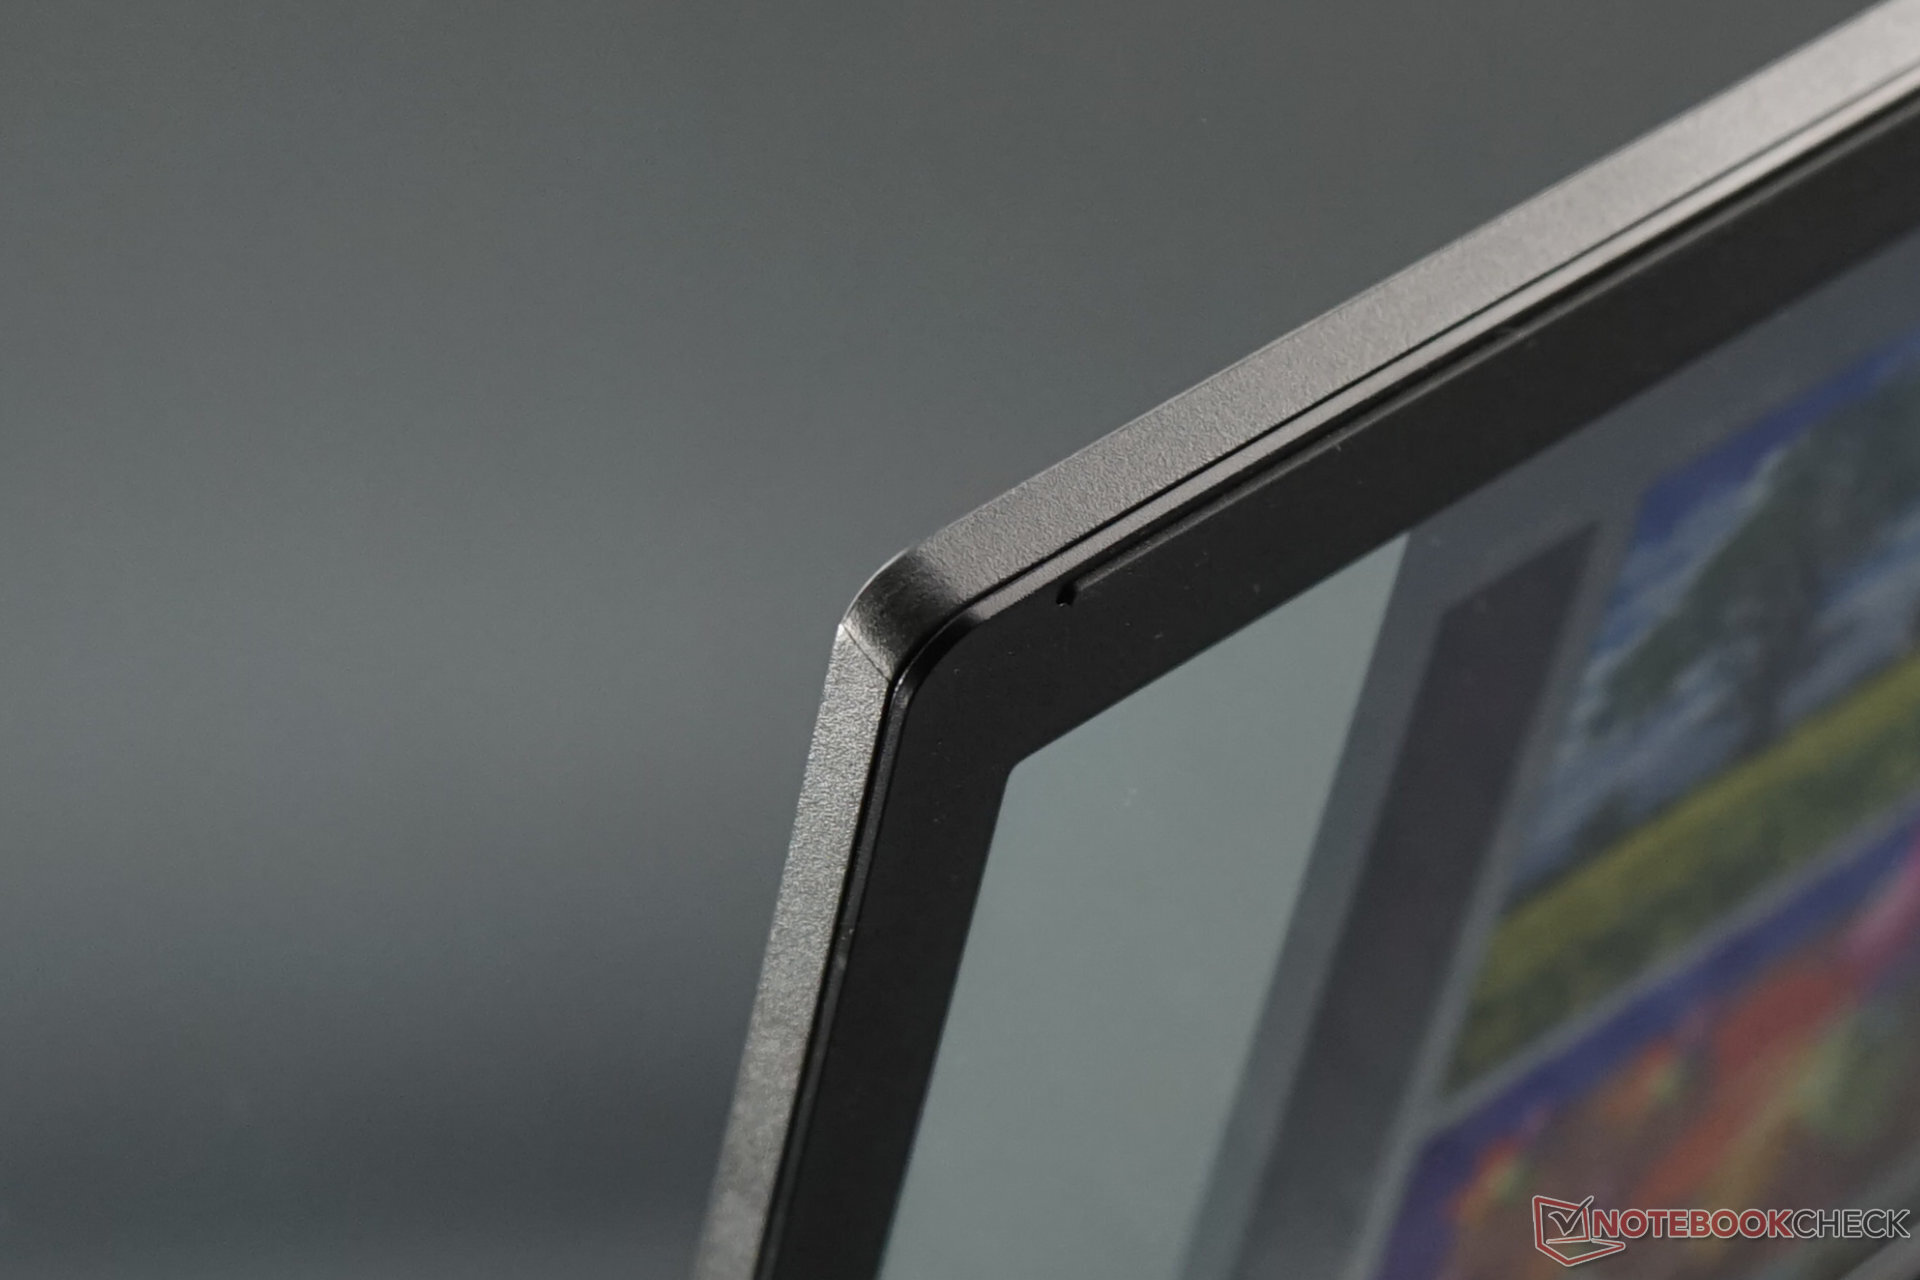
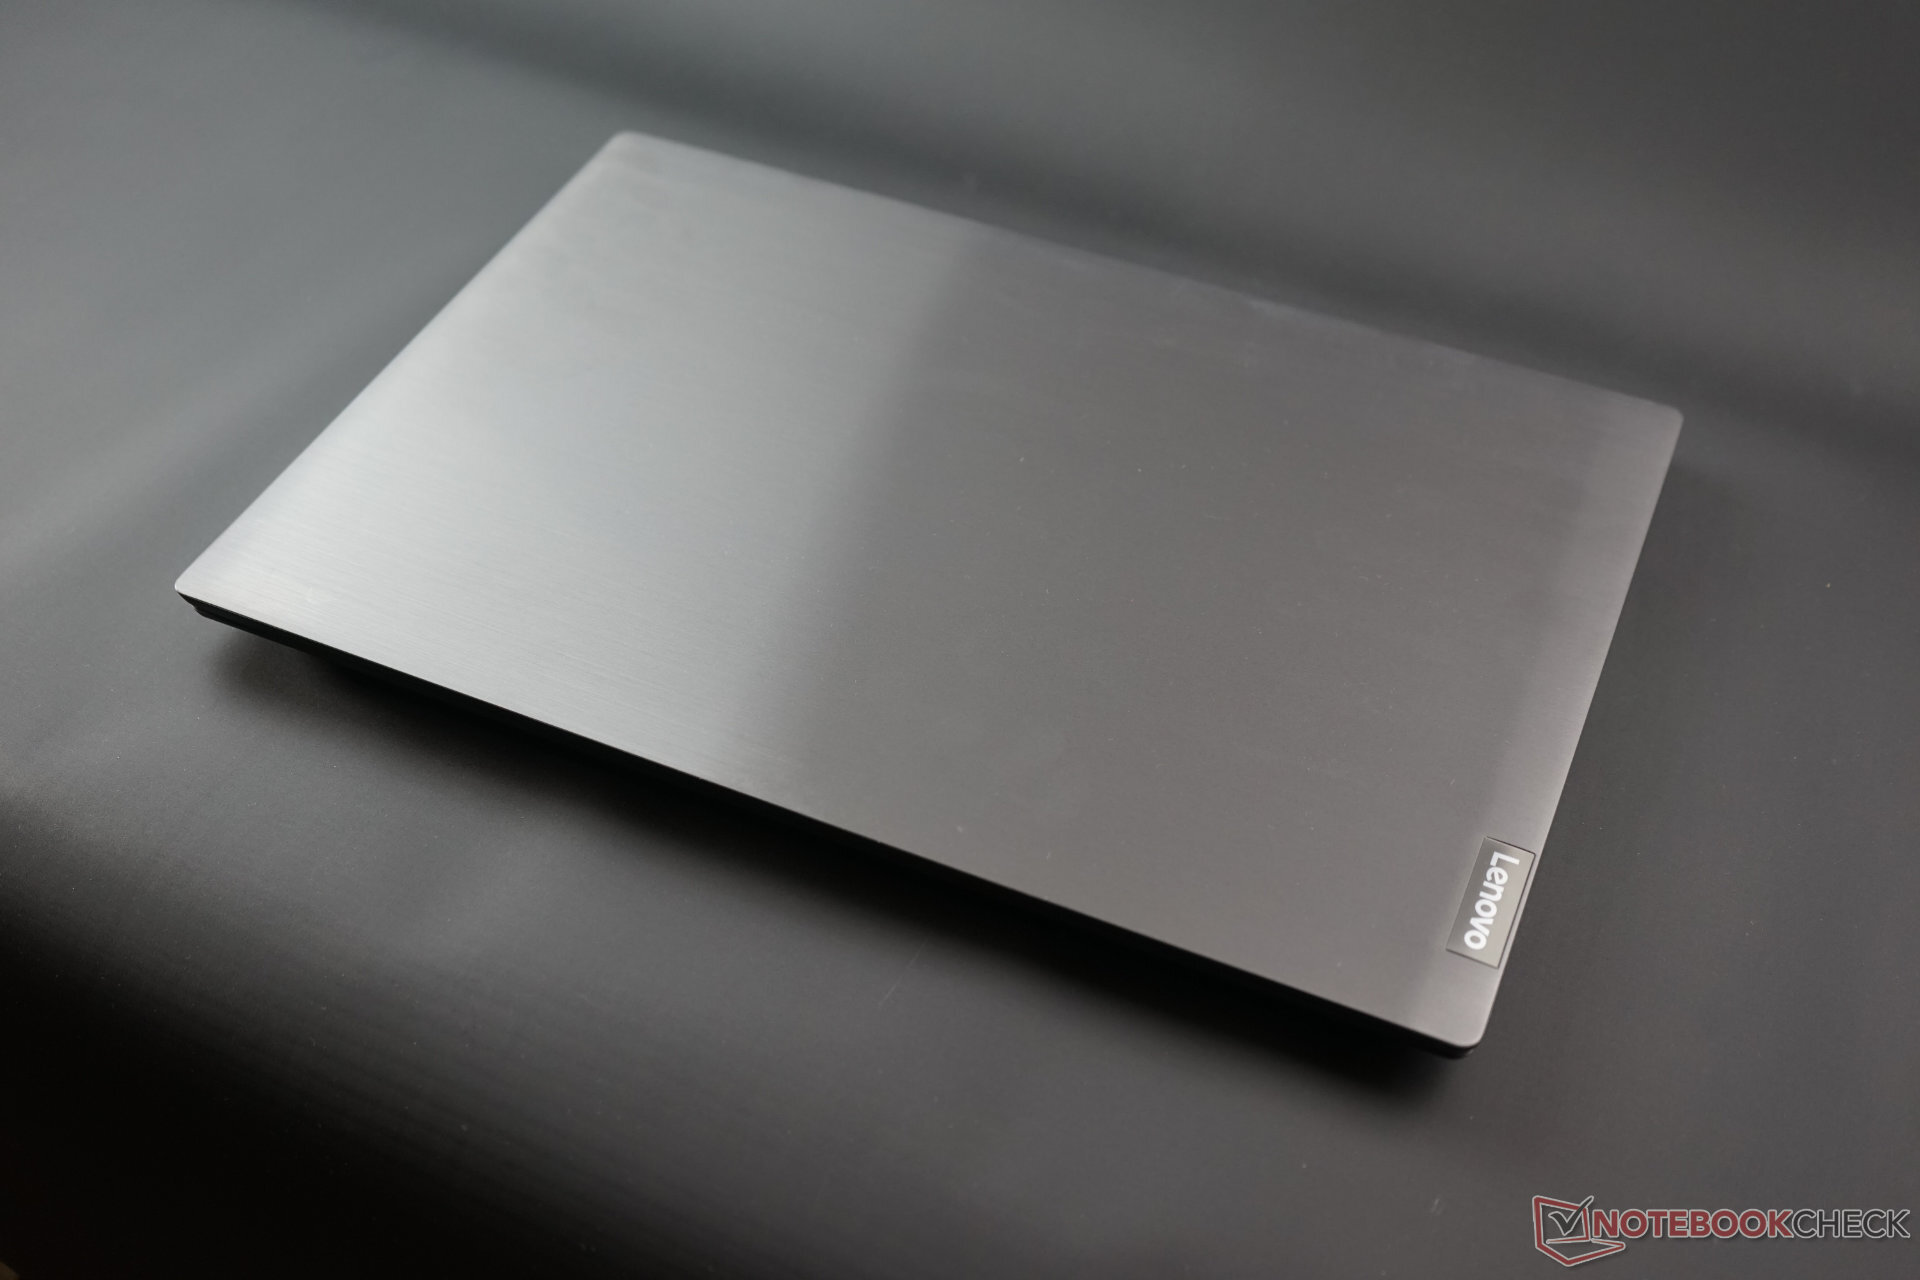
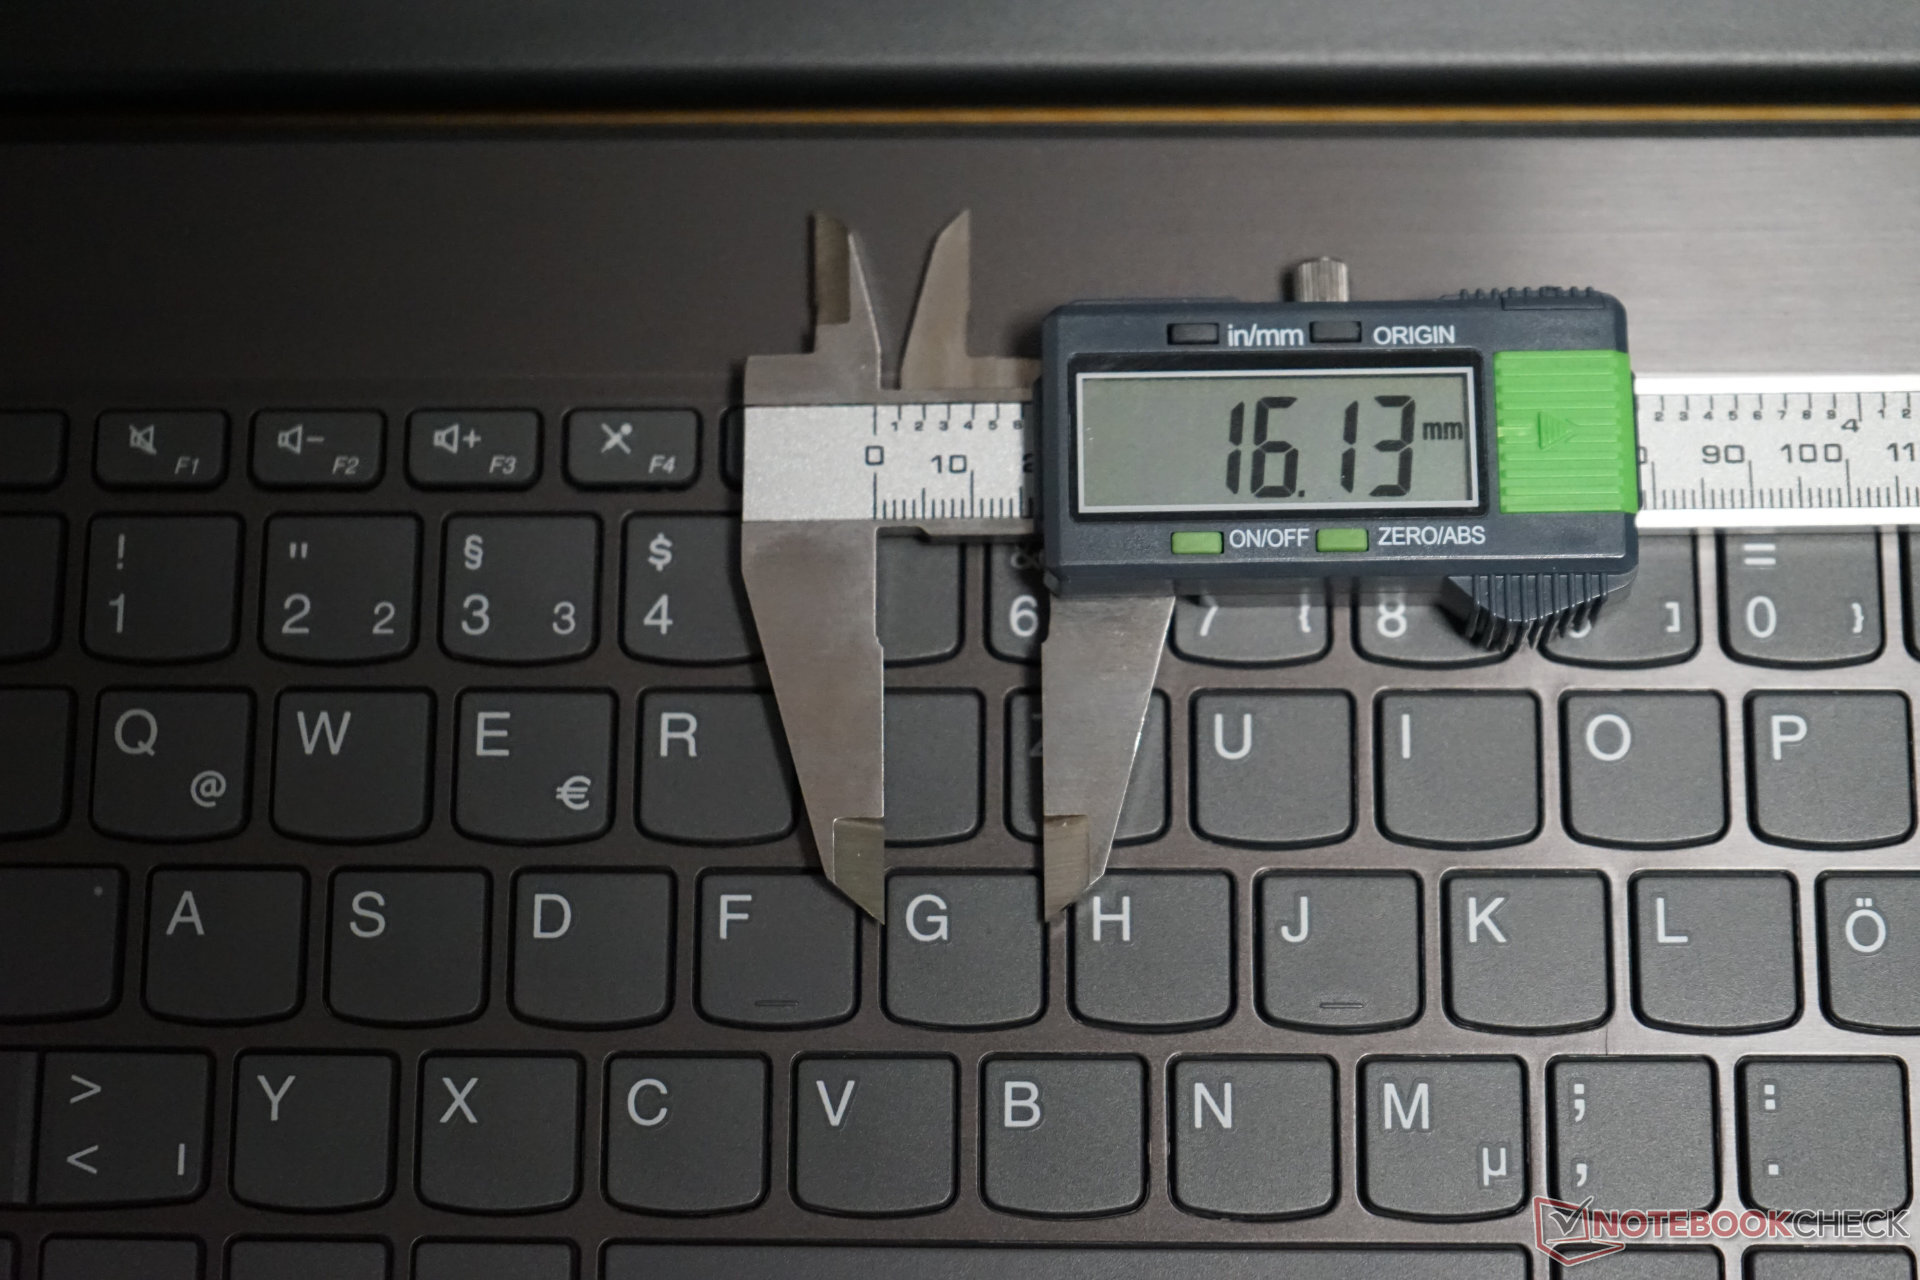
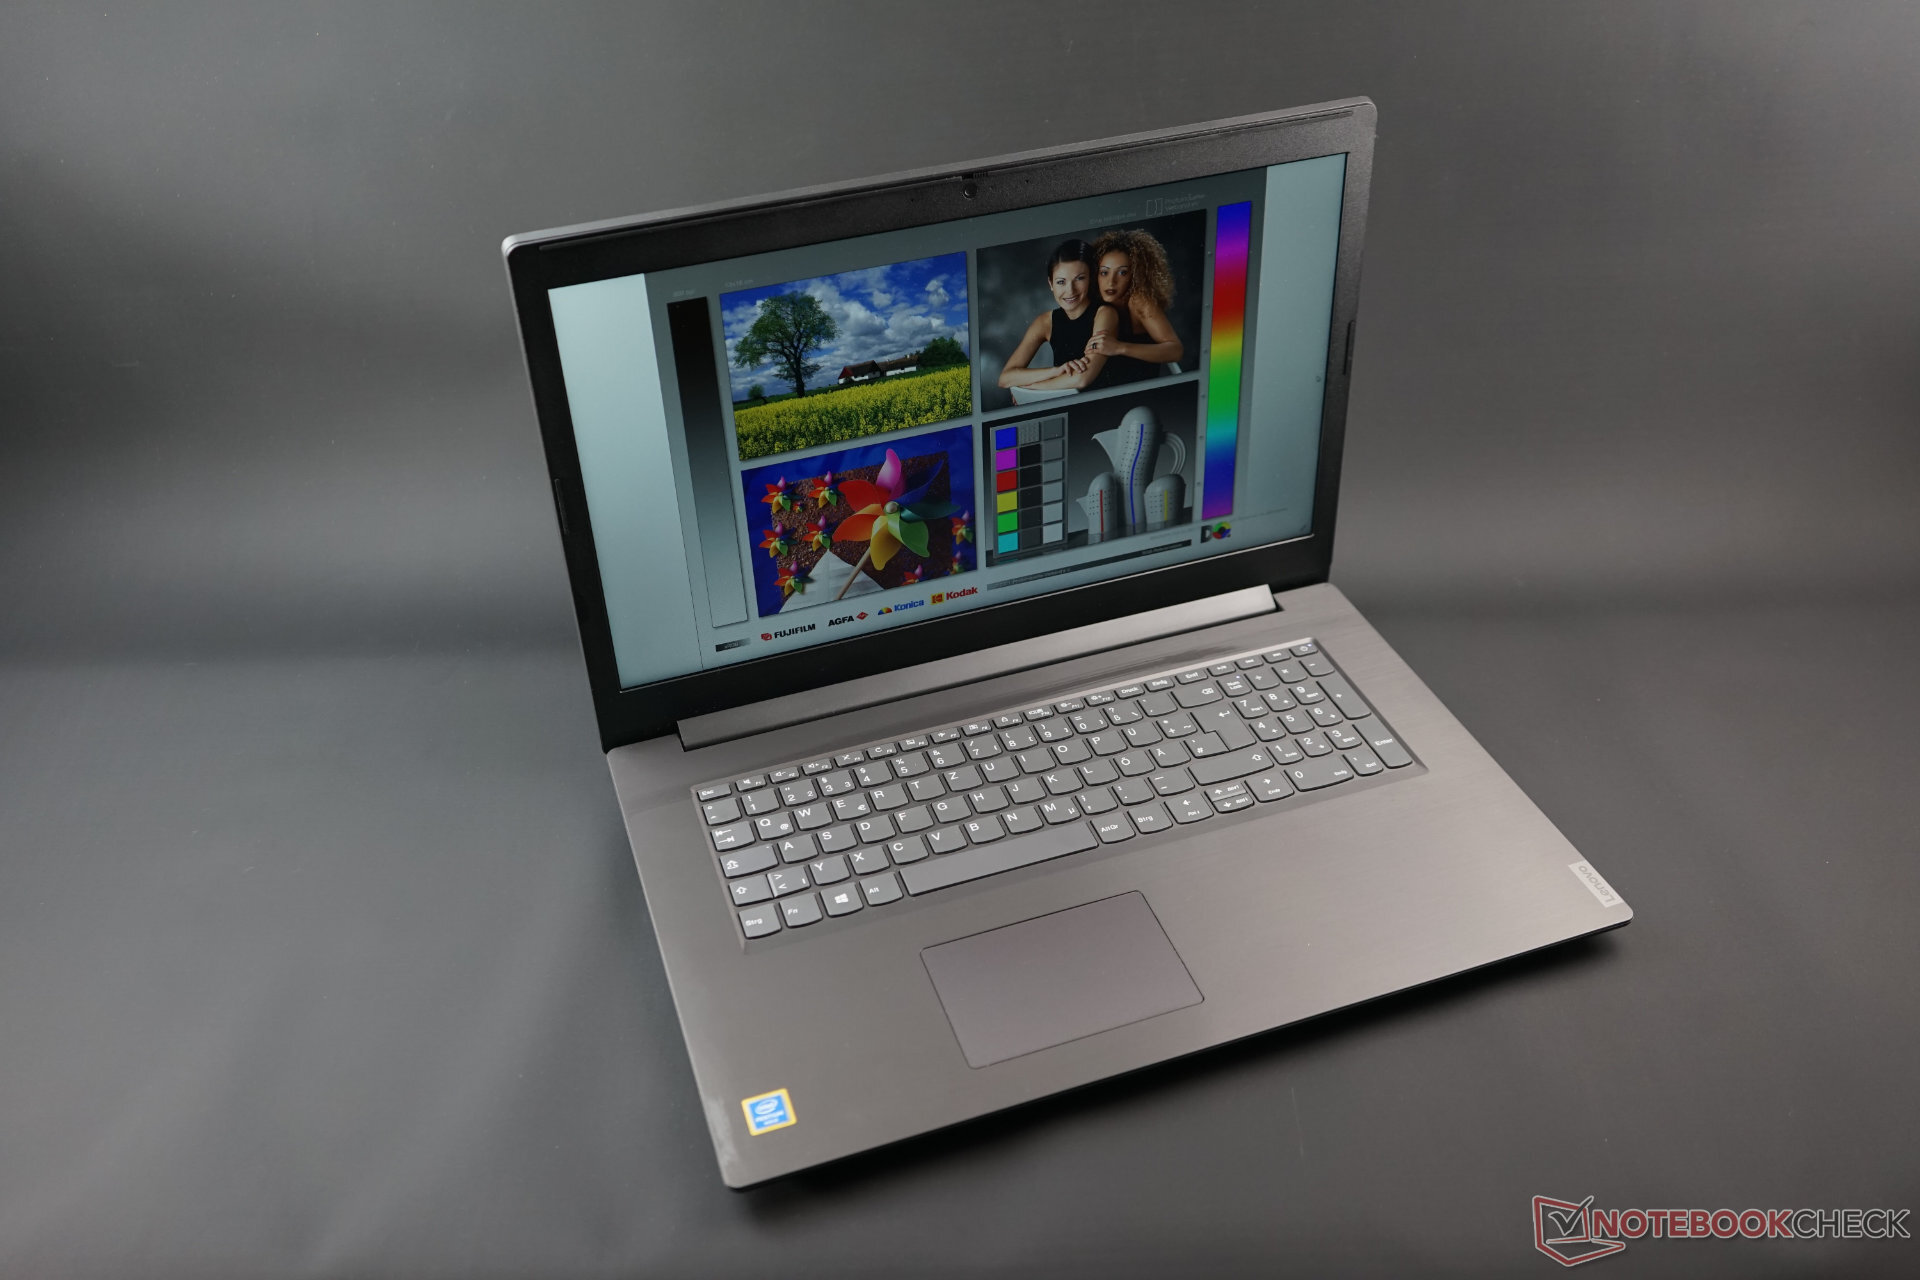
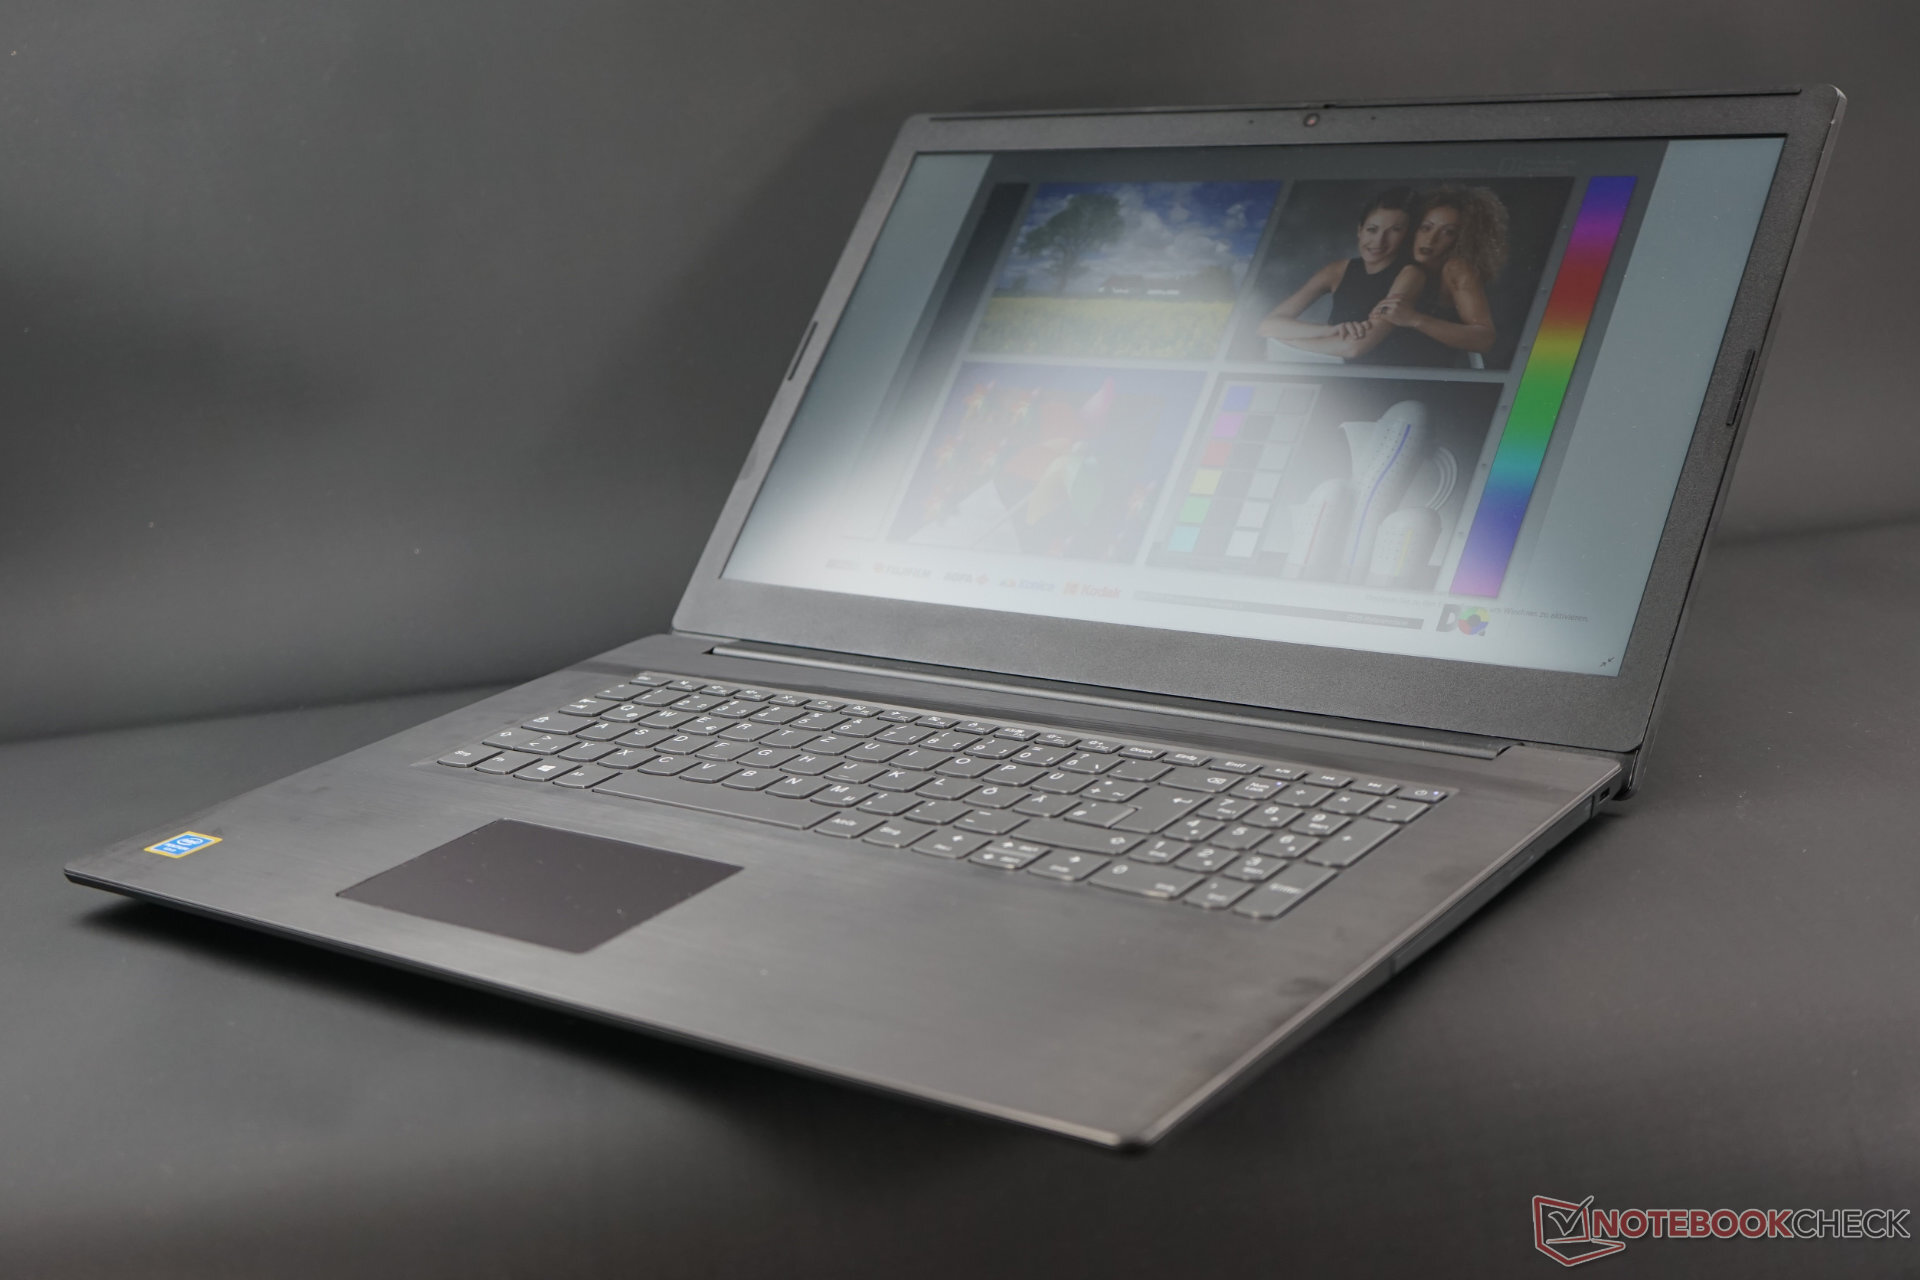
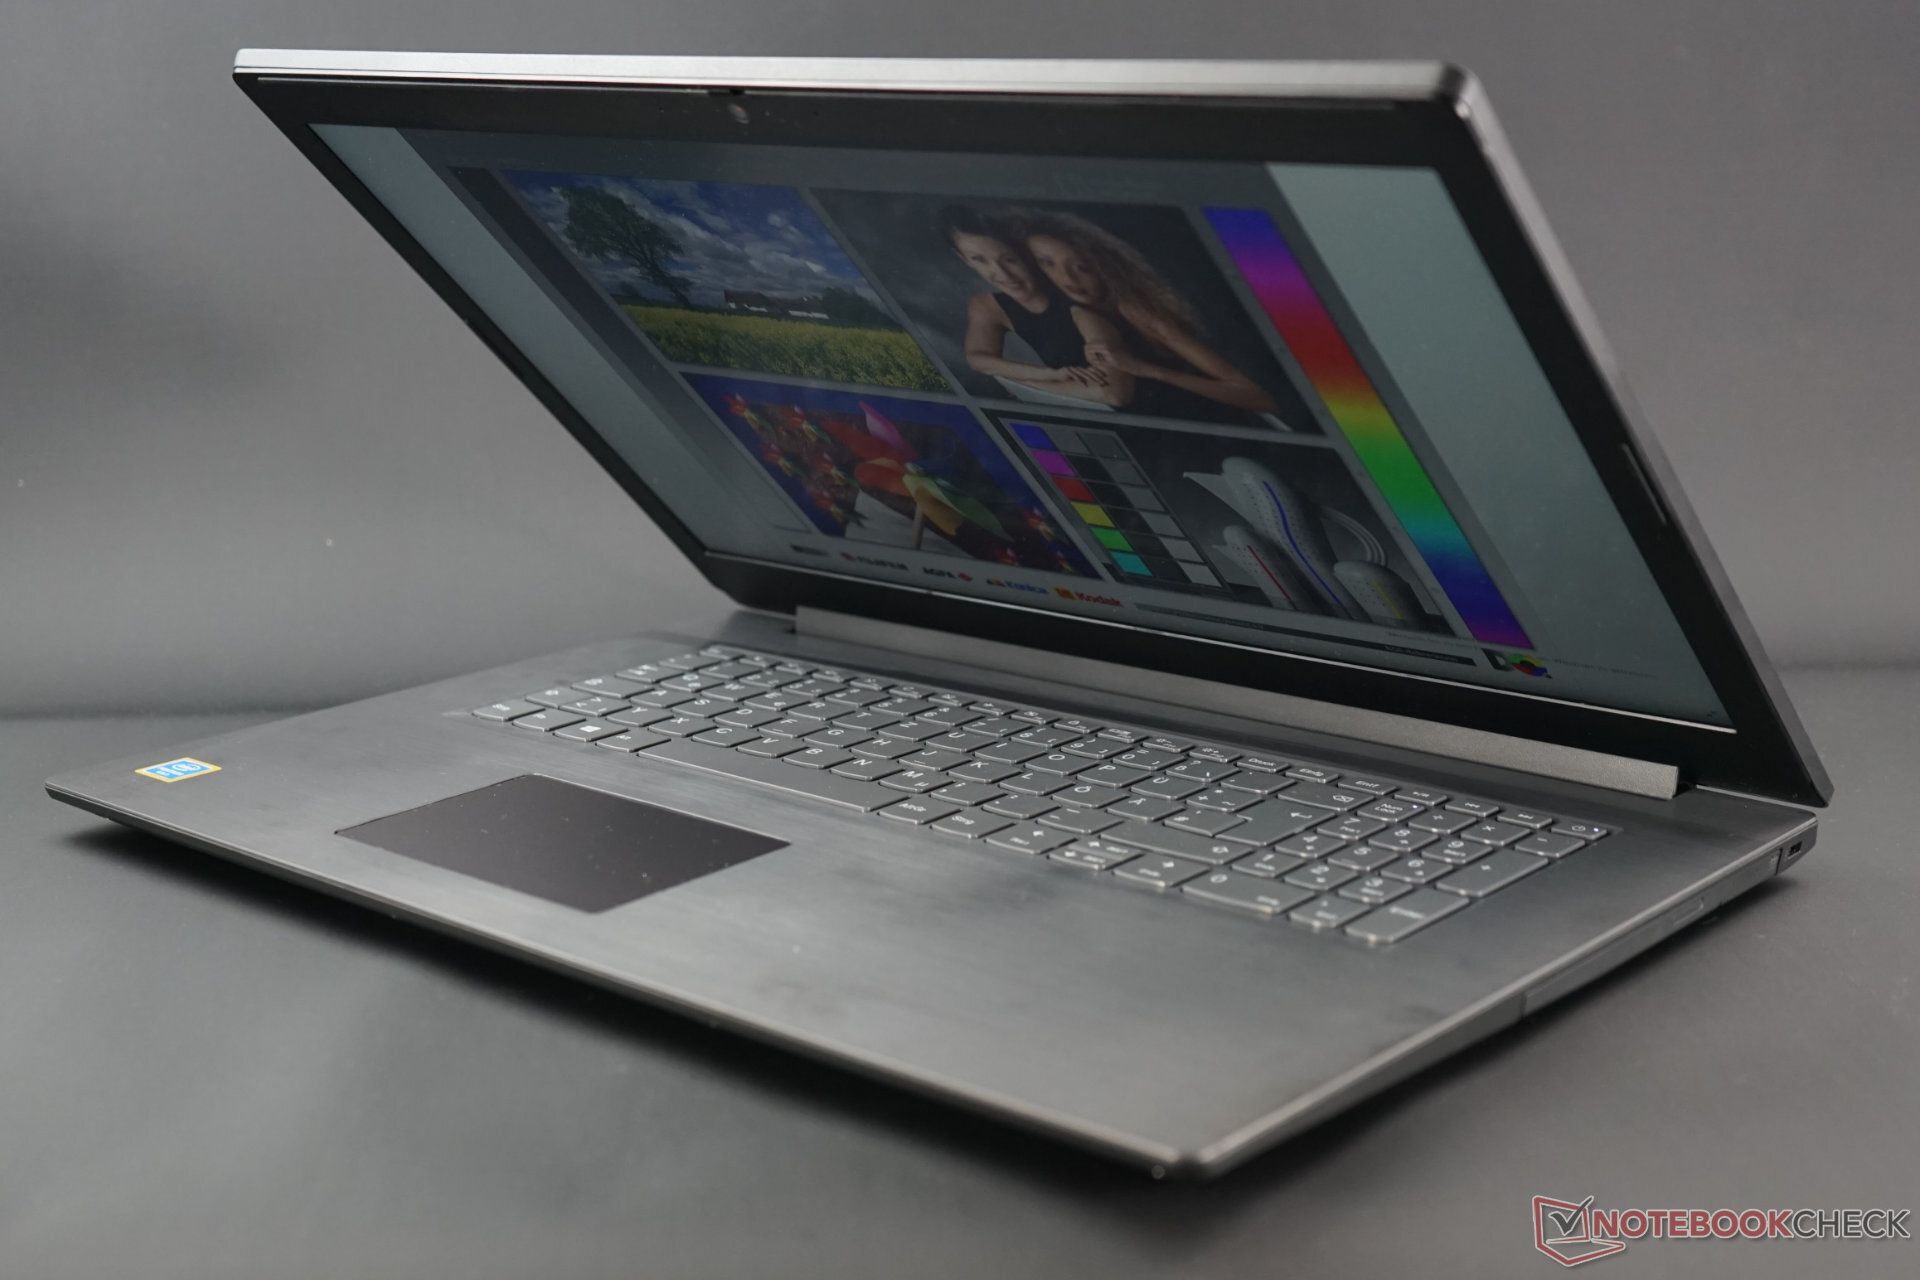
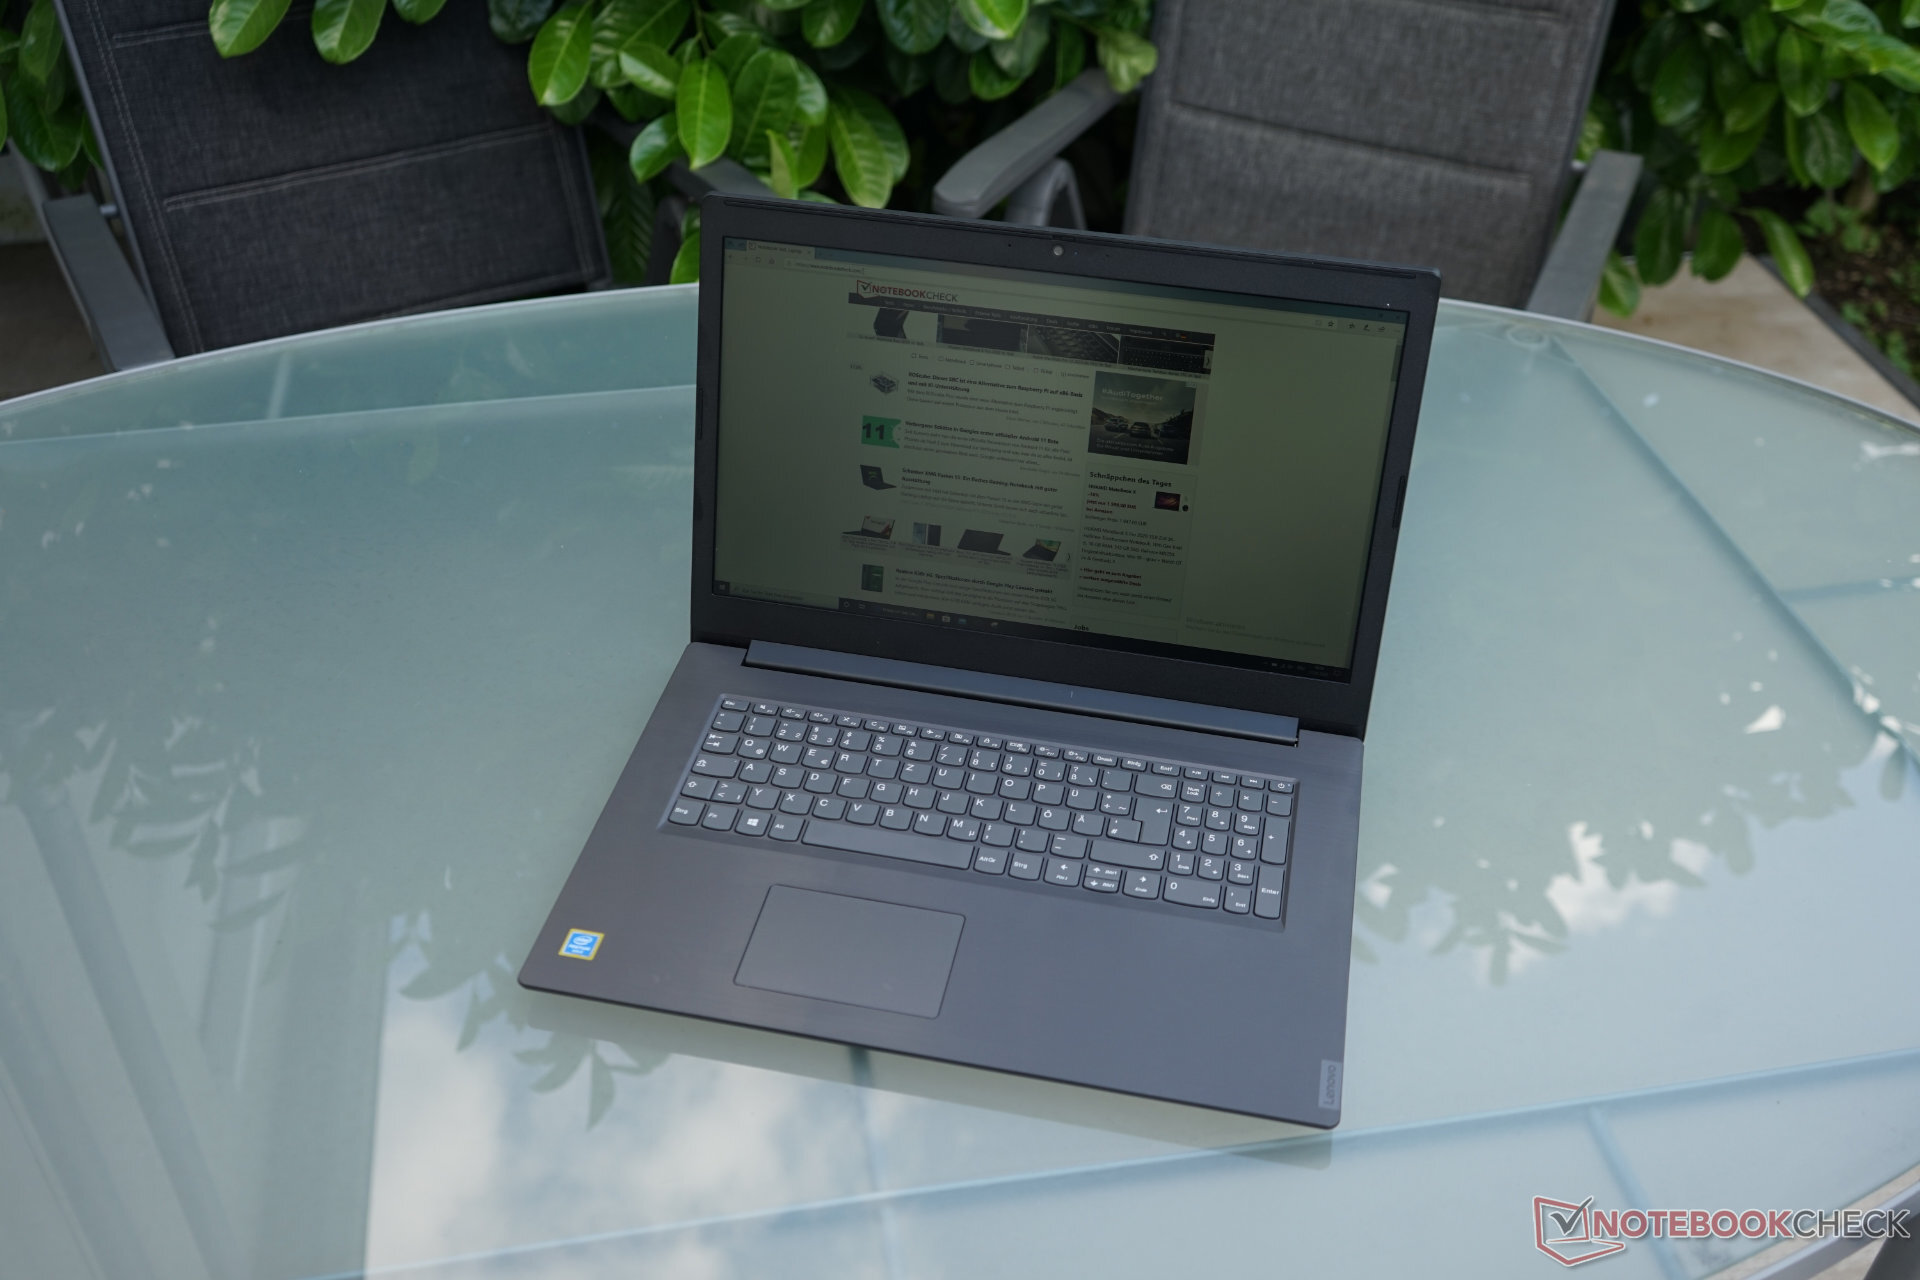
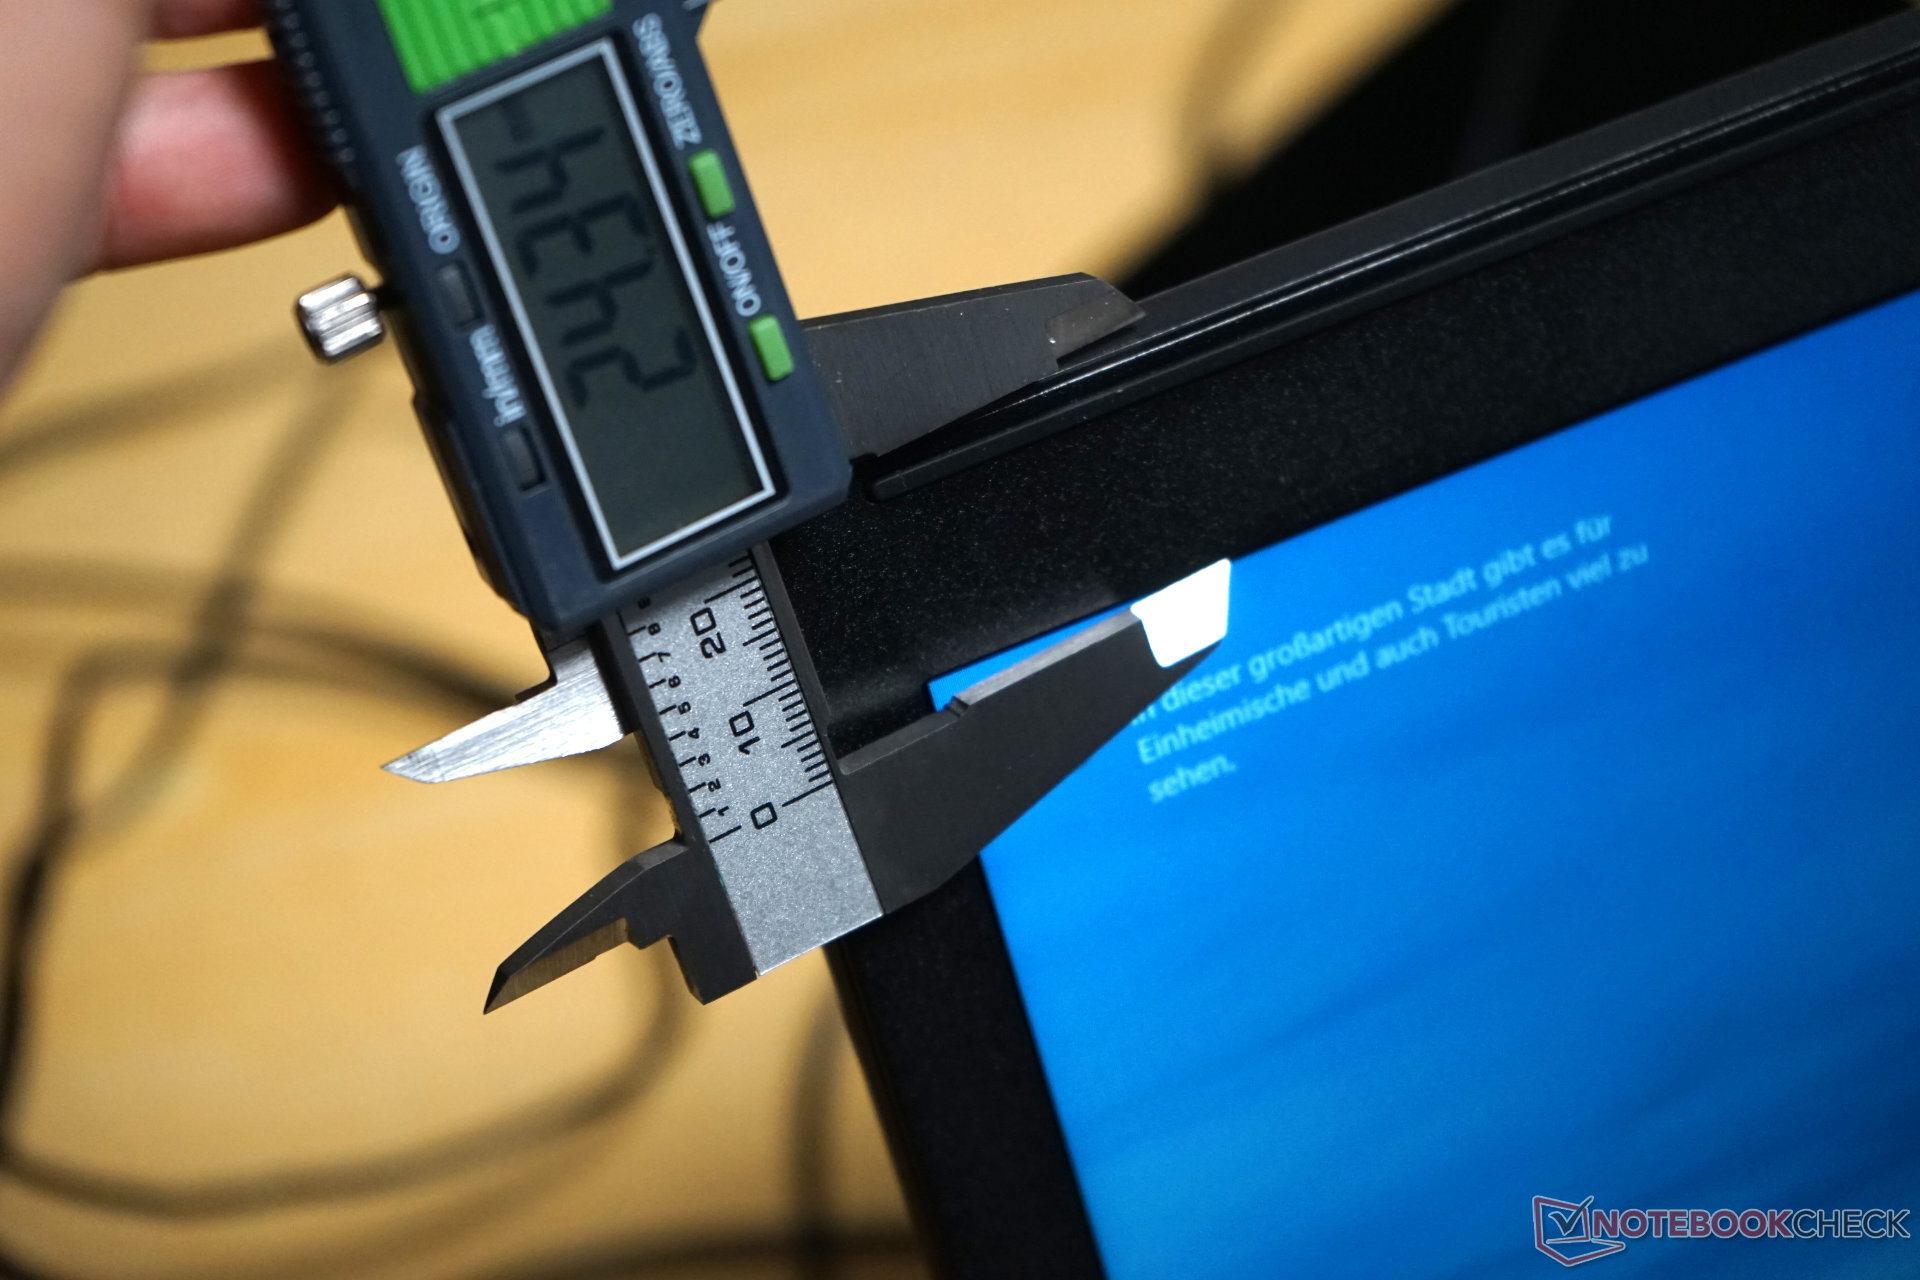
The dimensions are fairly similar to competing devices. That being said, the V340 is unlikely to win any screen-to-body awards due to its large display bezels and the integrated DVD drive and LAN port. As an example, the HP 17-ae143ng is lighter, thinner, and smaller.
Features
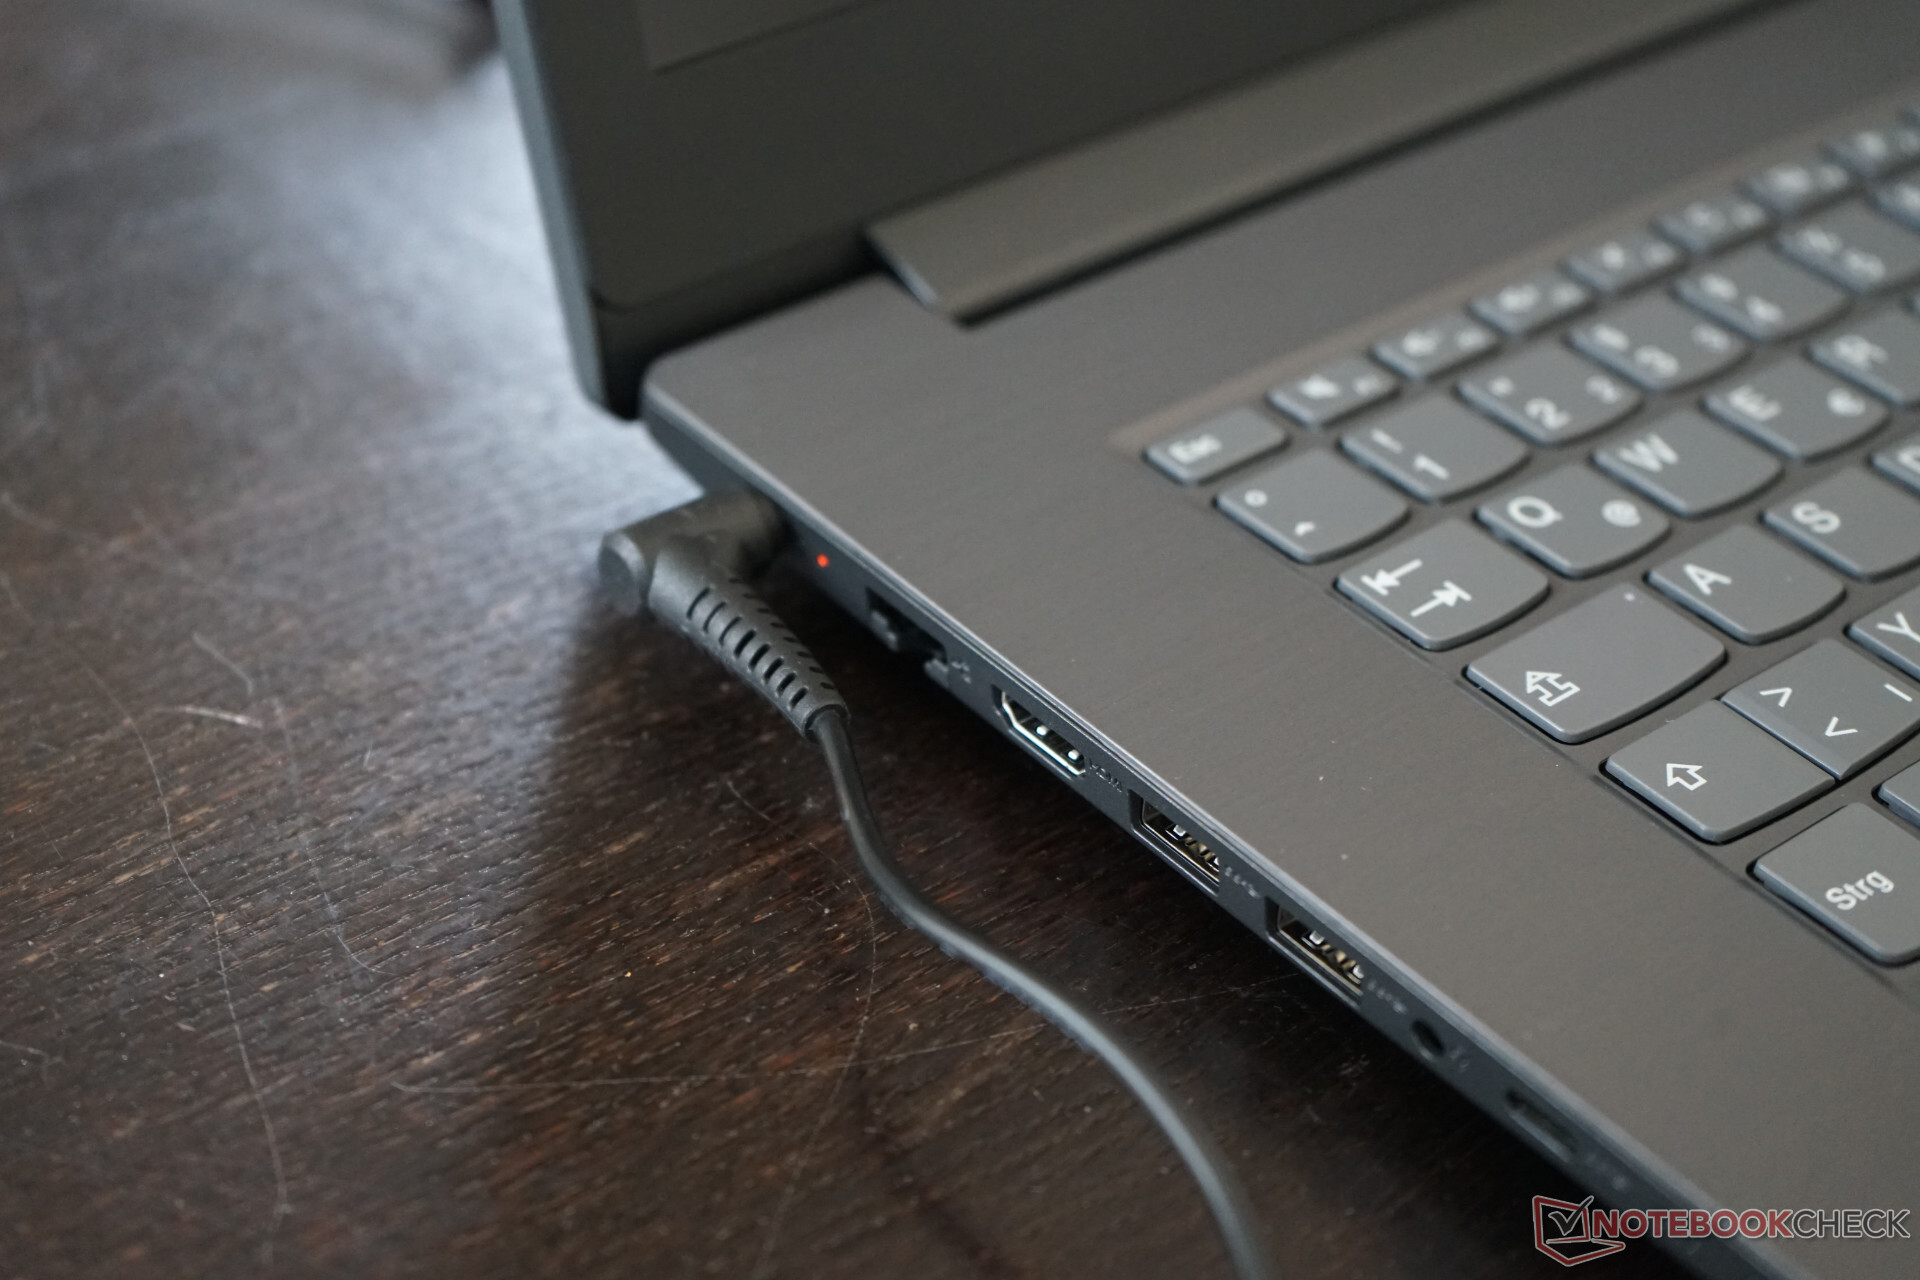
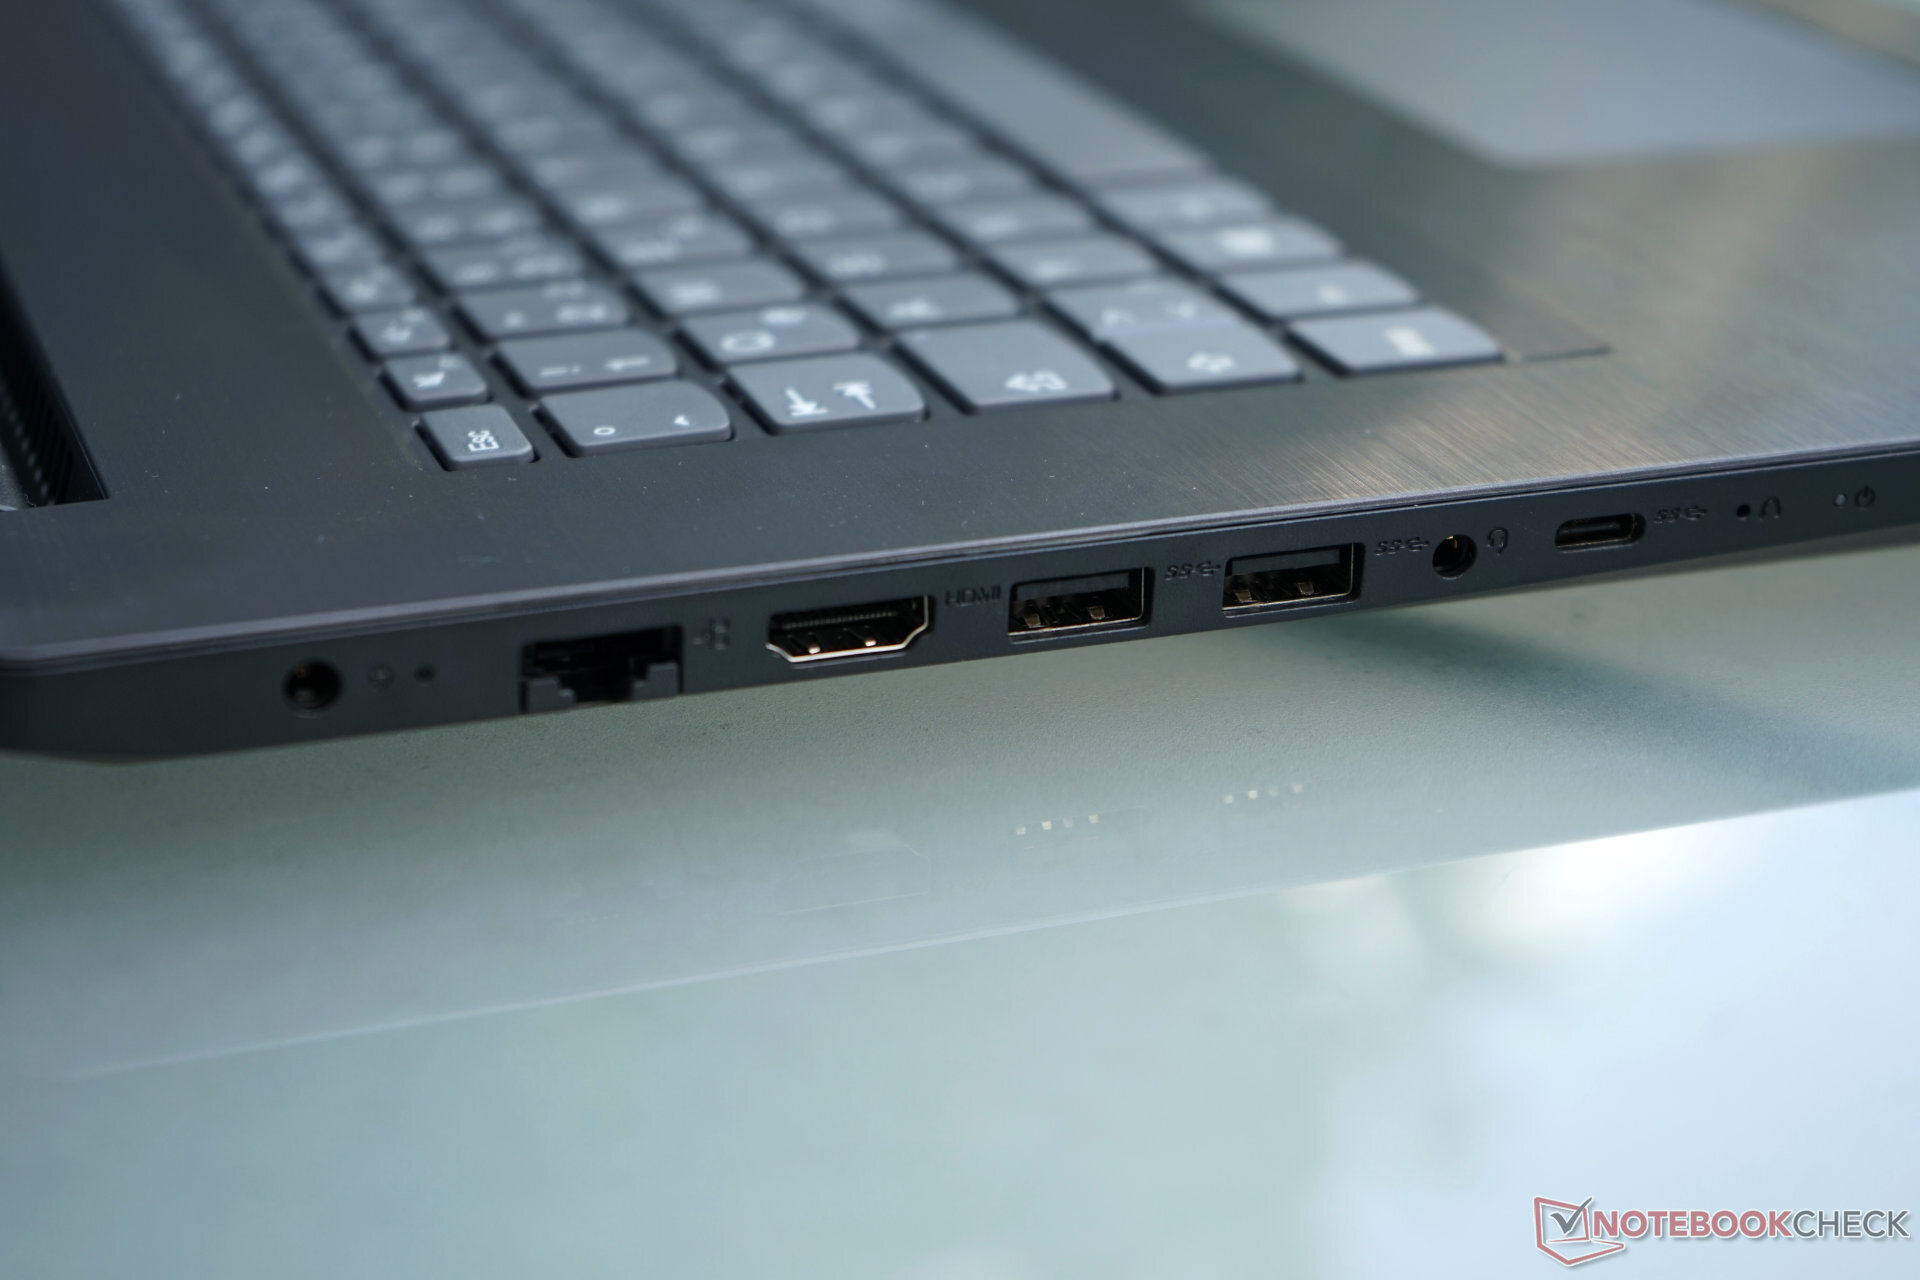
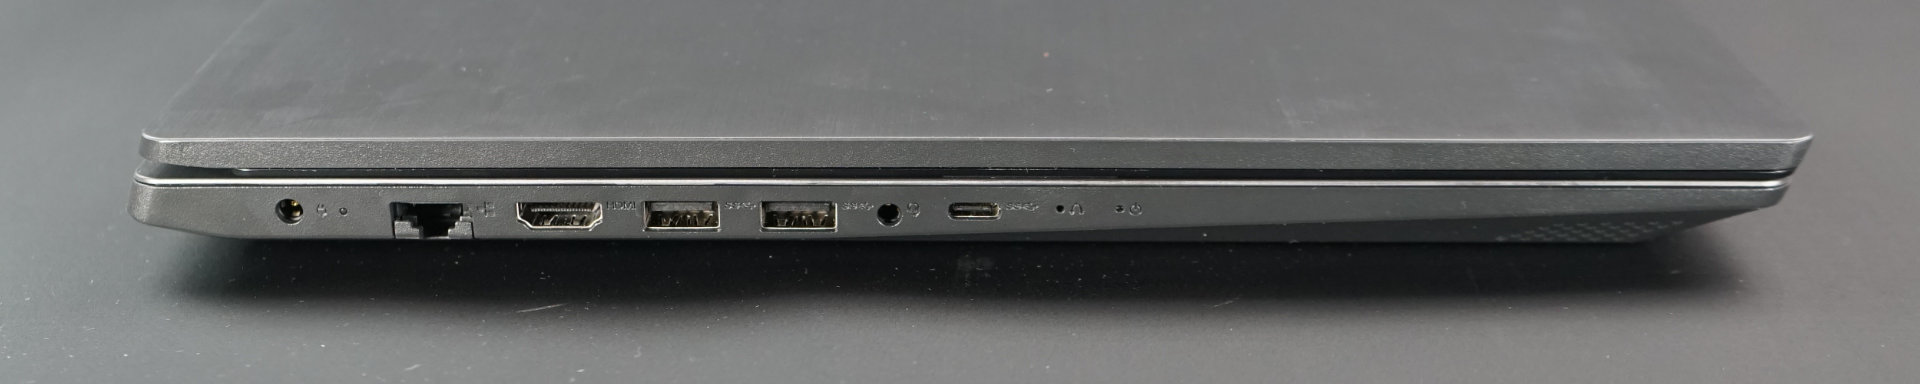
Lenovo offers a fairly average port selection. A physical LAN port is the most extraordinary feature. By contrast, the USB Type-C port only supports the minimum possible speeds (USB 3.0). There is no Power Delivery, DisplayPort or Thunderbolt functionality. In our test, even the HDMI port was only able to deliver up to 4K at 30 Hz.
Communications
The integrated Qualcomm Wi-Fi card is an entry-level module with just one antenna (1x1) and 802.11ac (Wi-Fi 5) compatibility. Furthermore, the integrated chip supports Bluetooth 5.0 + HS. While it should come as no surprise that the Wi-Fi performance is relatively weak, it is fairly good compared to other devices with the QCA9377 (the internal antenna appears to have been placed in a good location). During our tests, the connection was consistently stable, although the range certainly does not come close to high-end solutions. Modern 3x3 Wi-Fi 6 cards leave this Qualcomm Wi-Fi card in the dust.
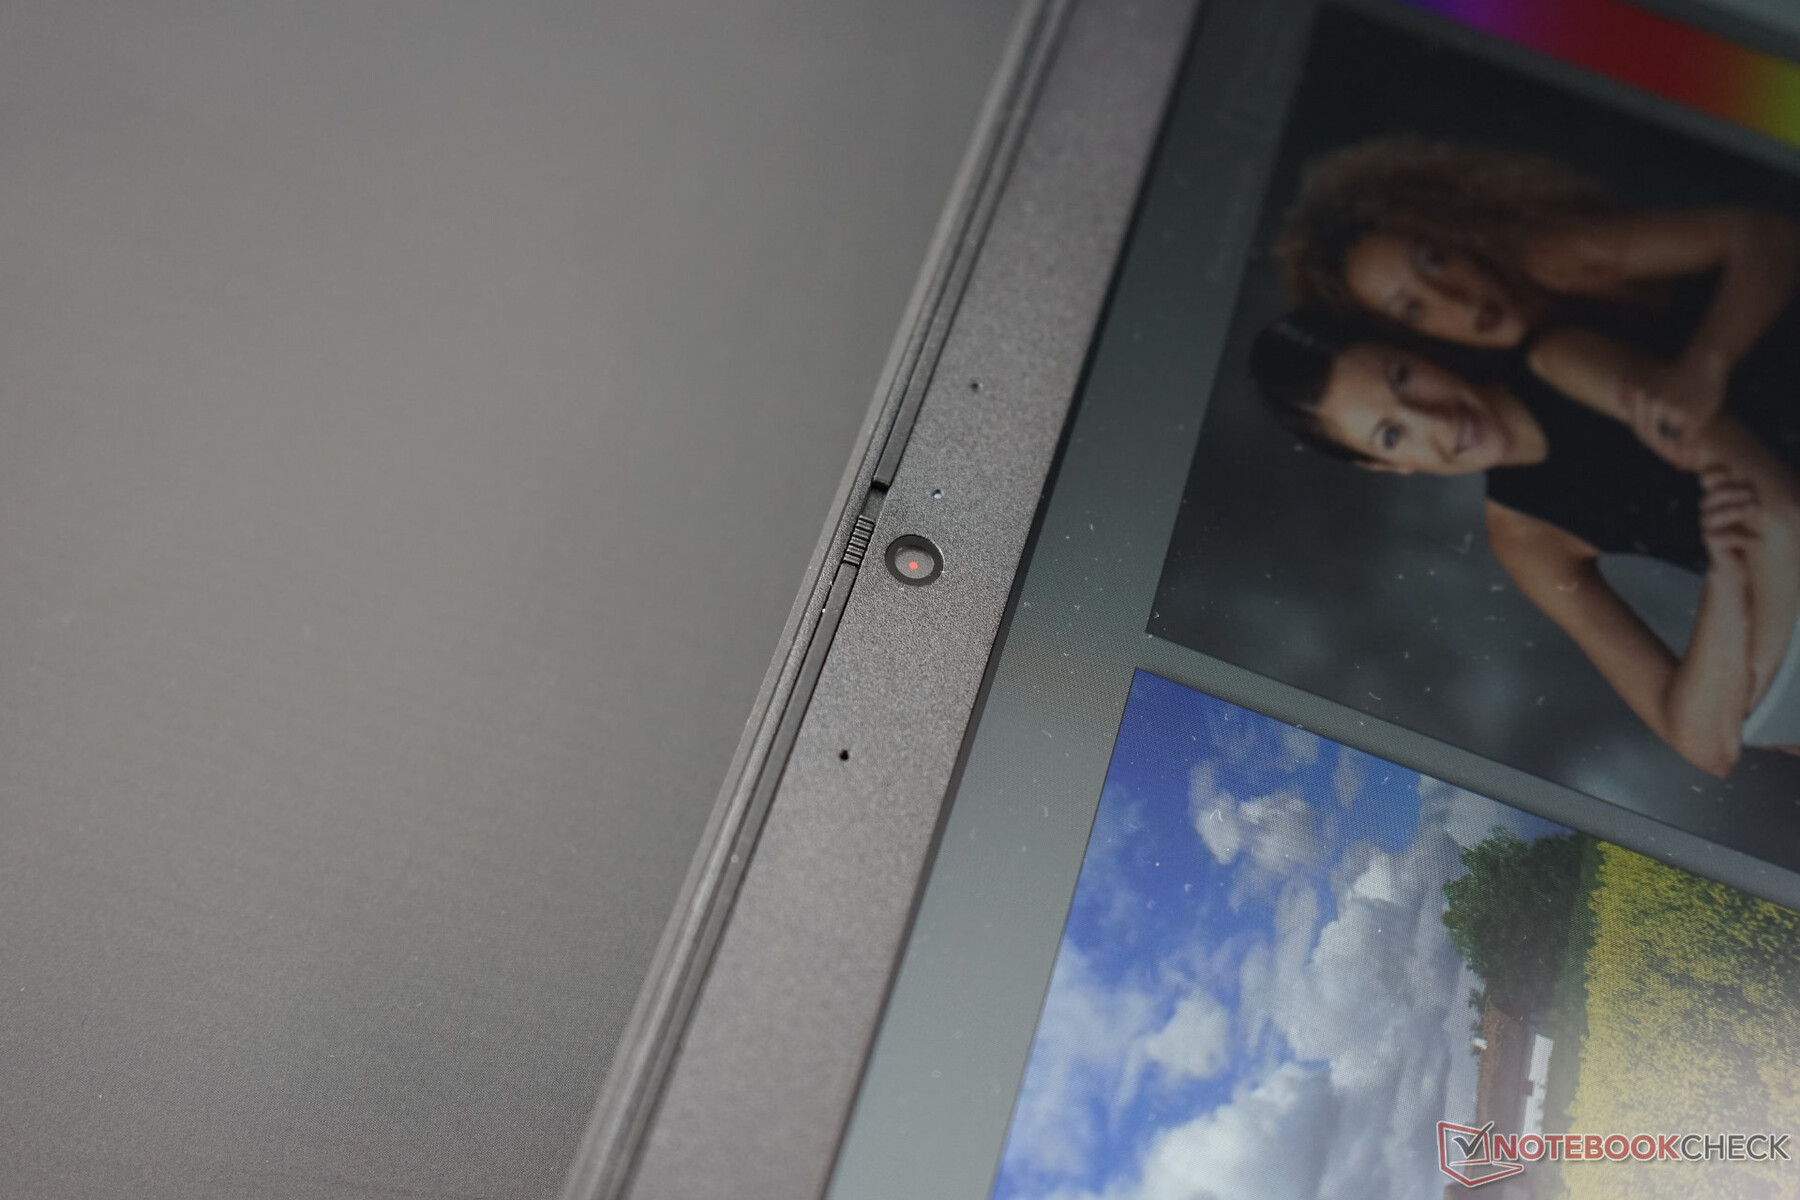
Webcam
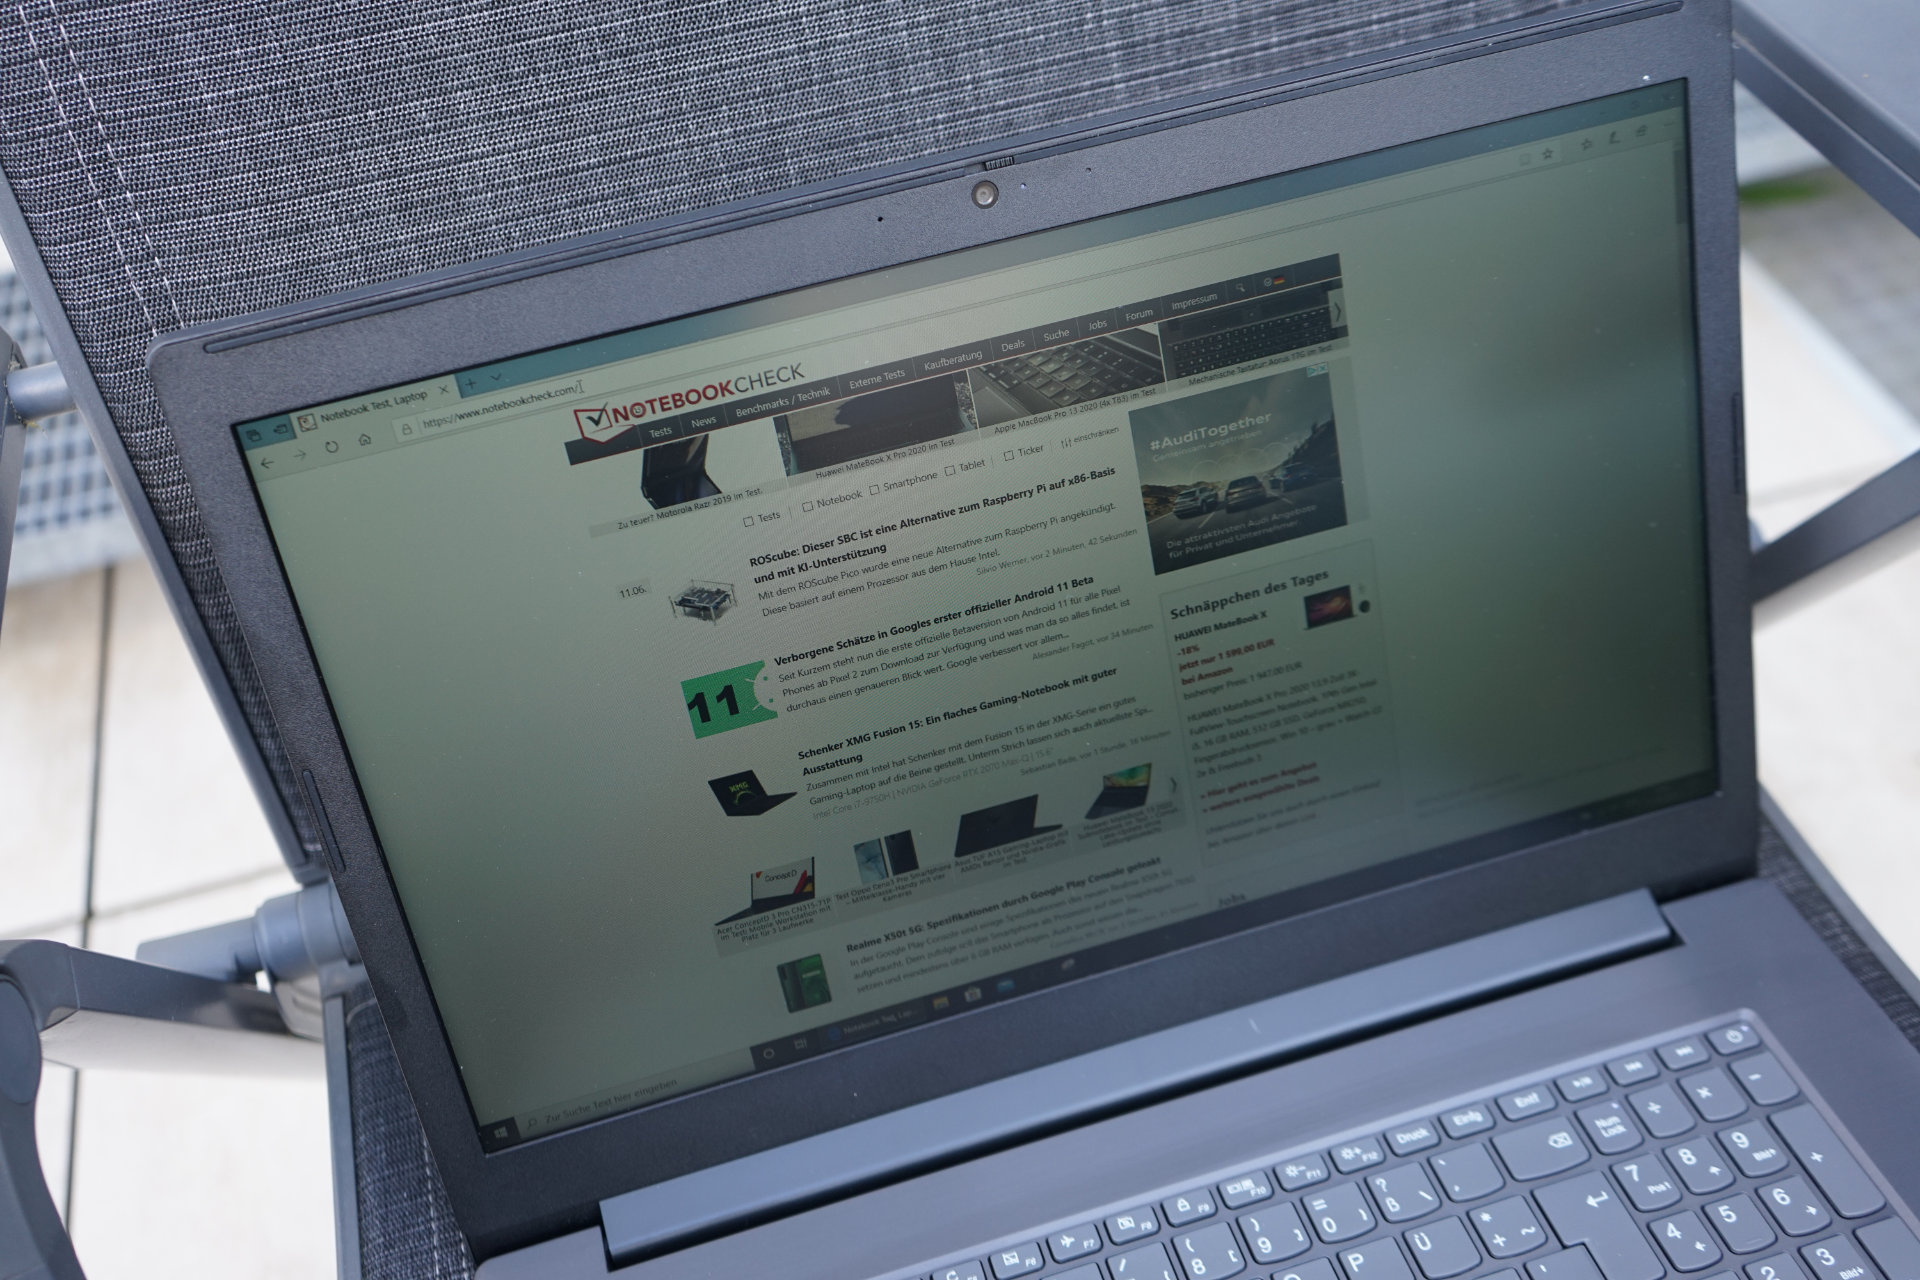
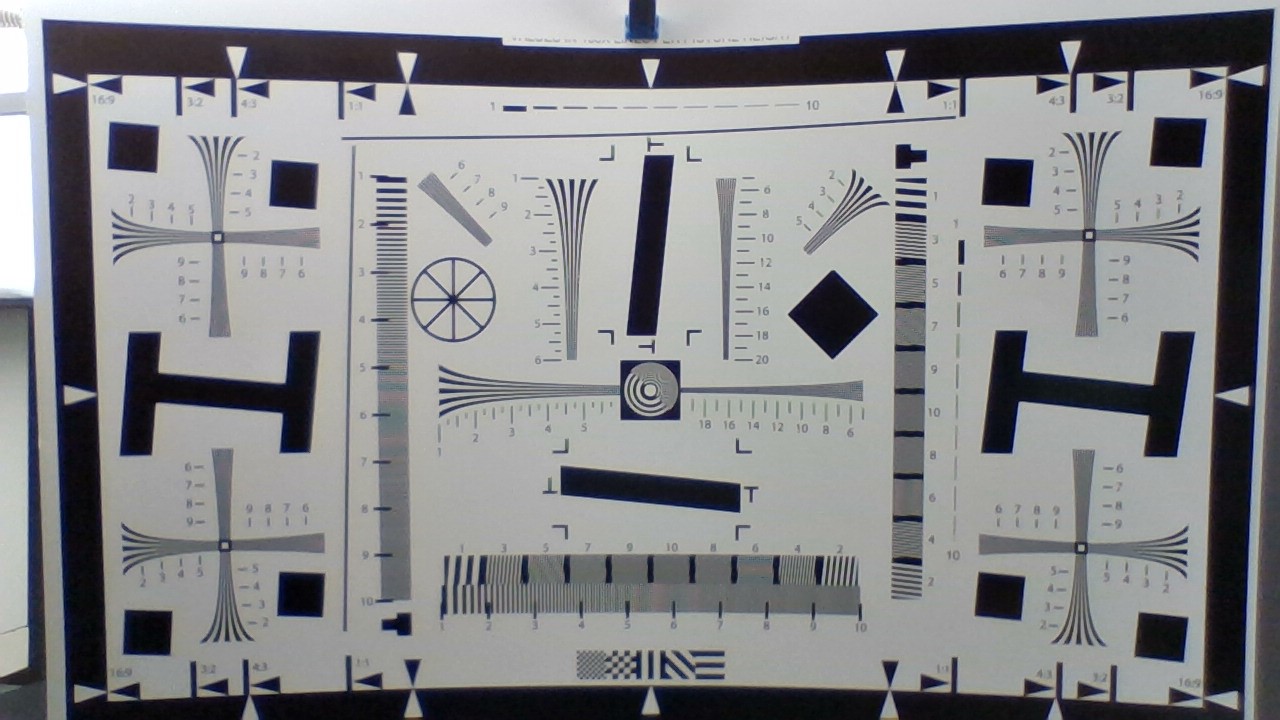
Unsurprisingly, the integrated webcam only achieves average results, making it suitable for simple video conferences. The manual button for covering the webcam is nice extra.


Accessories
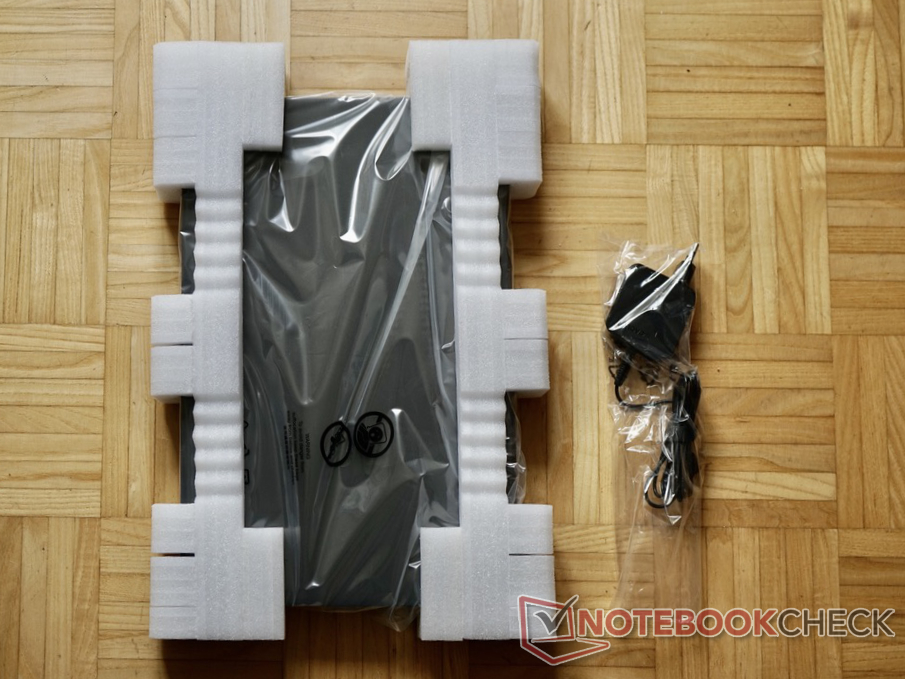
There are not many accessories included with the Lenovo V340. Aside from the AC adapter, there are only two relatively worthless pamphlets that explain basic functionality. There is a QR code, which only leads to a generic help page instead of showing the drivers necessary for our device that comes with Free DOS ex-factory. However, an up-to-date Windows 10 installation already includes all the necessary drivers and we found an additional update utility on Lenovo's homepage for updating the BIOS to the latest version as well as installing customized graphics drivers.
Maintenance
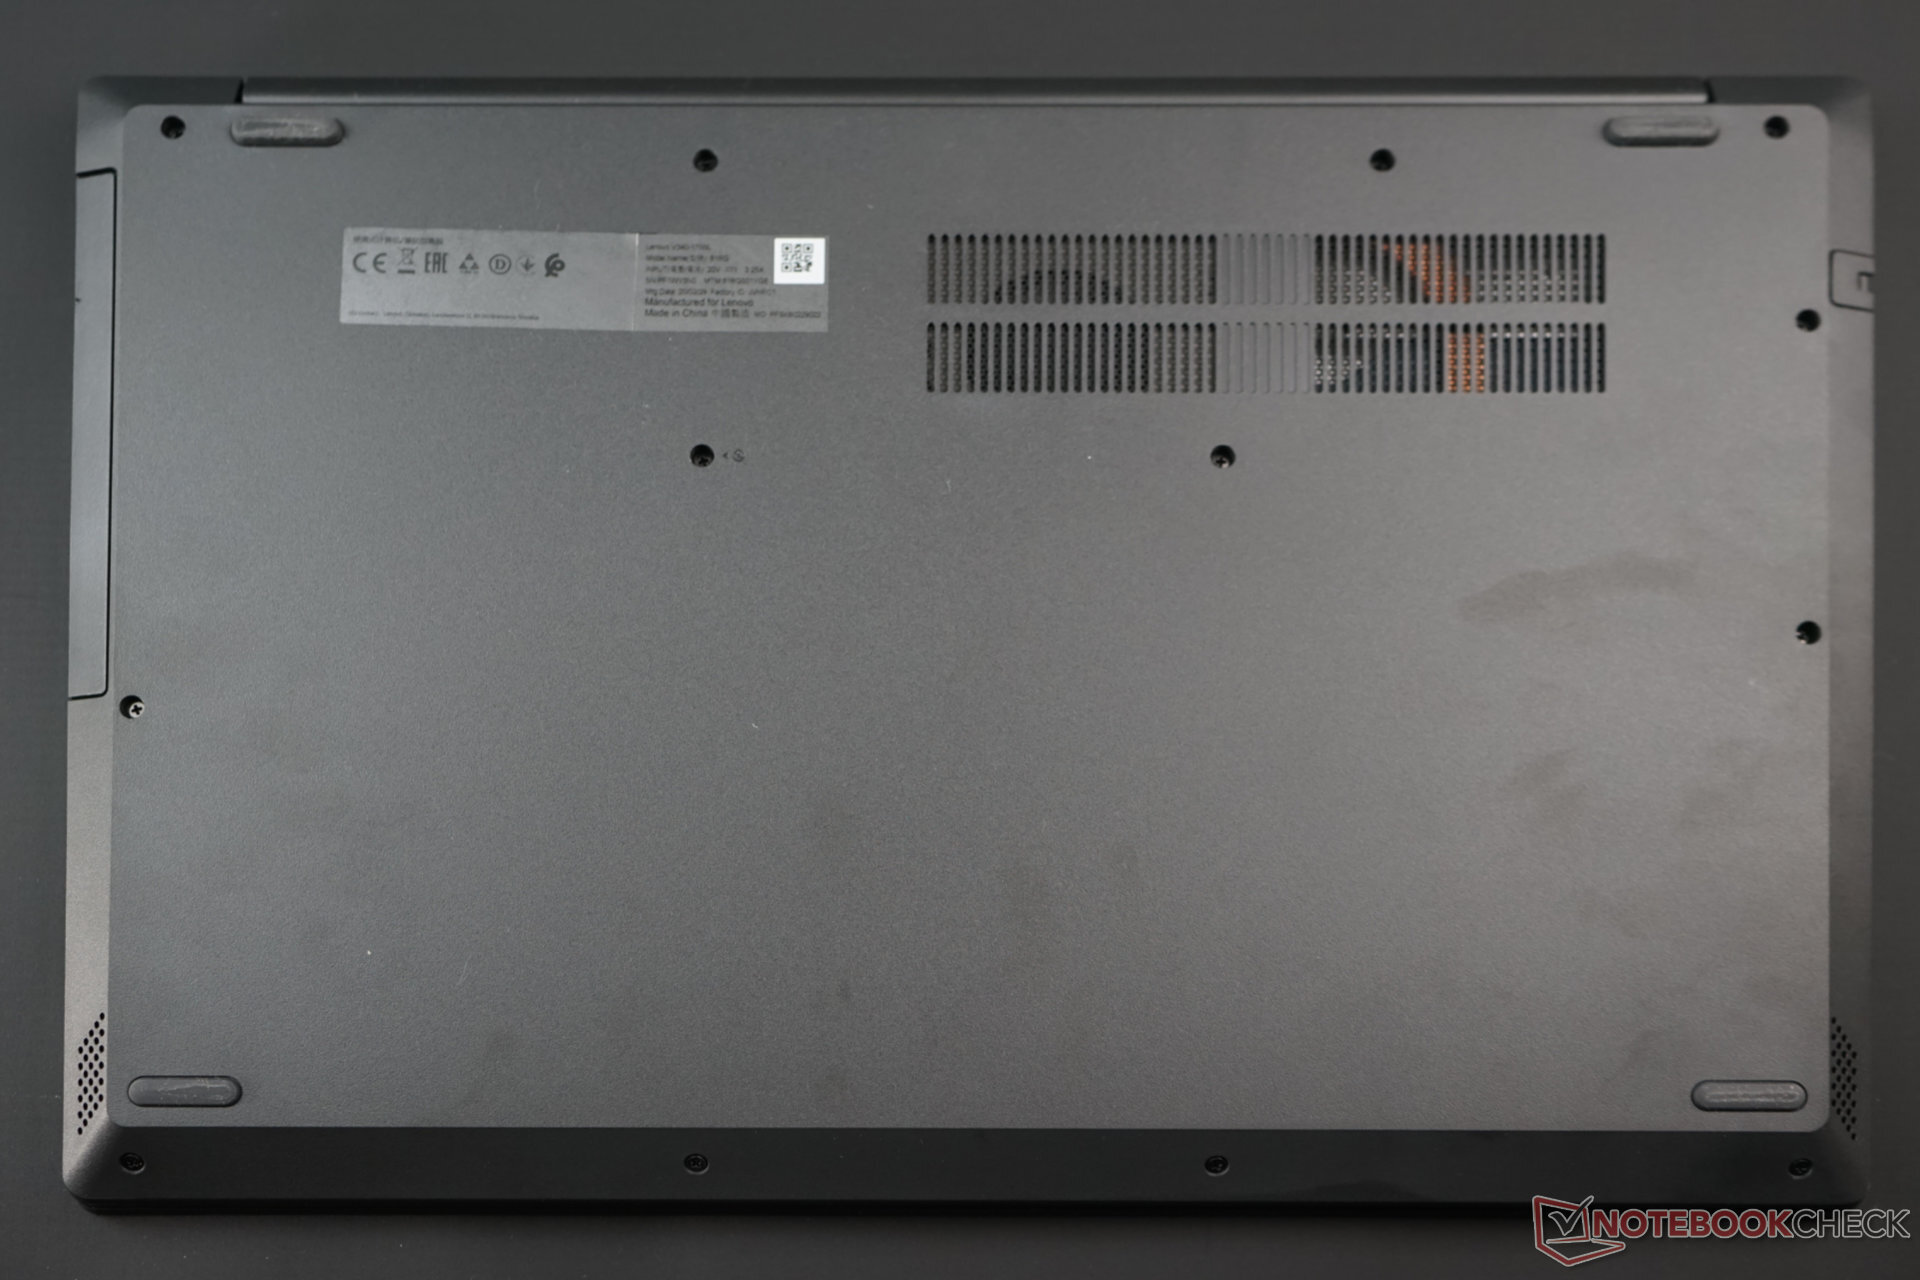
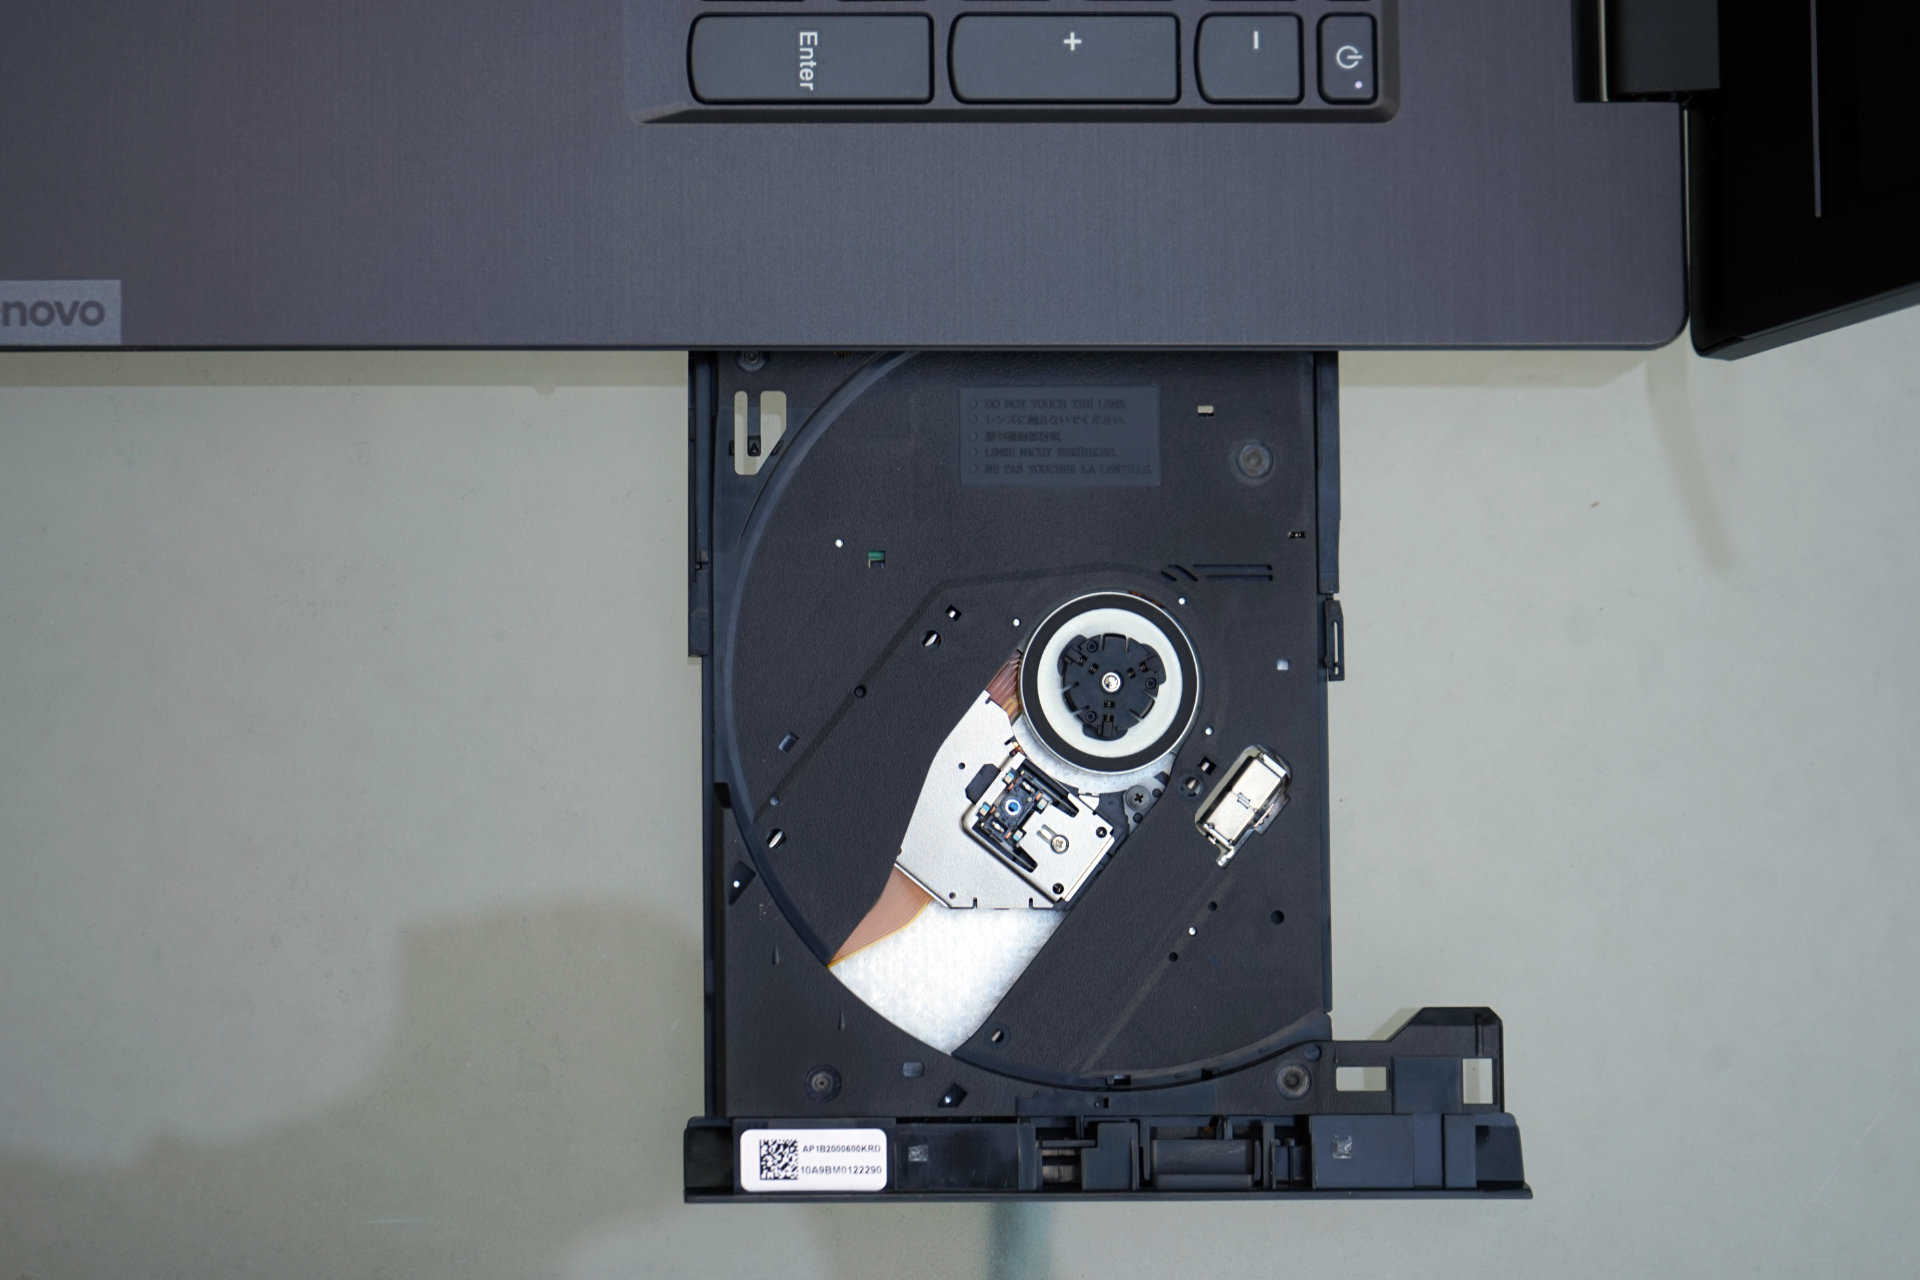
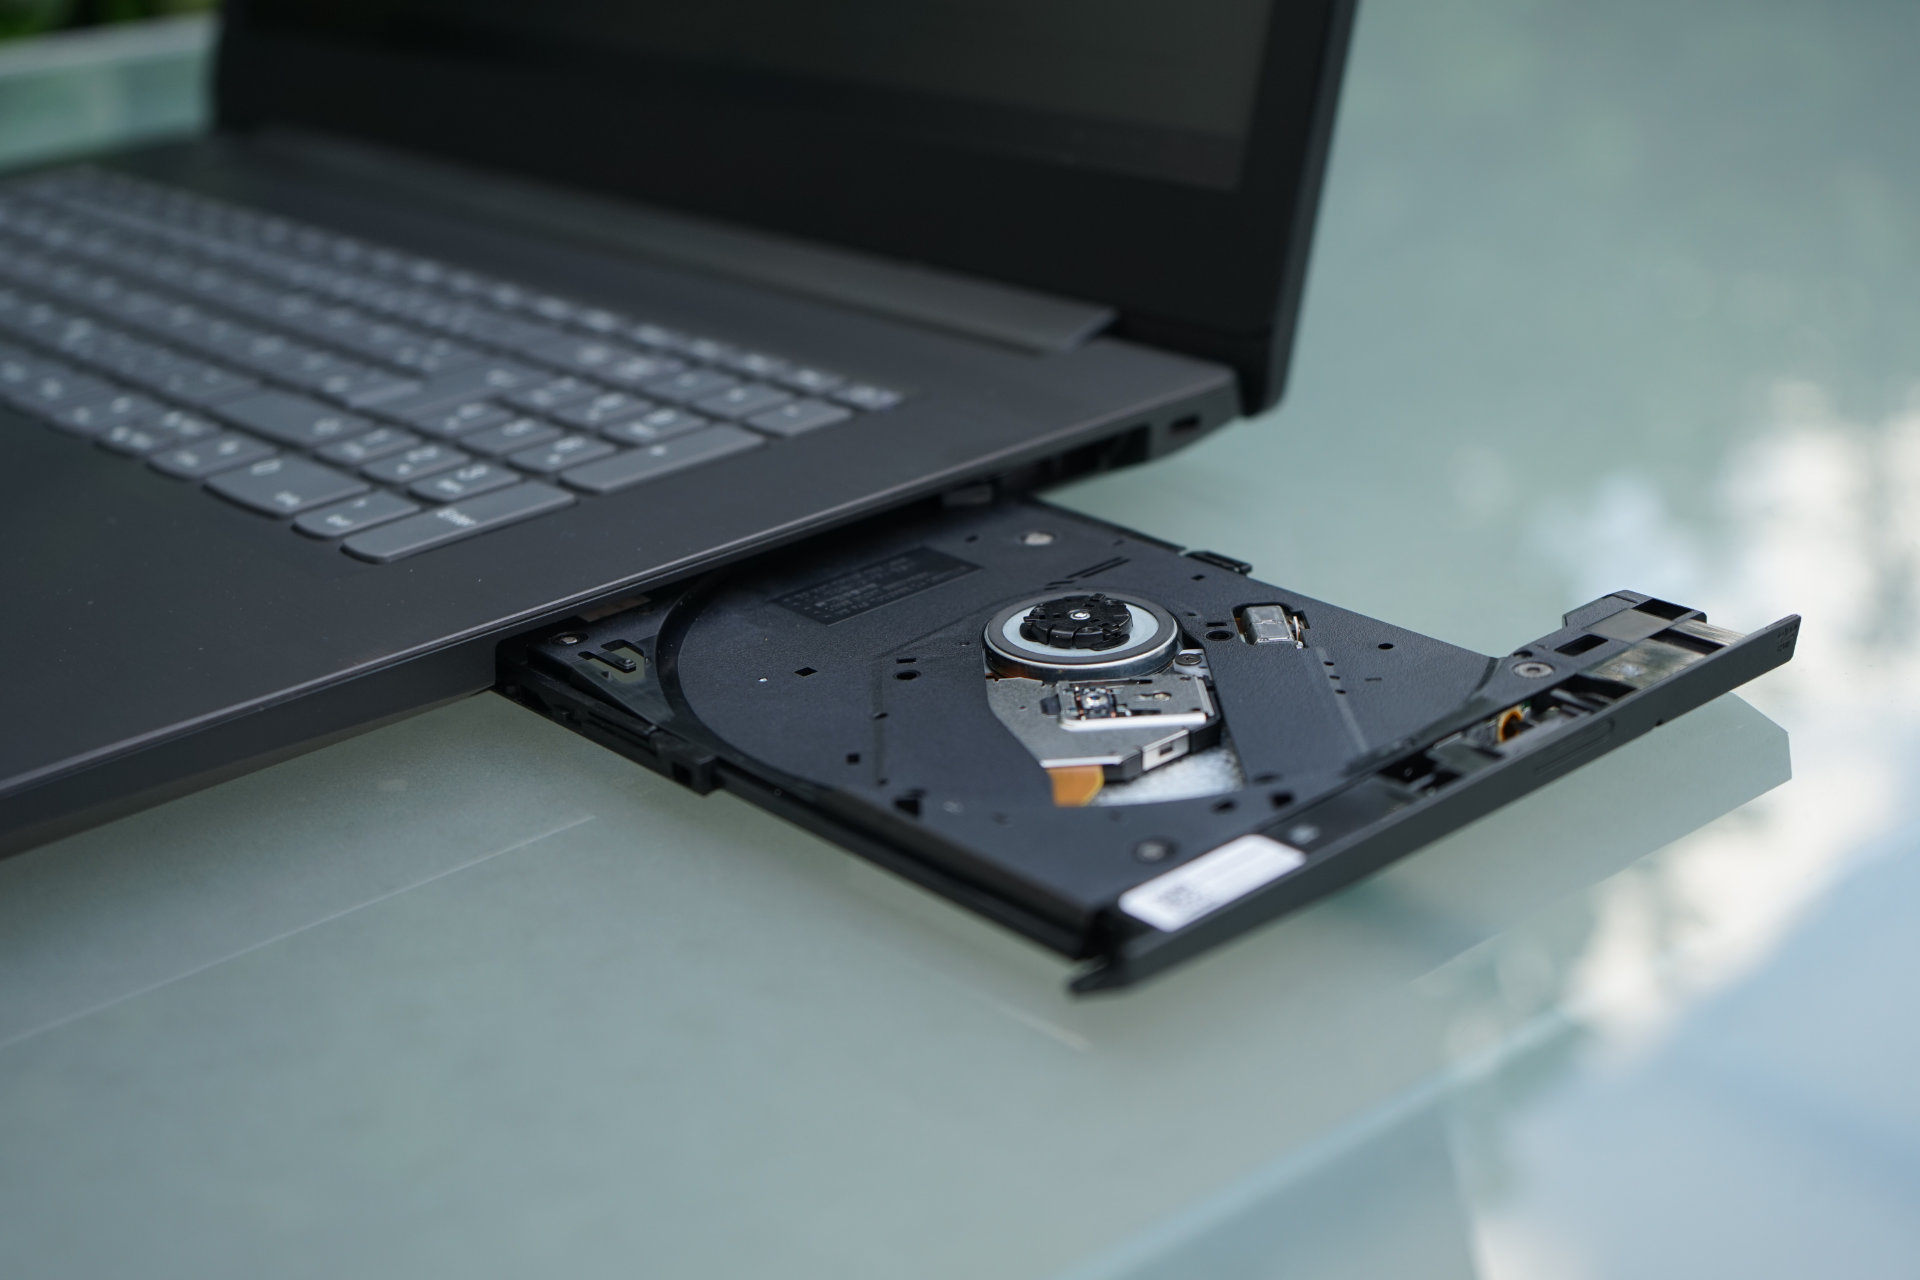
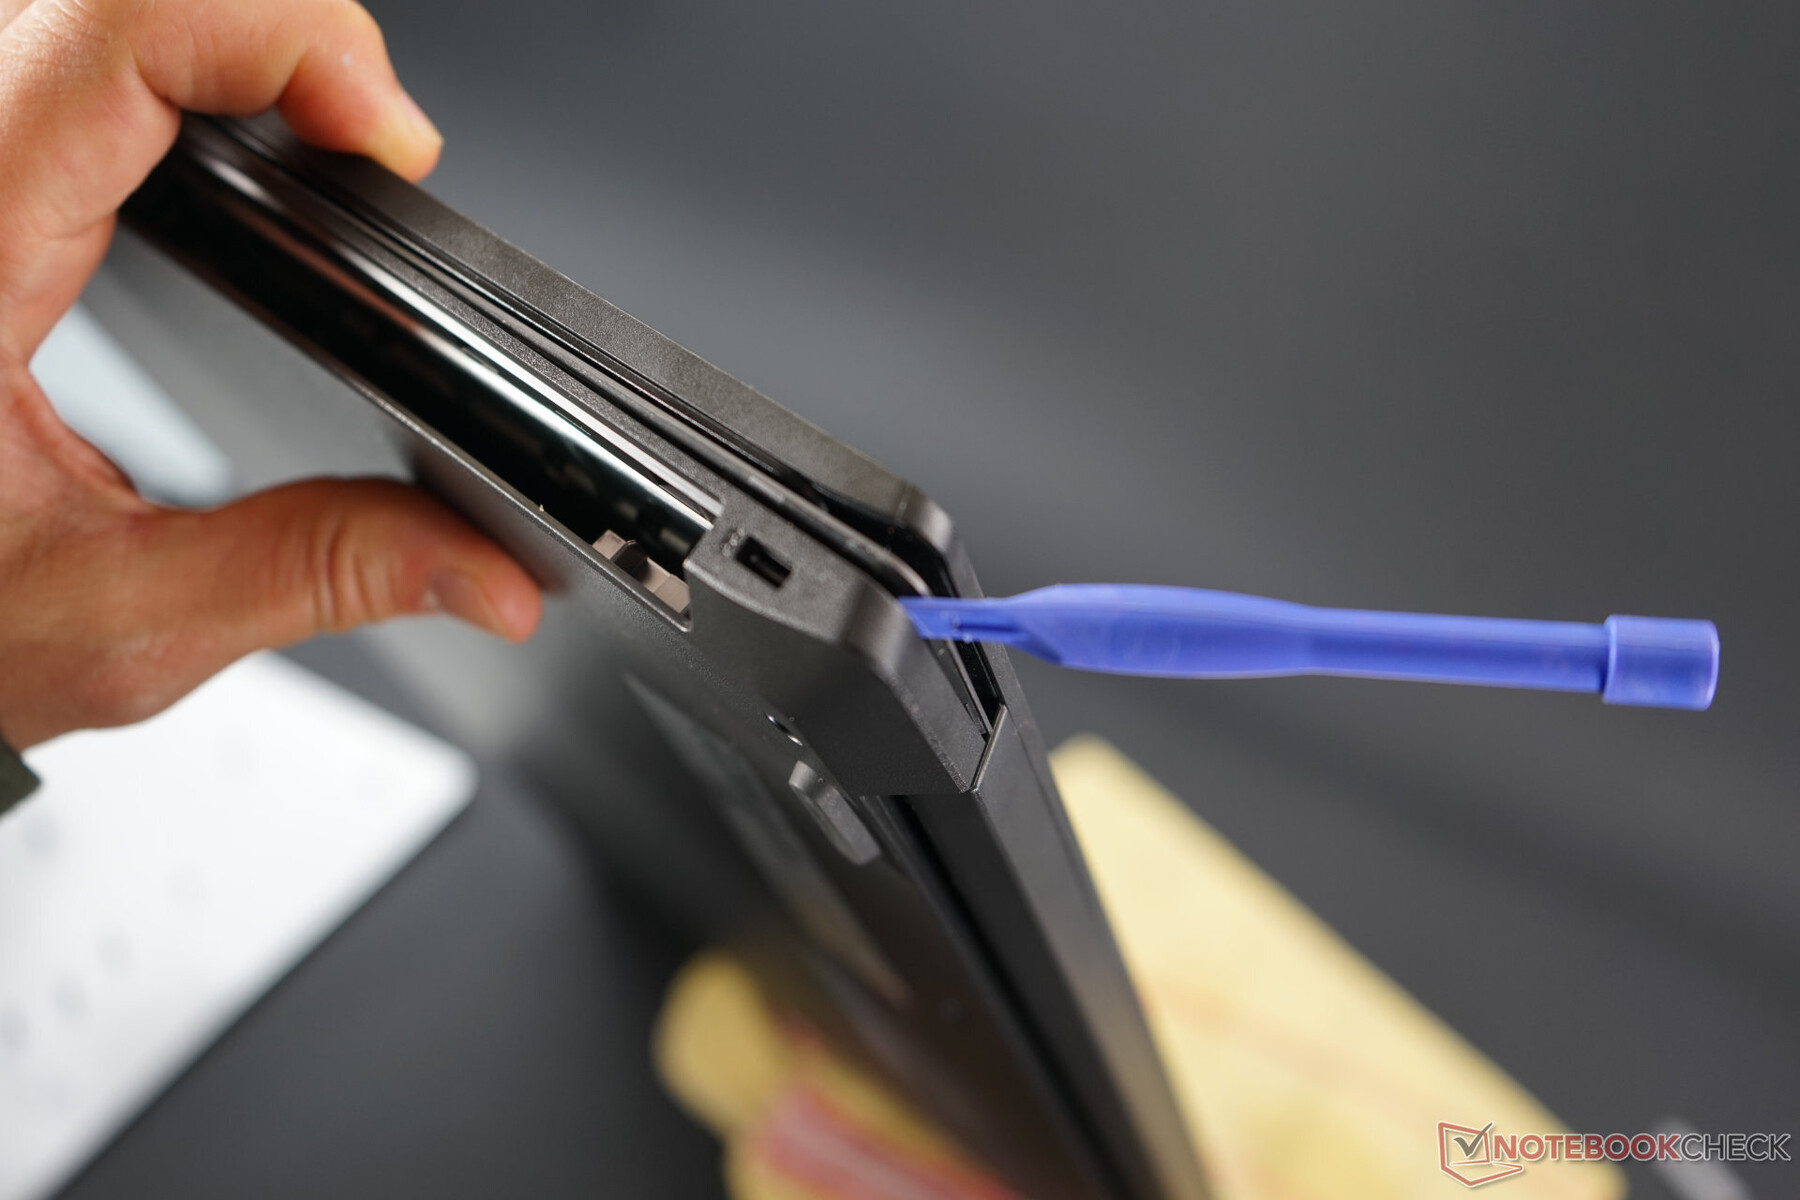
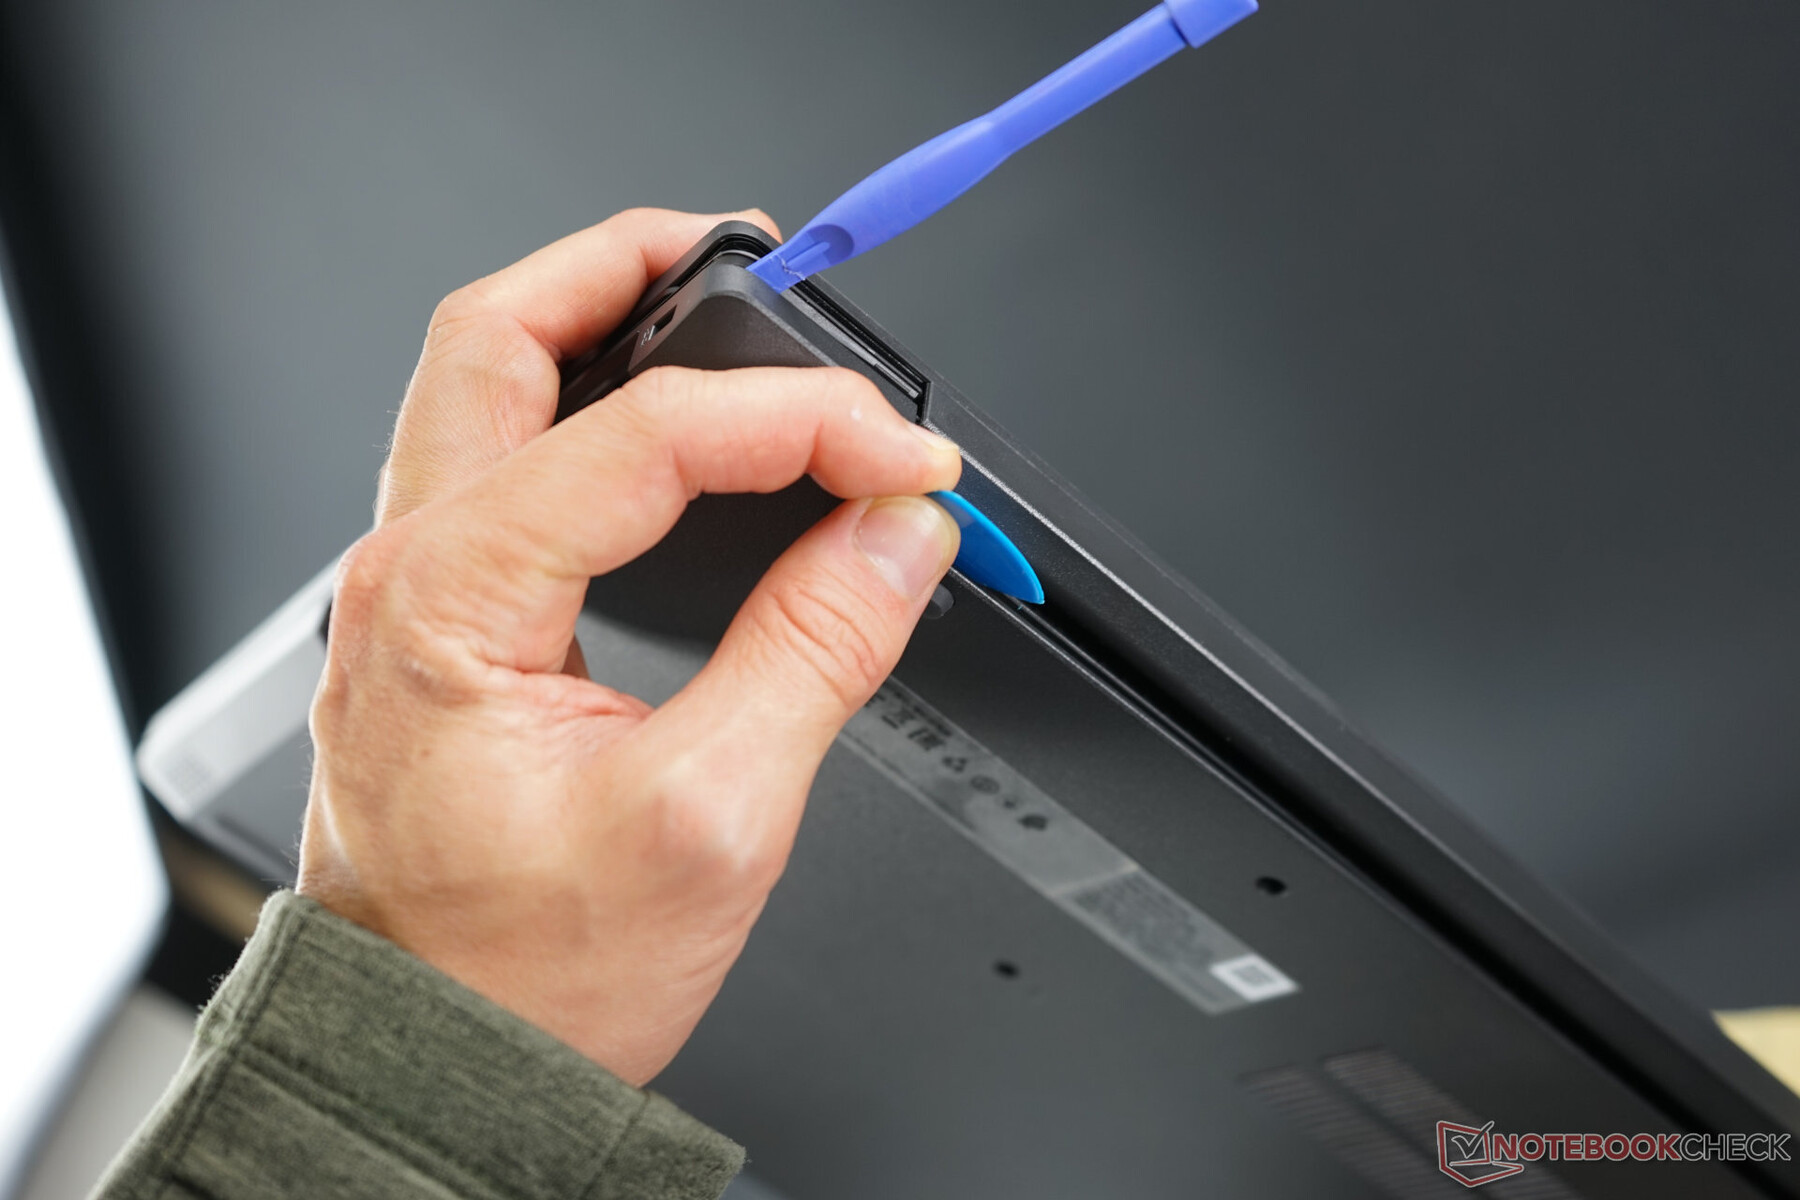
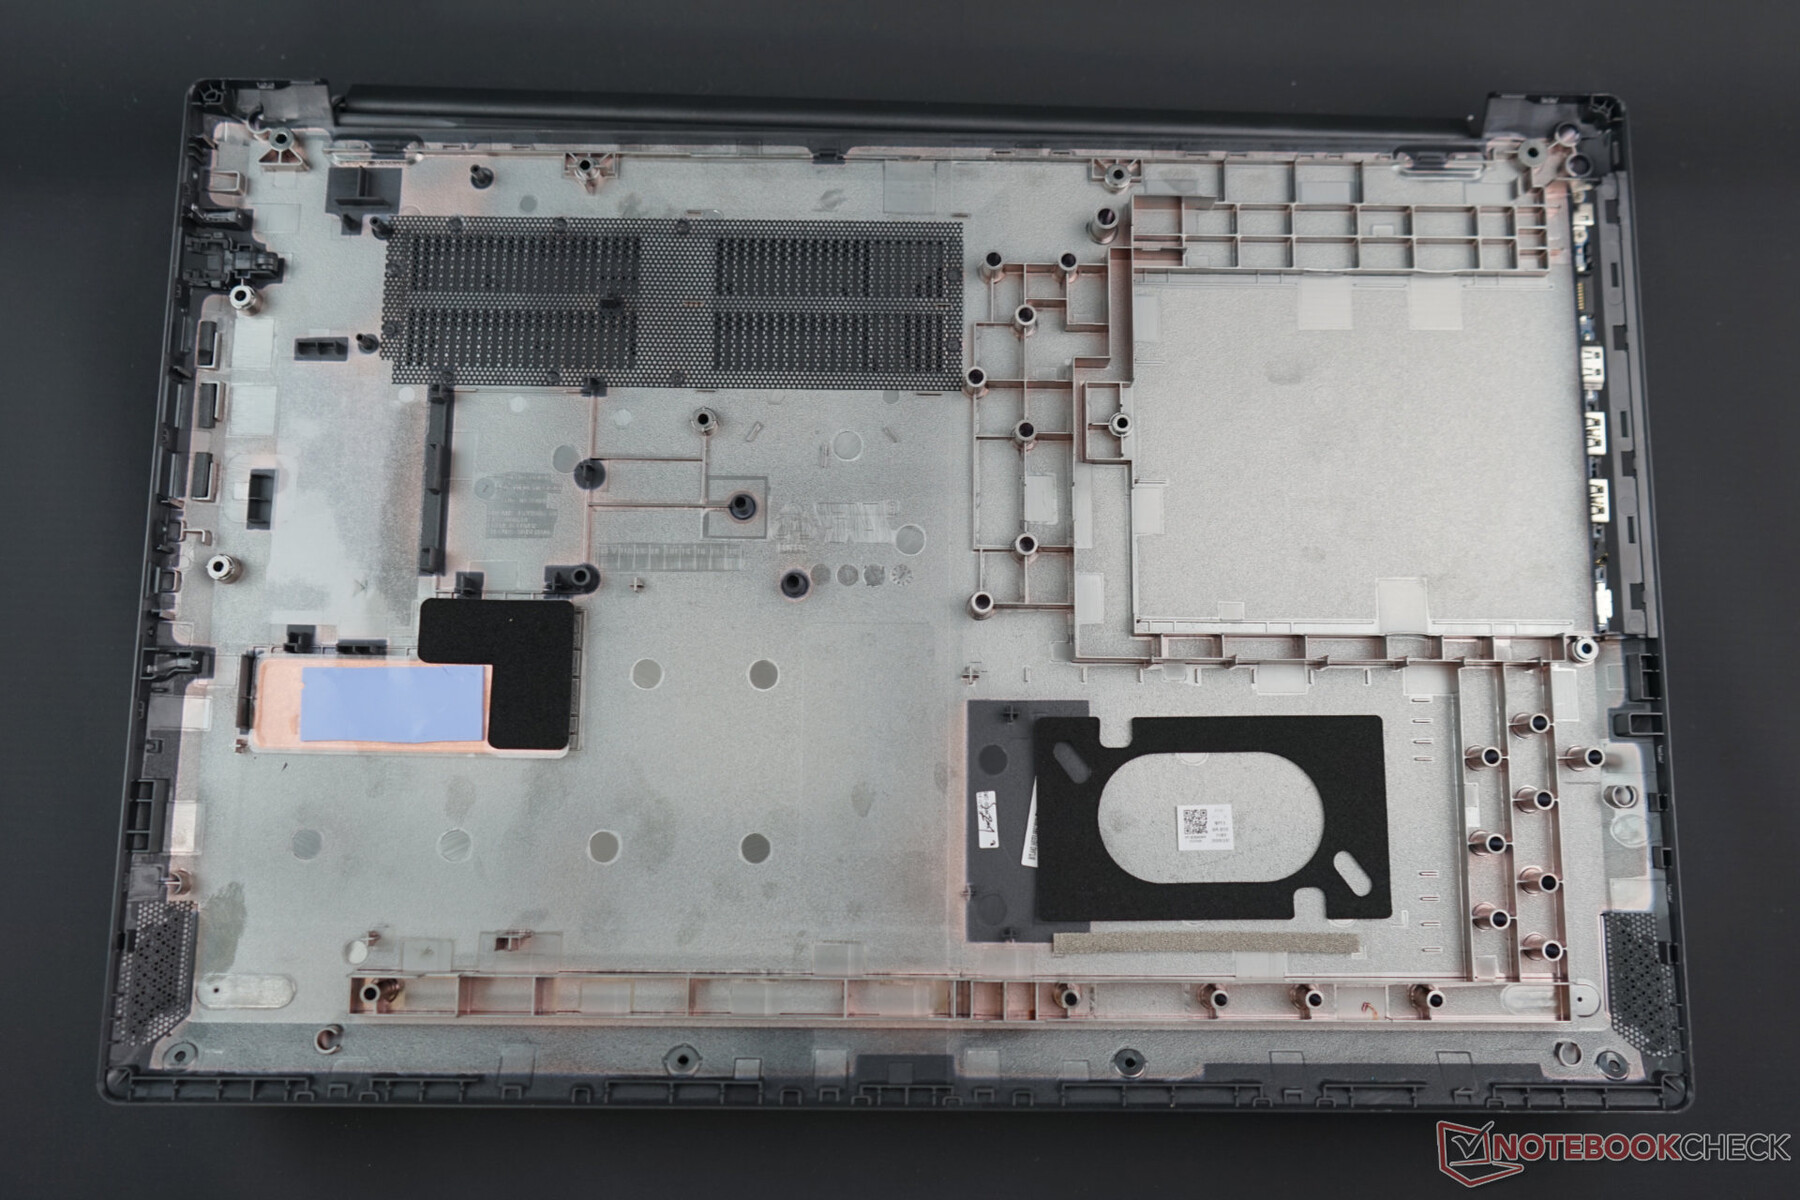
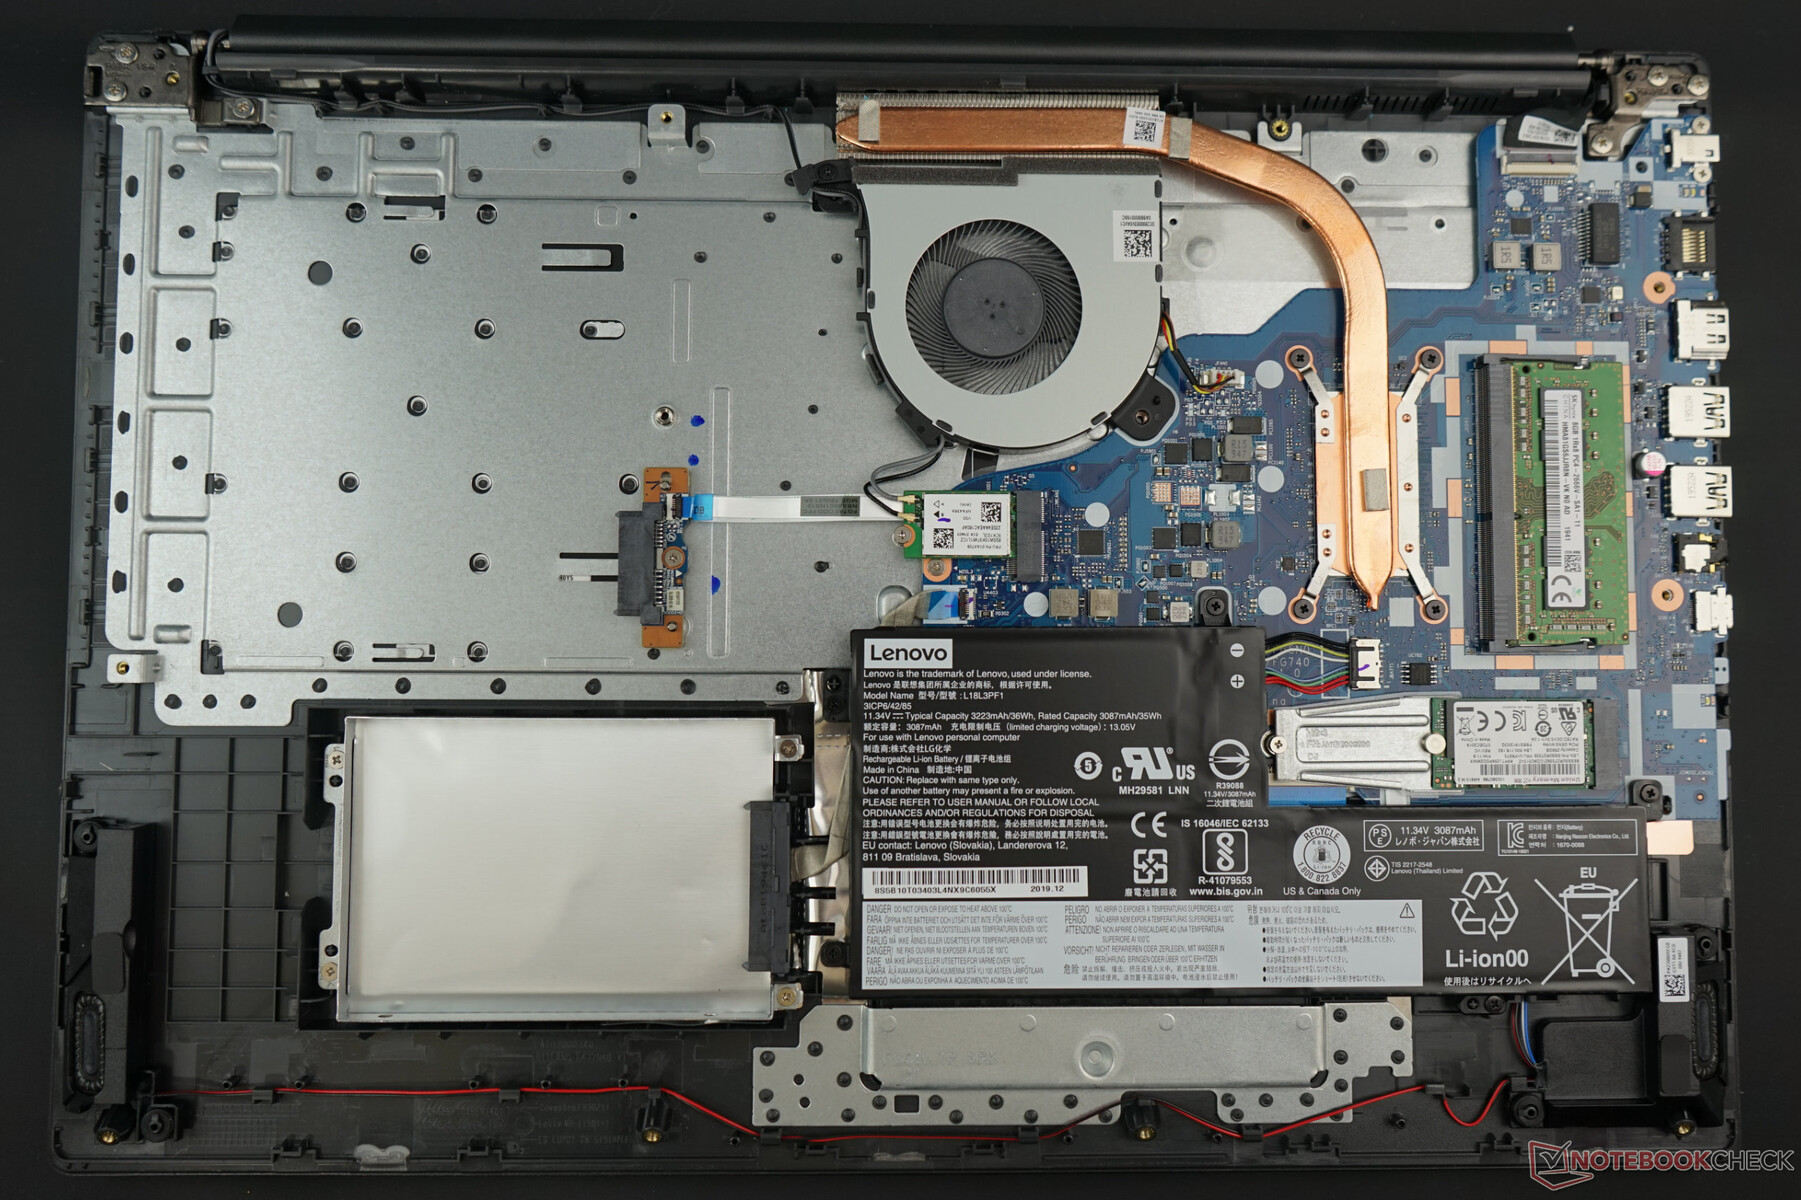
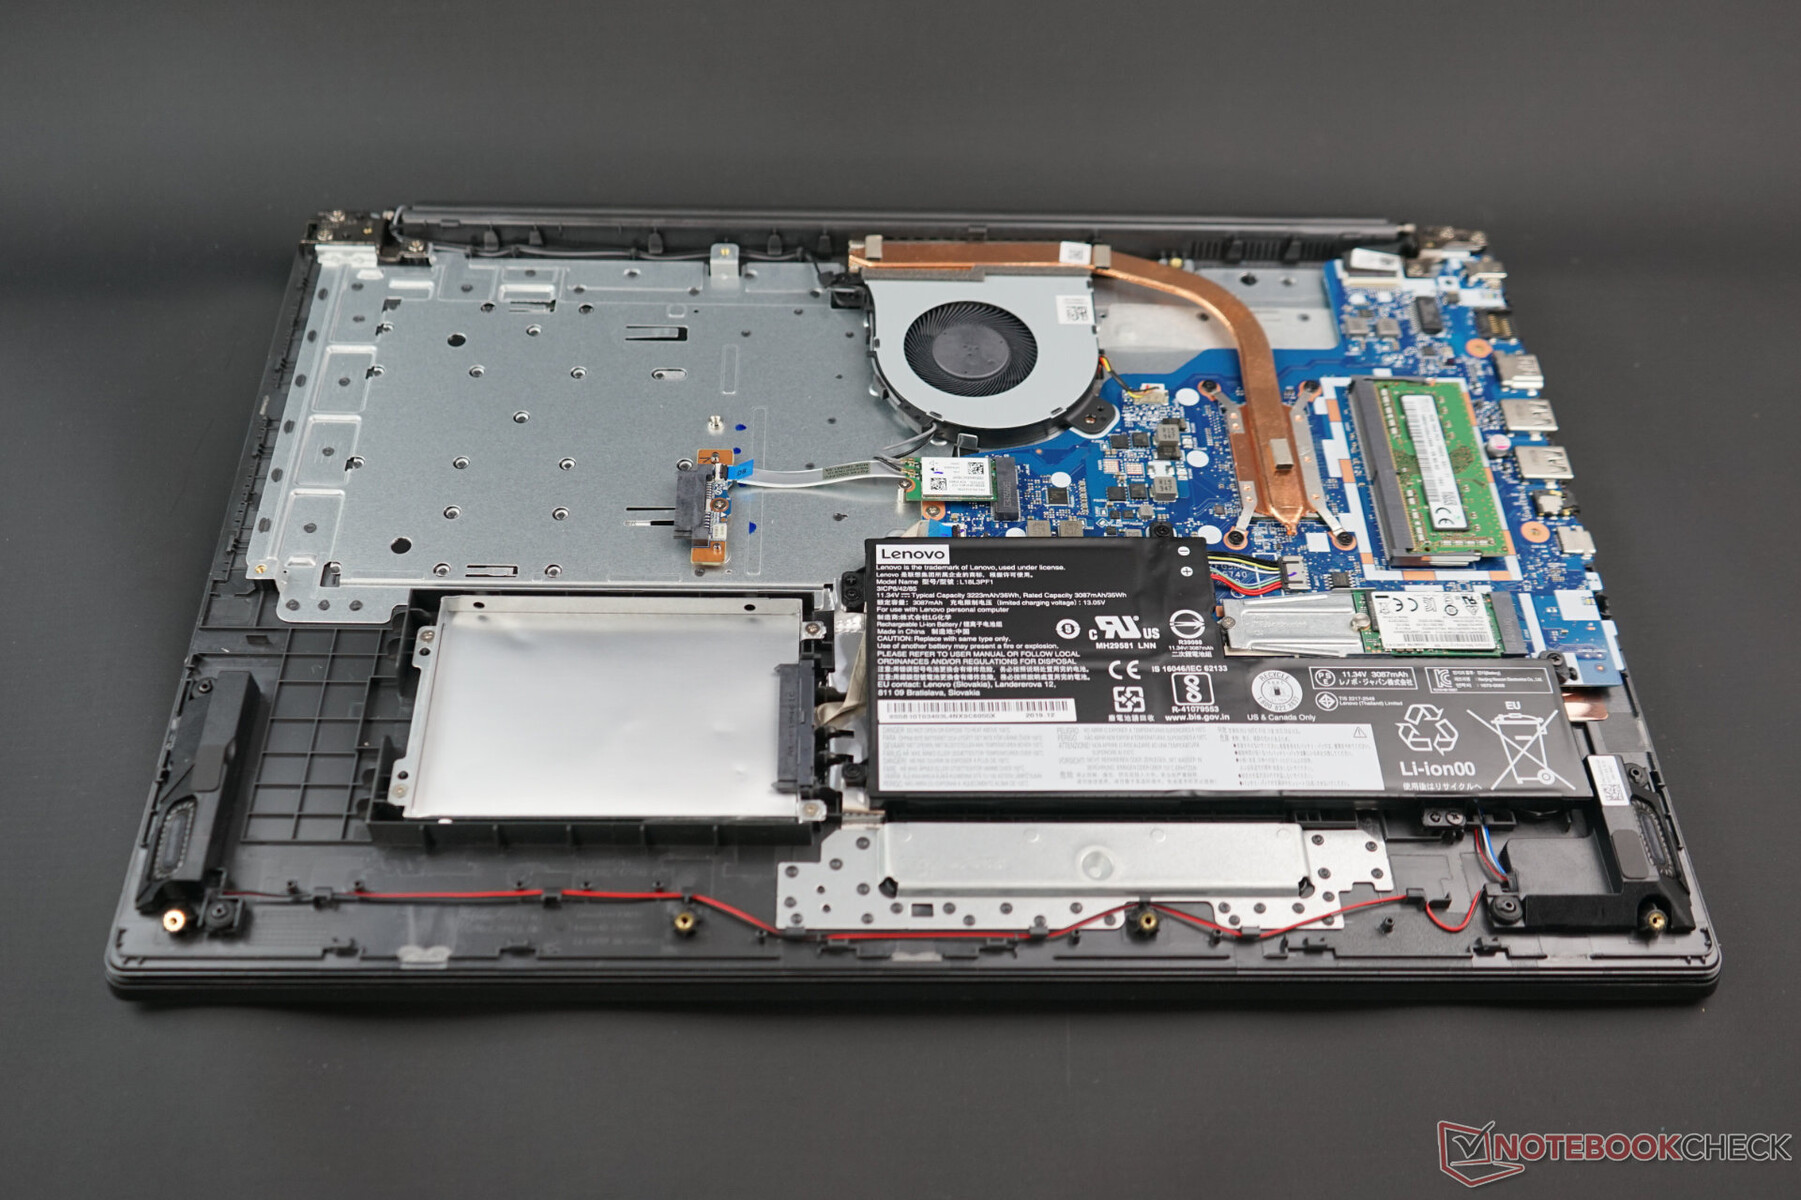
The bottom plate of the Lenovo V340 is secured by 13 Philips screws and plastic clips. We recommend to first remove the screws, subsequently the DVD drive and the clips on one of the back corners with the help of a thin plastic card or a spudger thereafter. Since the clips on our device were very tightly attached and susceptible to breaking, users would be wise to take their time and not lose their patience.
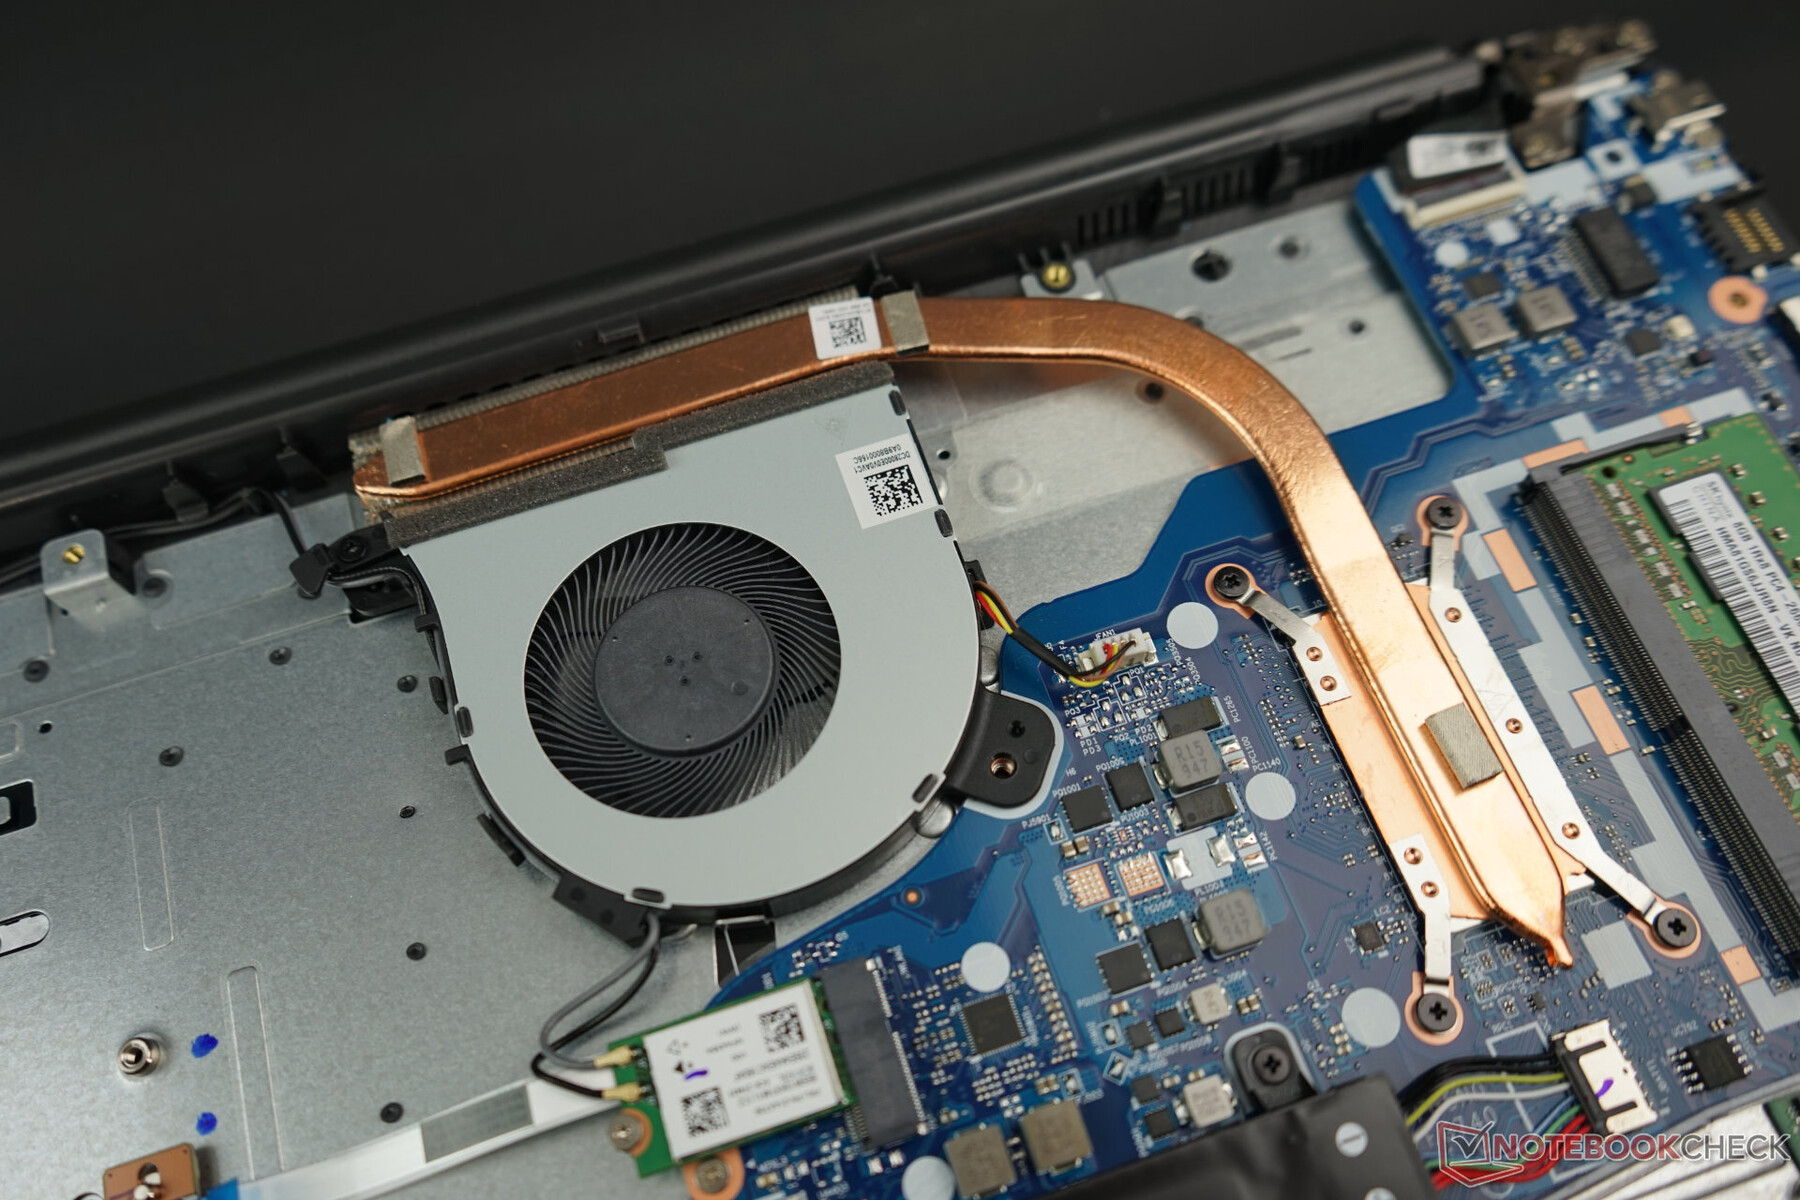
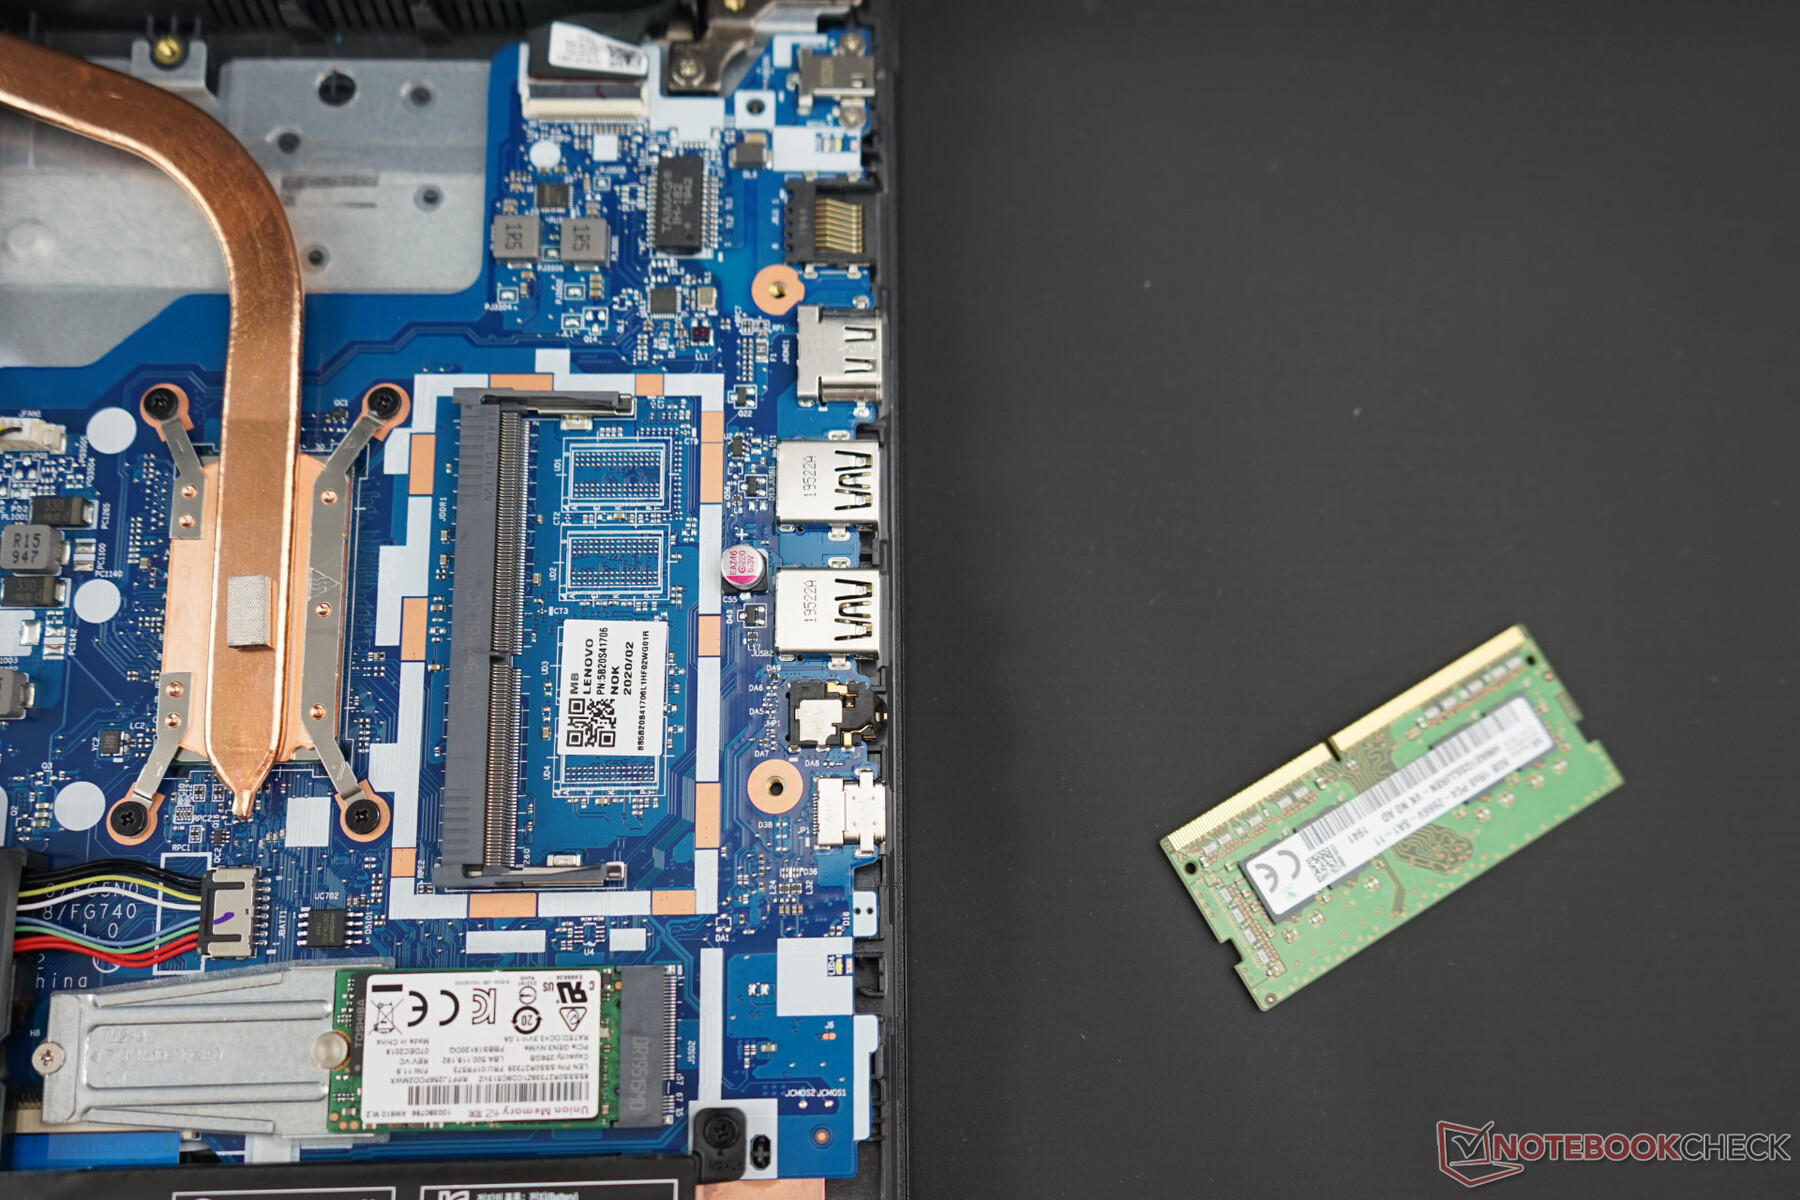
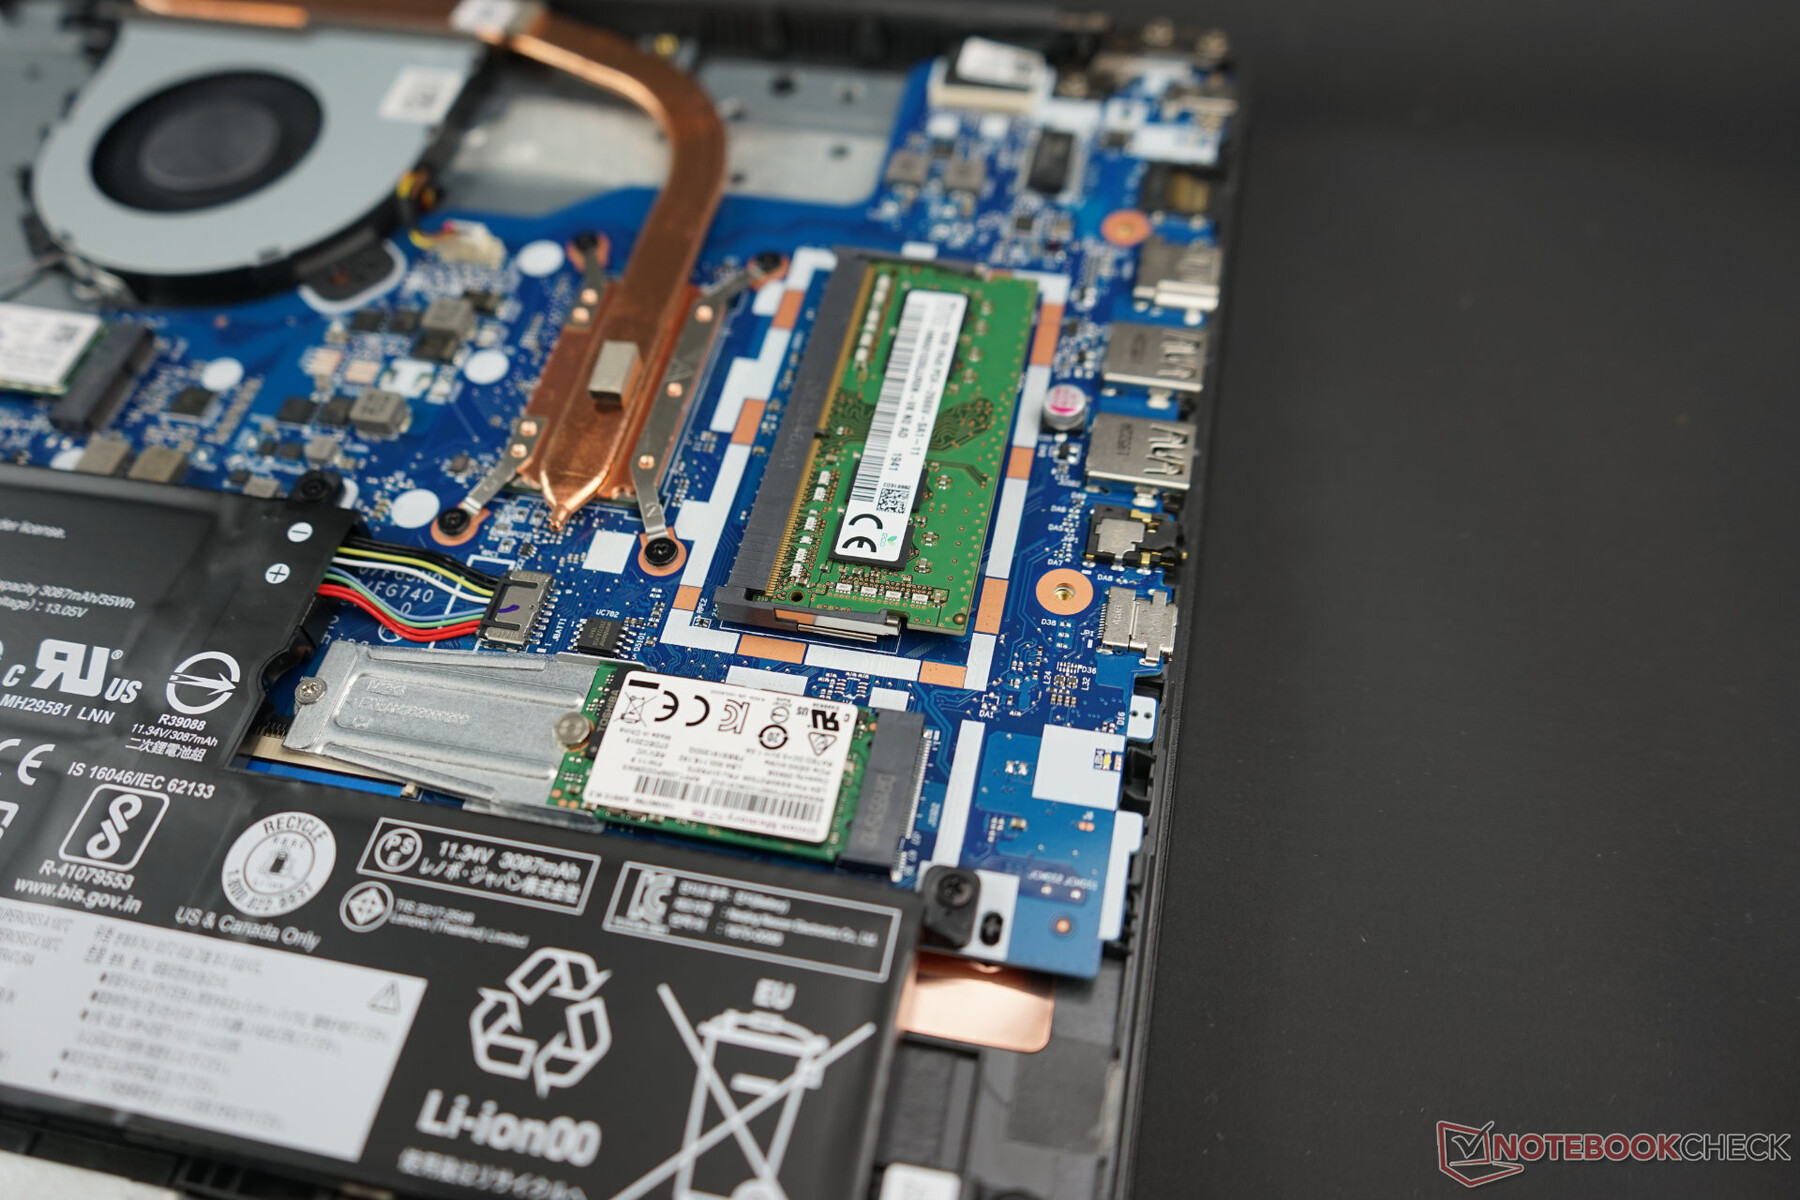
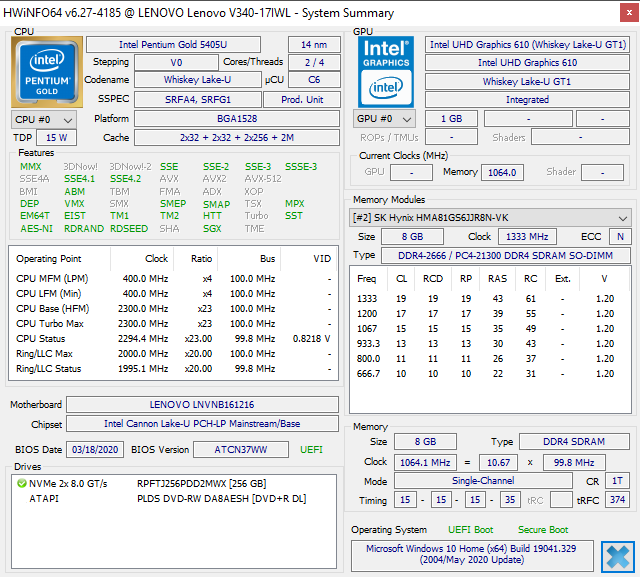
After removing the bottom plate, all components are easily accessible. The single RAM slot, M.2 SSD, empty 2.5-inch bay for an additional hard drive or SATA SSDs, the battery, and the fan are easy to reach. Since our test device has one soldered RAM module and no slotted RAM sticks, the system memory only runs in single-channel mode.
Warranty
Lenovo offers a one-year manufacturer warranty for the V340 in Europe - this is common for cheap entry-level laptops. As per usual, users benefit from a 2-year guarantee with a reversal of the burden of proof after half a year.
Input Devices
Keyboard
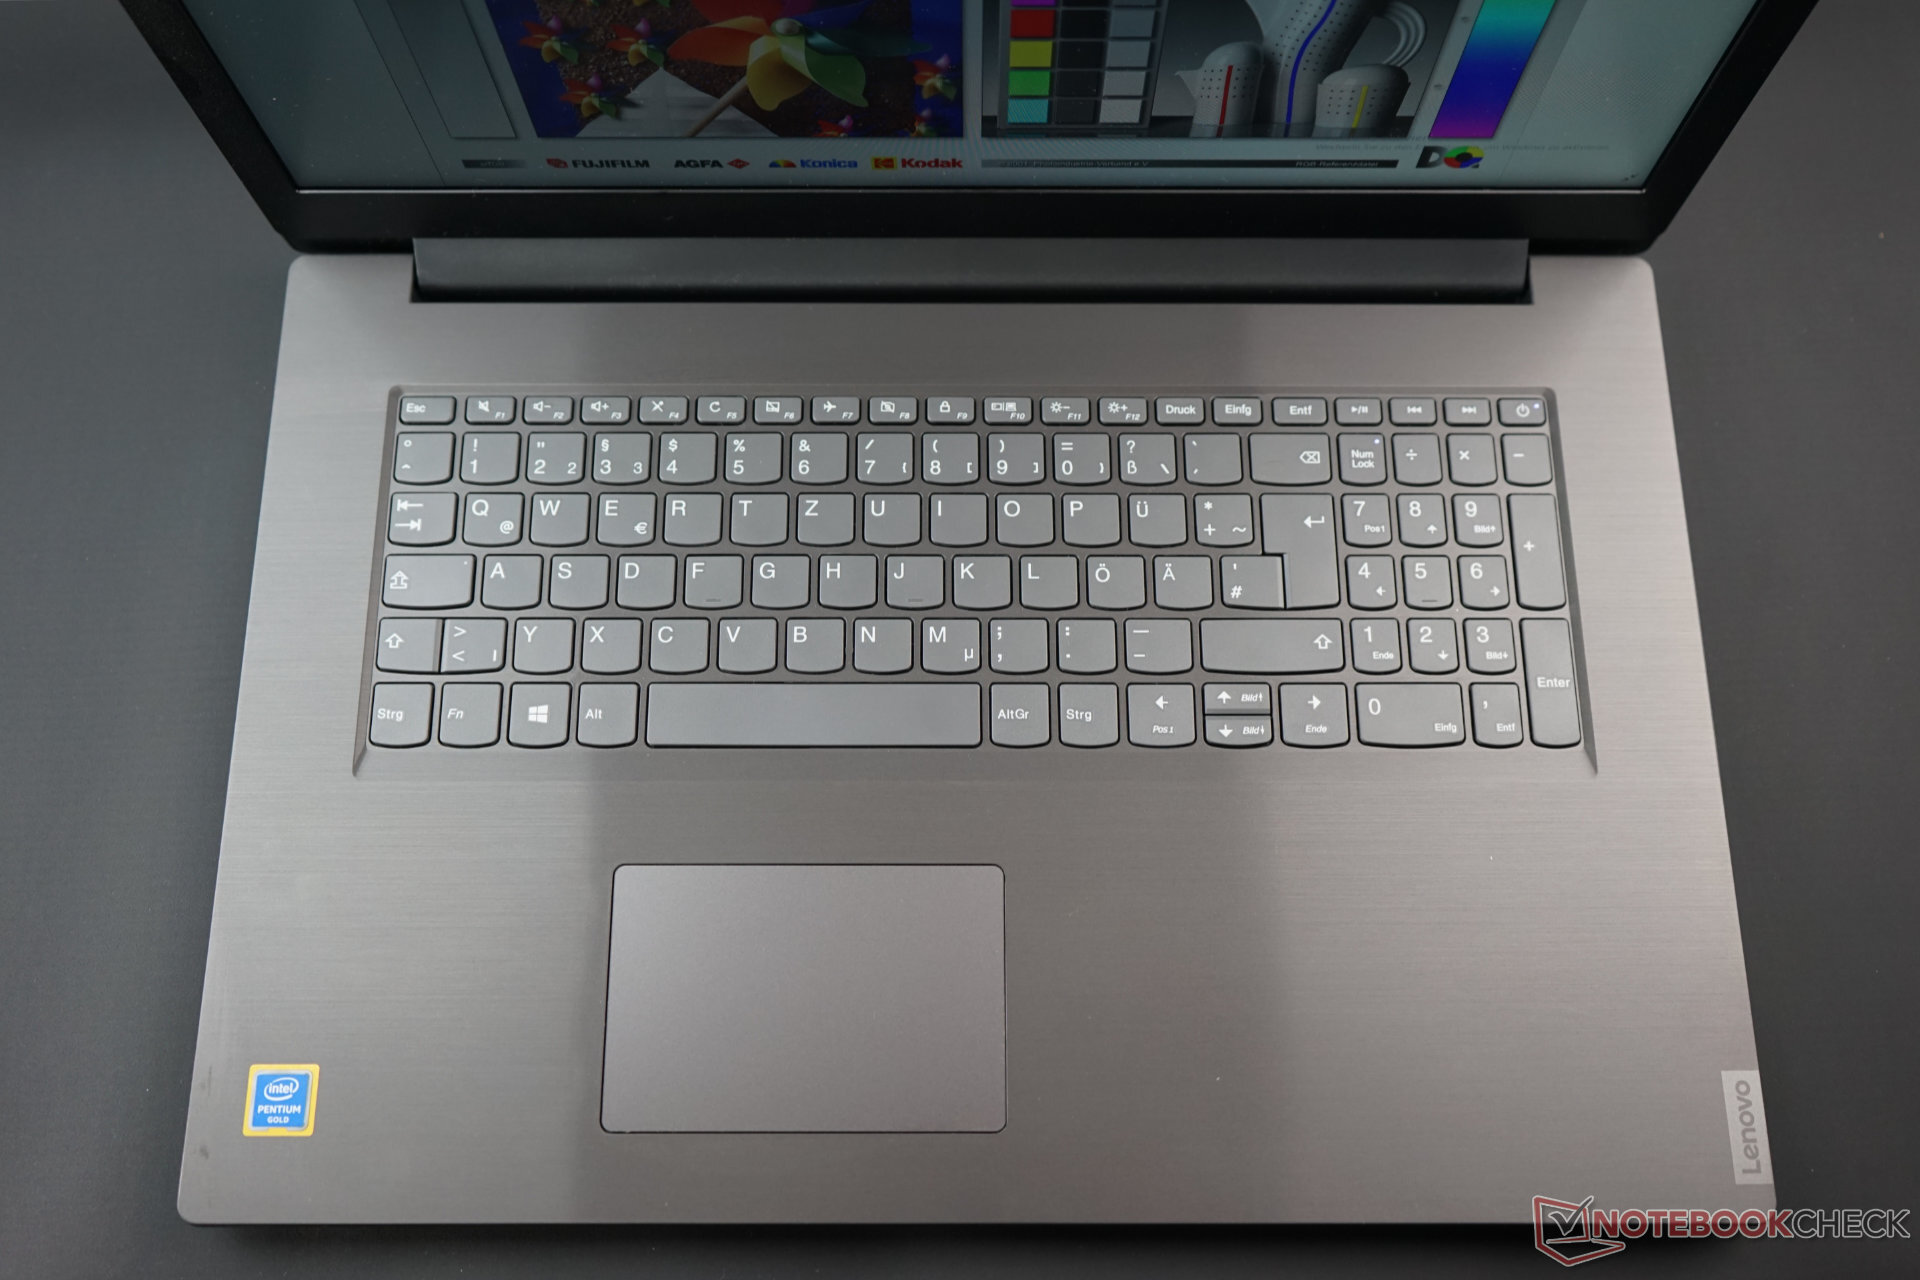
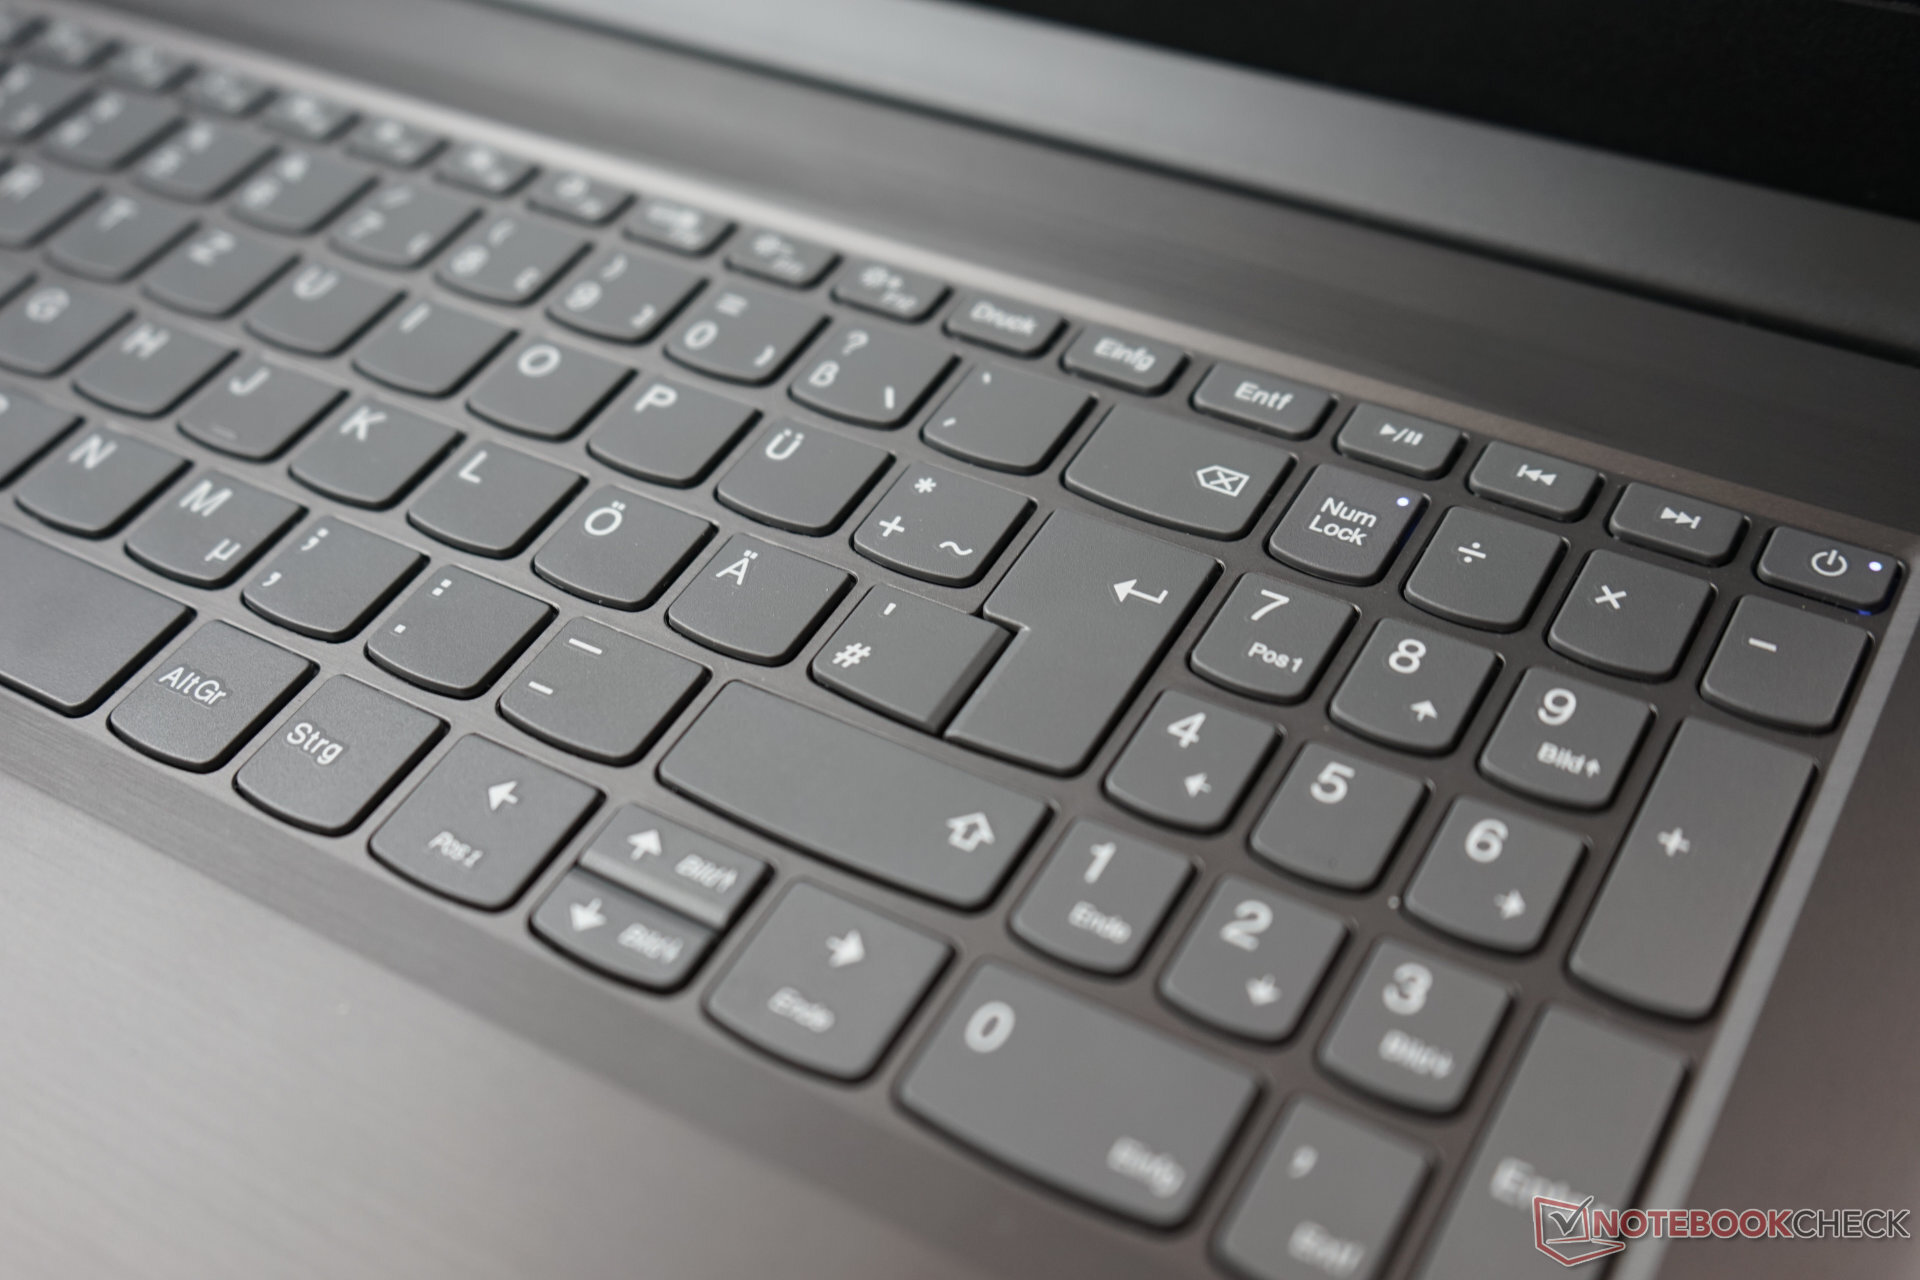
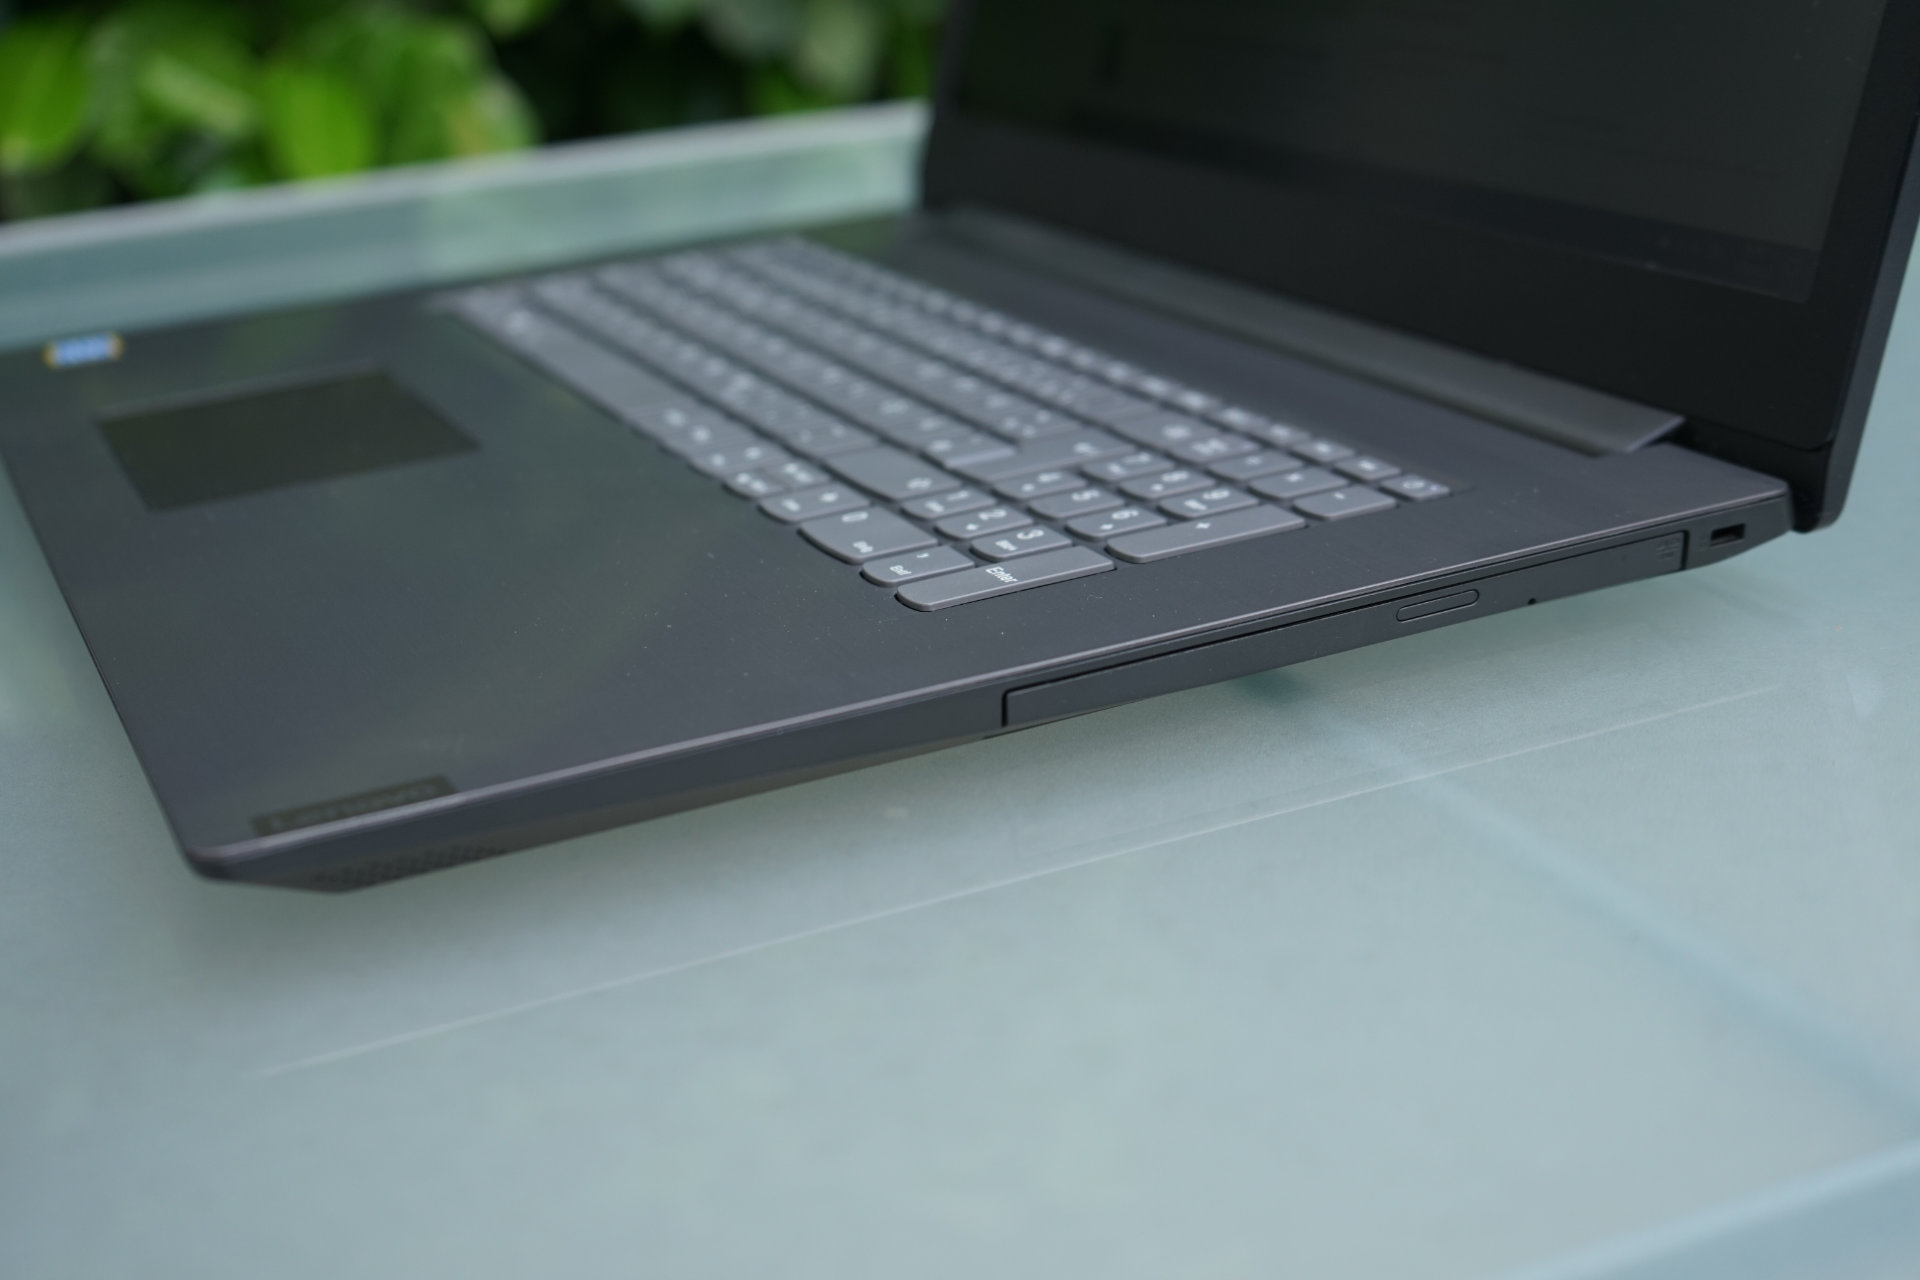
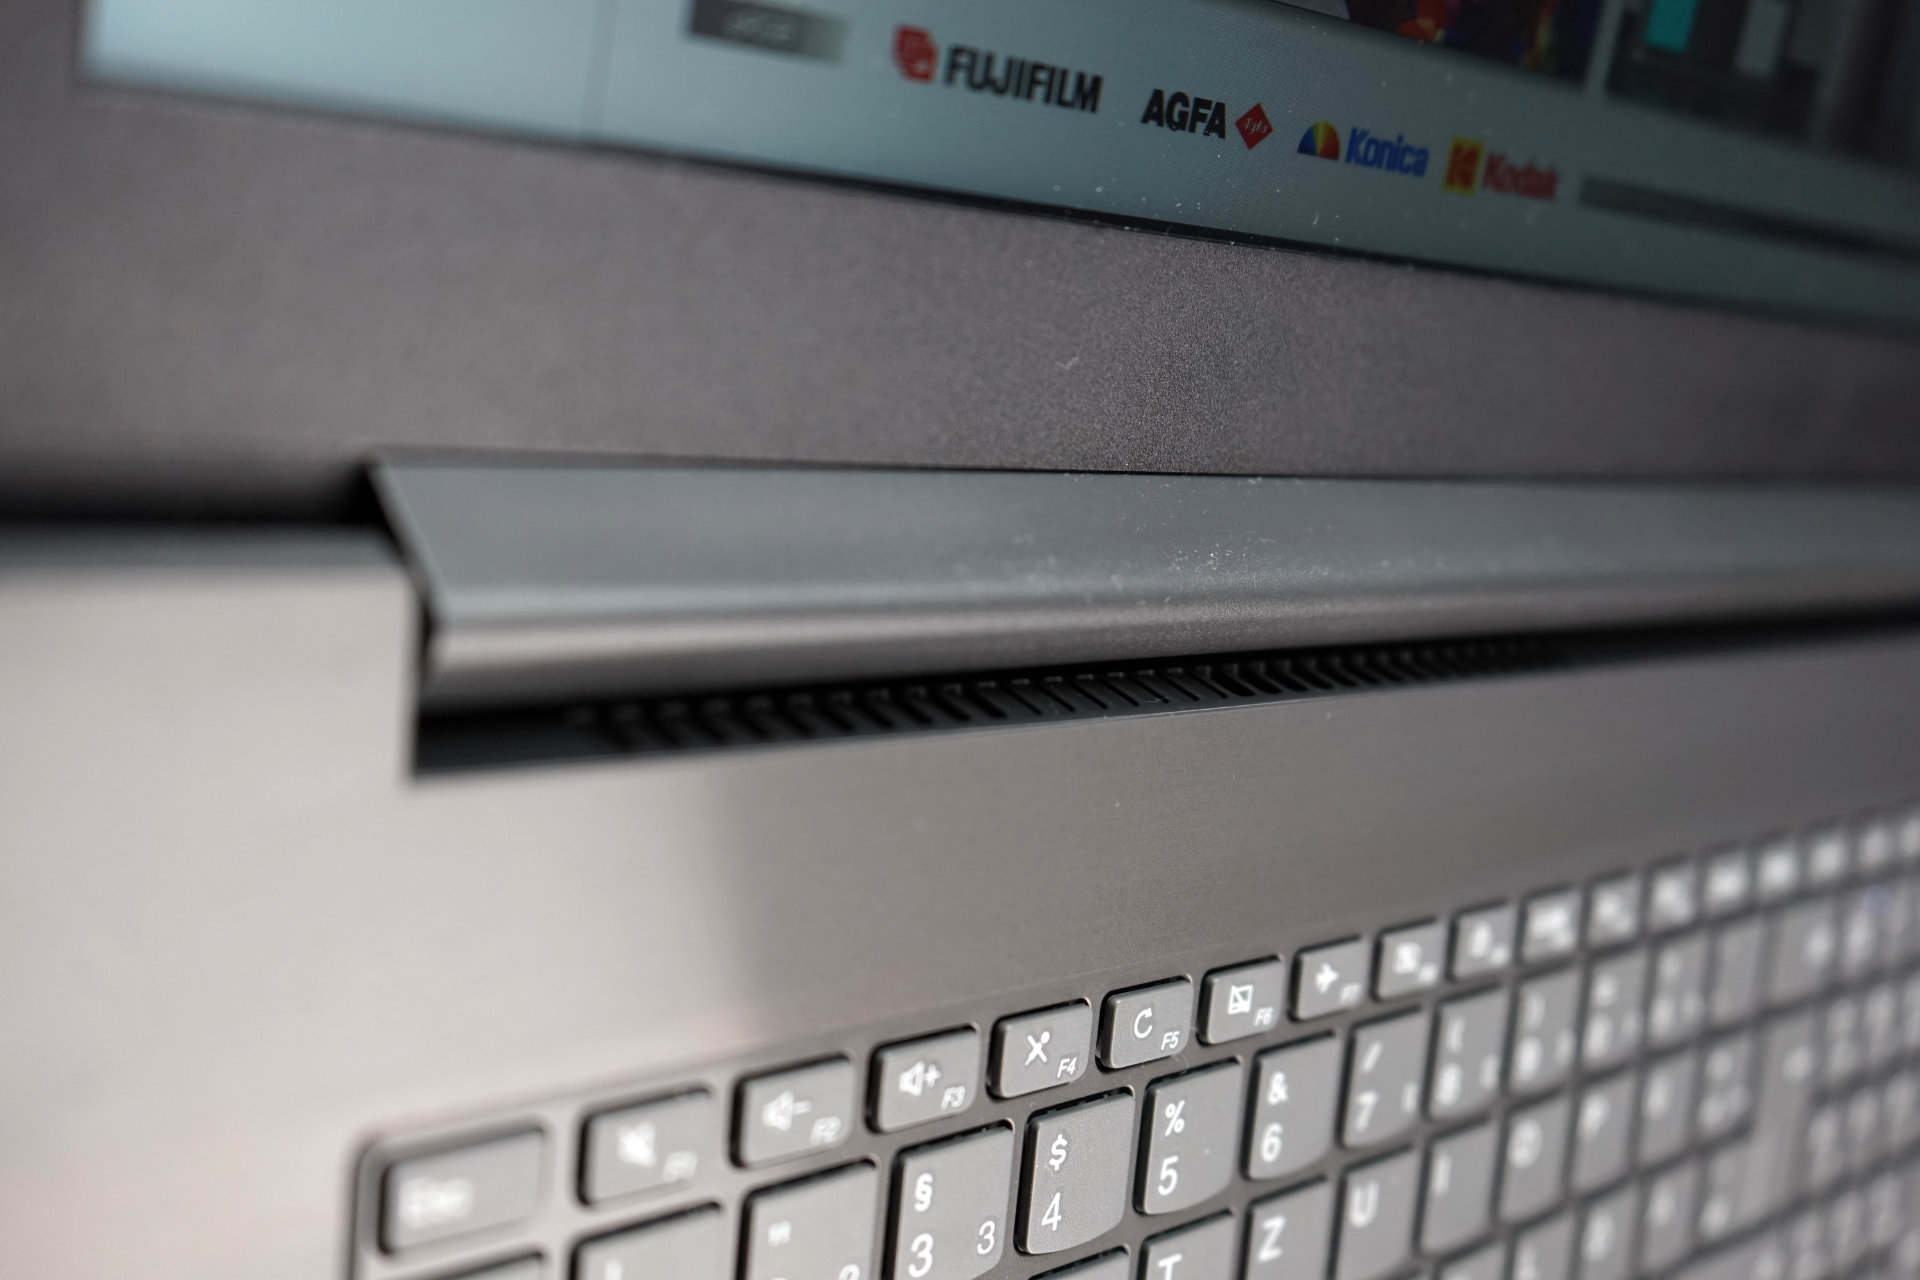
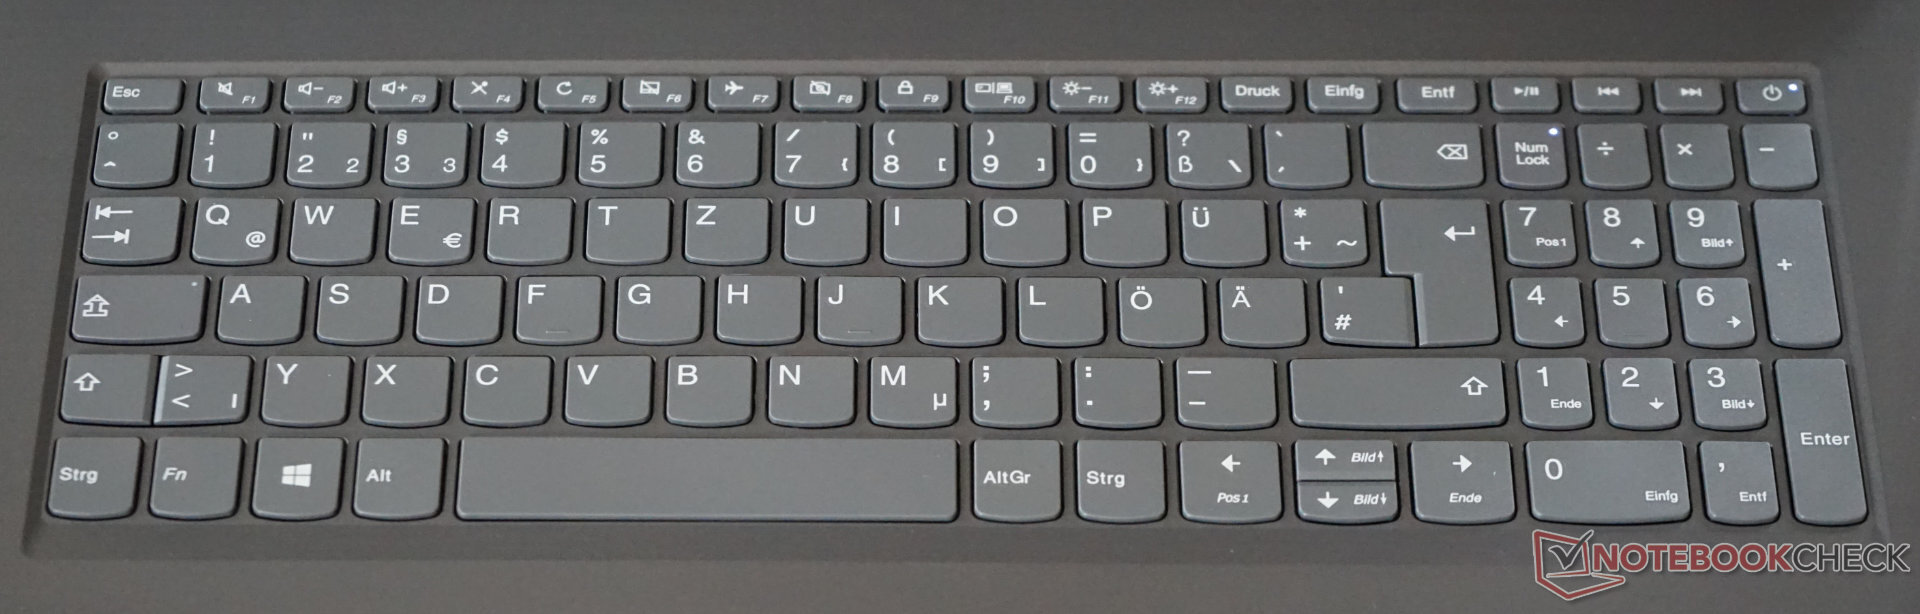
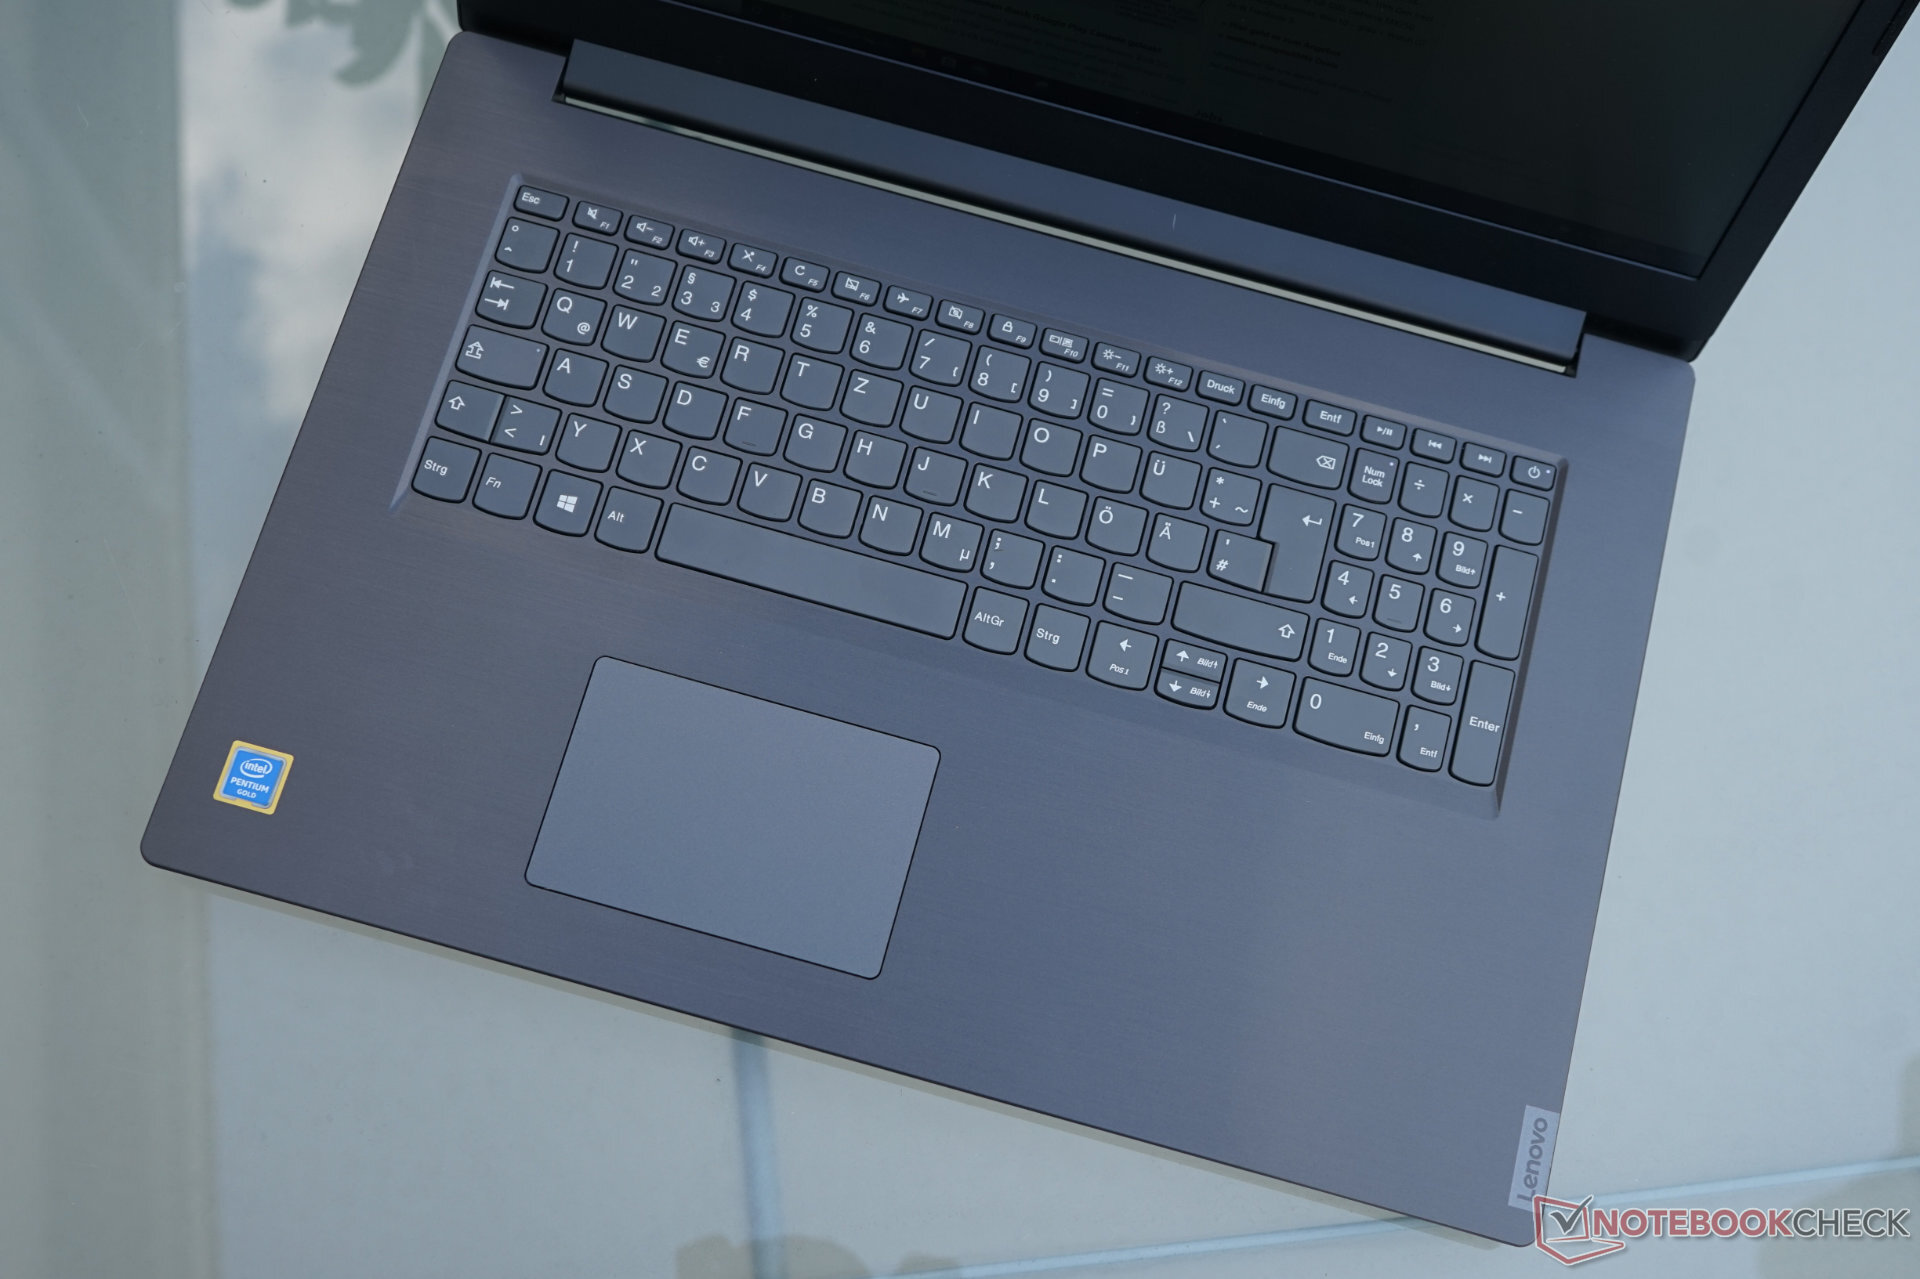
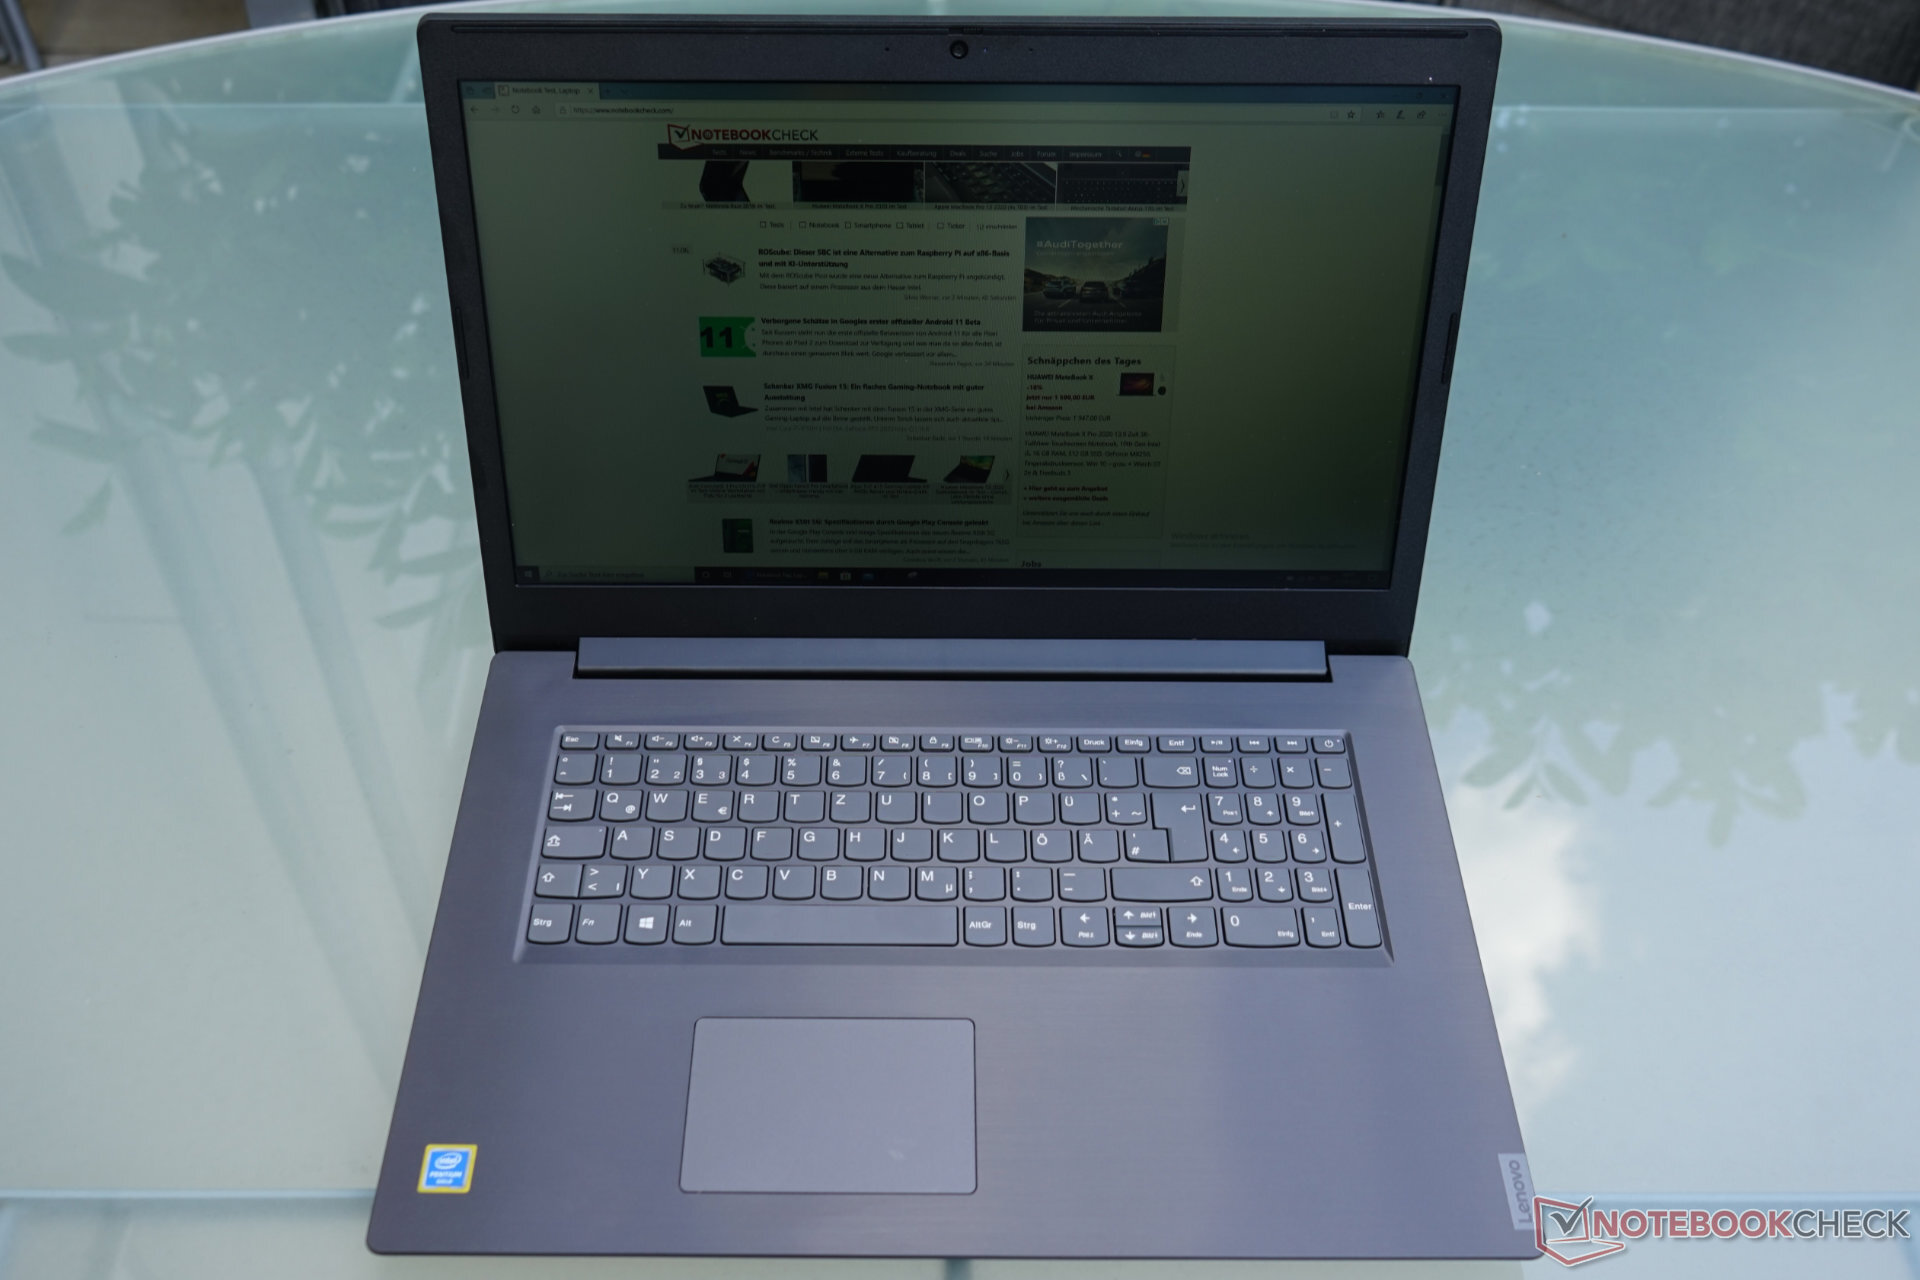
Due to the large chassis, Lenovo was able to integrate a full-size Chiclet keyboard with a numpad. As per usual, the keys of the Lenovo keyboard are rounded-off. The keys offer sufficient travel and only the center of the keyboard surface slightly yields under pressure. Since the feedback is somewhat spongy, the typing experience does not measure up to flagship ThinkPad models. The lack of keyboard backlighting further separates our test device from more premium models. Even though there is more than enough space, there are no dedicated special keys and Lenovo instead relies on FN and F1-F12 key combinations.
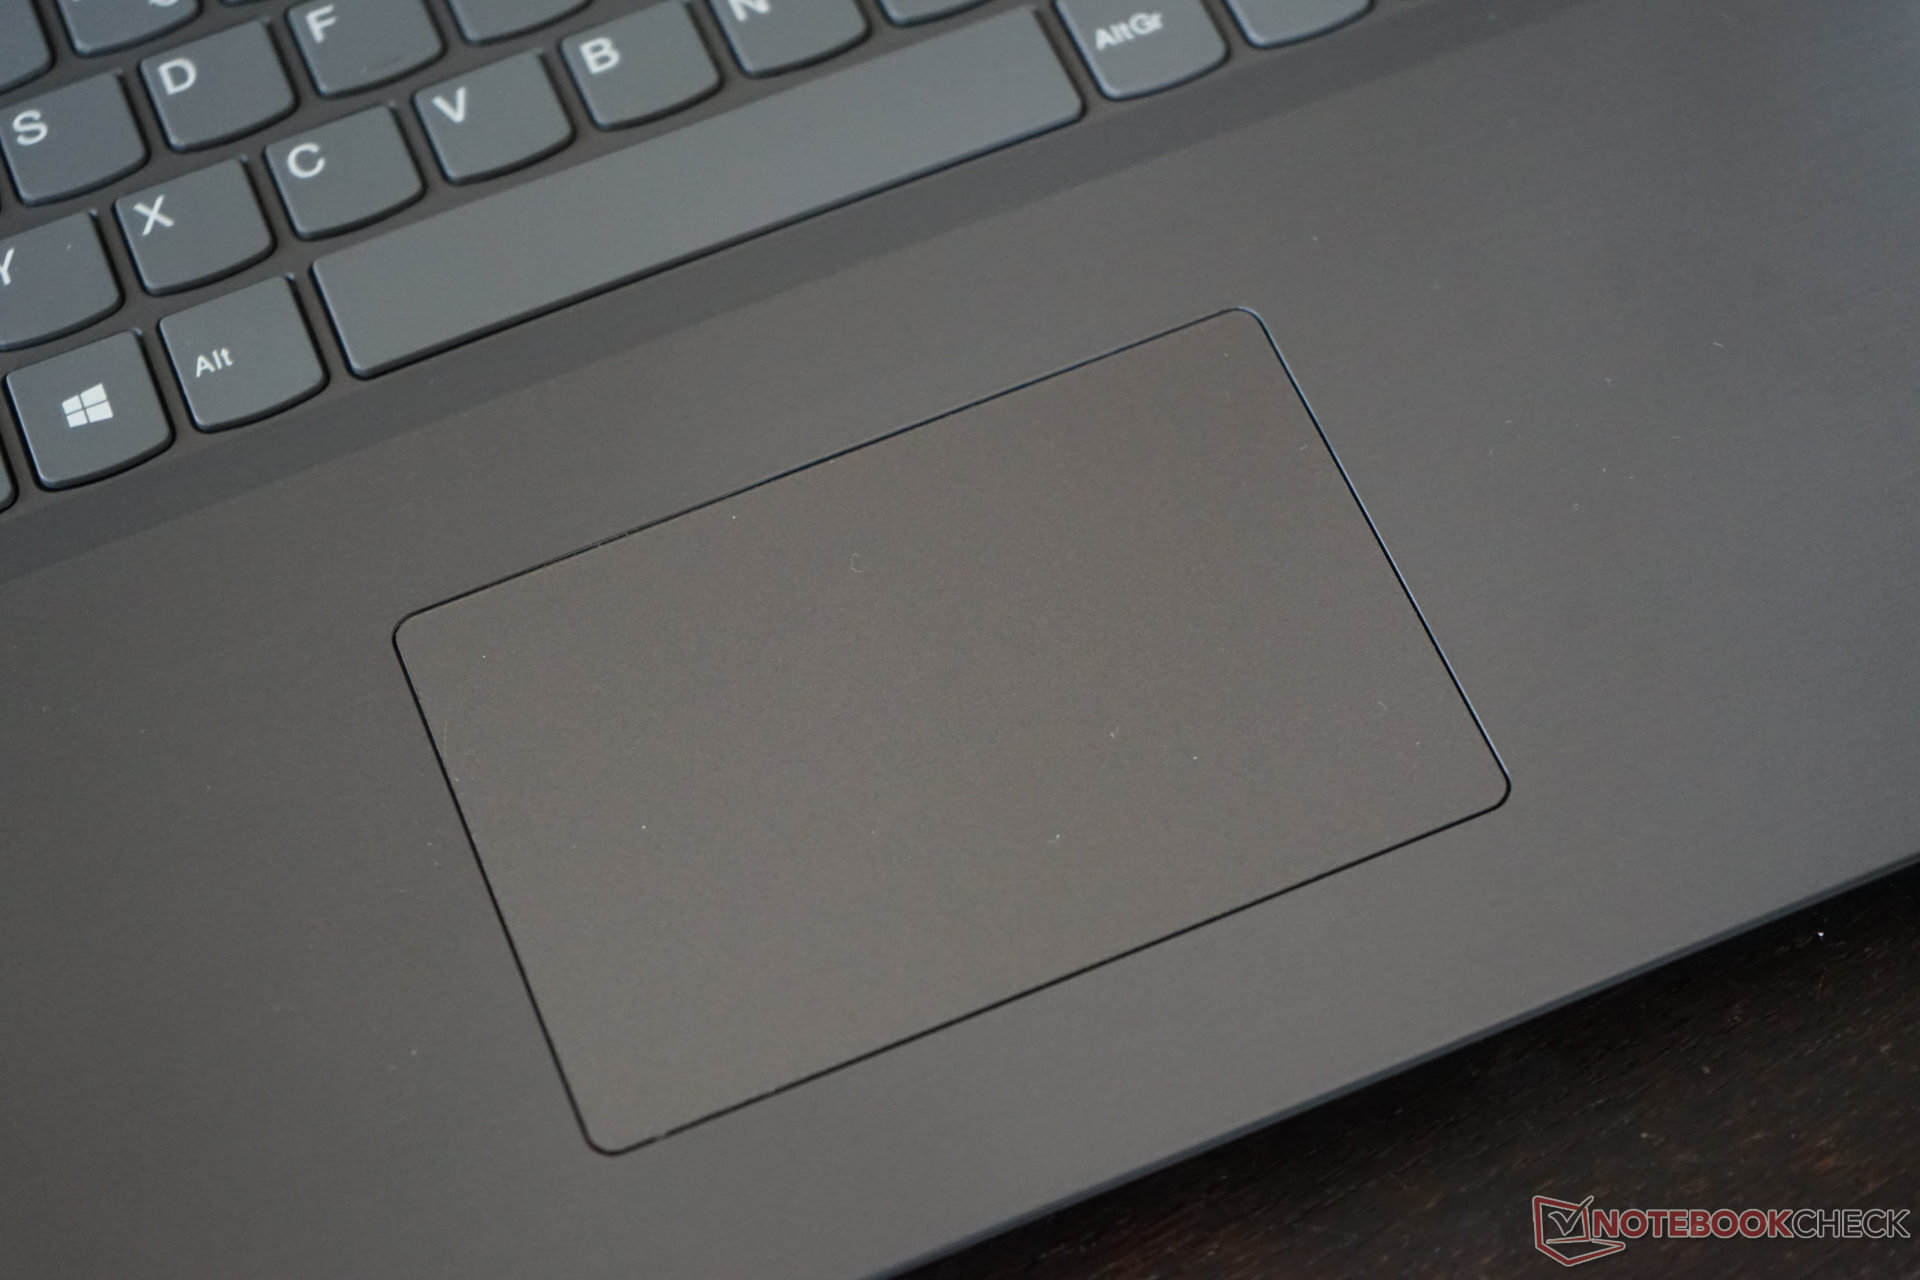
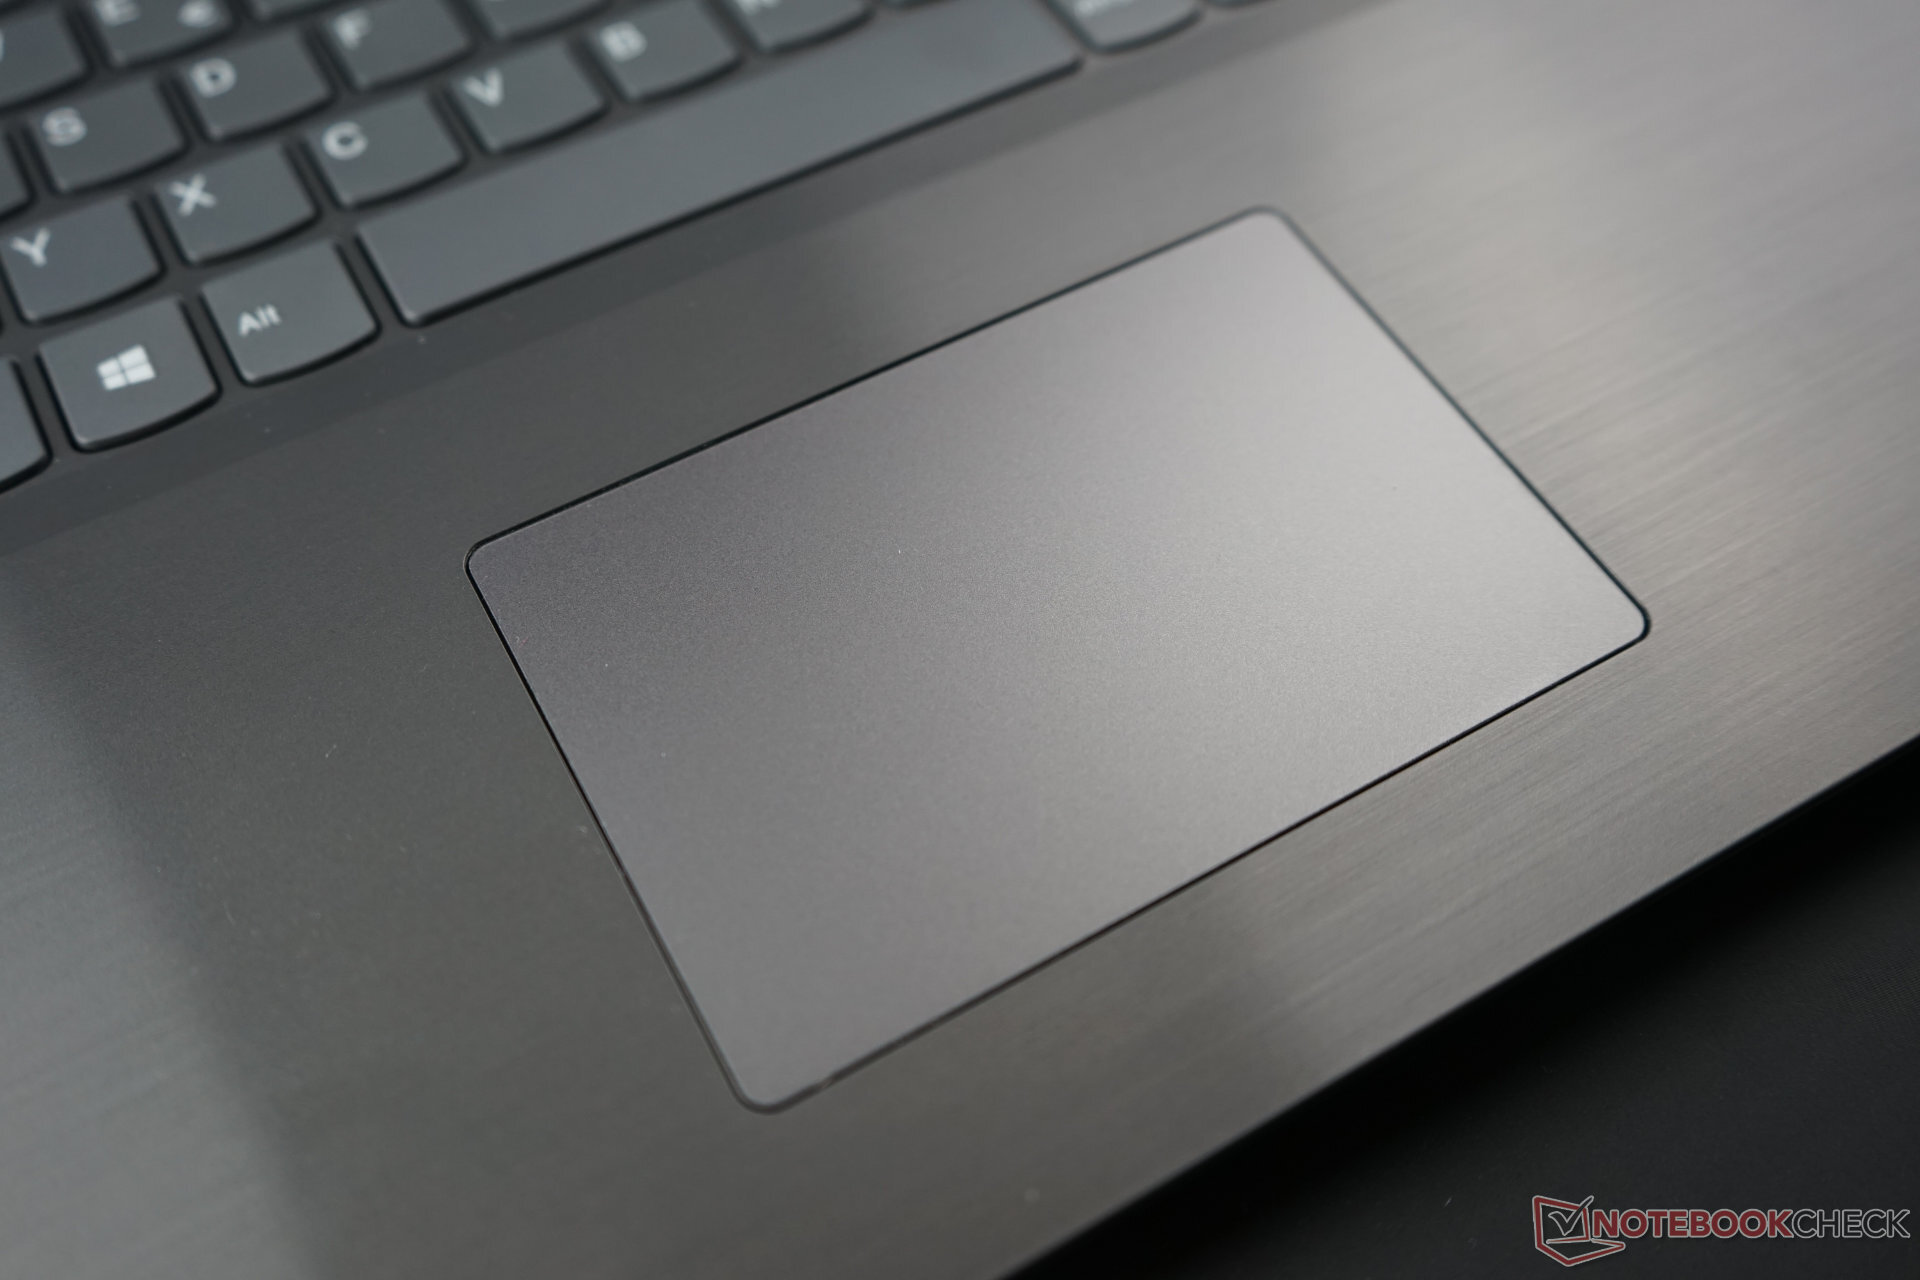
Touchpad
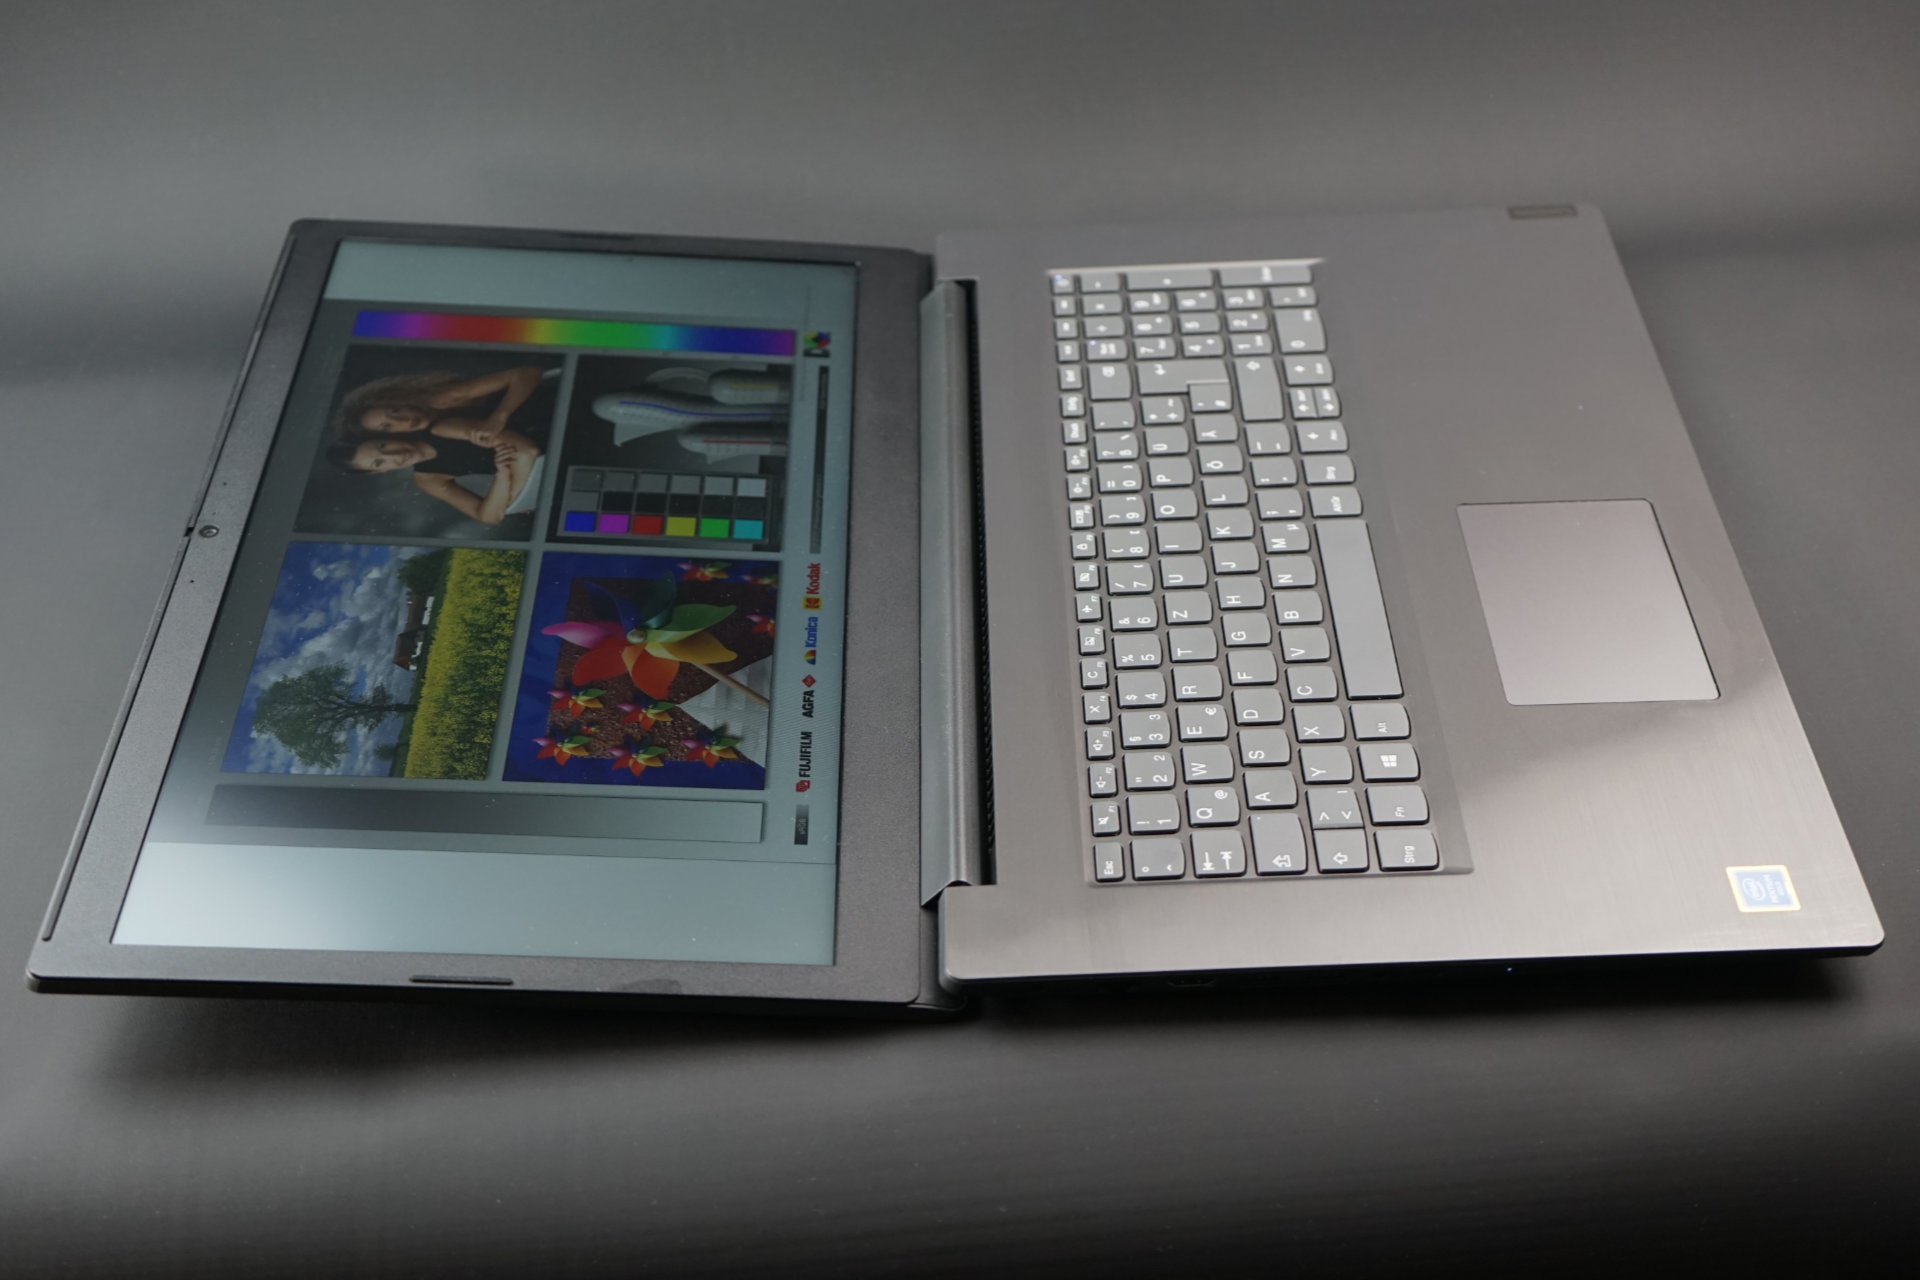
The ClickPad sits below the space bar - meaning it is off-center - and, in the case of our test device, comes from the manufacturer Elan. There were no Microsoft Precision drivers available via Microsoft Update or from Lenovo. The touchpad still supports multi-touch gestures and responds fairly reliably. While the plastic surface has relatively good gliding properties, it of course does not compare to the glass surfaces of high-end devices. Unfortunately, the integrated mouse key and the distinction between right and left clicks did work very reliably in our test. Thus, we often found ourselves using an external mouse. Overall, we consider the touchpad mostly a fallback for occasional use.
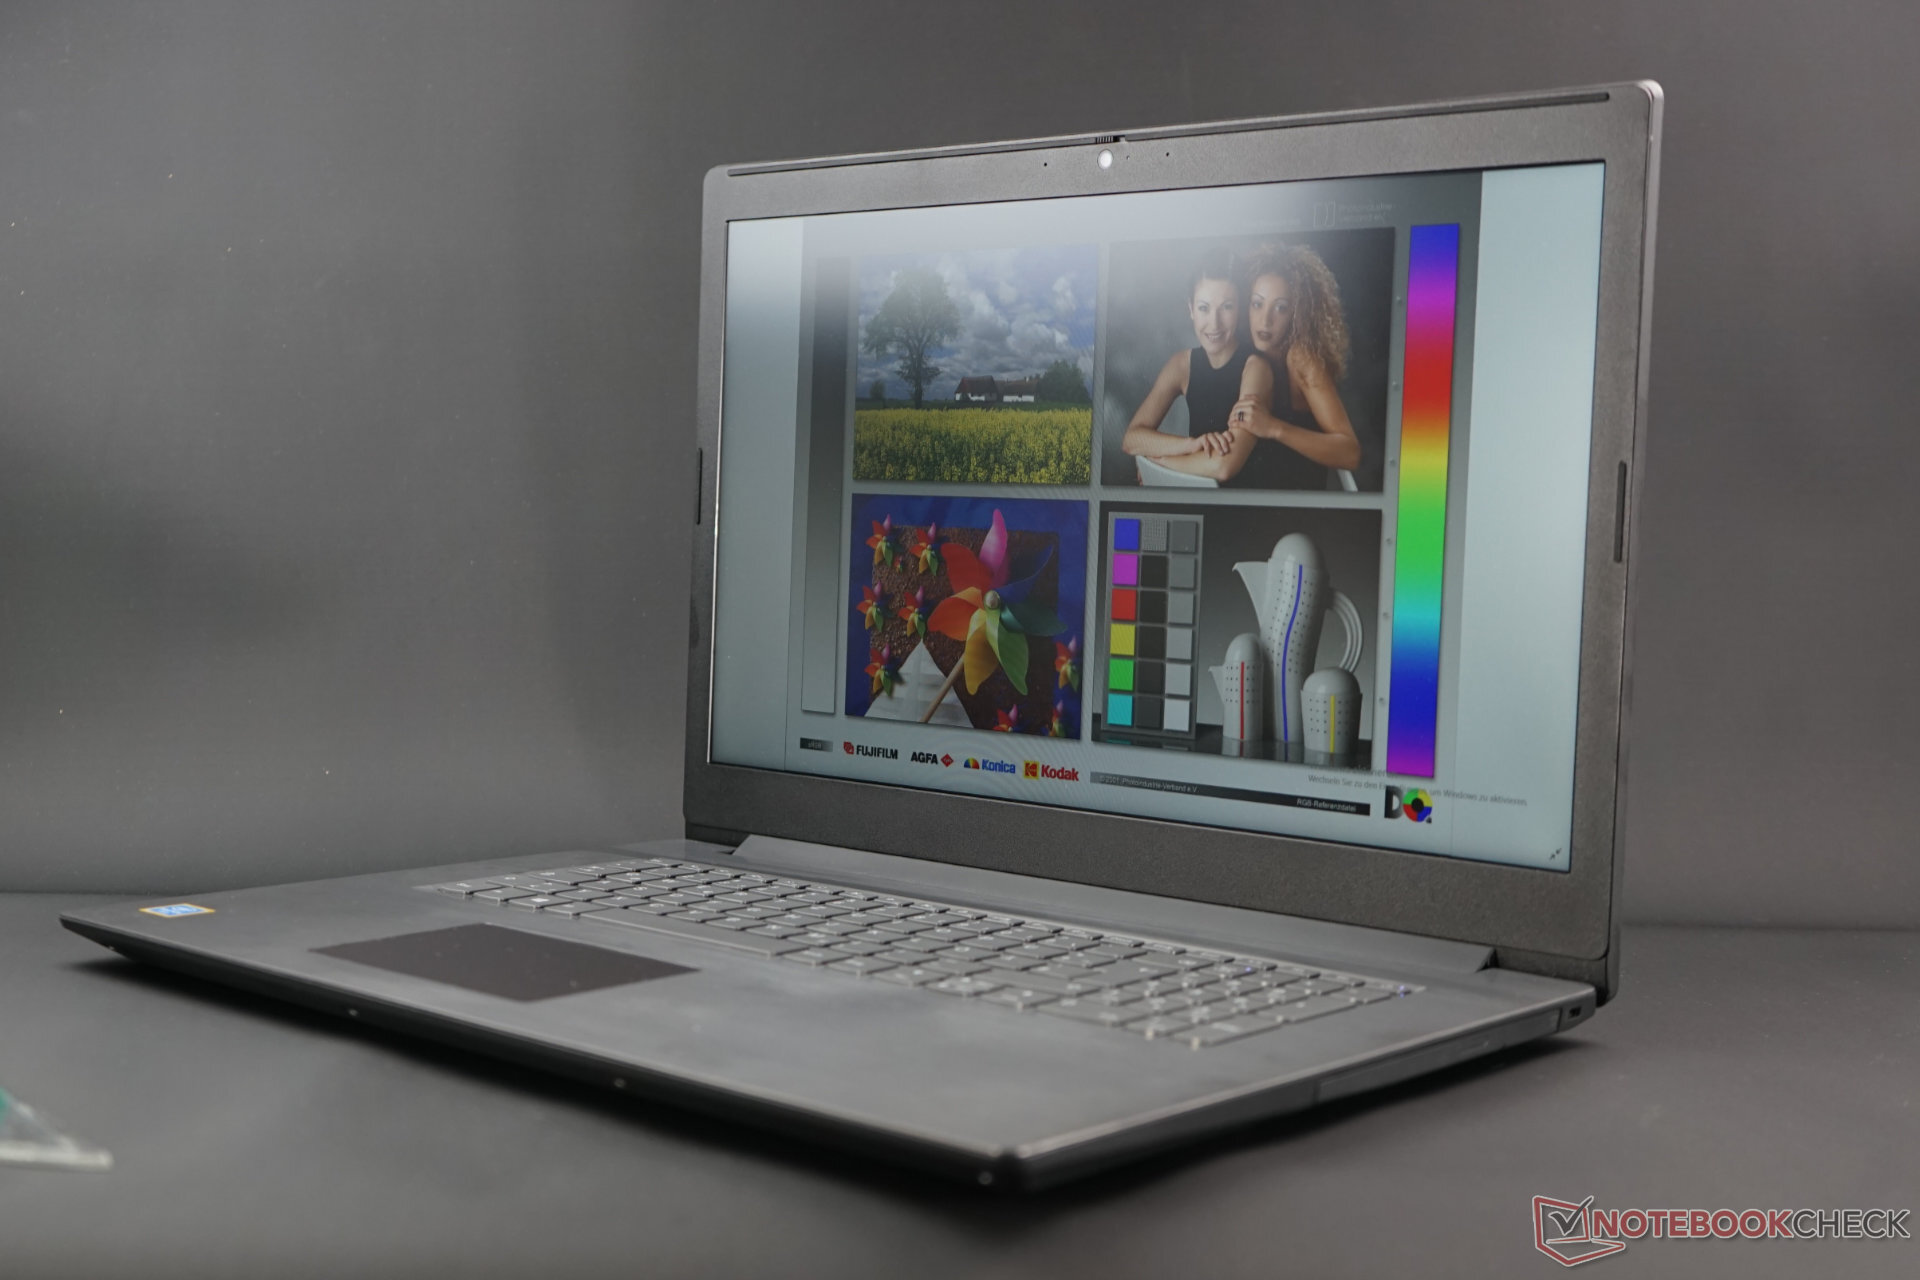
Display
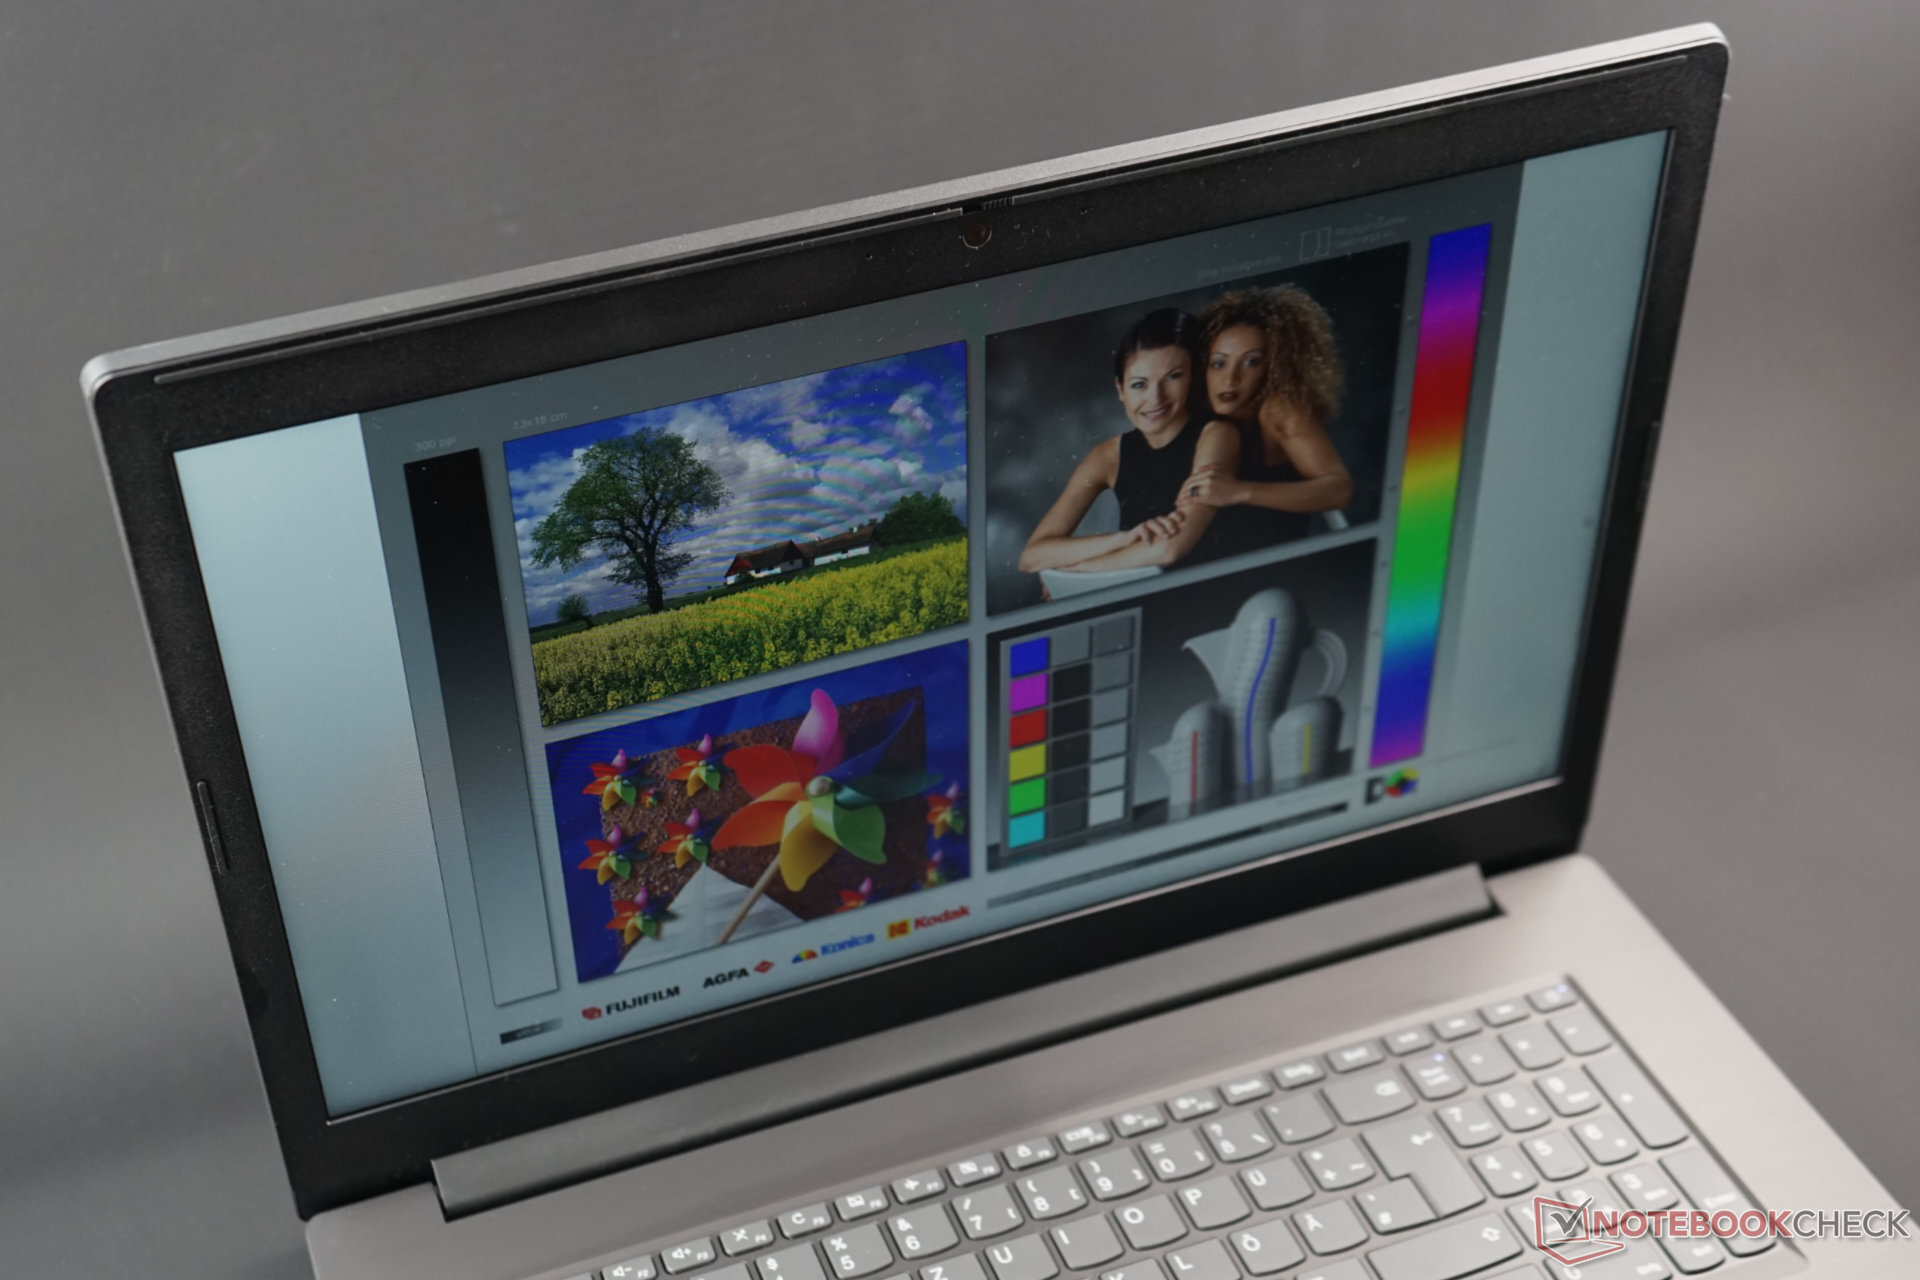
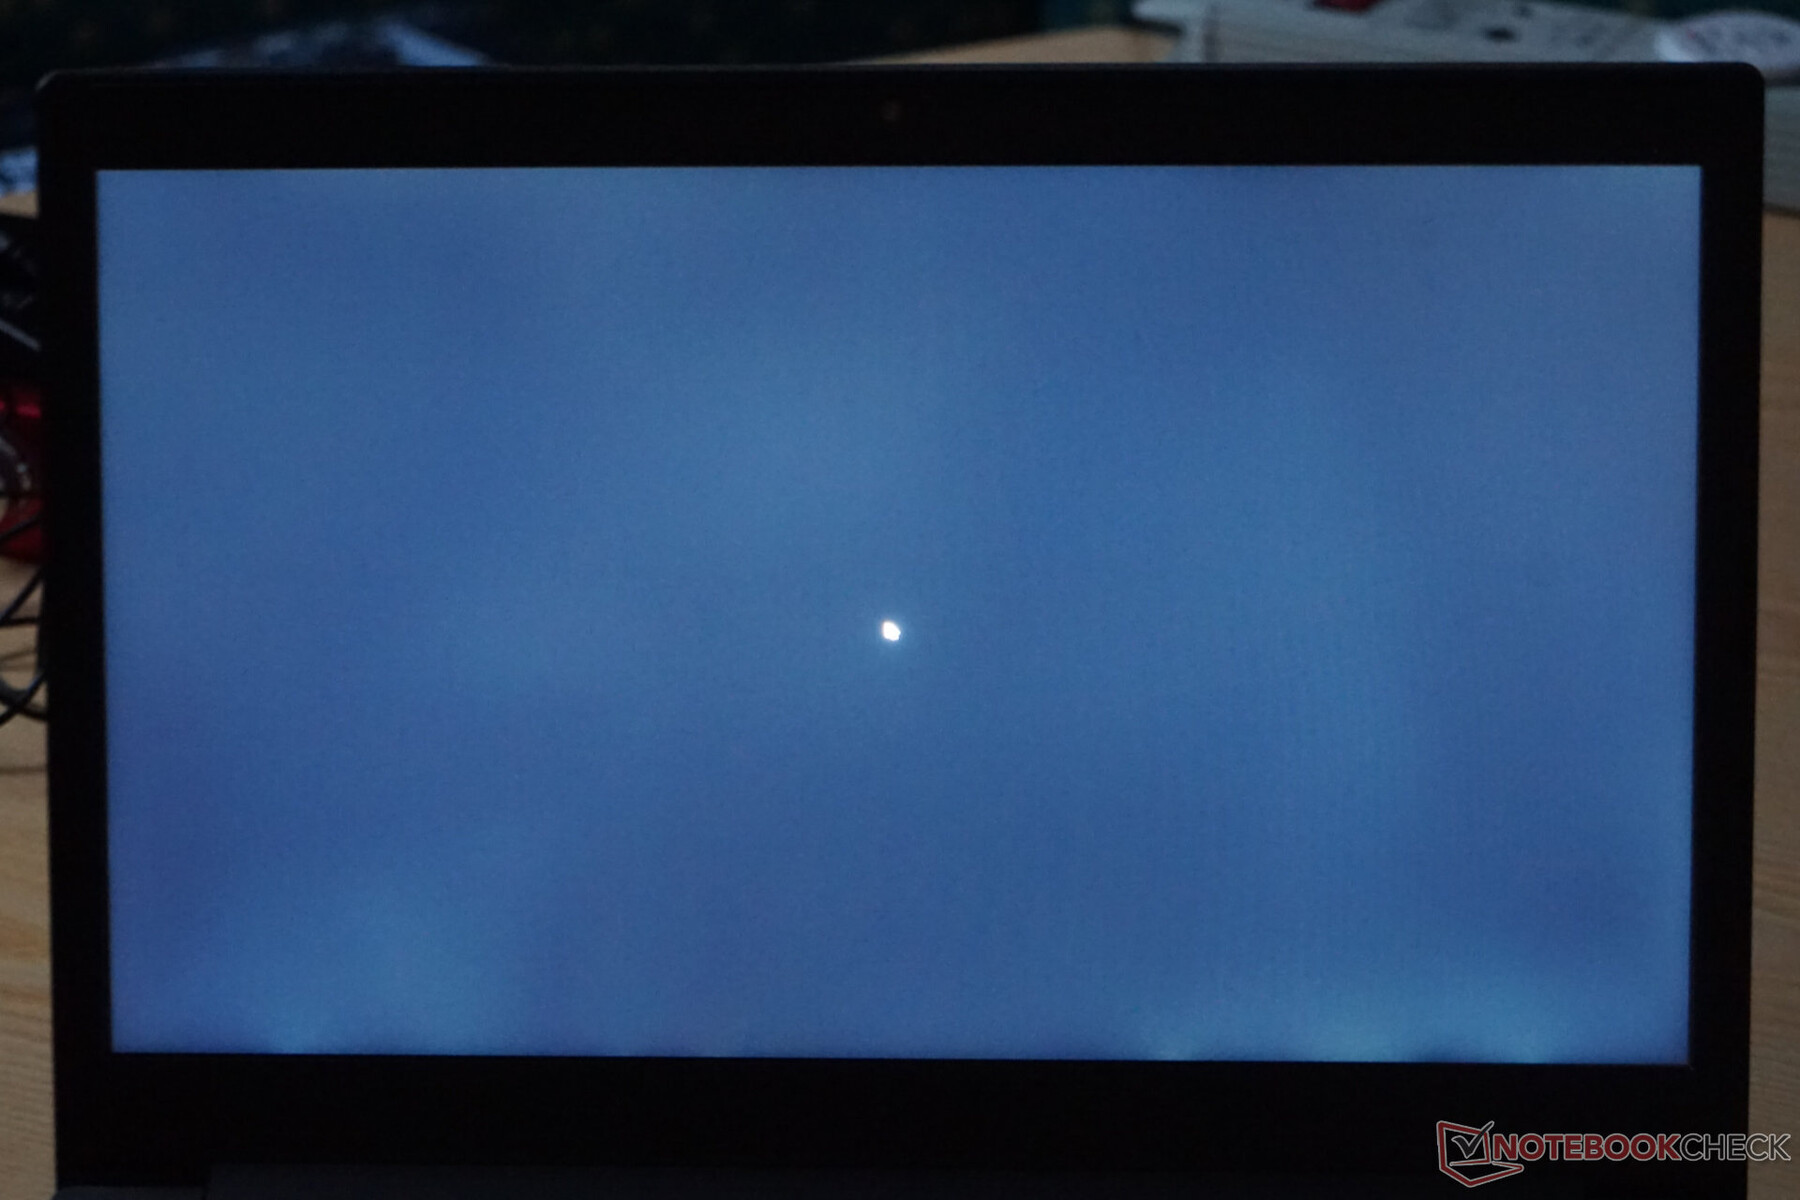
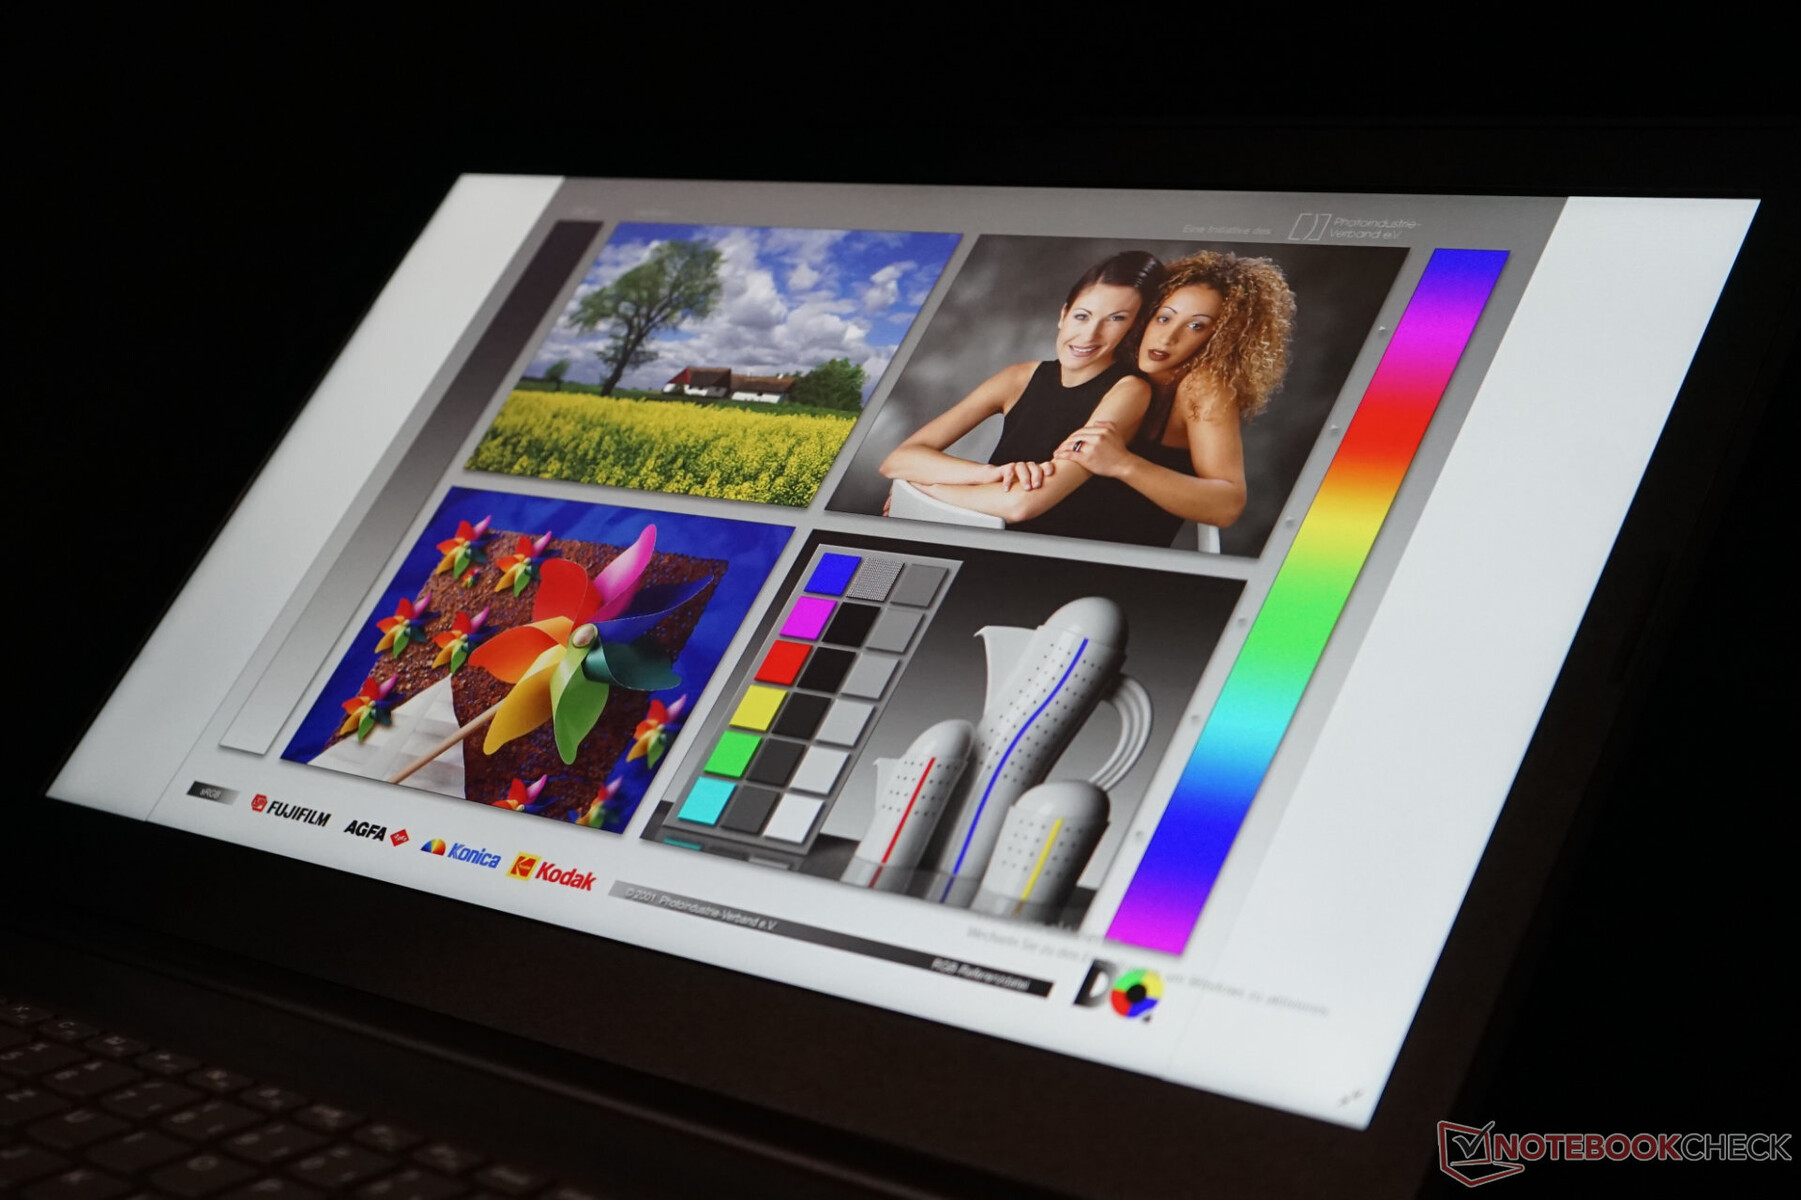
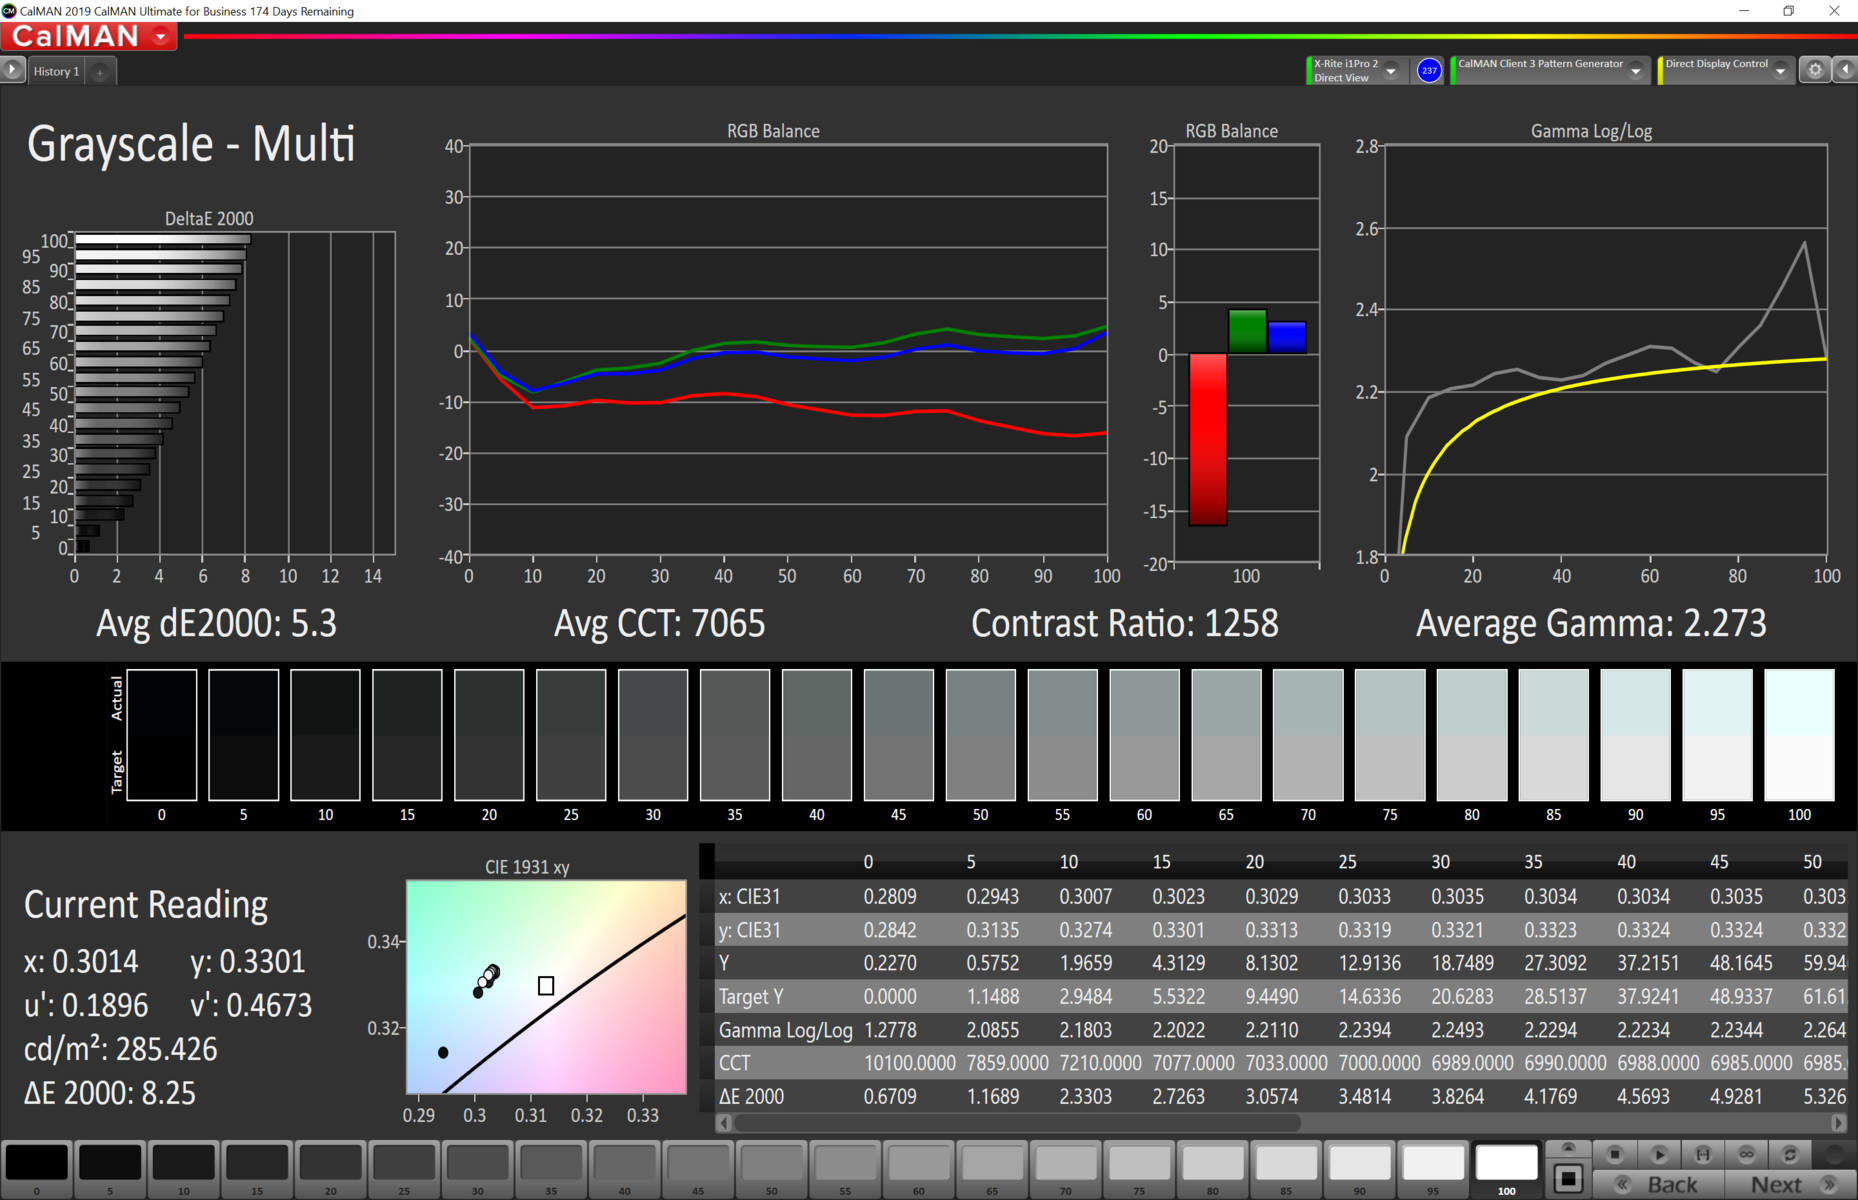
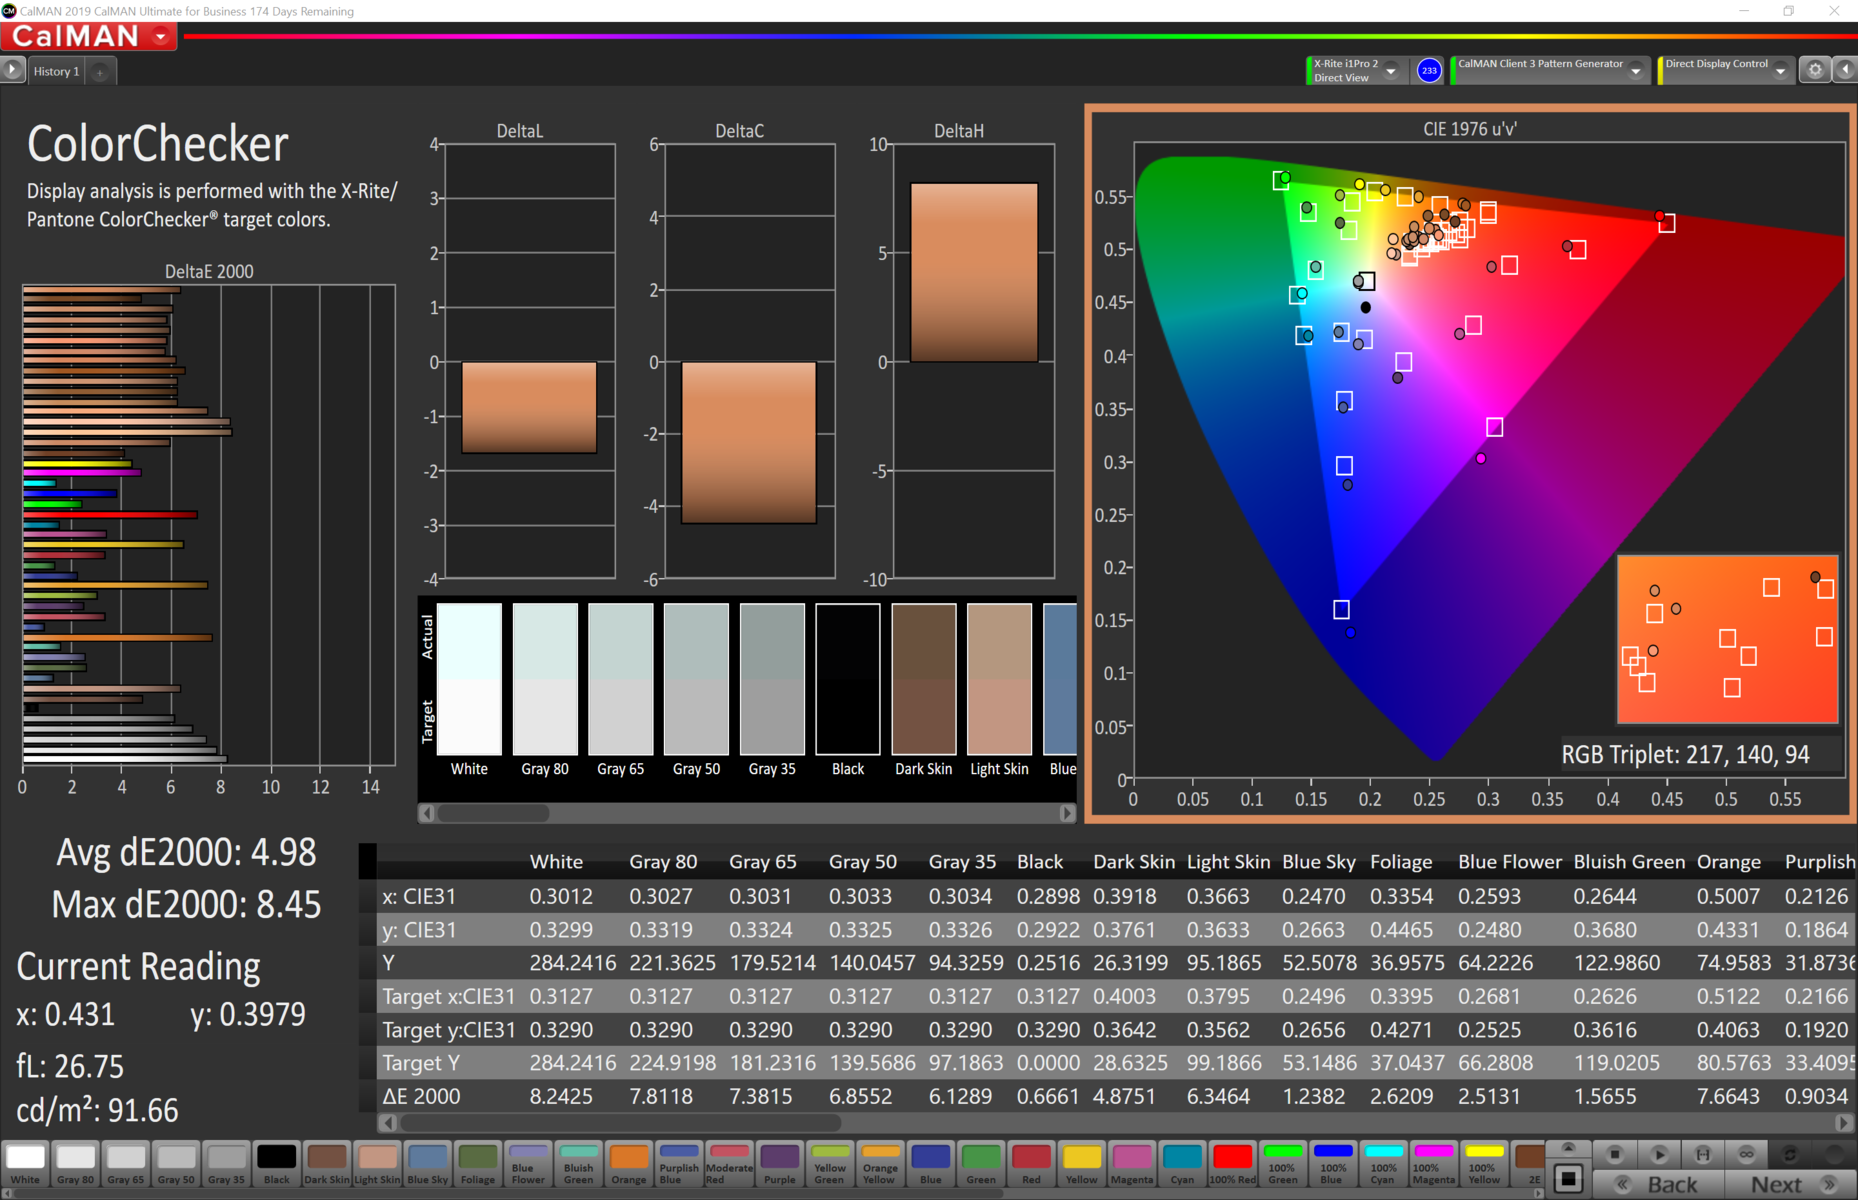
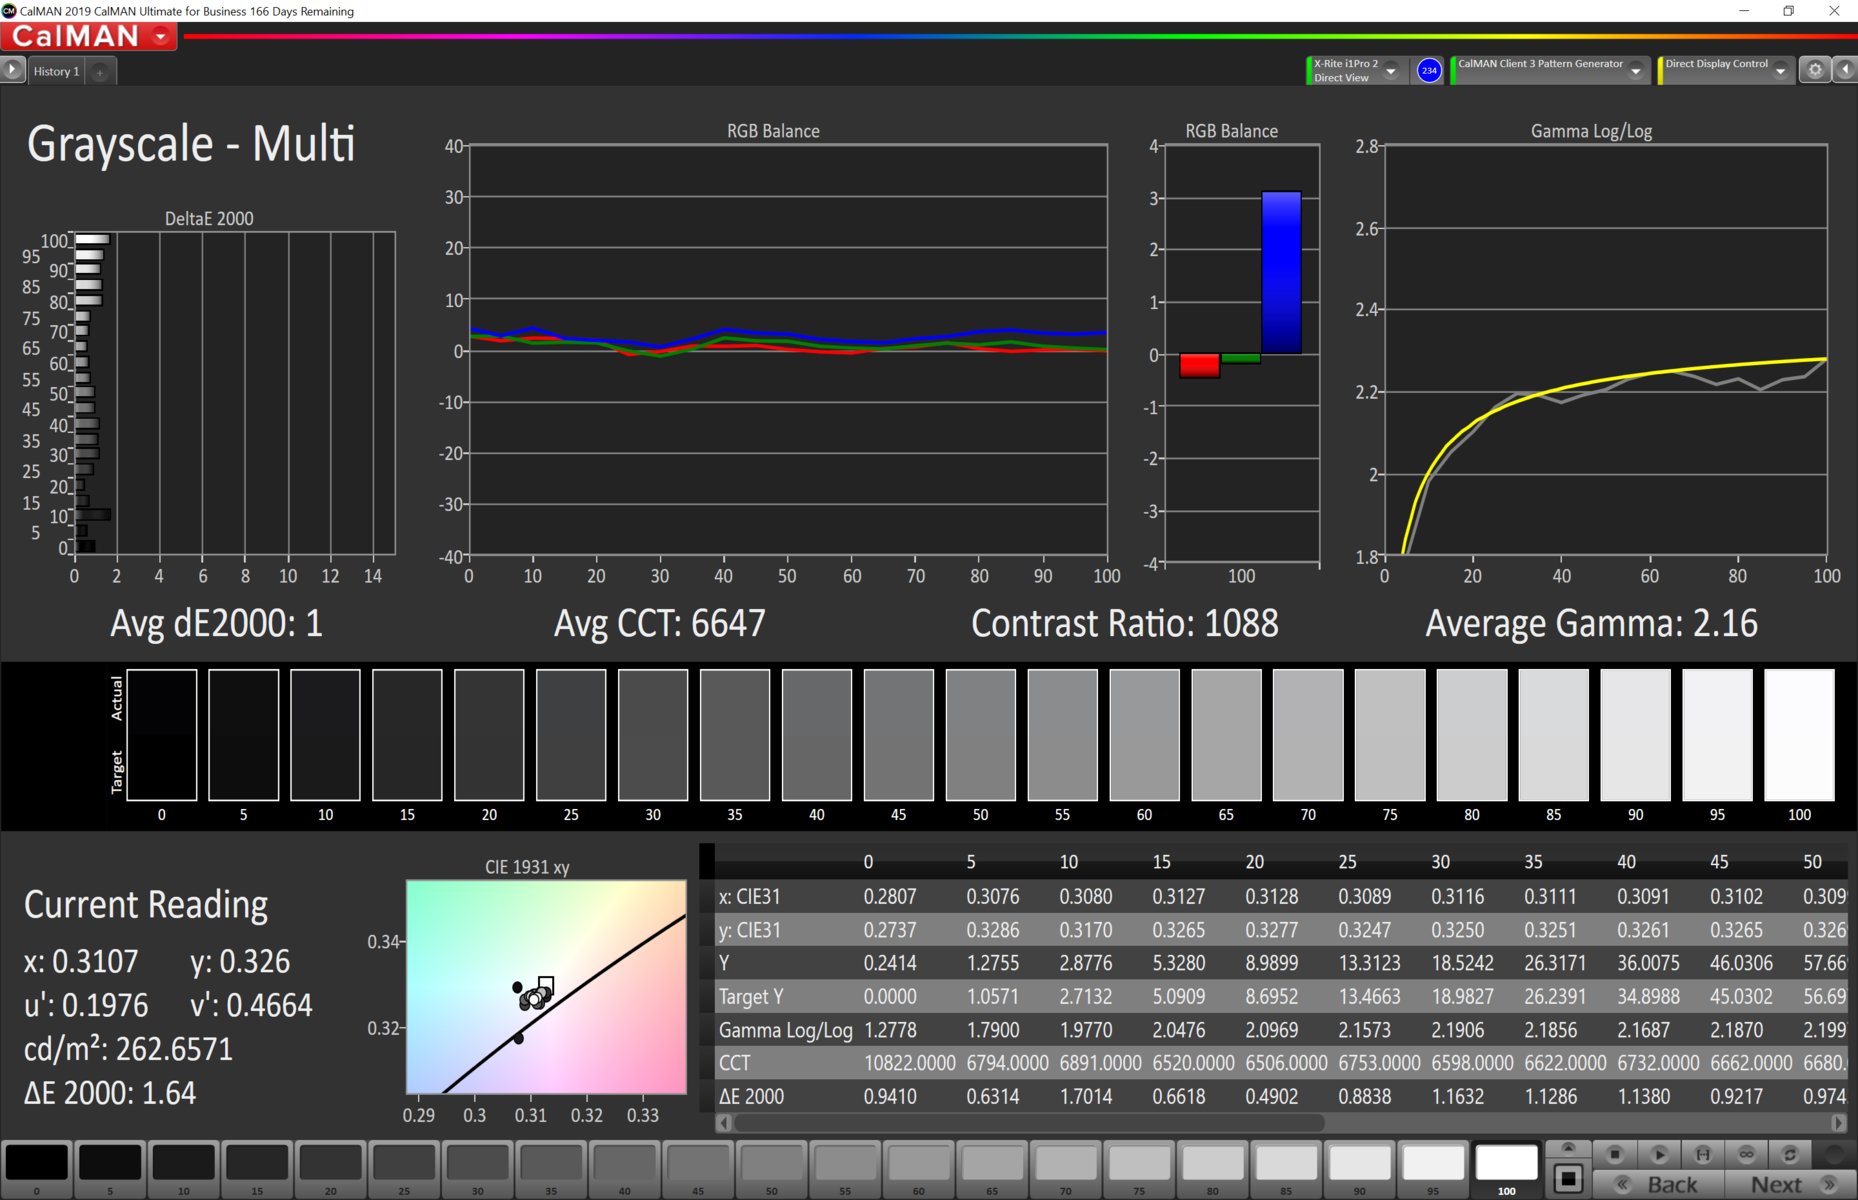
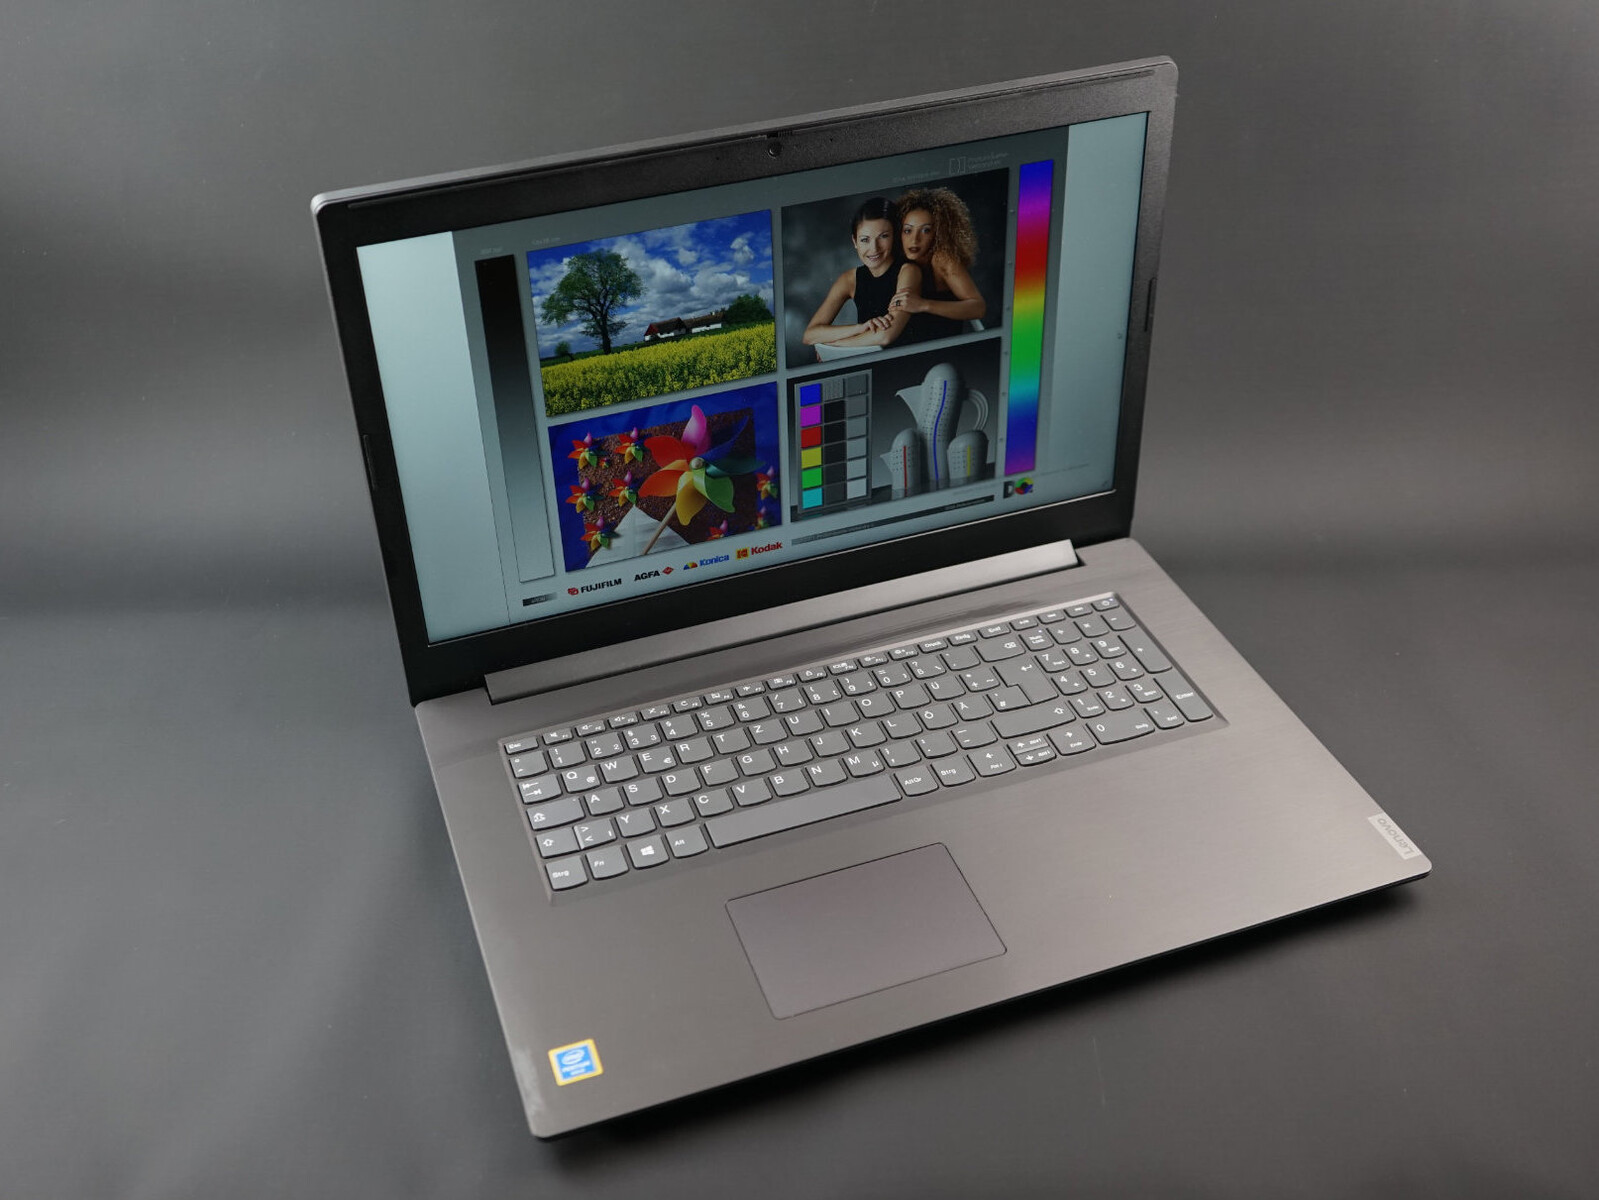
The large 17.3-inch screen offers a matte surface and Full HD resolution with 1920x1080 pixels. Thanks to the underlying IPS technology, the image is good subjectively and the viewing angles are solid. There are also cheaper models with TN displays, which you may want to avoid. The test results of the display are otherwise average. Across all measurements, the display achieves an average brightness of just 270 cd/m². Although this in conjunction with the matte layer is sufficient for indoor use, the screen quickly becomes unreadable in the sun. The color accuracy is not particularly good ex-factory and the display exhibits a noticeable blue tint. With 94% of the sRGB color space (measured with Argyll), the color space coverage is sufficiently large and the color representation is fairly precise after a calibration with the i1 Pro 2 (see screenshots). The illumination of the large display is mediocre and there is visible backlight bleeding on the bottom edge of our test device's screen (see picture below).

| |||||||||||||||||||||||||
Brightness Distribution: 77 %
Center on Battery: 284 cd/m²
Contrast: 1235:1 (Black: 0.23 cd/m²)
ΔE ColorChecker Calman: 4.98 | ∀{0.5-29.43 Ø4.72}
calibrated: 1.87
ΔE Greyscale Calman: 5.3 | ∀{0.09-98 Ø4.97}
94% sRGB (Argyll 1.6.3 3D)
61% AdobeRGB 1998 (Argyll 1.6.3 3D)
68% AdobeRGB 1998 (Argyll 3D)
94.2% sRGB (Argyll 3D)
67.5% Display P3 (Argyll 3D)
Gamma: 2273
CCT: 7065 K
| Lenovo V340-17IWL 81RG001YGE CMN N173HCE-E31 CMN1738, , 1920x1080, 17.3" | HP 17-by2437ng BOE NT173WDM-N21, TN LED, 1600x900, 17.3" | Lenovo Ideapad L340-17API-81LY0004GE AU Optronics B173RTN02.1, TN LED, 1600x900, 17.3" | Dell Inspiron 17 3780 AU Optronics B173HAN01.3, IPS, 1920x1080, 17.3" | Lenovo IdeaPad 330-17IKB 81DM BOE0685, TN LED, 1600x900, 17.3" | Acer Aspire ES1-732-P7YA Chi Mei N173FGE-E23, TN LED, 1600x900, 17.3" | HP 17-ca0013ng LG Philips LGD059E, IPS, 1920x1080, 17.3" | HP Envy 17-ae143ng AU Optronics B173HW01 V0, IPS, 1920x1080, 17.3" | Average of class Office | |
|---|---|---|---|---|---|---|---|---|---|
| Display | -21% | -23% | -6% | -18% | -18% | -5% | -6% | -11% | |
| Display P3 Coverage (%) | 67.5 | 53.6 -21% | 51.1 -24% | 63.7 -6% | 56.9 -16% | 53.5 -21% | 67 -1% | 63.9 -5% | 61.5 ? -9% |
| sRGB Coverage (%) | 94.2 | 74 -21% | 73.9 -22% | 88.9 -6% | 76.3 -19% | 80.1 -15% | 86.4 -8% | 88 -7% | 82 ? -13% |
| AdobeRGB 1998 Coverage (%) | 68 | 53.9 -21% | 52.7 -22% | 64.6 -5% | 55.9 -18% | 54.9 -19% | 63.2 -7% | 64.3 -5% | 61.5 ? -10% |
| Response Times | 20% | 22% | -30% | 21% | 5% | 9% | 15% | -17% | |
| Response Time Grey 50% / Grey 80% * (ms) | 37 ? | 42 ? -14% | 42 ? -14% | 46 ? -24% | 38.8 ? -5% | 49 ? -32% | 33 ? 11% | 33 ? 11% | 29.3 ? 21% |
| Response Time Black / White * (ms) | 25.8 ? | 12 ? 53% | 11 ? 57% | 35.2 ? -36% | 13.6 ? 47% | 15 ? 42% | 24 ? 7% | 21 ? 19% | 18.7 ? 28% |
| PWM Frequency (Hz) | 25000 ? | 250 ? | 961 | 47.8 ? -100% | |||||
| Screen | -78% | -62% | -2% | -68% | -50% | -12% | 1% | 1% | |
| Brightness middle (cd/m²) | 284 | 222 -22% | 230 -19% | 322.9 14% | 210.5 -26% | 227 -20% | 394 39% | 352 24% | 406 ? 43% |
| Brightness (cd/m²) | 268 | 208 -22% | 201 -25% | 322 20% | 204 -24% | 209 -22% | 352 31% | 330 23% | |
| Brightness Distribution (%) | 77 | 89 16% | 78 1% | 84 9% | 94 22% | 80 4% | 83 8% | 88 14% | |
| Black Level * (cd/m²) | 0.23 | 0.649 -182% | 0.46 -100% | 0.26 -13% | 0.63 -174% | 0.15 35% | 0.35 -52% | 0.31 -35% | 0.2495 ? -8% |
| Contrast (:1) | 1235 | 342 -72% | 500 -60% | 1242 1% | 334 -73% | 1513 23% | 1126 -9% | 1135 -8% | |
| Colorchecker dE 2000 * | 4.98 | 11.77 -136% | 10.36 -108% | 4.19 16% | 9.48 -90% | 12.93 -160% | 6.08 -22% | 4.34 13% | 4.16 ? 16% |
| Colorchecker dE 2000 max. * | 8.45 | 20.78 -146% | 18.63 -120% | 7.04 17% | 17.19 -103% | 20.92 -148% | 10.88 -29% | 8.69 -3% | 11.5 ? -36% |
| Colorchecker dE 2000 calibrated * | 1.87 | 3.5 -87% | 3.55 -90% | 4.04 -116% | 2.8 -50% | 2.57 ? -37% | |||
| Greyscale dE 2000 * | 5.3 | 14.31 -170% | 13.32 -151% | 4.5 15% | 12 -126% | 14.69 -177% | 7.22 -36% | 5.66 -7% | 3.96 ? 25% |
| Gamma | 2273 0% | 2.24 98% | 2.54 87% | 1.97 112% | 2.12 104% | 2.38 92% | 2.48 89% | 2.29 96% | 2.23 99% ? |
| CCT | 7065 92% | 19250 34% | 14124 46% | 7041 92% | 13874 47% | 19863 33% | 7997 81% | 6326 103% | 6776 96% ? |
| Color Space (Percent of AdobeRGB 1998) (%) | 61 | 48 -21% | 48 -21% | 57.6 -6% | 49.4 -19% | 51 -16% | 57 -7% | 57 -7% | |
| Color Space (Percent of sRGB) (%) | 94 | 74 -21% | 74 -21% | 88.4 -6% | 75.8 -19% | 80 -15% | 86 -9% | 88 -6% | |
| Total Average (Program / Settings) | -26% /
-55% | -21% /
-43% | -13% /
-6% | -22% /
-47% | -21% /
-36% | -3% /
-8% | 3% /
1% | -9% /
-7% |
* ... smaller is better
The response times are typical for a cheap 60-Hz IPS panel and not particularly fast. While office users will likely not notice this, 3D shooter fans will be disappointed. The latter group will also find the integrated graphics, which we will go into detail about later, to be problematic.
For energy conservation purposes, Lenovo uses PWM to control the brightness at less than 25% of its maximum setting. Due to the high frequency of 25 kHz and the low activation threshold, this should not be an issue for most users. Only sensitive users who like to work in the dark with their laptop should be aware of this behavior.
Display Response Times
| ↔ Response Time Black to White | ||
|---|---|---|
| 25.8 ms ... rise ↗ and fall ↘ combined | ↗ 15.2 ms rise | 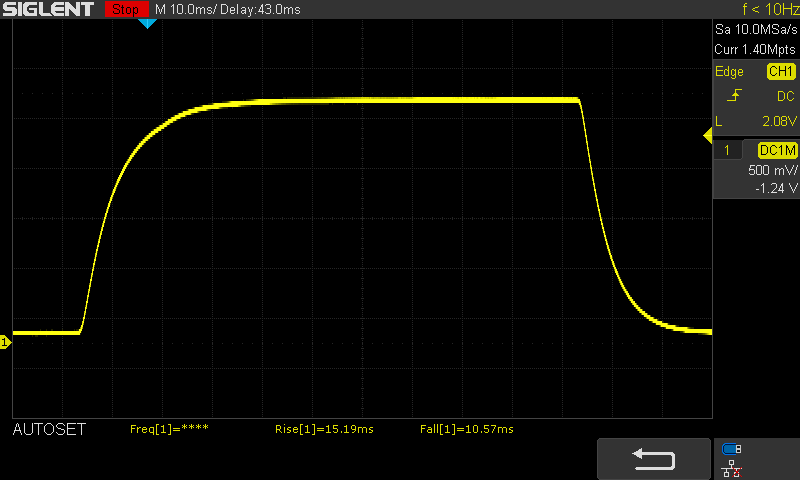 |
| ↘ 10.6 ms fall | ||
| The screen shows relatively slow response rates in our tests and may be too slow for gamers. In comparison, all tested devices range from 0.1 (minimum) to 240 (maximum) ms. » 62 % of all devices are better. This means that the measured response time is worse than the average of all tested devices (19.8 ms). | ||
| ↔ Response Time 50% Grey to 80% Grey | ||
| 37 ms ... rise ↗ and fall ↘ combined | ↗ 17.7 ms rise | 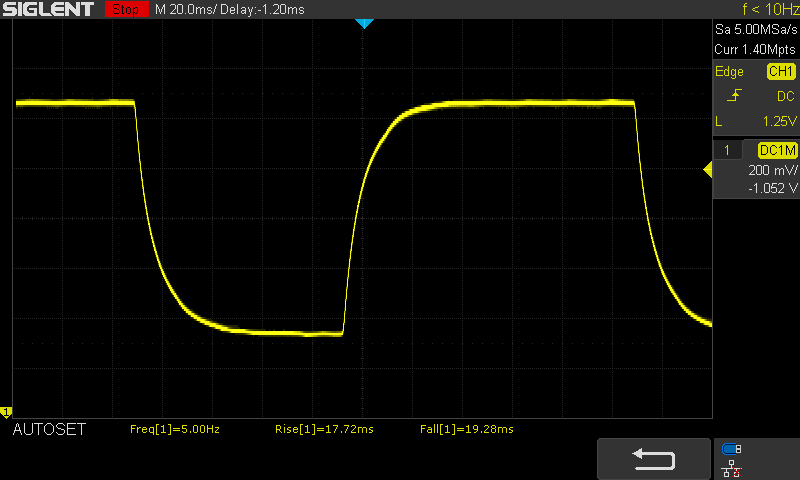 |
| ↘ 19.3 ms fall | ||
| The screen shows slow response rates in our tests and will be unsatisfactory for gamers. In comparison, all tested devices range from 0.165 (minimum) to 636 (maximum) ms. » 53 % of all devices are better. This means that the measured response time is worse than the average of all tested devices (31 ms). | ||
Screen Flickering / PWM (Pulse-Width Modulation)
| Screen flickering / PWM detected | 25000 Hz | ≤ 24 % brightness setting | 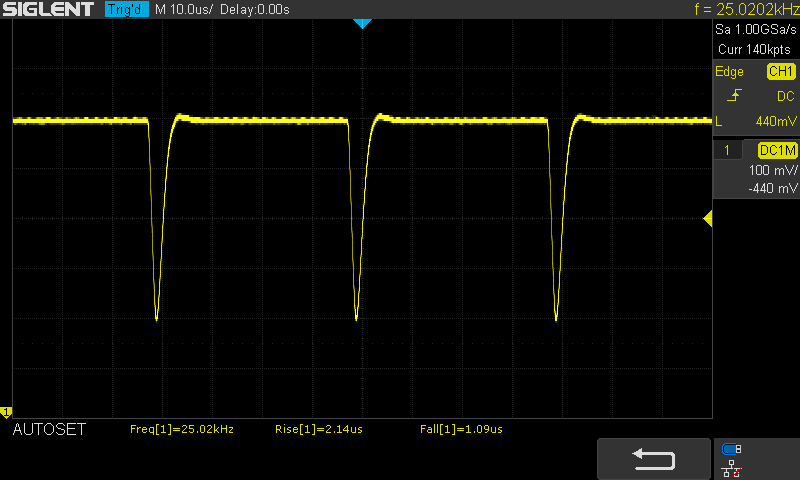 |
The display backlight flickers at 25000 Hz (worst case, e.g., utilizing PWM) Flickering detected at a brightness setting of 24 % and below. There should be no flickering or PWM above this brightness setting. The frequency of 25000 Hz is quite high, so most users sensitive to PWM should not notice any flickering. In comparison: 52 % of all tested devices do not use PWM to dim the display. If PWM was detected, an average of 7747 (minimum: 5 - maximum: 343500) Hz was measured. | |||
Performance
Our test device is a reasonable entry-level configuration with a Pentium Gold dual-core CPU, integrated graphics, 8 GB of (single-channel) RAM and a 256-GB SSD. Apparently, there are even lower-end configurations with a TN display, 4 GB of RAM and an HDD. However, unless you plan on upgrading, we advise against these configurations.
Processor
The Intel Pentium Gold 5405U is an energy-efficient dual-core processor that is based on the Whiskey Lake architecture. Its two processor cores are based on the Skylake architecture and support clock speeds of up to 2.3 GHz. Due to the lack of Turbo Boost, the single-core performance is limited. Thanks to Hyper-Threading (SMT), 4 threads can be processed simultaneously. Technologically, it barely differs from the older Pentium Gold 4417U, which has identical specifications. The benchmarks also reflect this and the Acer Swift 3 SF314-54-P2RK for example achieves essentially identical scores in Cinebench R15 (continuous). Compared to current Core i3 models (such as the HP 17-by2437ng with the Core i3-10110U), the Pentium processor is at a significant disadvantage. Both the single-core and the multi-core performance are substantially slower.
Core i3-8145U, i5-8265U, and i7-8565U configuration options are also available for the V340. Thanks to their high Turbo Boost clock speeds, these CPUs outperform the CPU in our test device by a significant margin in single-core benchmarks. Supposedly, this also leads to far better responsiveness when browsing or starting applications. For these scenarios, shor-term bursts are particularly helpful. Users who are able to use all four cores (for programming and many games), would be better served by the Core i5.
Due to the low energy consumption, moderate heat development, and the large case, there is no measurable throttling. Even under heavy load, the CPU maintains a 2.3-GHz clock rate and does not reduce its performance.
Cinebench R15: CPU Single 64Bit | CPU Multi 64Bit
Blender: v2.79 BMW27 CPU
7-Zip 18.03: 7z b 4 -mmt1 | 7z b 4
Geekbench 5.5: Single-Core | Multi-Core
HWBOT x265 Benchmark v2.2: 4k Preset
LibreOffice : 20 Documents To PDF
R Benchmark 2.5: Overall mean
| Cinebench R20 / CPU (Single Core) | |
| Average of class Office (345 - 816, n=73, last 2 years) | |
| HP 17-by2437ng | |
| Average Intel Core i5-8265U (325 - 403, n=16) | |
| Average Intel Core i3-8145U (n=1) | |
| Lenovo V340-17IWL 81RG001YGE | |
| Acer Swift 3 SF314-54-P2RK | |
| Cinebench R20 / CPU (Multi Core) | |
| Average of class Office (648 - 8840, n=73, last 2 years) | |
| Average Intel Core i5-8265U (972 - 1564, n=16) | |
| HP 17-by2437ng | |
| Average Intel Core i3-8145U (n=1) | |
| Lenovo V340-17IWL 81RG001YGE | |
| Acer Swift 3 SF314-54-P2RK | |
| Cinebench R15 / CPU Single 64Bit | |
| Average of class Office (99.5 - 313, n=75, last 2 years) | |
| HP 17-by2437ng | |
| Average Intel Core i5-8265U (111 - 164, n=35) | |
| Average Intel Core i3-8145U (139 - 154, n=4) | |
| Lenovo IdeaPad V110-15IKB 80TH001SGE | |
| Lenovo V340-17IWL 81RG001YGE | |
| Acer Swift 3 SF314-54-P2RK | |
| Cinebench R15 / CPU Multi 64Bit | |
| Average of class Office (250 - 3380, n=75, last 2 years) | |
| Average Intel Core i5-8265U (457 - 750, n=38) | |
| Average Intel Core i3-8145U (318 - 361, n=4) | |
| HP 17-by2437ng | |
| Lenovo IdeaPad V110-15IKB 80TH001SGE | |
| Acer Swift 3 SF314-54-P2RK | |
| Lenovo V340-17IWL 81RG001YGE | |
| Blender / v2.79 BMW27 CPU | |
| Lenovo V340-17IWL 81RG001YGE | |
| HP 17-by2437ng | |
| Average Intel Core i5-8265U (769 - 1098, n=15) | |
| Average of class Office (158 - 1940, n=74, last 2 years) | |
| 7-Zip 18.03 / 7z b 4 -mmt1 | |
| Average of class Office (3387 - 6469, n=75, last 2 years) | |
| HP 17-by2437ng | |
| Average Intel Core i5-8265U (3780 - 4195, n=15) | |
| Lenovo V340-17IWL 81RG001YGE | |
| 7-Zip 18.03 / 7z b 4 | |
| Average of class Office (7098 - 76886, n=75, last 2 years) | |
| Average Intel Core i5-8265U (13731 - 18802, n=15) | |
| HP 17-by2437ng | |
| Lenovo V340-17IWL 81RG001YGE | |
| Geekbench 5.5 / Single-Core | |
| Average of class Office (811 - 2148, n=71, last 2 years) | |
| Average Intel Core i5-8265U (1024 - 1047, n=4) | |
| HP 17-by2437ng | |
| Lenovo V340-17IWL 81RG001YGE | |
| Geekbench 5.5 / Multi-Core | |
| Average of class Office (1483 - 16999, n=71, last 2 years) | |
| Average Intel Core i5-8265U (3442 - 3986, n=4) | |
| HP 17-by2437ng | |
| Lenovo V340-17IWL 81RG001YGE | |
| HWBOT x265 Benchmark v2.2 / 4k Preset | |
| Average of class Office (2.21 - 26, n=74, last 2 years) | |
| Average Intel Core i5-8265U (3.38 - 4.8, n=15) | |
| HP 17-by2437ng | |
| Average Intel Core i3-8145U (n=1) | |
| Lenovo V340-17IWL 81RG001YGE | |
| LibreOffice / 20 Documents To PDF | |
| Lenovo V340-17IWL 81RG001YGE | |
| HP 17-by2437ng | |
| Average Intel Core i5-8265U (59.4 - 67.8, n=4) | |
| Average of class Office (39.9 - 102.3, n=74, last 2 years) | |
| R Benchmark 2.5 / Overall mean | |
| Lenovo V340-17IWL 81RG001YGE | |
| HP 17-by2437ng | |
| Average Intel Core i5-8265U (0.72 - 0.754, n=4) | |
| Average of class Office (0.4047 - 0.888, n=74, last 2 years) | |
* ... smaller is better
System Performance
The non-Turbo dual-core Pentium CPU is definitely an impediment for the general system performance. Devices with a Core i3-8145U are significantly faster on average, while Core i5-based laptops provide another noticeable performance jump. Meanwhile, entry-level devices with Atom-based CPUs such as the Acer Aspire ES1-732 with the Pentium N4200 fall behind by a large margin. In this case, a slower system drive (HDD, slow SSD or eMMC) further reduces the performance level. The V340 is slower than most average office laptops.
For daily use and undemanding tasks such as web browsing with few tabs, office tasks, or simple photo editing, the V340 is still a good choice. The SSD minimizes loading times and delays. That being said, slightly more demanding users may want to take a look at the Core i5 model and the 12 GB RAM option, which allows 4 GB of RAM to run in dual-channel mode (4 GB soldered + 8 GB stick).
| PCMark 10 Score | 2363 points | |
Help | ||
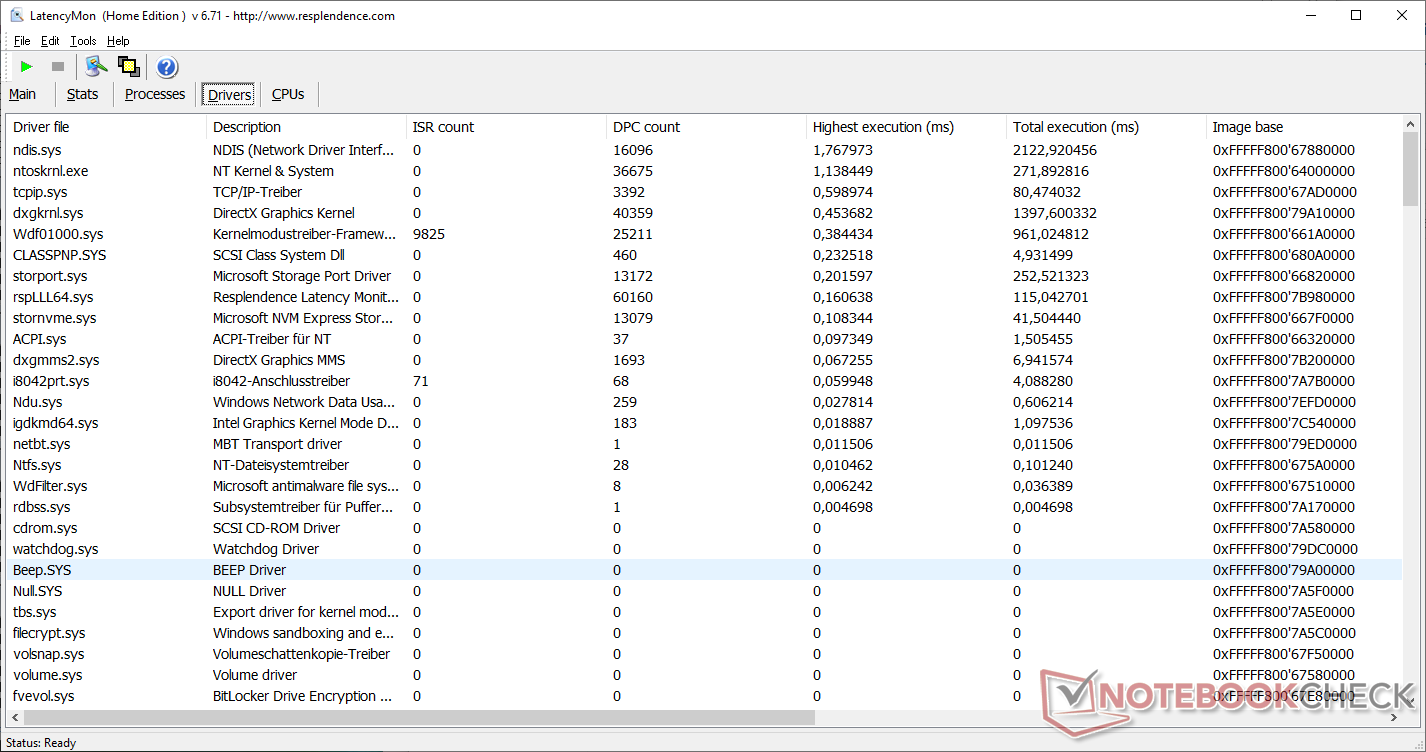
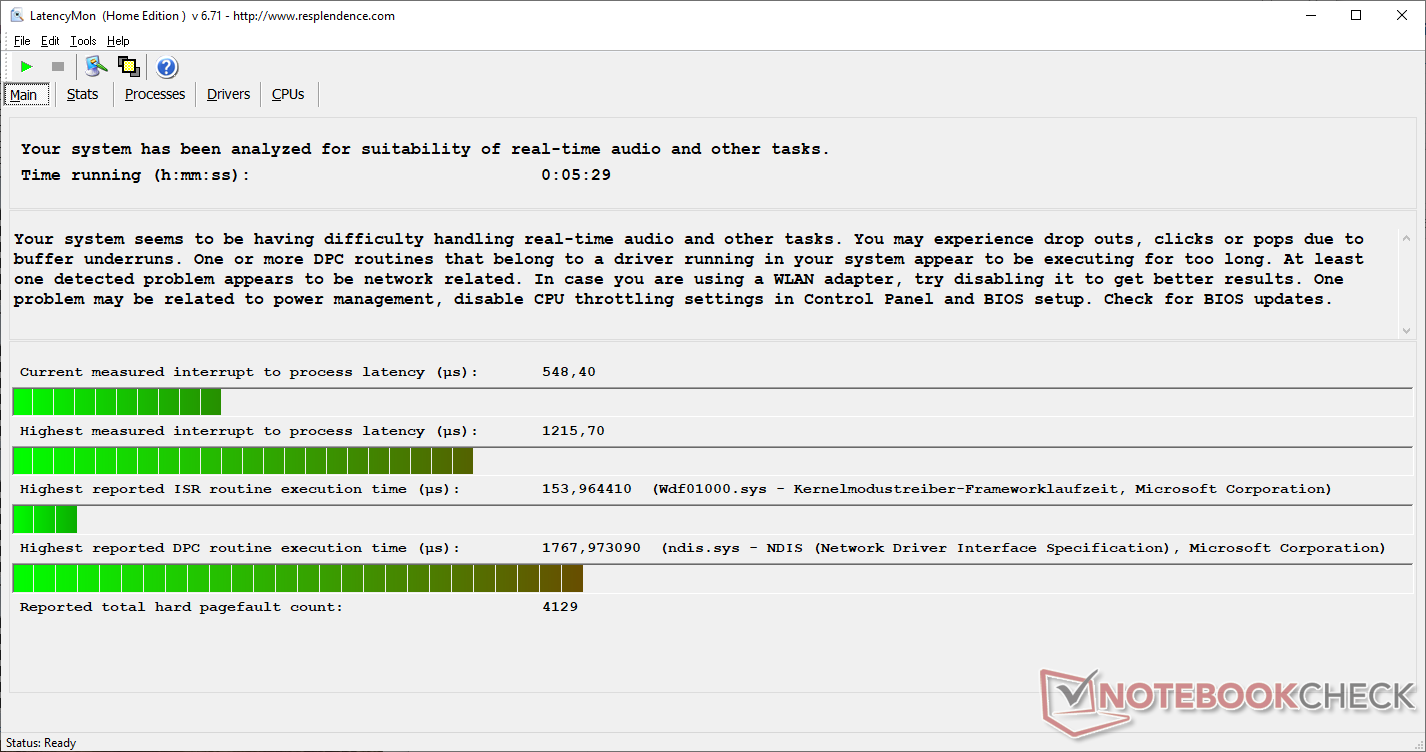
DPC Latencies
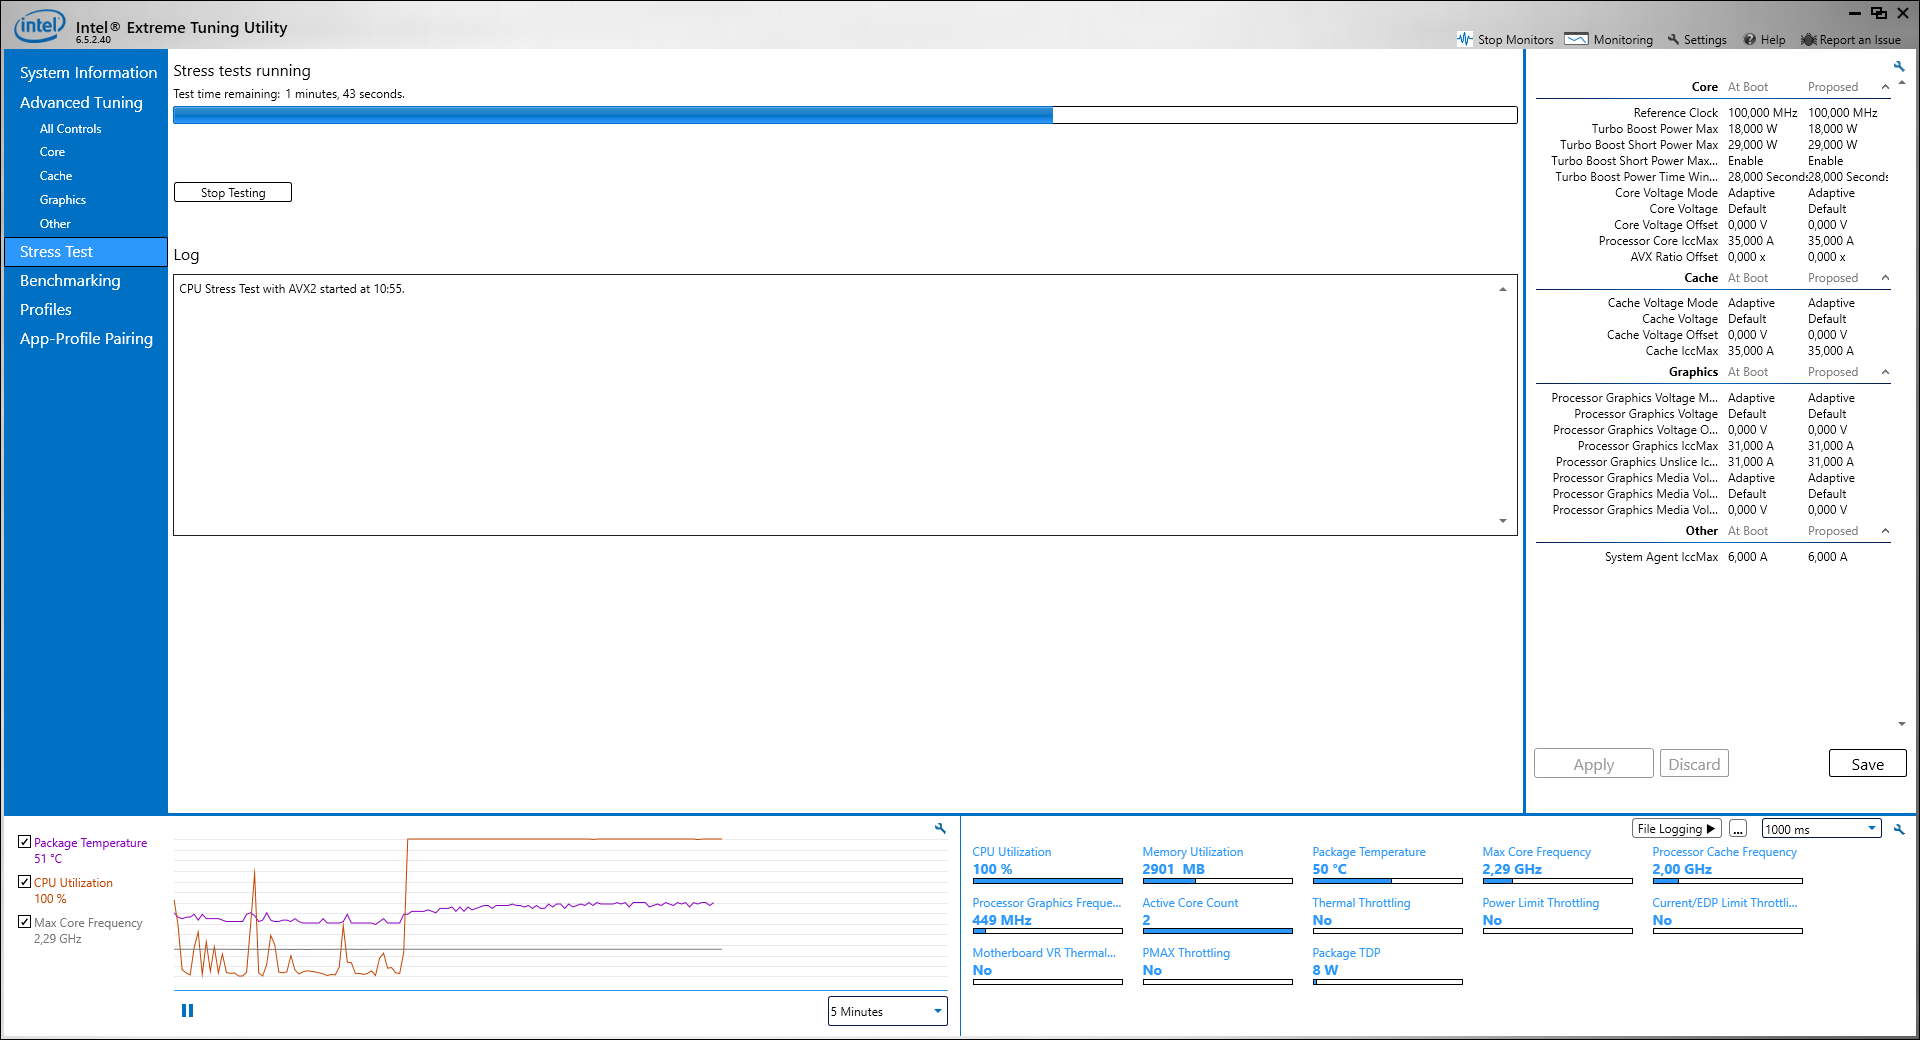
While the DPC latencies of our test device are relatively good compared to other laptops in its device class, they are less than ideal for real-time audio or similar tasks according to LatencyMon. It should be noted that our test heavily stresses the device (4K YouTube, web browsing and CPU stress test).
| DPC Latencies / LatencyMon - interrupt to process latency (max), Web, Youtube, Prime95 | |
| Average of class Office (365 - 98089, n=61, last 2 years) | |
| HP 17-by2437ng | |
| HP 470 G7 8VU24EA | |
| Lenovo V340-17IWL 81RG001YGE | |
* ... smaller is better
Storage Solution
The M.2 2242 SSD is Lenovo-branded and named UMIS AM610. We have already encountered this particular model in the Lenovo IdeaPad S530-13IWL, where it achieved far better speeds. Unfortunately, its performance is disappointing for a PCIe SSD. According to our measurements, it barely outperforms a fast SATA SSD. That being said, the SSD has a clear advantage over the V340's HDD options. During daily use, most users would be hard-pressed to notice an upgrade to a faster SSD model. Thanks to the accessible M.2 slot, users still have the option to upgrade regardless.
| Lenovo V340-17IWL 81RG001YGE Lenovo UMIS AM610 RPFTJ256PDD2MWX | Lenovo Ideapad S530-13IWL Lenovo UMIS AM610 RPFTJ256PDD2MWX | Schenker XMG Apex 15 NH57AF1 Samsung SSD 970 EVO Plus 1TB | Average Lenovo UMIS AM610 RPFTJ256PDD2MWX | Average of class Office | |
|---|---|---|---|---|---|
| AS SSD | 74% | 359% | 29% | 328% | |
| Seq Read (MB/s) | 758 | 1377 82% | 3002 296% | 1068 ? 41% | 4305 ? 468% |
| Seq Write (MB/s) | 278 | 805 190% | 2646 852% | 542 ? 95% | 2766 ? 895% |
| 4K Read (MB/s) | 28.09 | 45.01 60% | 58.3 108% | 36.6 ? 30% | 57.8 ? 106% |
| 4K Write (MB/s) | 74.1 | 88.9 20% | 188.1 154% | 81.5 ? 10% | 162.9 ? 120% |
| 4K-64 Read (MB/s) | 480.5 | 767 60% | 1799 274% | 624 ? 30% | 965 ? 101% |
| 4K-64 Write (MB/s) | 273.3 | 611 124% | 2440 793% | 442 ? 62% | 1632 ? 497% |
| Access Time Read * (ms) | 0.134 | 0.141 -5% | 0.043 68% | 0.1375 ? -3% | 0.08504 ? 37% |
| Access Time Write * (ms) | 0.065 | 0.043 34% | 0.02 69% | 0.054 ? 17% | 0.05931 ? 9% |
| Score Read (Points) | 584 | 950 63% | 2158 270% | 767 ? 31% | 1453 ? 149% |
| Score Write (Points) | 375 | 781 108% | 2892 671% | 578 ? 54% | 2071 ? 452% |
| Score Total (Points) | 1242 | 2200 77% | 6141 394% | 1721 ? 39% | 4202 ? 238% |
| Copy ISO MB/s (MB/s) | 290 | 290 ? 0% | 2533 ? 773% | ||
| Copy Program MB/s (MB/s) | 220 | 220 ? 0% | 788 ? 258% | ||
| Copy Game MB/s (MB/s) | 280 | 280 ? 0% | 1643 ? 487% |
* ... smaller is better

Dauerleistung Lesen: DiskSpd Read Loop, Queue Depth 8
GPU Performance
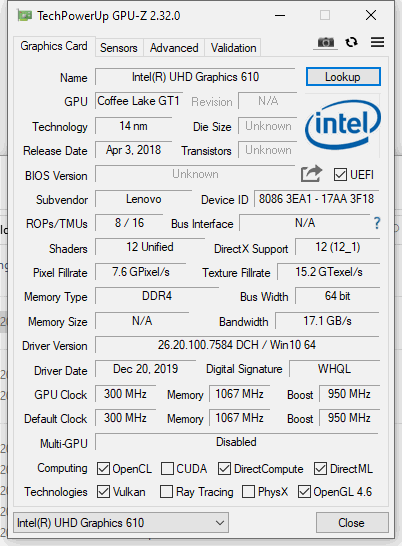
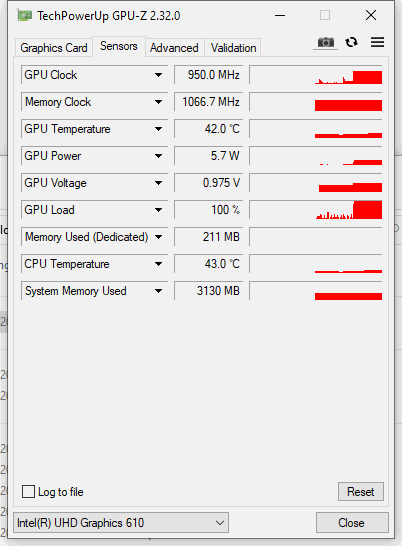
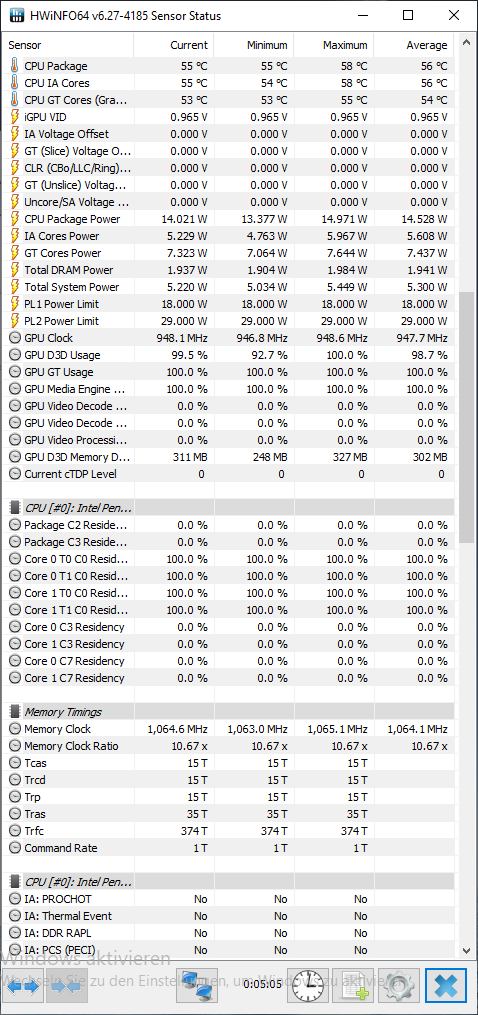
The integrated Intel UHD Graphics 610 belongs to the lower end of the entry-level spectrum. It is integrated into the processor unit, offers only 12 EUs (execution units) and does not have dedicated VRAM. In this regard, it is identical to the older HD Graphics 610. The iGPU achieves a clock speed of 300 (guaranteed base clock) to 950 MHz within the Pentium Gold 5405U. Thanks to an adequate amount of cooling and a sufficient TDP limit, it was able to maintain a clock speed just short of 950 MHz even when running extremely graphics-heavy scenarios.
Unsurprisingly, the results of the synthetic 3DMark benchmarks show the UHD Graphics 610 to be exactly as fast as the older HD Graphics 610. Conversely, the newer UHD Graphics 620, which can be found on Core i3, i5 and i7 models, is significantly faster. AMD Ryzen integrated GPUs such as the Vega 8 are in a different league altogether. The same holds true for the top configuration, which includes the GeForce MX230.
| 3DMark 06 Standard Score | 6026 points | |
| 3DMark 11 Performance | 1026 points | |
| 3DMark Ice Storm Standard Score | 37162 points | |
| 3DMark Cloud Gate Standard Score | 4244 points | |
| 3DMark Fire Strike Score | 597 points | |
| 3DMark Time Spy Score | 222 points | |
Help | ||
Gaming Performance
An integrated UHD Graphics 610 means that there are clear limitations in terms of the gaming performance. Only a select few, undemanding games can be run smoothly at the lowest quality and resolution settings. Even then, there is some stuttering. In our tests, the new Valorant and Counter-Strike: GO were playable at minimum quality settings. However, the frame rates would frequently dip, resulting in a measurable disadvantage when playing multiplayer games. Only League of Legends and Hearthstone ran smoothly on higher quality settings.
| The Witcher 3 - 1024x768 Low Graphics & Postprocessing | |
| Average of class Office (32.2 - 135, n=3, last 2 years) | |
| Lenovo IdeaPad 330-17IKB 81DM | |
| Average NVIDIA GeForce MX230 (45.9 - 48.4, n=2) | |
| Dell Inspiron 17 3780 | |
| Average Intel UHD Graphics 620 (8.8 - 50.9, n=64) | |
| Lenovo V340-17IWL 81RG001YGE | |
| Dota 2 Reborn - 1280x720 min (0/3) fastest | |
| Average NVIDIA GeForce MX230 (n=1) | |
| Average of class Office (32.2 - 171.3, n=75, last 2 years) | |
| Average Intel UHD Graphics 620 (42.4 - 90, n=92) | |
| Average Intel HD Graphics 610 (52.5 - 64.3, n=2) | |
| Lenovo V340-17IWL 81RG001YGE | |
| Far Cry 5 - 1280x720 Low Preset AA:T | |
| Average of class Office (38 - 99, n=13, last 2 years) | |
| Average NVIDIA GeForce MX230 (n=1) | |
| Average Intel UHD Graphics 620 (6 - 16, n=12) | |
| Lenovo V340-17IWL 81RG001YGE | |
| Average Intel HD Graphics 610 (n=1) | |
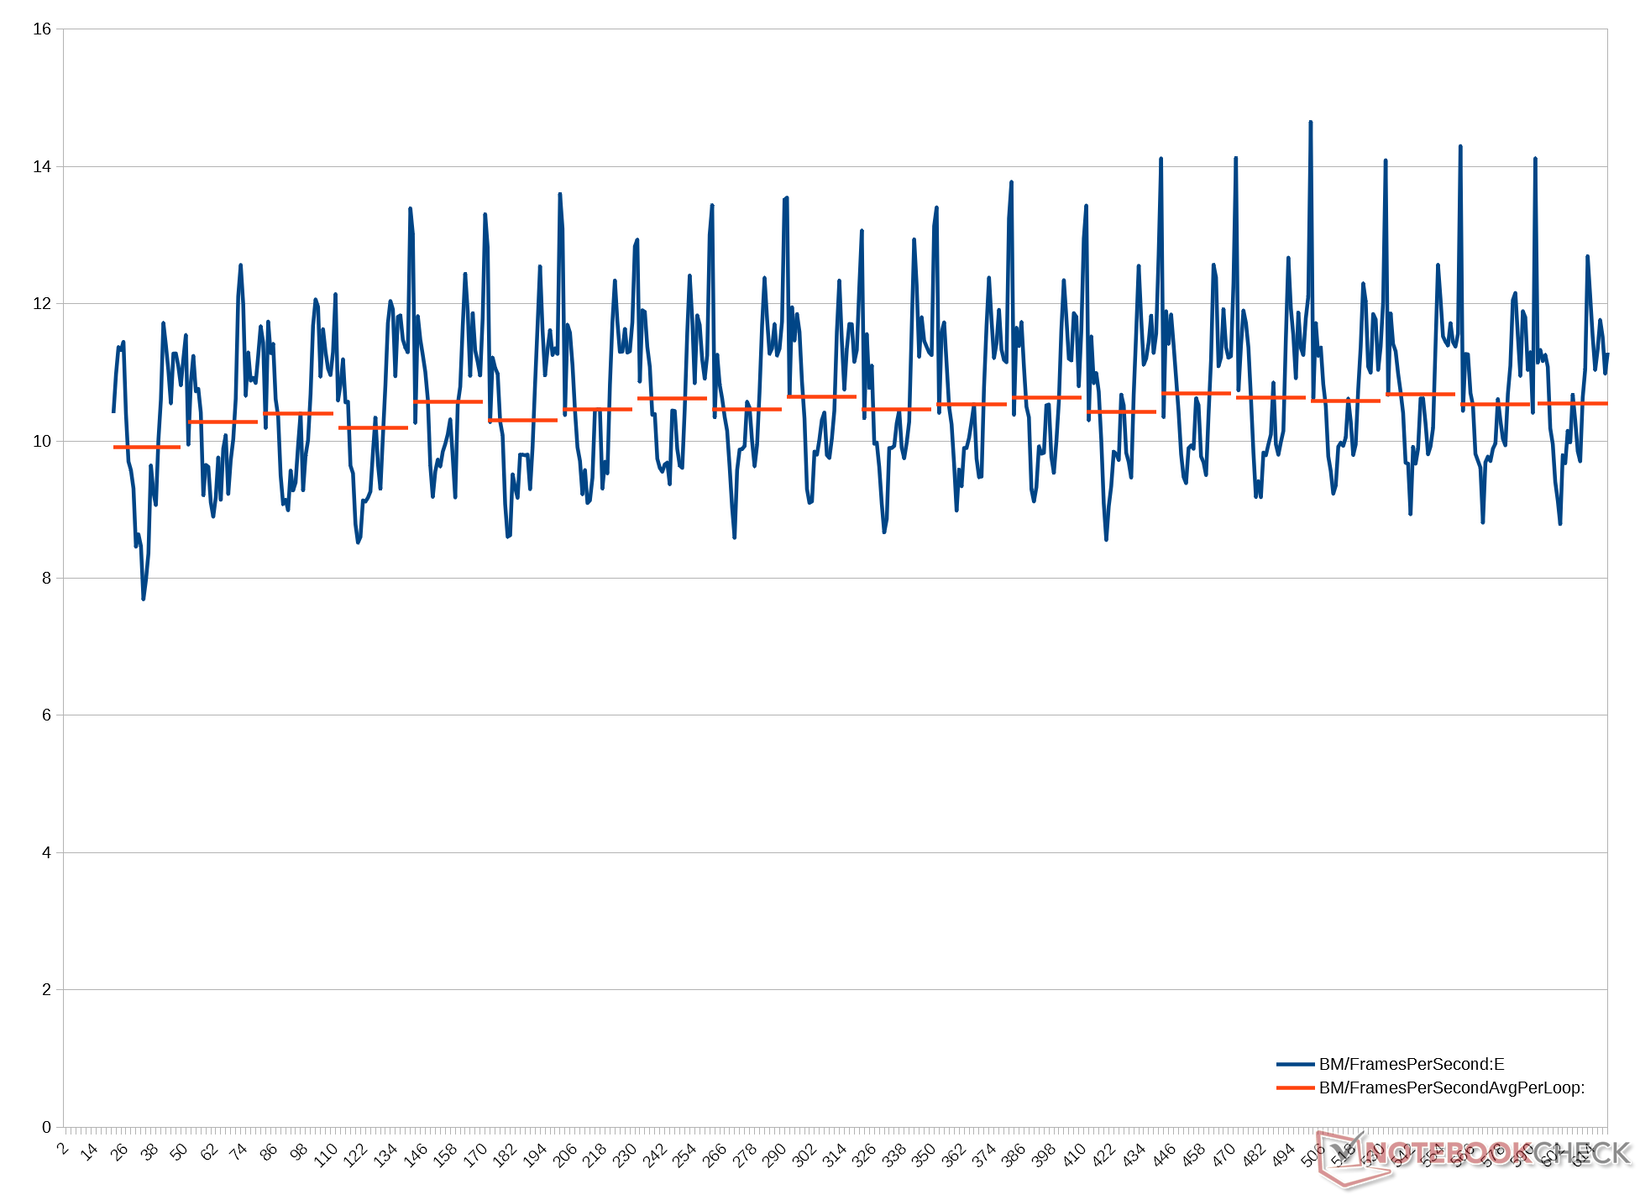
Even though the 3DMark Sky Driver benchmark shows inconsistent results, there is no GPU throttling and the scores even slightly improve over time. The iGPU was able to maintain a clock speed of 950 MHz even during the stress test.
| low | med. | high | ultra | |
|---|---|---|---|---|
| Diablo III (2012) | 38.9 | 26.2 | ||
| Counter-Strike: GO (2012) | 57.9 | 42.1 | ||
| GTA V (2015) | 17.9 | 16.7 | ||
| The Witcher 3 (2015) | 9.2 | |||
| Dota 2 Reborn (2015) | 54.4 | 23.1 | 10.6 | 9.7 |
| Rainbow Six Siege (2015) | 24.2 | 15.1 | ||
| Overwatch (2016) | 24.8 | 17.7 | ||
| Rocket League (2017) | 20.3 | |||
| Middle-earth: Shadow of War (2017) | 14 | |||
| Fortnite (2018) | 23 small graphical problems | |||
| X-Plane 11.11 (2018) | 9.56 | 7.53 | 6.92 | |
| Far Cry 5 (2018) | 7 | |||
| Shadow of the Tomb Raider (2018) | 9 | |||
| Battlefield V (2018) | 6.82 | |||
| Far Cry New Dawn (2019) | 7 | |||
| Dirt Rally 2.0 (2019) | 23.6 | |||
| Anno 1800 (2019) | 10.4 | |||
| Total War: Three Kingdoms (2019) | 16.9 | 5 | ||
| F1 2019 (2019) | 16.6 | |||
| FIFA 20 (2019) | 27 severe graphical problems (too slow) | |||
| Ghost Recon Breakpoint (2019) | 6 | |||
| Need for Speed Heat (2019) | 8 | |||
| Star Wars Jedi Fallen Order (2019) | 7.74 | |||
| Hearthstone (2020) | 30.4 | 21.9 | ||
| Hunt Showdown (2020) | 8.59 | |||
| Doom Eternal (2020) | 0 game wont start | |||
| Gears Tactics (2020) | 15.5 |
Emissions
System Noise
Thanks to the large chassis and the relatively weak CPU/GPU combination, the single fan does not have to spin particularly quickly. While idling, the fan may not spin at all resulting in completely silent operation. Although it still remains fairly quiet even under maximum load, there is an audible peak at 1250 Hz. Since it only becomes noticeable in very quiet environments, it is not distracting in most cases.
Noise level
| Idle |
| 30.2 / 31.1 / 31.1 dB(A) |
| Load |
| 31.1 / 32.5 dB(A) |
 | ||
30 dB silent 40 dB(A) audible 50 dB(A) loud |
||
min: | ||
Temperature
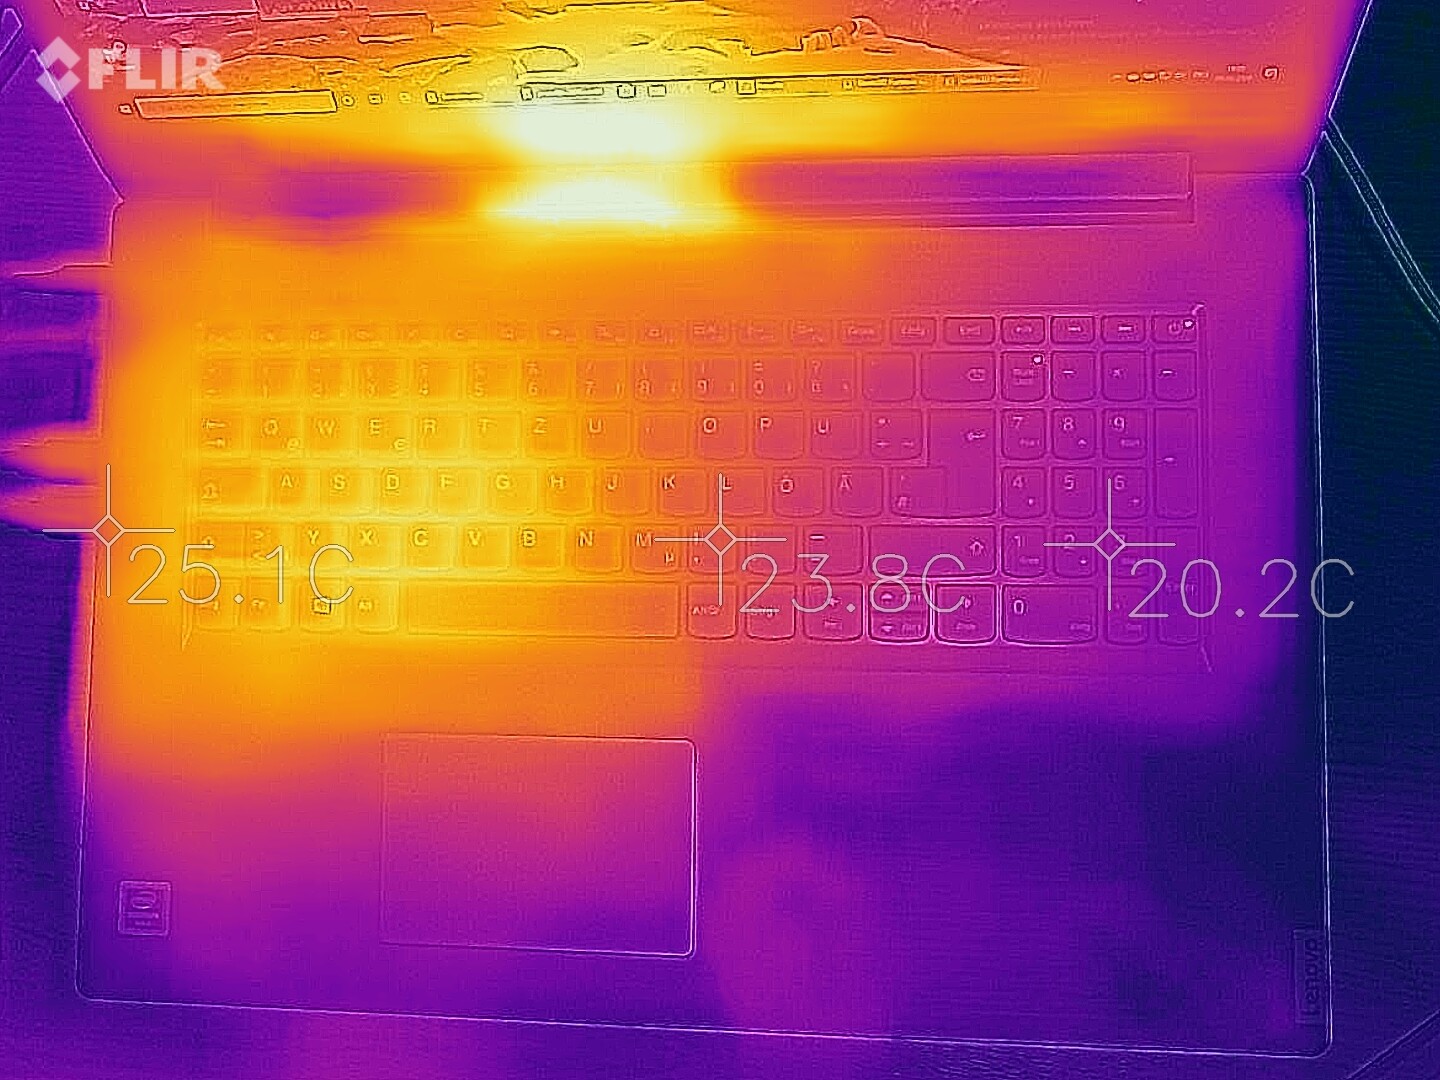
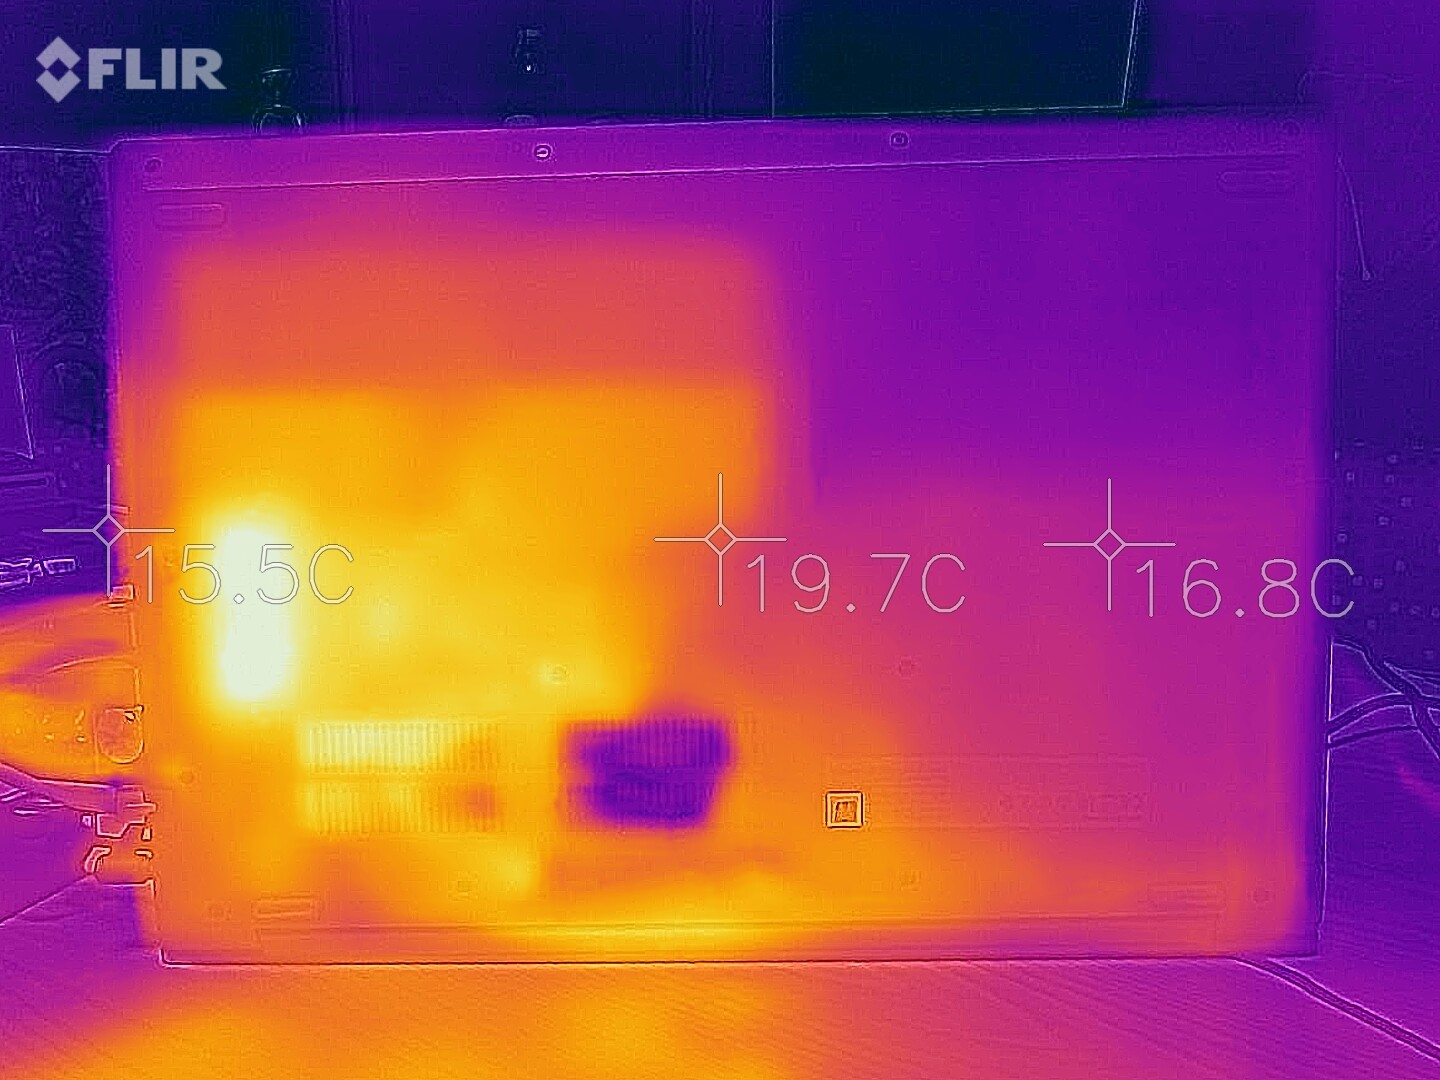
The surface temperatures are outstanding as well. The weak Pentium is incapable of raising the top or bottom surface temperatures to critical levels. Even after one hour of 100% CPU and GPU stress, we measured fairly moderate surface temperatures on the top and bottom of the device.
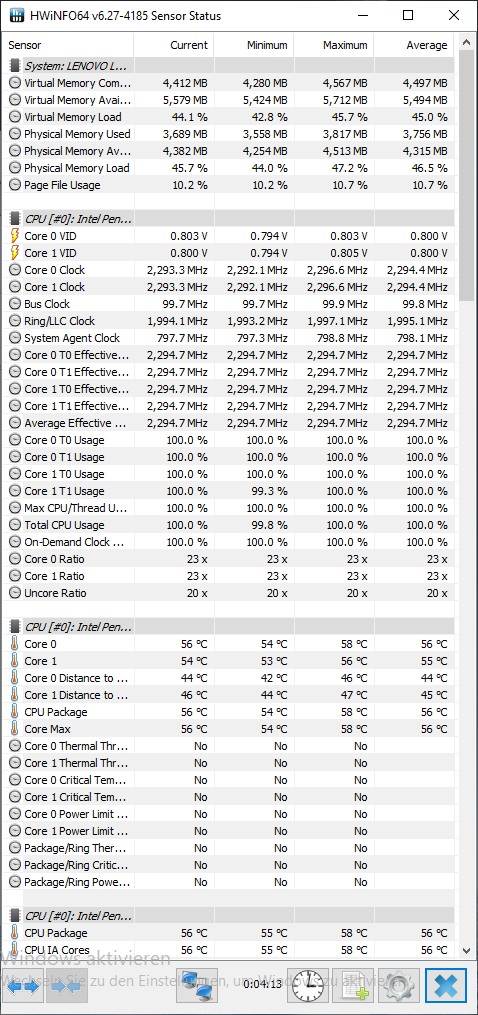
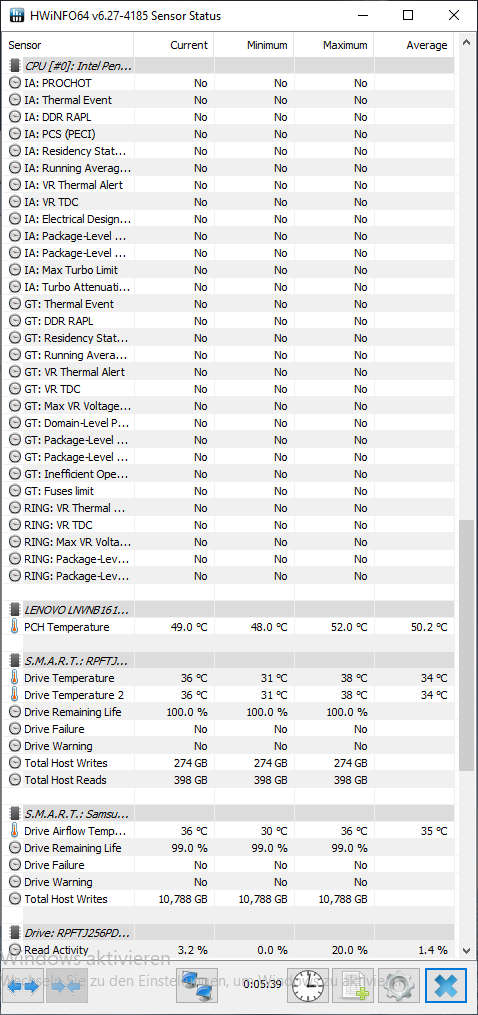
Similarly, the internal sensors report excellent values under extremely high loads. The CPU cores then consistently run at 2.3 GHz with a peak temperature of only 58 °C (136.4 °F). With a clock speed of 948 MHz, the iGPU also performs well at around 55 °C (131 °F). Meanwhile, the PCH and SSD reach a maximum of 52 °C (125.6 °F) and 38 °C (100.4 °F), respectively.
(+) The maximum temperature on the upper side is 31 °C / 88 F, compared to the average of 34.3 °C / 94 F, ranging from 21.2 to 62.5 °C for the class Office.
(+) The bottom heats up to a maximum of 34 °C / 93 F, compared to the average of 36.8 °C / 98 F
(+) In idle usage, the average temperature for the upper side is 24.1 °C / 75 F, compared to the device average of 29.5 °C / 85 F.
(+) The palmrests and touchpad are cooler than skin temperature with a maximum of 25 °C / 77 F and are therefore cool to the touch.
(+) The average temperature of the palmrest area of similar devices was 27.5 °C / 81.5 F (+2.5 °C / 4.5 F).
Speakers
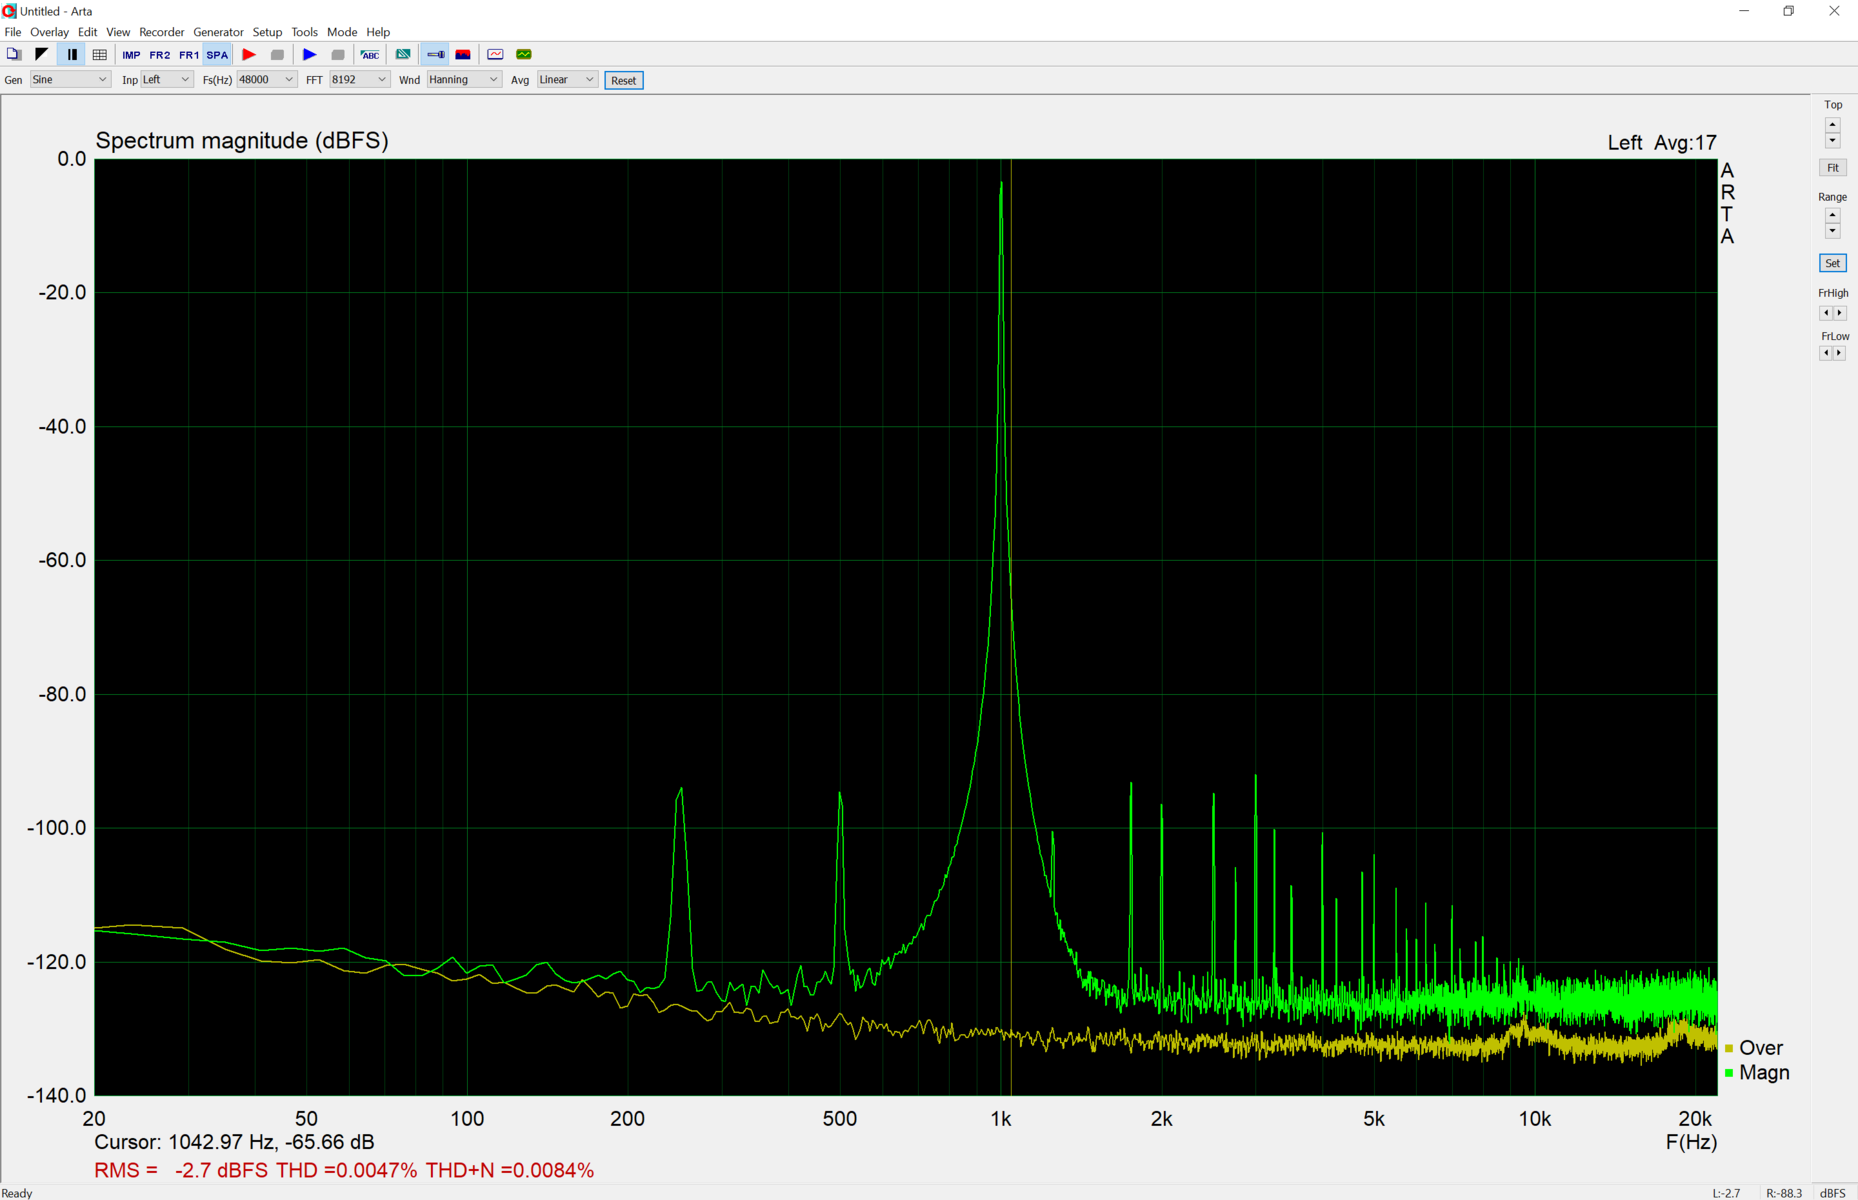
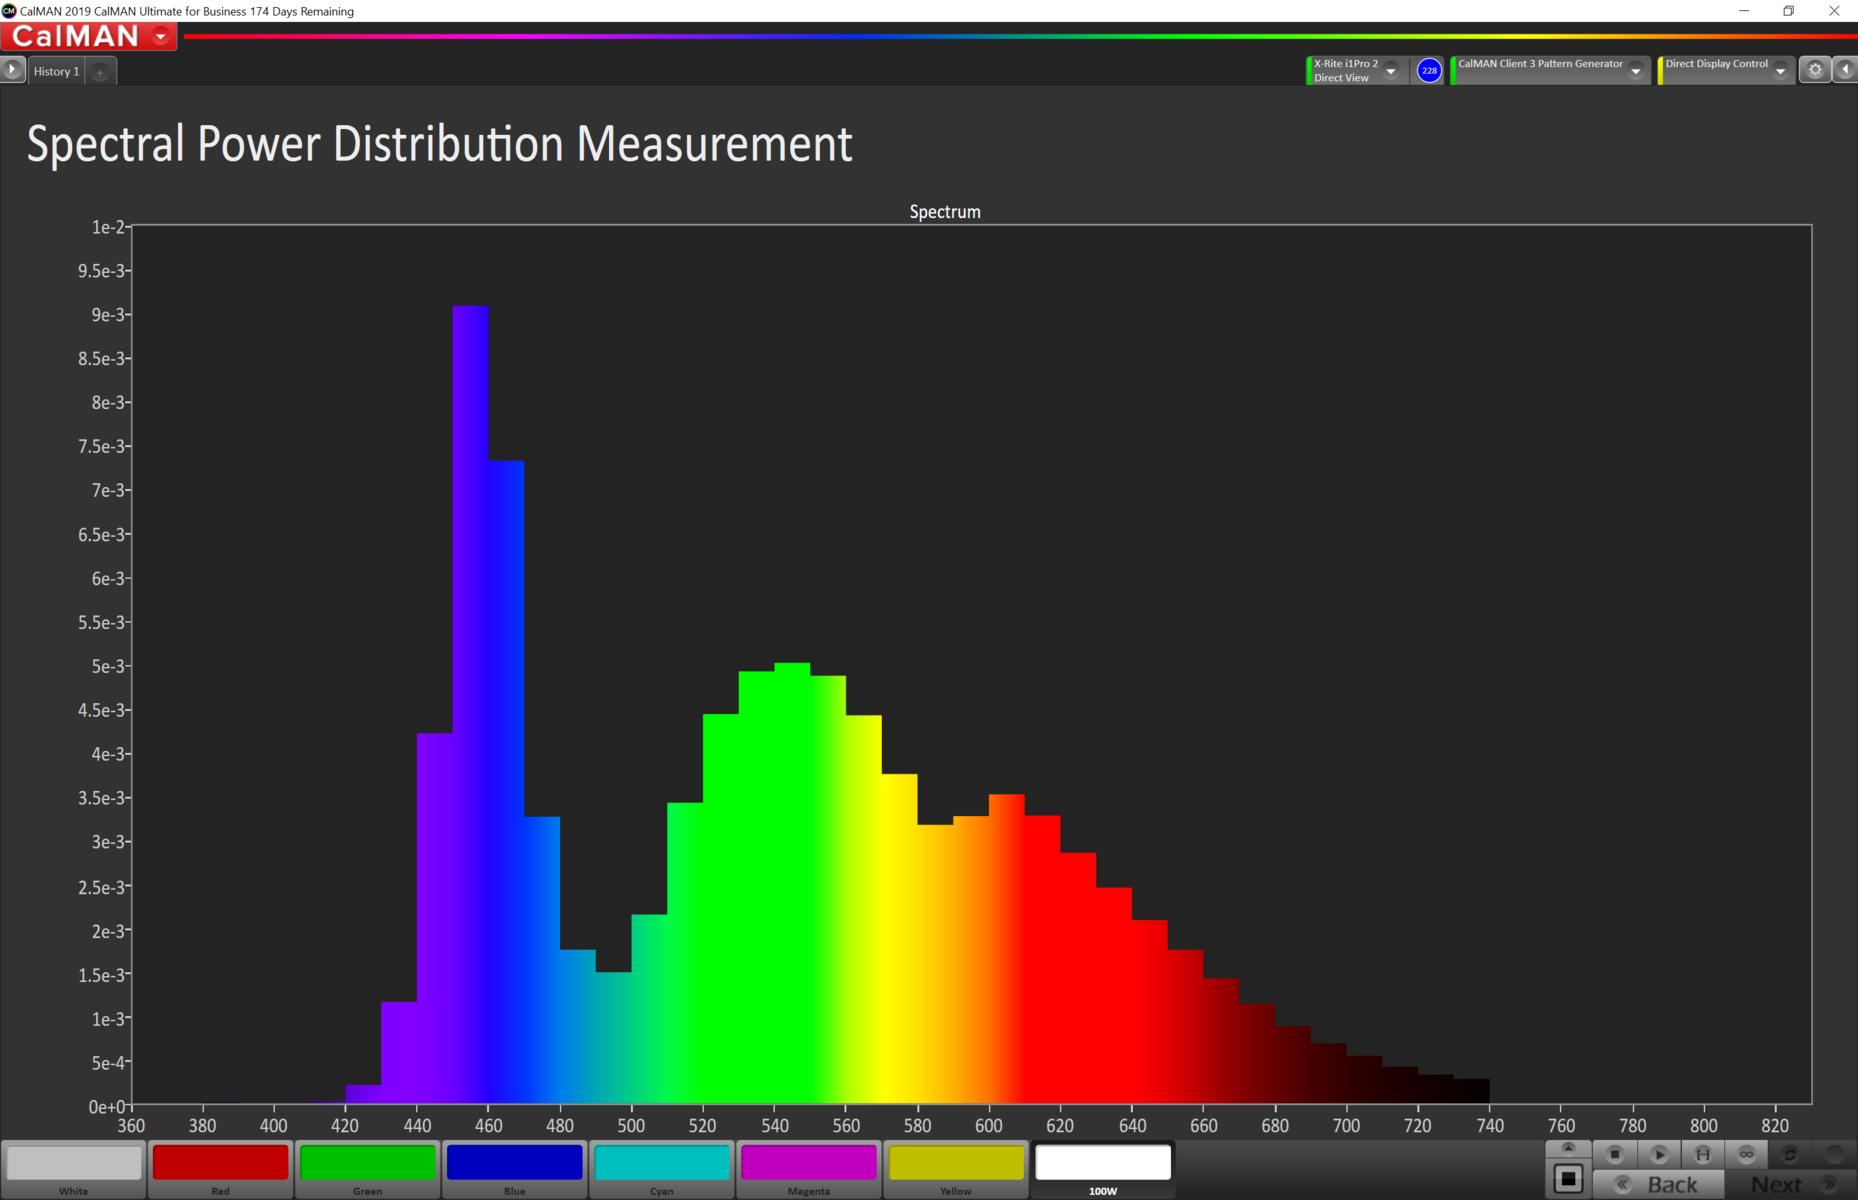
The integrated stereo speakers are not very loud andhttps://www.pco.co.at/Notebooks/Business-Professional/Lenovo-V340-17IWL-Pentium-G-5405U-8GB-RAM-256GB-SSD::71813.html?XTCsid=pbkagsb1qukljbm7q4p0211hh0, subjectively the quality does not sound particularly good. The frequency graph reveals an obvious lack of lower frequencies (bass) and weaknesses in terms of the balance.
Lenovo V340-17IWL 81RG001YGE audio analysis
(±) | speaker loudness is average but good (75.4 dB)
Bass 100 - 315 Hz
(-) | nearly no bass - on average 26.3% lower than median
(-) | bass is not linear (15% delta to prev. frequency)
Mids 400 - 2000 Hz
(+) | balanced mids - only 4.9% away from median
(+) | mids are linear (6% delta to prev. frequency)
Highs 2 - 16 kHz
(+) | balanced highs - only 2.3% away from median
(±) | linearity of highs is average (7% delta to prev. frequency)
Overall 100 - 16.000 Hz
(±) | linearity of overall sound is average (22.2% difference to median)
Compared to same class
» 58% of all tested devices in this class were better, 9% similar, 33% worse
» The best had a delta of 7%, average was 21%, worst was 53%
Compared to all devices tested
» 65% of all tested devices were better, 6% similar, 29% worse
» The best had a delta of 4%, average was 23%, worst was 134%
Apple MacBook 12 (Early 2016) 1.1 GHz audio analysis
(+) | speakers can play relatively loud (83.6 dB)
Bass 100 - 315 Hz
(±) | reduced bass - on average 11.3% lower than median
(±) | linearity of bass is average (14.2% delta to prev. frequency)
Mids 400 - 2000 Hz
(+) | balanced mids - only 2.4% away from median
(+) | mids are linear (5.5% delta to prev. frequency)
Highs 2 - 16 kHz
(+) | balanced highs - only 2% away from median
(+) | highs are linear (4.5% delta to prev. frequency)
Overall 100 - 16.000 Hz
(+) | overall sound is linear (10.2% difference to median)
Compared to same class
» 7% of all tested devices in this class were better, 2% similar, 90% worse
» The best had a delta of 5%, average was 18%, worst was 53%
Compared to all devices tested
» 5% of all tested devices were better, 1% similar, 94% worse
» The best had a delta of 4%, average was 23%, worst was 134%
Energy Management
Energy Consumption
We did not observe unusual behavior in terms of the energy consumption. The small dual-core processor is fairly economical, allowing it to beat an average office device in this discipline. That being said, devices with the HD Graphics 610 (from the previous generation) are more economical on average, although this also includes smaller devices with smaller screen sizes.
| Off / Standby | |
| Idle | |
| Load |
|
Key:
min: | |
| Lenovo V340-17IWL 81RG001YGE Pentium 5405U, UHD Graphics 610, Lenovo UMIS AM610 RPFTJ256PDD2MWX, , 1920x1080, 17.3" | HP 17-by2437ng i3-10110U, UHD Graphics 620, Toshiba KBG30ZMV256G, TN LED, 1600x900, 17.3" | Lenovo Ideapad L340-17API-81LY0004GE R5 3500U, Vega 8, Samsung SSD PM871b MZ7LN256HAJQ, TN LED, 1600x900, 17.3" | Dell Inspiron 17 3780 i7-8565U, Radeon 520, SK Hynix BC501 NVMe 256 GB, IPS, 1920x1080, 17.3" | Lenovo IdeaPad 330-17IKB 81DM i5-8550U, GeForce MX150, WDC Blue WD10SPZX-24Z10T0, TN LED, 1600x900, 17.3" | Acer Aspire ES1-732-P7YA Pentium N4200, HD Graphics 505, Toshiba MQ01ABD100, TN LED, 1600x900, 17.3" | HP 17-ca0013ng R5 2500U, Vega 8, Toshiba KBG30ZMV256G, IPS, 1920x1080, 17.3" | HP Envy 17-ae143ng i5-8250U, GeForce MX150, Liteonit CV3-8D128, IPS, 1920x1080, 17.3" | Average Intel HD Graphics 610 | Average of class Office | |
|---|---|---|---|---|---|---|---|---|---|---|
| Power Consumption | -5% | 6% | -53% | -56% | -2% | -62% | -65% | 19% | -29% | |
| Idle Minimum * (Watt) | 4.5 | 5.7 -27% | 3.8 16% | 5 -11% | 4.7 -4% | 6 -33% | 7.6 -69% | 4.8 -7% | 4 ? 11% | 4.28 ? 5% |
| Idle Average * (Watt) | 8.8 | 8.6 2% | 6.3 28% | 10.9 -24% | 9.2 -5% | 9.6 -9% | 12.9 -47% | 8.3 6% | 6.85 ? 22% | 7.31 ? 17% |
| Idle Maximum * (Watt) | 10.8 | 9 17% | 6.8 37% | 12 -11% | 10.6 2% | 10.7 1% | 13.7 -27% | 10.3 5% | 7.93 ? 27% | 8.58 ? 21% |
| Load Average * (Watt) | 24.3 | 29.3 -21% | 31 -28% | 49.6 -104% | 56.3 -132% | 21.2 13% | 44 -81% | 61 -151% | 23 ? 5% | 43.7 ? -80% |
| Load Maximum * (Watt) | 31.1 | 30.5 2% | 38.6 -24% | 66.9 -115% | 75.3 -142% | 26 16% | 57.1 -84% | 86 -177% | 22.5 ? 28% | 64.4 ? -107% |
| Witcher 3 ultra * (Watt) | 55 |
* ... smaller is better
Battery Life
Unsurprisingly, the small 36-Wh battery does not result in very long runtimes for the V340 in battery mode. On average, most office devices last significantly longer and the Ryzen 5-based IdeaPad L340 even manages to reach far longer runtimes with the same battery.
| Lenovo V340-17IWL 81RG001YGE Pentium 5405U, UHD Graphics 610, 36 Wh | HP 17-by2437ng i3-10110U, UHD Graphics 620, 41 Wh | Lenovo Ideapad L340-17API-81LY0004GE R5 3500U, Vega 8, 36 Wh | Dell Inspiron 17 3780 i7-8565U, Radeon 520, 42 Wh | Lenovo IdeaPad 330-17IKB 81DM i5-8550U, GeForce MX150, 34 Wh | Acer Aspire ES1-732-P7YA Pentium N4200, HD Graphics 505, 37 Wh | HP 17-ca0013ng R5 2500U, Vega 8, 40.6 Wh | HP Envy 17-ae143ng i5-8250U, GeForce MX150, 55.8 Wh | Average of class Office | |
|---|---|---|---|---|---|---|---|---|---|
| Battery runtime | 8% | 30% | -33% | -26% | -4% | -28% | 53% | 102% | |
| H.264 (h) | 5.7 | 15.5 ? 172% | |||||||
| WiFi v1.3 (h) | 5.3 | 5.7 8% | 6.9 30% | 4.2 -21% | 3.9 -26% | 5.1 -4% | 3.8 -28% | 8.1 53% | 13 ? 145% |
| Load (h) | 2 | 1.1 -45% | 1.5 -25% | 1.808 ? -10% | |||||
| Reader / Idle (h) | 9.6 | 8.5 | 24.5 ? |
Pros
Cons
Verdict
The Lenovo V340-17IWL 81RG001YGE is a cheap entry-level business laptop with a large 17-inch display. The good IPS display and the relatively fast SSD make it a reasonable entry-level choice for undemanding users. Since the Pentium Gold 5405U has only two cores and no Turbo Boost, it falls behind significantly compared to faster Core i3 and i5 Whiskey Lake CPUs when it comes to benchmark scores. In turn, the SoC shows very little heat development, which results in very low noise and temperature levels.
The construction of the chassis reflects the low price. However, the easy accessibility of components such as the (single) RAM slot, SSD, Wi-Fi module, 2.5-inch bay and fans is an advantage. Due to the relatively small battery, the V340 is well suited to being an inexpensive office desktop replacement. We were unimpressed by the touchpad, which is why we recommend using an external mouse. The Pentium CPU is a poor choice for occasional gaming and users with such interests would be better served by the model with dedicated MX230 graphics.
We received our loan unit from the PCO Computer-Handels-GmbH in Wels, which currently lists the V340 for around 529 Euros (~$597).
Lenovo V340-17IWL 81RG001YGE
- 06/22/2020 v7 (old)
Klaus Hinum
Price comparison
