Intel Iris Plus Graphics 655 vs Intel HD Graphics 515 vs Intel UHD Graphics 610
Intel Iris Plus Graphics 655 ► remove from comparison
The Intel Iris Plus Graphics 655 (GT3e) is a processor graphics card announced in September 2017. As the successor to the Intel Iris Graphics 650 (Kaby Lake), the Iris Plus Graphics 655 is used for 28-Watt Coffee Lake-U models. The biggest difference is the doubled eDRAM-cache at 128 MB. There should not be any big changes compared to the Iris Graphics 650.
The so called GT3e version of the Kaby Lake GPU still has 48 Execution Units (EUs), which can reach up to 1200 MHz (previously 1100 MHz) depending on the model. Besides eDRAM cache, the Iris 655 can also access the system memory (2x 64 Bit DDR3L-2133/DDR4-2400) via processor interface.
Compared to the Iris Plus 640 from the 15-Watt models, the Iris 655 only has a slightly higher maximum clock as well as almost twice the TDP, which allows a better utilization of the Turbo Boost potential.
The exact performance of the Iris Plus Graphics 655 depends on the CPU model, because maximum clock as well as the size of the L3 cache can differ a bit. The system memory (DDR3/DDR4) will influence the performance as well.
The fastest chips are high-clocked Core i7 models like the Core i7-8559U. Depending on the game, the Iris Plus 655 will probably be on par with a dedicated GeForce 930M or GeForce 940MX and can handle smooth gameplay in modern titles in low up to medium settings.
The reworked video engine now fully supports hardware decoding of H.265/HEVC videos. Contrary to Skylake, however, Kaby Lake can now also decode H.265/HEVC Main 10 with a 10-bit color depth as well as Google's VP9 codec. The video output is possible via DP 1.2/eDP 1.3 (up to 3840 x 2160 @60 Hz), whereas HDMI is also supported in the older 1.4a standard. An HDMI 2.0 output can be added via converter from DisplayPort. The GPU can drive up to three displays simultaneously.
The Iris Plus Graphics 655 is used for 28-Watt processor and therefore small/medium-sized notebooks.
Intel HD Graphics 515 ► remove from comparison
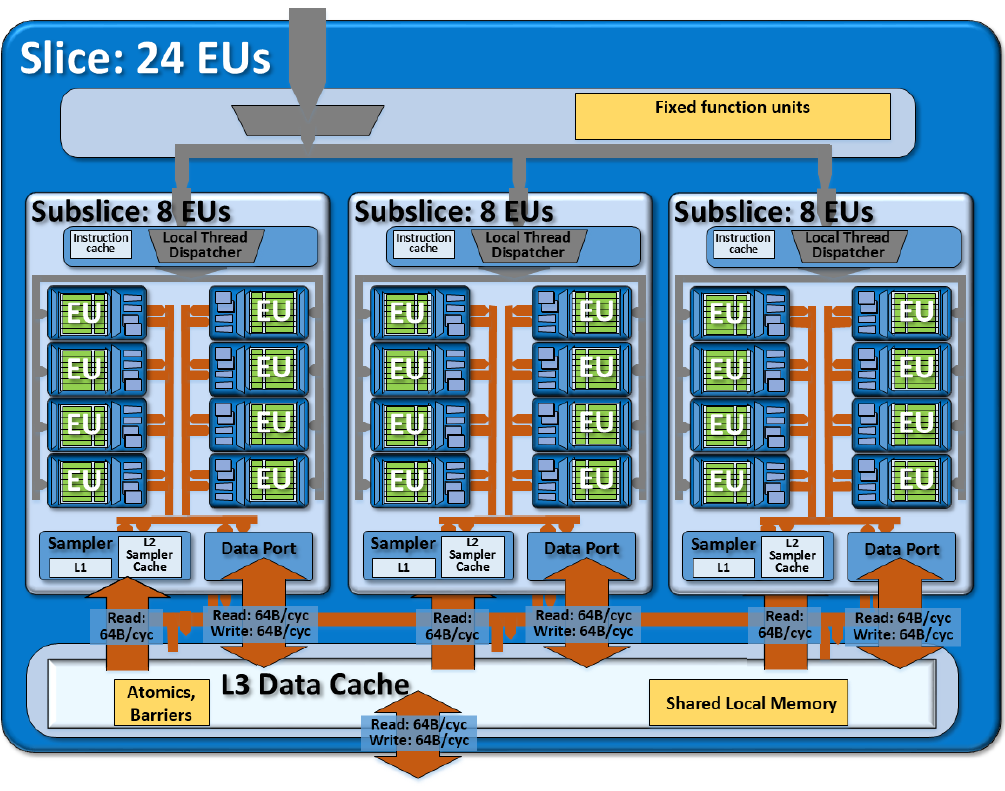
The Intel HD Graphics 515 (GT2) is a low-end integrated graphics unit, which can be found in the Core m-series of the Skylake generation. This "GT2" version of the Skylake GPU offers 24 Execution Units (EUs) clocked at up to 1000 MHz (depending on the CPU model). Due to its lack of dedicated graphics memory or eDRAM cache, the HD 515 has to access the main memory (2x 64bit DDR3L-1600 / LPDDR3-1866).
Performance
According to Intel, the HD Graphics 515 is up to 41 percent faster than the previous HD Graphics 5300 (Broadwell). Nevertheless, the GPU will handle only simple games like Counter-Strike or Dota with decent frame rates. Depending on the specific CPU model, memory configuration and TDP (4.5 W, configurable), performance may vary substantially.
Features
The revised video engine now decodes H.265/HEVC completely in hardware and thereby much more efficiently than before. Displays can be connected via DP 1.2 / eDP 1.3 (max. 3840 x 2160 @ 60 Hz), whereas HDMI is limited to the older version 1.4a (max. 3840 x 2160 @ 30 Hz). However, HDMI 2.0 can be added using a DisplayPort converter. Up to three displays can be controlled simultaneously.
Power Consumption
The HD Graphics 515 can be found in Core m processors with 4.5 W TDP (3.5/3.8 W cTDP down, 7 W cTDP up) and is therefore suited for very thin, mostly passively cooled 2-in-1 notebooks and tablets.
Intel UHD Graphics 610 ► remove from comparison
The Intel UHD Graphics 610 (GT1) is an integrated graphics unit, which can be found in low-end ULV (Ultra Low Voltage) processors of the Whisky-Lake generation. This "GT1" version of the Skylake GPU offers 12 Execution Units (EUs) clocked at up to 950 MHz (depending on the CPU model). Due to its lack of dedicated graphics memory or eDRAM cache, the HD 610 has to access the main memory (2x 64bit DDR3L-1600 / DDR4-2133).
Performance
Depending on various factors like memory configuration, the UHD Graphics 610 should offer a similar performance as the similar Intel HD Graphics 610 and the old Skylake HD Graphics 510 and therefore can only handle non demanding games. E.g. Farming Simulator 17, World of Warships or Dota 2 Reborn can be played on low settings.
Features
The revised video engine now supports H.265/HEVC Main10 profile in hardware with 10 bit colors. Furthermore, Googles VP9 codec can also be hardware decoded. The Pentium chips should already support HDCP 2.2 and therefore Netflix 4K. HDMI 2.0 however is still only supported with an external converter chip (LSPCon).
Power Consumption
The UHD Graphics 610 can be found in mobile processors specified at 15 W TDP and is therefore suited for compact laptops and ultrabooks.
Intel Iris Plus Graphics 655 Intel HD Graphics 515 Intel UHD Graphics 610 Gen. 9 Series Codename Kaby Lake GT3e Skylake GT2 Kaby Lake GT1 Architecture Gen. 9.5 Kaby Lake Gen. 9 Skylake Gen. 9 Kaby Lake Pipelines 48 - unified 24 - unified 12 - unified Core Speed 300 - 1200 (Boost) MHz 300 - 1000 (Boost) MHz 300 - 950 (Boost) MHz Memory Type DDR3/DDR4 DDR3L/LPDDR3 DDR3/DDR4 Shared Memory yes yes yes API DirectX 12_1, OpenGL 4.5 DirectX 12_1, OpenGL 4.4 DirectX 12_1, OpenGL 4.4 technology 14 nm 14 nm 14 nm Features QuickSync QuickSync QuickSync Date of Announcement 01.09.2017 01.09.2015 01.01.2019 Memory Bus Width 64/128 Bit 64/128 Bit
CPU in Iris Plus Graphics 655 GPU Base Speed GPU Boost / Turbo Intel Core i7-8559U 4 x 2700 MHz, 28 W 300 MHz 1200 MHz Intel Core i5-8269U 4 x 2600 MHz, 28 W 300 MHz 1100 MHz Intel Core i5-8279U 4 x 2400 MHz, 28 W 300 MHz 1150 MHz » show 2 more Intel Core i5-8259U 4 x 2300 MHz, 28 W 300 MHz 1050 MHz Intel Core i3-8109U 2 x 3000 MHz, 28 W 300 MHz 1050 MHz min. - max. 300 MHz 1050 - 1200 MHz
CPU in HD Graphics 515 GPU Base Speed GPU Boost / Turbo Intel Core m7-6Y75 2 x 1200 MHz, 4.5 W 300 MHz 1000 MHz Intel Core m5-6Y57 2 x 1100 MHz, 4.5 W 300 MHz 900 MHz Intel Core m5-6Y54 2 x 1100 MHz, 4.5 W 300 MHz 900 MHz Intel Core m3-6Y30 2 x 900 MHz, 4.5 W 300 MHz 850 MHz min. - max. 300 MHz 850 - 1200 MHz
CPU in UHD Graphics 610 GPU Base Speed GPU Boost / Turbo Intel Core i5-10200H 4 x 2400 MHz, 45 W 350 MHz 1050 MHz Intel Pentium Gold 6405U 2 x 2400 MHz, 15 W 300 MHz 900 MHz Intel Pentium Gold 5405U 2 x 2300 MHz, 15 W 300 MHz 950 MHz Intel Celeron 5205U 2 x 1900 MHz, 15 W 300 MHz 900 MHz min. - max. 300 - 350 MHz 850 - 1200 MHz
Benchmarks Performance Rating - 3DMark 11 + Fire Strike + Time Spy - Iris Plus Graphics 655
0.9 pt (3%)
...
Intel Iris Plus Graphics 655
...
max:
Performance Rating - 3DMark 11 + Fire Strike + Time Spy - HD Graphics 515
0.3 pt (1%)
...
...
max:
Performance Rating - 3DMark 11 + Fire Strike + Time Spy - UHD Graphics 610
0.3 pt (1%)
...
...
max:
3DMark - 3DMark Time Spy Score
min: 348 avg: 647 median: 684 (2%) max: 722 Points
222 Points (1%)
3DMark - 3DMark Time Spy Graphics
min: 301 avg: 570 median: 604.5 (2%) max: 633 Points
194 Points (1%)
3DMark - 3DMark Ice Storm Unlimited Graphics
min: 131607 avg: 139716 median: 137266 (16%) max: 152727 Points
min: 43449 avg: 58940 median: 56787 (6%) max: 78808 Points
min: 41521 avg: 42713 median: 42712.5 (5%) max: 43904 Points
3DMark - 3DMark Ice Storm Extreme Graphics
min: 57033 avg: 72655 median: 71073 (9%) max: 89859 Points
min: 18749 avg: 24669 median: 23314 (3%) max: 33413 Points
20443 Points (3%)
3DMark - 3DMark Cloud Gate Score
min: 6769 avg: 10798 median: 11622 (12%) max: 13037 Points
min: 2705 avg: 3940 median: 3850.5 (4%) max: 5257 Points
min: 4244 avg: 4334 median: 4333.5 (5%) max: 4423 Points
3DMark - 3DMark Cloud Gate Graphics
min: 6498 avg: 13736 median: 14343 (4%) max: 16698 Points
min: 3982 avg: 5440 median: 5467 (1%) max: 7035 Points
min: 5139 avg: 5277 median: 5276.5 (1%) max: 5414 Points
3DMark - 3DMark Fire Strike Standard Score
min: 852 avg: 1703 median: 1850 (3%) max: 2040 Points
min: 453 avg: 617 median: 623.5 (1%) max: 780 Points
min: 597 avg: 616 median: 616 (1%) max: 635 Points
3DMark - 3DMark Fire Strike Standard Graphics
min: 920 avg: 1836 median: 1983 (2%) max: 2260 Points
min: 494 avg: 679 median: 691.5 (1%) max: 892 Points
min: 634 avg: 664 median: 663.5 (1%) max: 693 Points
3DMark - 3DMark Ice Storm Graphics
min: 85405 avg: 107151 median: 110302 (13%) max: 122594 Points
min: 31627 avg: 44439 median: 45108 (5%) max: 54558 Points
min: 33154 avg: 36325 median: 36325 (4%) max: 39496 Points
3DMark - 3DMark Night Raid
2629 Points (2%)
3DMark - 3DMark Night Raid Graphics Score
2850 Points (1%)
3DMark 11 - 3DM11 Performance Score
min: 1548 avg: 2942 median: 3180.5 (4%) max: 3349 Points
min: 785 avg: 1105 median: 1115 (2%) max: 1360 Points
min: 1026 avg: 1046 median: 1045.5 (1%) max: 1065 Points
3DMark 11 - 3DM11 Performance GPU
min: 1365 avg: 2707 median: 2894 (2%) max: 3081 Points
min: 714 avg: 1013 median: 1014 (1%) max: 1254 Points
min: 915 avg: 923 median: 922.5 (1%) max: 930 Points
3DMark Vantage + Intel Iris Plus Graphics 655 3DMark Vantage - 3DM Vant. Perf. total
min: 12093 avg: 12287 median: 12287 (4%) max: 12481 Points
3DM Vant. Perf. total + Intel HD Graphics 515
4672 Points (1%)
3DM Vant. Perf. total + Intel UHD Graphics 610
3996 Points (1%)
3DM Vant. Perf. GPU no PhysX + Intel Iris Plus Graphics 655 3DMark Vantage - 3DM Vant. Perf. GPU no PhysX
min: 10337 avg: 10514 median: 10513.5 (6%) max: 10690 Points
3DM Vant. Perf. GPU no PhysX + Intel HD Graphics 515
4218 Points (2%)
3DM Vant. Perf. GPU no PhysX + Intel UHD Graphics 610
3375 Points (2%)
3DMark 2001SE - 3DMark 2001 - Standard
20345 Points (21%)
3DMark 03 - 3DMark 03 - Standard
18019 Points (9%)
3DMark 05 - 3DMark 05 - Standard
22740 Points (25%)
9173 Points (10%)
12054 Points (13%)
3DMark 06 3DMark 06 - Standard 1280x1024 + Intel Iris Plus Graphics 655
min: 17176 avg: 17885 median: 17885 (23%) max: 18594 Points
3DMark 06 - Standard 1280x1024 + Intel HD Graphics 515
min: 4968 avg: 6621 median: 6446 (8%) max: 7912 Points
3DMark 06 - Standard 1280x1024 + Intel UHD Graphics 610
min: 6026 avg: 6902 median: 6902 (9%) max: 7778 Points
Unigine Valley 1.0 - Unigine Valley 1.0 DX
8.2 fps (3%)
min: 3 avg: 3.4 median: 3.4 (1%) max: 3.7 fps
Unigine Heaven 3.0 - Unigine Heaven 3.0 DX 11
10.2 fps (3%)
Unigine Heaven 2.1 - Heaven 2.1 high
min: 15.7 avg: 16.9 median: 16.9 (3%) max: 18 fps
SPECviewperf 12 + Intel Iris Plus Graphics 655 SPECviewperf 12 - specvp12 sw-03
28.2 fps (7%)
specvp12 sw-03 + Intel HD Graphics 515
17.6 fps (4%)
specvp12 snx-02 + Intel Iris Plus Graphics 655 SPECviewperf 12 - specvp12 snx-02
2.1 fps (0%)
specvp12 snx-02 + Intel HD Graphics 515 2.1 fps (0%)
specvp12 showcase-01 + Intel Iris Plus Graphics 655 SPECviewperf 12 - specvp12 showcase-01
10.3 fps (2%)
specvp12 showcase-01 + Intel HD Graphics 515
5 fps (1%)
specvp12 mediacal-01 + Intel Iris Plus Graphics 655 SPECviewperf 12 - specvp12 mediacal-01
4.6 fps (1%)
specvp12 mediacal-01 + Intel HD Graphics 515 1.8 fps (0%)
specvp12 maya-04 + Intel Iris Plus Graphics 655 SPECviewperf 12 - specvp12 maya-04
20.4 fps (6%)
specvp12 maya-04 + Intel HD Graphics 515
9 fps (2%)
specvp12 energy-01 + Intel Iris Plus Graphics 655 SPECviewperf 12 - specvp12 energy-01
0.3 fps (0%)
specvp12 energy-01 + Intel HD Graphics 515 0.1 fps (0%)
specvp12 creo-01 + Intel Iris Plus Graphics 655 SPECviewperf 12 - specvp12 creo-01
14.9 fps (6%)
specvp12 creo-01 + Intel HD Graphics 515
7.9 fps (3%)
specvp12 catia-04 + Intel Iris Plus Graphics 655 SPECviewperf 12 - specvp12 catia-04
18.8 fps (3%)
specvp12 catia-04 + Intel HD Graphics 515
9.8 fps (2%)
specvp12 3dsmax-05 + Intel Iris Plus Graphics 655 SPECviewperf 12 - specvp12 3dsmax-05
18.1 fps (3%)
SPECviewperf 13 specvp13 sw-04 + Intel Iris Plus Graphics 655 SPECviewperf 13 - specvp13 sw-04
34.6 fps (9%)
specvp13 snx-03 + Intel Iris Plus Graphics 655 SPECviewperf 13 - specvp13 snx-03
3.8 fps (0%)
specvp13 showcase-02 + Intel Iris Plus Graphics 655 SPECviewperf 13 - specvp13 showcase-02
10.3 fps (2%)
specvp13 medical-02 + Intel Iris Plus Graphics 655 SPECviewperf 13 - specvp13 medical-02
3.8 fps (1%)
specvp13 maya-05 + Intel Iris Plus Graphics 655 SPECviewperf 13 - specvp13 maya-05
25.9 fps (3%)
specvp13 energy-02 + Intel Iris Plus Graphics 655 SPECviewperf 13 - specvp13 energy-02
1.1 fps (0%)
specvp13 creo-02 + Intel Iris Plus Graphics 655 SPECviewperf 13 - specvp13 creo-02
19.6 fps (3%)
specvp13 catia-05 + Intel Iris Plus Graphics 655 SPECviewperf 13 - specvp13 catia-05
26.4 fps (3%)
specvp13 3dsmax-06 + Intel Iris Plus Graphics 655 SPECviewperf 13 - specvp13 3dsmax-06
18.2 fps (3%)
SPECviewperf 2020 specvp2020 solidworks-05 4k + Intel Iris Plus Graphics 655 SPECviewperf 2020 - specvp2020 solidworks-05 4k
21.2 fps (6%)
specvp2020 snx-04 4k + Intel Iris Plus Graphics 655 SPECviewperf 2020 - specvp2020 snx-04 4k
3.8 fps (0%)
specvp2020 medical-03 4k + Intel Iris Plus Graphics 655 SPECviewperf 2020 - specvp2020 medical-03 4k
1.8 fps (2%)
specvp2020 maya-06 4k + Intel Iris Plus Graphics 655 SPECviewperf 2020 - specvp2020 maya-06 4k
32.7 fps (5%)
specvp2020 energy-03 4k + Intel Iris Plus Graphics 655 SPECviewperf 2020 - specvp2020 energy-03 4k
1.1 fps (0%)
specvp2020 creo-03 4k + Intel Iris Plus Graphics 655 SPECviewperf 2020 - specvp2020 creo-03 4k
12.1 fps (6%)
specvp2020 catia-06 4k + Intel Iris Plus Graphics 655 SPECviewperf 2020 - specvp2020 catia-06 4k
6.3 fps (4%)
specvp2020 3dsmax-07 4k + Intel Iris Plus Graphics 655 SPECviewperf 2020 - specvp2020 3dsmax-07 4k
8.4 fps (3%)
Cinebench R10 Cinebench R10 Shading (32bit) + Intel Iris Plus Graphics 655 Cinebench R10 - Cinebench R10 Shading (32bit)
min: 7836 avg: 9544 median: 10263 (7%) max: 10533 Points
Cinebench R10 Shading (32bit) + Intel HD Graphics 515
min: 4740 avg: 6063 median: 6088 (4%) max: 7263 Points
Cinebench R10 Shading (32bit) + Intel UHD Graphics 610
min: 4516 avg: 5210 median: 5209.5 (4%) max: 5903 Points
Cinebench R11.5 Cinebench R11.5 OpenGL 64 Bit + Intel Iris Plus Graphics 655 Cinebench R11.5 - Cinebench R11.5 OpenGL 64 Bit
min: 50.25 avg: 51.4 median: 51.6 (18%) max: 52.2 fps
Cinebench R11.5 OpenGL 64 Bit + Intel HD Graphics 515
min: 16.86 avg: 23.6 median: 23.1 (8%) max: 31.86 fps
Cinebench R11.5 OpenGL 64 Bit + Intel UHD Graphics 610
17.3 fps (6%)
Cinebench R15 + Intel Iris Plus Graphics 655 Cinebench R15 - Cinebench R15 OpenGL 64 Bit
min: 33.91 avg: 67 median: 74 (4%) max: 88 fps
Cinebench R15 OpenGL 64 Bit + Intel HD Graphics 515
min: 18.93 avg: 28.6 median: 29.4 (2%) max: 35.98 fps
Cinebench R15 OpenGL 64 Bit + Intel UHD Graphics 610
min: 27.5 avg: 28.4 median: 28.4 (2%) max: 29.24 fps
Cinebench R15 OpenGL Ref. Match 64 Bit + Intel Iris Plus Graphics 655 Cinebench R15 - Cinebench R15 OpenGL Ref. Match 64 Bit
min: 97.8 avg: 98.1 median: 97.8 (98%) max: 99.3 %
Cinebench R15 OpenGL Ref. Match 64 Bit + Intel HD Graphics 515
min: 97.7 avg: 98 median: 97.8 (98%) max: 99.3 %
Cinebench R15 OpenGL Ref. Match 64 Bit + Intel UHD Graphics 610
97.8 % (98%)
GFXBench - GFXBench 5.0 Aztec Ruins High Tier Offscreen
5.4 fps (1%)
GFXBench - GFXBench 5.0 Aztec Ruins Normal Tier Offscreen
15.3 fps (1%)
GFXBench - GFXBench Car Chase Offscreen
20.9 fps (2%)
16.7 fps (2%)
GFXBench 3.1 - GFXBench Manhattan ES 3.1 Offscreen
min: 43.1 avg: 2387 median: 2387.1 (50%) max: 4731 fps
min: 25.5 avg: 27.7 median: 27.7 (1%) max: 29.9 fps
23.1 fps (0%)
GFXBench 3.0 - GFXBench 3.0 Manhattan Offscreen
199.6 fps (12%)
min: 31.9 avg: 36.5 median: 36.7 (2%) max: 43.6 fps
33.1 fps (2%)
GFXBench (DX / GLBenchmark) 2.7 + Intel Iris Plus Graphics 655 GFXBench (DX / GLBenchmark) 2.7 - GFXBench T-Rex HD Offscreen C24Z16
min: 199.6 avg: 6375 median: 6375.3 (51%) max: 12551 fps
GFXBench T-Rex HD Offscreen C24Z16 + Intel HD Graphics 515
min: 70 avg: 75.4 median: 73.2 (1%) max: 87 fps
GFXBench T-Rex HD Offscreen C24Z16 + Intel UHD Graphics 610
71.9 fps (1%)
Basemark GPU 1.2 - Basemark GPU 1.2 Vulkan Official Medium Offscreen 1080
25.5 fps (0%)
LuxMark v2.0 64Bit - LuxMark v2.0 Room GPU
min: 359 avg: 419.5 median: 419.5 (2%) max: 480 Samples/s
min: 173 avg: 183 median: 183 (1%) max: 193 Samples/s
min: 144 avg: 157 median: 157 (1%) max: 170 Samples/s
LuxMark v2.0 64Bit - LuxMark v2.0 Sala GPU
min: 882 avg: 1038 median: 1038 (2%) max: 1194 Samples/s
min: 395 avg: 413.5 median: 416 (1%) max: 427 Samples/s
min: 295 avg: 304.5 median: 304.5 (1%) max: 314 Samples/s
ComputeMark v2.1 - ComputeMark v2.1 Result
min: 1584 avg: 1713 median: 1712.5 (2%) max: 1841 Points
min: 476 avg: 660 median: 704 (1%) max: 741 Points
min: 480 avg: 481.5 median: 481.5 (1%) max: 483 Points
Power Consumption - Furmark Stress Test Power Consumption - external Monitor *
min: 28.9 avg: 37.4 median: 39.2 (6%) max: 42.4 Watt
min: 18 avg: 23.1 median: 23.1 (3%) max: 28.2 Watt
Power Consumption - The Witcher 3 Power Consumption - external Monitor *
min: 35.3 avg: 40.6 median: 39.4 (6%) max: 47.2 Watt
Power Consumption - Witcher 3 Power Consumption *
min: 39.4 avg: 43.3 median: 43.3 (10%) max: 47.2 Watt
25.6 Watt (6%)
Power Consumption - Witcher 3 ultra Power Efficiency
0.1 fps per Watt (14%)
Power Consumption - Witcher 3 ultra Power Efficiency - external Monitor
0.2 fps per Watt (13%)
Emissions Witcher 3 Fan Noise + Intel Iris Plus Graphics 655 Emissions - Witcher 3 Fan Noise
min: 32.5 avg: 36.2 median: 37.2 (60%) max: 39 dB(A)
Clock Speed - GPU Clock Witcher 3 ultra
998 MHz (39%)
Clock Speed - GPU Clock Speed Furmark
948 MHz (38%)
Average Benchmarks Intel Iris Plus Graphics 655 → 100% n=23 Average Benchmarks Intel HD Graphics 515 → 38% n=23 Average Benchmarks Intel UHD Graphics 610 → 34% n=23
- Range of benchmark values for this graphics card
- Average benchmark values for this graphics card
* Smaller numbers mean a higher performance
1 This benchmark is not used for the average calculation
Game Benchmarks The following benchmarks stem from our benchmarks of review laptops. The performance depends on the used graphics memory, clock rate, processor, system settings, drivers, and operating systems. So the results don't have to be representative for all laptops with this GPU. For detailed information on the benchmark results, click on the fps number.
100%
Iris Plus Graphics 655:
44.6 fps
44%
UHD Graphics 610:
19.7 [X] Nofflink M500-5405U 874931
Intel Pentium Gold 5405U 2.3GHz
UHD Graphics 610
min:
4 fps, P1:
11 fps, max:
23 fps
fps
100%
Iris Plus Graphics 655:
21.6 fps
36%
UHD Graphics 610:
7.9 [X] Nofflink M500-5405U 874931
Intel Pentium Gold 5405U 2.3GHz
UHD Graphics 610
min:
2 fps, P1:
5 fps, max:
9 fps
fps
100%
Iris Plus Graphics 655:
16.4 fps
38%
UHD Graphics 610:
6.3 [X] Nofflink M500-5405U 874931
Intel Pentium Gold 5405U 2.3GHz
UHD Graphics 610
min:
3 fps, P1:
4 fps, max:
7 fps
fps
100%
Iris Plus Graphics 655:
10.2 fps
100%
Iris Plus Graphics 655:
40.7 fps
43%
UHD Graphics 610:
17.6 fps
100%
Iris Plus Graphics 655:
19.1 fps
39%
UHD Graphics 610:
7.5 fps
100%
Iris Plus Graphics 655:
14.5 fps
38%
UHD Graphics 610:
5.5 fps
100%
Iris Plus Graphics 655:
9.6 fps
100%
Iris Plus Graphics 655:
54.8 fps
28%
UHD Graphics 610:
15.5 fps
100%
Iris Plus Graphics 655:
17.3 fps
100%
Iris Plus Graphics 655:
11.6 fps
Iris Plus Graphics 655:
0 (!) [X] Intel NUC8i7BE Intel Core i7-8559U 2.7GHz
Iris Plus Graphics 655
fps
UHD Graphics 610:
0 (!) fps
100%
Iris Plus Graphics 655:
29.1 [X] Intel NUC8i7BE Intel Core i7-8559U 2.7GHz
Iris Plus Graphics 655
min:
17 fps, max:
36 fps
fps
100%
Iris Plus Graphics 655:
16.2 [X] Intel NUC8i7BE Intel Core i7-8559U 2.7GHz
Iris Plus Graphics 655
min:
11 fps, max:
22 fps
fps
100%
Iris Plus Graphics 655:
14.1 [X] Intel NUC8i7BE Intel Core i7-8559U 2.7GHz
Iris Plus Graphics 655
min:
11 fps, max:
21 fps
fps
100%
Iris Plus Graphics 655:
6.6 [X] Intel NUC8i7BE Intel Core i7-8559U 2.7GHz
Iris Plus Graphics 655
min:
3 fps, max:
9 fps
fps
UHD Graphics 610:
30.4 fps
100%
Iris Plus Graphics 655:
59.8 [X] Intel NUC8i7BE Intel Core i7-8559U 2.7GHz
Iris Plus Graphics 655
min:
56 fps, max:
62 fps
fps
37%
UHD Graphics 610:
21.9 fps
100%
Iris Plus Graphics 655:
27.2 [X] Intel NUC8i7BE Intel Core i7-8559U 2.7GHz
Iris Plus Graphics 655
min:
20 fps, max:
31 fps
fps
100%
Iris Plus Graphics 655:
15.8 [X] Intel NUC8i7BE Intel Core i7-8559U 2.7GHz
Iris Plus Graphics 655
min:
3.7 fps, P1:
6.17 fps, max:
130 fps
fps
Iris Plus Graphics 655:
0 (!) [X] Intel NUC8i7BE Intel Core i7-8559U 2.7GHz
Iris Plus Graphics 655
fps
100%
Iris Plus Graphics 655:
36.3 (!) [X] Intel NUC8i7BE Intel Core i7-8559U 2.7GHz
Iris Plus Graphics 655
P1:
24.6 fps
fps
100%
Iris Plus Graphics 655:
20.9 (!) [X] Intel NUC8i7BE Intel Core i7-8559U 2.7GHz
Iris Plus Graphics 655
P1:
14.5 fps
fps
Iris Plus Graphics 655:
0 (!) [X] Intel NUC8i7BE Intel Core i7-8559U 2.7GHz
Iris Plus Graphics 655
fps
100%
Iris Plus Graphics 655:
92 [X] Intel NUC8i7BE DirectX 11
Intel Core i7-8559U 2.7GHz
Iris Plus Graphics 655
P1:
74.1 fps
fps
30%
UHD Graphics 610:
27.5 (!) [X] Lenovo V340-17IWL 81RG001YGE Intel Pentium Gold 5405U 2.3GHz
UHD Graphics 610
P1:
21 fps
fps
100%
Iris Plus Graphics 655:
55.9 [X] Intel NUC8i7BE DirectX 11
Intel Core i7-8559U 2.7GHz
Iris Plus Graphics 655
P1:
47.4 fps
fps
100%
Iris Plus Graphics 655:
46.3 [X] Intel NUC8i7BE DirectX 11
Intel Core i7-8559U 2.7GHz
Iris Plus Graphics 655
P1:
35.6 fps
fps
100%
Iris Plus Graphics 655:
34.9 [X] Intel NUC8i7BE DirectX 11
Intel Core i7-8559U 2.7GHz
Iris Plus Graphics 655
P1:
31.3 fps
fps
100%
Iris Plus Graphics 655:
26.5 [X] Intel NUC8i7BE DirectX 11
Intel Core i7-8559U 2.7GHz
Iris Plus Graphics 655
P1:
24 fps
fps
100%
Iris Plus Graphics 655:
13.6 [X] Intel NUC8i7BE DirectX 11
Intel Core i7-8559U 2.7GHz
Iris Plus Graphics 655
P1:
12 fps
fps
100%
Iris Plus Graphics 655:
22.5 23.5 ~ 23 fps
100%
Iris Plus Graphics 655:
10.2 10.4 ~ 10 fps
100%
Iris Plus Graphics 655:
6.4 6.7 ~ 7 fps
100%
Iris Plus Graphics 655:
25.4 (!) [X] Intel NUC8i7BE Intel Core i7-8559U 2.7GHz
Iris Plus Graphics 655
min:
20 fps, max:
31 fps
fps
100%
Iris Plus Graphics 655:
51.2 [X] Intel NUC8i7BE Intel Core i7-8559U 2.7GHz
Iris Plus Graphics 655
min:
46 fps, max:
56 fps
fps
32%
UHD Graphics 610:
16.6 fps
100%
Iris Plus Graphics 655:
21.9 [X] Intel NUC8i7BE Intel Core i7-8559U 2.7GHz
Iris Plus Graphics 655
min:
19 fps, max:
23 fps
fps
100%
Iris Plus Graphics 655:
19.3 [X] Intel NUC8i7BE Intel Core i7-8559U 2.7GHz
Iris Plus Graphics 655
min:
17 fps, max:
21 fps
fps
100%
Iris Plus Graphics 655:
56.7 [X] Intel NUC8i7BE Intel Core i7-8559U 2.7GHz
Iris Plus Graphics 655
min:
51 fps, max:
63 fps
fps
30%
UHD Graphics 610:
16.9 fps
100%
Iris Plus Graphics 655:
18.5 [X] Intel NUC8i7BE Intel Core i7-8559U 2.7GHz
Iris Plus Graphics 655
min:
14 fps, max:
24 fps
fps
27%
UHD Graphics 610:
5 fps
100%
Iris Plus Graphics 655:
10.5 [X] Intel NUC8i7BE Intel Core i7-8559U 2.7GHz
Iris Plus Graphics 655
min:
8 fps, max:
13 fps
fps
100%
Iris Plus Graphics 655:
24.5 fps
100%
Iris Plus Graphics 655:
30.2 [X] Intel NUC8i7BE Intel Core i7-8559U 2.7GHz
Iris Plus Graphics 655
min:
26 fps, max:
34 fps
fps
34%
UHD Graphics 610:
10.4 fps
100%
Iris Plus Graphics 655:
35 fps
100%
Iris Plus Graphics 655:
64 [X] Intel NUC8i7BE Intel Core i7-8559U 2.7GHz
Iris Plus Graphics 655
min:
57 fps, max:
76 fps
fps
100%
Iris Plus Graphics 655:
22.8 [X] Intel NUC8i7BE Intel Core i7-8559U 2.7GHz
Iris Plus Graphics 655
min:
20 fps, max:
25 fps
fps
100%
Iris Plus Graphics 655:
16.6 [X] Intel NUC8i7BE Intel Core i7-8559U 2.7GHz
Iris Plus Graphics 655
min:
8 fps, max:
21 fps
fps
100%
Iris Plus Graphics 655:
21 22 [X] Intel NUC8i7BE Intel Core i7-8559U 2.7GHz
Iris Plus Graphics 655
min:
19 fps, max:
27 fps
~ 22 fps
36%
UHD Graphics 610:
7 8 ~ 8 fps
100%
Iris Plus Graphics 655:
11 [X] Intel NUC8i7BE Intel Core i7-8559U 2.7GHz
Iris Plus Graphics 655
min:
10 fps, max:
14 fps
11 ~ 11 fps
36%
UHD Graphics 610:
4 fps
100%
Iris Plus Graphics 655:
10 fps
40%
UHD Graphics 610:
4 fps
100%
Iris Plus Graphics 655:
9 fps
100%
Iris Plus Graphics 655:
18.3 [X] Intel NUC8i7BE Intel Core i7-8559U 2.7GHz
Iris Plus Graphics 655
min:
10.36 fps, max:
31.73 fps
20.1 ~ 19 fps
100%
Iris Plus Graphics 655:
10.1 fps
100%
Iris Plus Graphics 655:
7.4 fps
100%
Iris Plus Graphics 655:
19.9 [X] Intel NUC8i7BE Intel Core i7-8559U 2.7GHz
Iris Plus Graphics 655
min:
1 fps, max:
33 fps
fps
34%
UHD Graphics 610:
6.8 fps
Iris Plus Graphics 655:
0 (!) fps
100%
Iris Plus Graphics 655:
13 18 [X] Intel NUC8i7BE Intel Core i7-8559U 2.7GHz
Iris Plus Graphics 655
min:
7 fps, max:
26 fps
~ 16 fps
100%
Iris Plus Graphics 655:
25 fps
Iris Plus Graphics 655:
0 (!) fps
100%
Iris Plus Graphics 655:
82 [X] Intel NUC8i7BE Intel Core i7-8559U 2.7GHz
Iris Plus Graphics 655
min:
70 fps, max:
96 fps
fps
26%
HD Graphics 515:
21 (!) [X] Cube i9 Intel Core m3-6Y30 0.9GHz
HD Graphics 515
max:
30 fps
fps
100%
Iris Plus Graphics 655:
45.8 [X] Intel NUC8i7BE Intel Core i7-8559U 2.7GHz
Iris Plus Graphics 655
min:
39 fps, max:
51 fps
fps
100%
Iris Plus Graphics 655:
40.3 [X] Intel NUC8i7BE Intel Core i7-8559U 2.7GHz
Iris Plus Graphics 655
min:
32 fps, max:
48 fps
fps
100%
Iris Plus Graphics 655:
36.7 [X] Intel NUC8i7BE Intel Core i7-8559U 2.7GHz
Iris Plus Graphics 655
min:
30 fps, max:
45 fps
fps
43%
UHD Graphics 610:
9 fps
100%
Iris Plus Graphics 655:
11 13 ~ 12 fps
100%
Iris Plus Graphics 655:
8 10.1 ~ 9 fps
100%
Iris Plus Graphics 655:
41.4 fps
44%
UHD Graphics 610:
18.3 [X] Nofflink M500-5405U 1.47.22.14 D3D12
Intel Pentium Gold 5405U 2.3GHz
UHD Graphics 610
min:
5 fps, P1:
6.15 fps, max:
195.1 fps
fps
100%
Iris Plus Graphics 655:
17.6 fps
44%
UHD Graphics 610:
7.7 [X] Nofflink M500-5405U 1.47.22.14 D3D12
Intel Pentium Gold 5405U 2.3GHz
UHD Graphics 610
min:
5 fps, P1:
5 fps, max:
169.3 fps
fps
100%
Iris Plus Graphics 655:
16.9 fps
59%
UHD Graphics 610:
10 [X] Nofflink M500-5405U 1.47.22.14 D3D12
Intel Pentium Gold 5405U 2.3GHz
UHD Graphics 610
min:
5 fps, P1:
5 fps, max:
151.2 fps
fps
100%
Iris Plus Graphics 655:
14.5 fps
94%
UHD Graphics 610:
13.6 [X] Nofflink M500-5405U 1.47.22.14 D3D12
Intel Pentium Gold 5405U 2.3GHz
UHD Graphics 610
min:
5 fps, P1:
5 fps, max:
158.2 fps
fps
100%
Iris Plus Graphics 655:
45 fps
100%
Iris Plus Graphics 655:
23 fps
100%
Iris Plus Graphics 655:
17 fps
100%
Iris Plus Graphics 655:
12 12 ~ 12 fps
100%
Iris Plus Graphics 655:
30.9 fps
100%
Iris Plus Graphics 655:
20 22 23 [X] Intel NUC8i7BE Intel Core i7-8559U 2.7GHz
Iris Plus Graphics 655
min:
20 fps, max:
28 fps
~ 22 fps
36%
UHD Graphics 610:
7 8 ~ 8 fps
100%
Iris Plus Graphics 655:
10 11 [X] Intel NUC8i7BE Intel Core i7-8559U 2.7GHz
Iris Plus Graphics 655
min:
10 fps, max:
14 fps
11 ~ 11 fps
36%
UHD Graphics 610:
4 fps
100%
Iris Plus Graphics 655:
10 fps
30%
UHD Graphics 610:
3 fps
100%
Iris Plus Graphics 655:
9 fps
100%
Iris Plus Graphics 655:
15.7 250 ~ 133 fps
100%
Iris Plus Graphics 655:
40.3 fps
55%
HD Graphics 515:
14.4 [X] Cube i9 Intel Core m3-6Y30 0.9GHz
HD Graphics 515
fps
38%
UHD Graphics 610:
9.6 10.9 ~ 10 fps
50%
UHD Graphics 610:
7.5 10.5 ~ 9 fps
44%
UHD Graphics 610:
6.9 7.3 ~ 7 fps
48%
UHD Graphics 610:
7.7 fps
39%
UHD Graphics 610:
3.5 fps
59%
UHD Graphics 610:
3.5 fps
100%
Iris Plus Graphics 655:
51.5 fps
46%
UHD Graphics 610:
23.8 (!) [X] Lenovo V340-17IWL 81RG001YGE Intel Pentium Gold 5405U 2.3GHz
UHD Graphics 610
min:
7 fps, max:
36 fps
fps
100%
Iris Plus Graphics 655:
21.6 fps
100%
Iris Plus Graphics 655:
13 fps
100%
Iris Plus Graphics 655:
30 fps
47%
UHD Graphics 610:
14 fps
100%
Iris Plus Graphics 655:
18 fps
100%
Iris Plus Graphics 655:
14 fps
100%
Iris Plus Graphics 655:
9 fps
100%
Iris Plus Graphics 655:
128 fps
35%
HD Graphics 515:
42 48 [X] Cube i9 Intel Core m3-6Y30 0.9GHz
HD Graphics 515
min:
42 fps
~ 45 fps
100%
Iris Plus Graphics 655:
125 fps
26%
HD Graphics 515:
30 36 [X] Cube i9 Intel Core m3-6Y30 0.9GHz
HD Graphics 515
min:
32 fps
~ 33 fps
100%
Iris Plus Graphics 655:
113 fps
17%
HD Graphics 515:
14 24 [X] Cube i9 Intel Core m3-6Y30 0.9GHz
HD Graphics 515
min:
20 fps
~ 19 fps
100%
Iris Plus Graphics 655:
57.8 fps
100%
Iris Plus Graphics 655:
34.4 fps
HD Graphics 515:
26.6 [X] Cube i9 Intel Core m3-6Y30 0.9GHz
HD Graphics 515
min:
23 fps, max:
29 fps
fps
100%
Iris Plus Graphics 655:
78 97 133.3 ~ 103 fps
28%
HD Graphics 515:
28 30.1 [X] Cube i9 Intel Core m3-6Y30 0.9GHz
HD Graphics 515
min:
15 fps, max:
44 fps
~ 29 fps
20%
UHD Graphics 610:
20.3 fps
22%
HD Graphics 515:
10.7 [X] Cube i9 Intel Core m3-6Y30 0.9GHz
HD Graphics 515
max:
16 fps
11 ~ 11 fps
100%
Iris Plus Graphics 655:
20.4 22.7 [X] Intel NUC8i7BE Intel Core i7-8559U 2.7GHz
Iris Plus Graphics 655
min:
15 fps, max:
27 fps
~ 22 fps
43%
HD Graphics 515:
9.4 [X] Medion Akoya P3401T 2in1 Intel Core m5-6Y54 1.1GHz
HD Graphics 515
fps
100%
Iris Plus Graphics 655:
10.2 fps
42%
HD Graphics 515:
4.3 [X] Medion Akoya P3401T 2in1 Intel Core m5-6Y54 1.1GHz
HD Graphics 515
fps
100%
Iris Plus Graphics 655:
0 (!) 41.3 [X] Intel NUC8i7BE Intel Core i7-8559U 2.7GHz
Iris Plus Graphics 655
min:
31 fps, max:
65 fps
~ 21 fps
82%
HD Graphics 515:
17.2 [X] Medion Akoya P3401T 2in1 Intel Core m5-6Y54 1.1GHz
HD Graphics 515
fps
100%
Iris Plus Graphics 655:
16.1 [X] Intel NUC8i7BE Intel Core i7-8559U 2.7GHz
Iris Plus Graphics 655
min:
13 fps, max:
21 fps
fps
41%
HD Graphics 515:
6.6 [X] Medion Akoya P3401T 2in1 Intel Core m5-6Y54 1.1GHz
HD Graphics 515
fps
HD Graphics 515:
22.3 [X] Medion Akoya P3401T 2in1 Intel Core m5-6Y54 1.1GHz
HD Graphics 515
fps
HD Graphics 515:
10.3 [X] Medion Akoya P3401T 2in1 Intel Core m5-6Y54 1.1GHz
HD Graphics 515
fps
HD Graphics 515:
48 [X] Cube i9 Intel Core m3-6Y30 0.9GHz
HD Graphics 515
min:
42 fps, max:
60 fps
fps
HD Graphics 515:
24.1 [X] Cube i9 Intel Core m3-6Y30 0.9GHz
HD Graphics 515
min:
19 fps, max:
30 fps
fps
HD Graphics 515:
10.1 [X] Cube i9 Intel Core m3-6Y30 0.9GHz
HD Graphics 515
min:
8 fps, max:
14 fps
fps
HD Graphics 515:
21.5 [X] Medion Akoya P3401T 2in1 Intel Core m5-6Y54 1.1GHz
HD Graphics 515
fps
HD Graphics 515:
10.3 [X] Medion Akoya P3401T 2in1 Intel Core m5-6Y54 1.1GHz
HD Graphics 515
fps
100%
Iris Plus Graphics 655:
28.7 [X] Intel NUC8i7BE Intel Core i7-8559U 2.7GHz
Iris Plus Graphics 655
min:
2.6 fps, max:
41.3 fps
fps
37%
HD Graphics 515:
10.7 [X] Medion Akoya P3401T 2in1 Intel Core m5-6Y54 1.1GHz
HD Graphics 515
fps
100%
Iris Plus Graphics 655:
21.1 [X] Intel NUC8i7BE Intel Core i7-8559U 2.7GHz
Iris Plus Graphics 655
min:
16 fps, max:
29 fps
fps
37%
HD Graphics 515:
7.8 [X] Medion Akoya P3401T 2in1 Intel Core m5-6Y54 1.1GHz
HD Graphics 515
fps
HD Graphics 515:
11.4 [X] Cube i9 Intel Core m3-6Y30 0.9GHz
HD Graphics 515
min:
5 fps, max:
15 fps
fps
100%
Iris Plus Graphics 655:
91 fps
20%
HD Graphics 515:
13.8 21.7 [X] Cube i9 Intel Core m3-6Y30 0.9GHz
HD Graphics 515
min:
14 fps, max:
30 fps
~ 18 fps
27%
UHD Graphics 610:
24.8 fps
100%
Iris Plus Graphics 655:
68 fps
12%
HD Graphics 515:
8.4 fps
26%
UHD Graphics 610:
17.7 fps
100%
Iris Plus Graphics 655:
29.9 fps
100%
Iris Plus Graphics 655:
18.2 fps
100%
Iris Plus Graphics 655:
19.4 fps
100%
Iris Plus Graphics 655:
11.3 fps
100%
Iris Plus Graphics 655:
10.5 fps
HD Graphics 515:
6.1 8.4 ~ 7 fps
100%
Iris Plus Graphics 655:
34.2 fps
35%
HD Graphics 515:
12 fps
100%
Iris Plus Graphics 655:
21.2 fps
40%
HD Graphics 515:
8.4 fps
100%
Iris Plus Graphics 655:
25.9 39.2 ~ 33 fps
100%
Iris Plus Graphics 655:
17.6 22.3 ~ 20 fps
100%
Iris Plus Graphics 655:
10.8 fps
100%
Iris Plus Graphics 655:
8.9 fps
100%
Iris Plus Graphics 655:
75.8 [X] Intel NUC8i7BE Intel Core i7-8559U 2.7GHz
Iris Plus Graphics 655
min:
12 fps, max:
128 fps
fps
34%
HD Graphics 515:
25.7 fps
32%
UHD Graphics 610:
24.2 fps
Iris Plus Graphics 655:
0 (!) [X] Intel NUC8i7BE Intel Core i7-8559U 2.7GHz
Iris Plus Graphics 655
fps
UHD Graphics 610:
15.1 fps
HD Graphics 515:
32 [X] Cube i9 Intel Core m3-6Y30 0.9GHz
HD Graphics 515
min:
13 fps, max:
48 fps
32.1 42.8 ~ 36 fps
HD Graphics 515:
23.6 [X] Cube i9 Intel Core m3-6Y30 0.9GHz
HD Graphics 515
min:
10 fps, max:
42 fps
26.3 30.2 ~ 27 fps
56%
HD Graphics 515:
48 [X] Cube i9 Intel Core m3-6Y30 0.9GHz
HD Graphics 515
min:
42.2 fps
fps
48%
HD Graphics 515:
25.4 [X] Cube i9 Intel Core m3-6Y30 0.9GHz
HD Graphics 515
min:
21.5 fps
30 [X] Cube i9 Intel Core m3-6Y30 0.9GHz
HD Graphics 515
~ 28 fps
32%
HD Graphics 515:
9.4 [X] Cube i9 Intel Core m3-6Y30 0.9GHz
HD Graphics 515
min:
8.7 fps
fps
31%
HD Graphics 515:
8.1 [X] Cube i9 Intel Core m3-6Y30 0.9GHz
HD Graphics 515
min:
7.1 fps
fps
42%
UHD Graphics 610:
9.7 11.6 ~ 11 fps
100%
Iris Plus Graphics 655:
11.6 12.2 ~ 12 fps
38%
UHD Graphics 610:
9.2 11.3 [X] Nofflink M500-5405U Intel Pentium Gold 5405U 2.3GHz
UHD Graphics 610
min:
1.234 fps, P0.1:
2.27 fps, P1:
5.1 fps, max:
60.3 fps
~ 10 fps
100%
Iris Plus Graphics 655:
14.6 17.8 ~ 16 fps
44%
HD Graphics 515:
7.1 fps
48%
UHD Graphics 610:
7.7 [X] Nofflink M500-5405U Intel Pentium Gold 5405U 2.3GHz
UHD Graphics 610
min:
6.08 fps, P0.1:
6.31 fps, P1:
7.15 fps, max:
8.32 fps
fps
100%
Iris Plus Graphics 655:
10.1 10.9 ~ 11 fps
38%
UHD Graphics 610:
4.2 [X] Nofflink M500-5405U Intel Pentium Gold 5405U 2.3GHz
UHD Graphics 610
min:
3.82 fps, P0.1:
3.85 fps, P1:
4.05 fps, max:
4.39 fps
fps
100%
Iris Plus Graphics 655:
5.6 5.6 ~ 6 fps
HD Graphics 515:
57 [X] Dell Latitude 12 E7275 Intel Core m7-6Y75 1.2GHz
HD Graphics 515
57.8 65.7 67.2 ~ 62 fps
HD Graphics 515:
13.9 [X] Dell Latitude 12 E7275 Intel Core m7-6Y75 1.2GHz
HD Graphics 515
14.4 15.8 16 ~ 15 fps
100%
Iris Plus Graphics 655:
57 61 68 [X] Intel NUC8i7BE Intel Core i7-8559U 2.7GHz
Iris Plus Graphics 655
min:
17.5 fps, P1:
40 fps, max:
131 fps
~ 62 fps
37%
UHD Graphics 610:
17.9 28.5 [X] Nofflink M500-5405U Intel Pentium Gold 5405U 2.3GHz
UHD Graphics 610
min:
9.02 fps, P1:
18.2 fps, max:
49.6 fps
~ 23 fps
100%
Iris Plus Graphics 655:
51.2 51.8 62.1 [X] Intel NUC8i7BE Intel Core i7-8559U 2.7GHz
Iris Plus Graphics 655
min:
15.1 fps, P1:
37 fps, max:
117 fps
~ 55 fps
38%
UHD Graphics 610:
16.7 25.4 [X] Nofflink M500-5405U Intel Pentium Gold 5405U 2.3GHz
UHD Graphics 610
min:
11 fps, P1:
15.2 fps, max:
41.5 fps
~ 21 fps
100%
Iris Plus Graphics 655:
13.7 14.3 15.8 [X] Intel NUC8i7BE Intel Core i7-8559U 2.7GHz
Iris Plus Graphics 655
min:
8.44 fps, P1:
11.9 fps, max:
85.5 fps
~ 15 fps
40%
UHD Graphics 610:
6 [X] Nofflink M500-5405U Intel Pentium Gold 5405U 2.3GHz
UHD Graphics 610
min:
0.798 fps, P1:
4.46 fps, max:
19.1 fps
fps
100%
Iris Plus Graphics 655:
5.2 5.5 6.2 [X] Intel NUC8i7BE Intel Core i7-8559U 2.7GHz
Iris Plus Graphics 655
min:
3.37 fps, P1:
4.2 fps, max:
28.7 fps
~ 6 fps
100%
Iris Plus Graphics 655:
4.2 [X] Intel NUC8i7BE Intel Core i7-8559U 2.7GHz
Iris Plus Graphics 655
min:
2.38 fps, P1:
2.82 fps, max:
99 fps
fps
HD Graphics 515:
6.8 8.3 ~ 8 fps
HD Graphics 515:
41 41 ~ 41 fps
HD Graphics 515:
27 28 ~ 28 fps
HD Graphics 515:
15 17 ~ 16 fps
HD Graphics 515:
161.1 fps
100%
Iris Plus Graphics 655:
78.4 116.6 ~ 98 fps
100%
Iris Plus Graphics 655:
54.3 64.8 ~ 60 fps
100%
Iris Plus Graphics 655:
49.4 55 ~ 52 fps
100%
Iris Plus Graphics 655:
15.5 17 ~ 16 fps
31%
HD Graphics 515:
3.8 4 4.3 4.4 4.6 [X] Dell Latitude 12 E7275 Intel Core m7-6Y75 1.2GHz
HD Graphics 515
4.7 4.7 4.9 5.1 5.3 5.9 6 6.5 [X] Panasonic Toughbook CF-20 Intel Core m5-6Y57 1.1GHz
HD Graphics 515
6.7 [X] Medion Akoya P3401T 2in1 Intel Core m5-6Y54 1.1GHz
HD Graphics 515
~ 5 fps
UHD Graphics 610:
57.9 fps
UHD Graphics 610:
42.1 fps
100%
Iris Plus Graphics 655:
93.7 fps
37%
HD Graphics 515:
35.1 fps
100%
Iris Plus Graphics 655:
49.6 fps
41%
HD Graphics 515:
20.2 fps
100%
Iris Plus Graphics 655:
12.4 fps
UHD Graphics 610:
38.9 fps
UHD Graphics 610:
26.2 fps
Average Gaming Intel Iris Plus Graphics 655 → 100% Average Gaming 30-70 fps → 100%
Average Gaming Intel HD Graphics 515 → 35% Average Gaming 30-70 fps → 39%
Average Gaming Intel UHD Graphics 610 → 40% Average Gaming 30-70 fps → 69%
For more games that might be playable and a list of all games and graphics cards visit our Gaming List
v1.26
log 15. 05:28:44
#0 checking url part for id 8828 +0s ... 0s
#1 checking url part for id 6450 +0s ... 0s
#2 checking url part for id 10401 +0s ... 0s
#3 not redirecting to Ajax server +0s ... 0s
#4 did not recreate cache, as it is less than 5 days old! Created at Mon, 13 May 2024 05:40:51 +0200 +0.001s ... 0.001s
#5 composed specs +0.173s ... 0.174s
#6 did output specs +0s ... 0.174s
#7 start showIntegratedCPUs +0s ... 0.174s
#8 getting avg benchmarks for device 8828 +0.067s ... 0.241s
#9 got single benchmarks 8828 +0.031s ... 0.272s
#10 getting avg benchmarks for device 6450 +0.019s ... 0.291s
#11 got single benchmarks 6450 +0.114s ... 0.404s
#12 getting avg benchmarks for device 10401 +0.015s ... 0.42s
#13 got single benchmarks 10401 +0.021s ... 0.441s
#14 got avg benchmarks for devices +0s ... 0.441s
#15 min, max, avg, median took s +0.524s ... 0.965s
#16 before gaming benchmark output +0s ... 0.965s
#17 Got 619 rows for game benchmarks. +0.103s ... 1.068s
#18 composed SQL query for gamebenchmarks +0s ... 1.068s
#19 got data and put it in $dataArray +0.063s ... 1.131s
#20 benchmarks composed for output. +0.194s ... 1.325s
#21 calculated avg scores. +0s ... 1.325s
#22 return log +0.003s ... 1.328s
Please share our article, every link counts!
Redaktion, 2017-09- 8 (Update: 2023-07- 1)
 Deutsch
 English
 Español
 Français
 Italiano
 Nederlands
 Polski
 Português
 Русский
 Türkçe
 Svenska
 Chinese
 Magyar