NVIDIA GeForce MX230 vs NVIDIA GeForce GTX 1070 Ti (Desktop) vs NVIDIA GeForce GTX 1060 Max-Q
NVIDIA GeForce MX230 ► remove from comparison
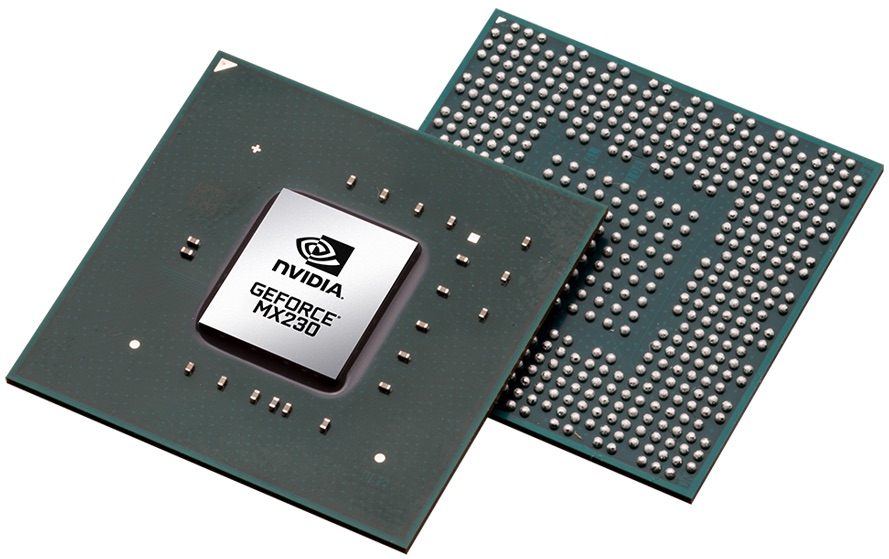
The Nvidia GeForce MX230 is an entry-level dedicated laptop graphics card with DirectX 12 support (FL 12_1) based (most likely) on the Pascal architecture (and not Maxwell as the older MX130). Similar to the faster MX250 , the MX230 is based on the GP108 chip.
Features
The GP108 chip is manufactured in a 14 nm FinFET process at Samsung (LPP) and offers a number of new features, including support for DisplayPort 1.4 (ready), HDMI 2.0b, HDR and improved H.265 video de- and encoding (PlayReady 3.0). 4K HDR with Netflix, however, wont run due to the minimum 3 GB graphics memory that is required. Compared to the bigger Pascal chips, the small GP108 does not support Simultaneous Multi-Projection (SMP) for VR and G-Sync. A full list of improvements and the new Pascal desktop GPUs is available in our dedicated Pascal architecture article
Performance
Thanks to the newer Pascal architecture, the MX230 is significantly faster than the old GeForce MX130 (Maxwell based). Demanding games of 2019 run only in lowest resolution and detail settings and may stutter (e.g. Anno 1800 or Rage 2 ran with under 30fps in our benchmarks). Less demanding games like Overwatch, Fifa 19 or Rocket League, however, can be played in higher detail and resolution settings without stuttering (see benchmarks below).
Power Consumption
The MX230 is manufactured in 14nm at Samsung and due to the low shader count and 64 Bit memory bus, the power consumption is rather low. Therefore, the chip can be also used for small and thin laptops. In our power tests, the faster MX250 needed 22% more power (Furmark load) and the old MX130 even 38% more. The integrated UHD Graphics 620 needed on average only 17% less power at a much lower performance.
NVIDIA GeForce GTX 1070 Ti (Desktop) ► remove from comparison
The Nvidia GeForce GTX 1070 Ti is the second fastest Pascal based graphics card in November 2017. It is a high-end desktop graphics card based on a cut down GP104 chip as the GTX 1080 and manufactured in 16 nm FinFET at TSMC. Compared to the GTX 1080, it uses the more available GDDR5 graphics memory, and compared to the GTX 1070 it offers more shaders (2432 versus 1920). More details on the Pascal architecture including all features and comparisons to Maxwell, can be found here .
The performance of the GTX 1070 Ti was in our tests right between the GTX 1070 and GTX 1080. However, the powerefficiency was worse than the GTX 1070 and near the GTX 1080. Nvidia also specifies the 1070 Ti and 1080 at 180W.
NVIDIA GeForce GTX 1060 Max-Q ► remove from comparison
The Nvidia GeForce GTX 1060 with the Max-Q design is a mobile high-end GPU from the Pascal series. It is designed for thin and light laptops and about 10-15% slower than a regular GTX 1060 for laptops based on the cooling capabilities. The base frequency (1063-1265 MHz) is also much lower than on the regular GTX 1060 (1506 MHz, at least -16%) and the Boost (1341-1480 MHz) is also much lower compared to 1708 MHz (at least -13%) for the regular GTX 1060. The memory clock, however, is identical.
The clock is not the only difference compared to the regular GTX 1060 though. The drivers for the Max-Q version were optimized for efficiency (and not performance; only for Max-Q models), there are optimized voltage converters for 1V operation, high-end cooling methods, and a 40 dB limit for the fan noise (with clock adjustments to ensure this at all times).
Features
The GP106 chip is produced in 16nm FinFET at TSMC and offers a range of new features, like DisplayPort 1.4 (ready), HDMI 2.0b, HDR, Simultaneous Multi-Projection (SMP) and improved H.265 video de- and encoding (PlayReady 3.0). A list of improvements and features can be found in our article on the Pascal architecture .
The power consumption of the Max-Q design is notably lower than the normal GTX 1060 for laptops and ranges between 60 and 70 Watt (TGP) according to Nvidia.
NVIDIA GeForce MX230 NVIDIA GeForce GTX 1070 Ti (Desktop) NVIDIA GeForce GTX 1060 Max-Q GeForce GTX 1000 Series GeForce MX250 384 @ 1.52 - 1.58 GHz 64 Bit @ 7000 MHz GeForce MX230 256 @ 1.52 - 1.53 GHz 64 Bit @ 7000 MHz
Codename N17S-G0 Pascal GP104 N17P-G1 Max-Q Architecture Pascal Pascal Pascal Pipelines 256 - unified 2432 - unified 1280 - unified Core Speed 1519 - 1531 (Boost) MHz 1607 - 1683 (Boost) MHz 1063 - 1265 - 1341 - 1480 (Boost) MHz Memory Speed 7000 MHz 8000 MHz 8000 MHz Memory Bus Width 64 Bit 256 Bit 192 Bit Memory Type GDDR5 GDDR5 GDDR5 Max. Amount of Memory 4 GB 8 GB 6.144 MB Shared Memory no no no API DirectX 12_1, Shader 5.0, OpenGL 4.5 DirectX 12_1, OpenGL 4.5 DirectX 12_1, OpenGL 4.5 Transistors 1.8 Billion 7.2 Billion 4.4 Billion technology 14 nm 16 nm 16 nm Features Vulcan 1.1, GPU Boost 3.0, Optimus, PhysX, CUDA, GeForce Experience, GameWorks Multi-Projection, VR Ready, G-SYNC, Vulkan, Multi Monitor Multi-Projection, VR Ready, G-SYNC, Vulkan, Multi Monitor Notebook Size medium sized large Date of Announcement 20.02.2019 02.11.2017 30.05.2017 Link to Manufacturer Page www.geforce.com www.nvidia.at Power Consumption 180 Watt 60 - 70 Watt
Benchmarks Performance Rating - 3DMark 11 + Fire Strike + Time Spy - GeForce MX230
1.1 pt (3%)
...
...
max:
Performance Rating - 3DMark 11 + Fire Strike + Time Spy - GeForce GTX 1060 Max-Q
4.8 pt (14%)
...
NVIDIA GeForce GTX 1060 Max-Q
...
max:
3DMark - 3DMark Time Spy Score
min: 786 avg: 851 median: 839.5 (2%) max: 937 Points
6177 Points (18%)
min: 3271 avg: 3415 median: 3415 (10%) max: 3559 Points
3DMark - 3DMark Time Spy Graphics
min: 698 avg: 758 median: 748 (2%) max: 837 Points
6531 Points (17%)
min: 3138 avg: 3324 median: 3324 (9%) max: 3510 Points
3DMark - 3DMark Ice Storm Unlimited Graphics
min: 163728 avg: 178637 median: 183041 (21%) max: 189141 Points
442105 Points (50%)
min: 287286 avg: 346663 median: 367999 (42%) max: 384095 Points
3DMark - 3DMark Ice Storm Extreme Graphics
min: 35141 avg: 61903 median: 74932 (10%) max: 75636 Points
min: 71289 avg: 105162 median: 96536 (12%) max: 156285 Points
3DMark - 3DMark Cloud Gate Score
min: 8886 avg: 10432 median: 10529.5 (11%) max: 11659 Points
29364 Points (31%)
min: 16358 avg: 24167 median: 24154.5 (26%) max: 32658 Points
3DMark - 3DMark Cloud Gate Graphics
min: 13376 avg: 15921 median: 15796.5 (4%) max: 17999 Points
88161 Points (23%)
min: 42781 avg: 71376 median: 74101 (19%) max: 81720 Points
3DMark - 3DMark Fire Strike Standard Score
min: 2041 avg: 2300 median: 2298.5 (4%) max: 2531 Points
15061 Points (27%)
min: 8292 avg: 9159 median: 9148.5 (16%) max: 9936 Points
3DMark - 3DMark Fire Strike Standard Graphics
min: 2168 avg: 2479 median: 2467.5 (3%) max: 2755 Points
18405 Points (21%)
min: 9992 avg: 10659 median: 10430 (12%) max: 11366 Points
3DMark - 3DMark Ice Storm Graphics
min: 49120 avg: 78716 median: 84971 (10%) max: 95803 Points
min: 80051 avg: 144686 median: 118989 (14%) max: 265343 Points
3DMark 11 - 3DM11 Performance Score
min: 3316 avg: 3590 median: 3621.5 (5%) max: 3720 Points
20106 Points (28%)
min: 10176 avg: 11974 median: 11973 (17%) max: 13296 Points
3DMark 11 - 3DM11 Performance GPU
min: 3180 avg: 3392 median: 3363.5 (3%) max: 3582 Points
27503 Points (24%)
min: 12970 avg: 13581 median: 13333.5 (11%) max: 14487 Points
3DMark 06 3DMark 06 - Standard 1280x1024 + NVIDIA GeForce MX230
18399 Points (24%)
Model CPU GPU RAM Value 3DMark 06 - Standard 1280x1024 Asus VivoBook 14 F412FJ-EB119T (3DMark 06 - Standard 1280x1024) i5-8265U GeForce MX230 2 GB 18399
3DMark 06 - Standard 1280x1024 + NVIDIA GeForce GTX 1070 Ti (Desktop)
36475 Points (48%)
3DMark 06 - Standard 1280x1024 + NVIDIA GeForce GTX 1060 Max-Q
34189 Points (45%)
SPECviewperf 11 + NVIDIA GeForce GTX 1060 Max-Q SPECviewperf 11 - specvp11 snx-01
9.5 fps (6%)
specvp11 tcvis-02 + NVIDIA GeForce GTX 1060 Max-Q SPECviewperf 11 - specvp11 tcvis-02
2.8 fps (2%)
specvp11 sw-02 + NVIDIA GeForce GTX 1060 Max-Q SPECviewperf 11 - specvp11 sw-02
18.4 fps (14%)
specvp11 proe-05 + NVIDIA GeForce GTX 1060 Max-Q SPECviewperf 11 - specvp11 proe-05
2.8 fps (3%)
specvp11 maya-03 + NVIDIA GeForce GTX 1060 Max-Q SPECviewperf 11 - specvp11 maya-03
17.3 fps (13%)
specvp11 lightwave-01 + NVIDIA GeForce GTX 1060 Max-Q SPECviewperf 11 - specvp11 lightwave-01
20.1 fps (22%)
specvp11 ensight-04 + NVIDIA GeForce GTX 1060 Max-Q SPECviewperf 11 - specvp11 ensight-04
109.7 fps (52%)
specvp11 catia-03 + NVIDIA GeForce GTX 1060 Max-Q SPECviewperf 11 - specvp11 catia-03
19.7 fps (10%)
SPECviewperf 12 + NVIDIA GeForce GTX 1060 Max-Q SPECviewperf 12 - specvp12 sw-03
43.9 fps (11%)
specvp12 snx-02 + NVIDIA GeForce GTX 1060 Max-Q SPECviewperf 12 - specvp12 snx-02
5.4 fps (1%)
specvp12 showcase-01 + NVIDIA GeForce GTX 1060 Max-Q SPECviewperf 12 - specvp12 showcase-01
56.2 fps (12%)
specvp12 mediacal-01 + NVIDIA GeForce GTX 1060 Max-Q SPECviewperf 12 - specvp12 mediacal-01
27.5 fps (7%)
specvp12 maya-04 + NVIDIA GeForce GTX 1060 Max-Q SPECviewperf 12 - specvp12 maya-04
92 fps (25%)
specvp12 energy-01 + NVIDIA GeForce GTX 1060 Max-Q SPECviewperf 12 - specvp12 energy-01
5.2 fps (5%)
specvp12 creo-01 + NVIDIA GeForce GTX 1060 Max-Q SPECviewperf 12 - specvp12 creo-01
34.8 fps (14%)
specvp12 catia-04 + NVIDIA GeForce GTX 1060 Max-Q SPECviewperf 12 - specvp12 catia-04
45.4 fps (8%)
Cinebench R10 Cinebench R10 Shading (32bit) + NVIDIA GeForce MX230 Cinebench R10 - Cinebench R10 Shading (32bit)
min: 4095 avg: 5887 median: 6353 (5%) max: 6748 Points
Cinebench R10 Shading (32bit) + NVIDIA GeForce GTX 1060 Max-Q
min: 6822 avg: 8146 median: 6829.5 (5%) max: 11275 Points
Cinebench R11.5 Cinebench R11.5 OpenGL 64 Bit + NVIDIA GeForce MX230 Cinebench R11.5 - Cinebench R11.5 OpenGL 64 Bit
64.7 fps (22%)
Cinebench R11.5 OpenGL 64 Bit + NVIDIA GeForce GTX 1060 Max-Q
min: 59.6 avg: 68.9 median: 71.7 (25%) max: 76.2 fps
Cinebench R15 + NVIDIA GeForce MX230 Cinebench R15 - Cinebench R15 OpenGL 64 Bit
min: 79.7 avg: 84.3 median: 83.4 (5%) max: 92.5 fps
Cinebench R15 OpenGL 64 Bit + NVIDIA GeForce GTX 1060 Max-Q
min: 88.5 avg: 107.1 median: 110.6 (6%) max: 120.1 fps
Cinebench R15 OpenGL Ref. Match 64 Bit + NVIDIA GeForce MX230 Cinebench R15 - Cinebench R15 OpenGL Ref. Match 64 Bit
99.6 % (100%)
Cinebench R15 OpenGL Ref. Match 64 Bit + NVIDIA GeForce GTX 1060 Max-Q
99.6 % (100%)
GFXBench - GFXBench Car Chase Offscreen
45 fps (5%)
GFXBench 3.1 - GFXBench Manhattan ES 3.1 Offscreen
65 fps (1%)
GFXBench 3.0 - GFXBench 3.0 Manhattan Offscreen
91 fps (5%)
398 fps (23%)
GFXBench (DX / GLBenchmark) 2.7 + NVIDIA GeForce MX230 GFXBench (DX / GLBenchmark) 2.7 - GFXBench T-Rex HD Offscreen C24Z16
176 fps (1%)
LuxMark v2.0 64Bit - LuxMark v2.0 Room GPU
583 Samples/s (3%)
2542 Samples/s (11%)
1614 Samples/s (7%)
LuxMark v2.0 64Bit - LuxMark v2.0 Sala GPU
1069 Samples/s (2%)
5159 Samples/s (9%)
2924 Samples/s (5%)
ComputeMark v2.1 - ComputeMark v2.1 Result
2018 Points (2%)
15488 Points (17%)
min: 7555 avg: 7747 median: 7653 (8%) max: 8202 Points
Power Consumption - Furmark Stress Test Power Consumption - external Monitor *
33.8 Watt (5%)
291 Watt (41%)
Power Consumption - The Witcher 3 Power Consumption - external Monitor *
290 Watt (41%)
Power Consumption - Witcher 3 Power Consumption *
min: 89 avg: 105 median: 101.9 (22%) max: 123.1 Watt
Power Consumption - Witcher 3 ultra Power Efficiency
min: 0.3006 avg: 0.3 median: 0.3 (31%) max: 0.3955 fps per Watt
Power Consumption - Witcher 3 ultra Power Efficiency - external Monitor
0.2 fps per Watt (21%)
Emissions Witcher 3 Fan Noise + NVIDIA GeForce GTX 1060 Max-Q Emissions - Witcher 3 Fan Noise
min: 37.6 avg: 44.1 median: 44.1 (71%) max: 51.3 dB(A)
Clock Speed - GPU Clock Witcher 3 ultra
1810 MHz (71%)
1440 MHz (56%)
Clock Speed - GPU Clock Speed Furmark
1300 MHz (52%)
1677 MHz (66%)
Average Benchmarks NVIDIA GeForce MX230 → 100% n=13 Average Benchmarks NVIDIA GeForce GTX 1070 Ti (Desktop) → 565% n=13 Average Benchmarks NVIDIA GeForce GTX 1060 Max-Q → 340% n=13
- Range of benchmark values for this graphics card
- Average benchmark values for this graphics card
* Smaller numbers mean a higher performance
1 This benchmark is not used for the average calculation
Game Benchmarks The following benchmarks stem from our benchmarks of review laptops. The performance depends on the used graphics memory, clock rate, processor, system settings, drivers, and operating systems. So the results don't have to be representative for all laptops with this GPU. For detailed information on the benchmark results, click on the fps number.
100%
GeForce MX230:
46.8 fps
100%
GeForce MX230:
19.2 fps
100%
GeForce MX230:
12.4 fps
100%
GeForce MX230:
28 fps
100%
GeForce MX230:
14 fps
100%
GeForce MX230:
13 fps
100%
GeForce MX230:
73.1 fps
100%
GeForce MX230:
62.4 fps
100%
GeForce MX230:
55.6 fps
100%
GeForce MX230:
46.4 fps
100%
GeForce MX230:
39.6 fps
100%
GeForce MX230:
16 fps
100%
GeForce MX230:
10.1 fps
100%
GeForce MX230:
7.4 fps
100%
GeForce MX230:
34.8 fps
575%
GeForce GTX 1070 Ti (Desktop):
200 [X] i7-7740X Asus X299 Prime Intel Core i7-7740X 4.3GHz
GeForce GTX 1070 Ti (Desktop)
min:
173 fps, max:
219 fps
fps
100%
GeForce MX230:
11 fps
709%
GeForce GTX 1070 Ti (Desktop):
78 [X] i7-7740X Asus X299 Prime Intel Core i7-7740X 4.3GHz
GeForce GTX 1070 Ti (Desktop)
min:
68 fps, max:
88 fps
fps
100%
GeForce MX230:
7.5 fps
780%
GeForce GTX 1070 Ti (Desktop):
58.5 [X] i7-7740X Asus X299 Prime Intel Core i7-7740X 4.3GHz
GeForce GTX 1070 Ti (Desktop)
min:
50 fps, max:
67 fps
fps
GeForce GTX 1070 Ti (Desktop):
37.1 [X] i7-7740X Asus X299 Prime Intel Core i7-7740X 4.3GHz
GeForce GTX 1070 Ti (Desktop)
min:
31 fps, max:
43 fps
fps
GeForce GTX 1070 Ti (Desktop):
17.9 [X] i7-7740X Asus X299 Prime Intel Core i7-7740X 4.3GHz
GeForce GTX 1070 Ti (Desktop)
min:
15 fps, max:
21 fps
fps
100%
GeForce MX230:
62 fps
394%
GeForce GTX 1070 Ti (Desktop):
244 [X] i7-7740X Asus X299 Prime Intel Core i7-7740X 4.3GHz
GeForce GTX 1070 Ti (Desktop)
min:
195 fps, max:
269 fps
fps
100%
GeForce MX230:
25 fps
732%
GeForce GTX 1070 Ti (Desktop):
183 [X] i7-7740X Asus X299 Prime Intel Core i7-7740X 4.3GHz
GeForce GTX 1070 Ti (Desktop)
min:
155 fps, max:
196 fps
fps
100%
GeForce MX230:
20 fps
820%
GeForce GTX 1070 Ti (Desktop):
164 [X] i7-7740X Asus X299 Prime Intel Core i7-7740X 4.3GHz
GeForce GTX 1070 Ti (Desktop)
min:
145 fps, max:
176 fps
fps
100%
GeForce MX230:
12 fps
1000%
GeForce GTX 1070 Ti (Desktop):
120 [X] i7-7740X Asus X299 Prime Intel Core i7-7740X 4.3GHz
GeForce GTX 1070 Ti (Desktop)
min:
112 fps, max:
129 fps
fps
GeForce GTX 1070 Ti (Desktop):
94 [X] i7-7740X Asus X299 Prime Intel Core i7-7740X 4.3GHz
GeForce GTX 1070 Ti (Desktop)
min:
86 fps, max:
98 fps
fps
GeForce GTX 1070 Ti (Desktop):
57 [X] i7-7740X Asus X299 Prime Intel Core i7-7740X 4.3GHz
GeForce GTX 1070 Ti (Desktop)
min:
52 fps, max:
60 fps
fps
GeForce GTX 1070 Ti (Desktop):
271 [X] i7-7740X Asus X299 Prime Intel Core i7-7740X 4.3GHz
GeForce GTX 1070 Ti (Desktop)
min:
209 fps, max:
313 fps
fps
GeForce GTX 1070 Ti (Desktop):
249 [X] i7-7740X Asus X299 Prime Intel Core i7-7740X 4.3GHz
GeForce GTX 1070 Ti (Desktop)
min:
201 fps, max:
284 fps
fps
GeForce GTX 1070 Ti (Desktop):
241 [X] i7-7740X Asus X299 Prime Intel Core i7-7740X 4.3GHz
GeForce GTX 1070 Ti (Desktop)
min:
189 fps, max:
269 fps
fps
GeForce GTX 1070 Ti (Desktop):
219 [X] i7-7740X Asus X299 Prime Intel Core i7-7740X 4.3GHz
GeForce GTX 1070 Ti (Desktop)
min:
159 fps, max:
243 fps
fps
GeForce GTX 1070 Ti (Desktop):
222 [X] i7-7740X Asus X299 Prime Intel Core i7-7740X 4.3GHz
GeForce GTX 1070 Ti (Desktop)
min:
176 fps, max:
250 fps
fps
GeForce GTX 1070 Ti (Desktop):
221 [X] i7-7740X Asus X299 Prime Intel Core i7-7740X 4.3GHz
GeForce GTX 1070 Ti (Desktop)
min:
161 fps, max:
247 fps
fps
100%
GeForce MX230:
5.8 7.9 9 ~ 8 fps
1083%
GeForce GTX 1070 Ti (Desktop):
86.6 [X] i7-7740X Asus X299 Prime Intel Core i7-7740X 4.3GHz
GeForce GTX 1070 Ti (Desktop)
min:
71 fps, max:
102 fps
fps
1268%
GeForce GTX 1070 Ti (Desktop):
63.4 [X] i7-7740X Asus X299 Prime Intel Core i7-7740X 4.3GHz
GeForce GTX 1070 Ti (Desktop)
min:
56 fps, max:
76 fps
fps
GeForce GTX 1070 Ti (Desktop):
41.2 [X] i7-7740X Asus X299 Prime Intel Core i7-7740X 4.3GHz
GeForce GTX 1070 Ti (Desktop)
min:
36 fps, max:
47 fps
fps
GeForce GTX 1070 Ti (Desktop):
20.3 [X] i7-7740X Asus X299 Prime Intel Core i7-7740X 4.3GHz
GeForce GTX 1070 Ti (Desktop)
min:
17 fps, max:
22 fps
fps
100%
GeForce MX230:
24.5 fps
100%
GeForce MX230:
10.2 fps
100%
GeForce MX230:
4.1 fps
100%
GeForce MX230:
24.4 fps
100%
GeForce MX230:
8.1 fps
100%
GeForce MX230:
4.9 fps
100%
GeForce MX230:
2.1 fps
2190%
GeForce GTX 1070 Ti (Desktop):
46 [X] i7-7740X Asus X299 Prime Intel Core i7-7740X 4.3GHz
GeForce GTX 1070 Ti (Desktop)
min:
39 fps, max:
54 fps
fps
GeForce GTX 1070 Ti (Desktop):
40.4 [X] i7-7740X Asus X299 Prime Intel Core i7-7740X 4.3GHz
GeForce GTX 1070 Ti (Desktop)
min:
34 fps, max:
44 fps
fps
GeForce GTX 1070 Ti (Desktop):
24.1 [X] i7-7740X Asus X299 Prime Intel Core i7-7740X 4.3GHz
GeForce GTX 1070 Ti (Desktop)
min:
22 fps, max:
26 fps
fps
100%
GeForce MX230:
43 fps
100%
GeForce MX230:
13 fps
100%
GeForce MX230:
10 fps
100%
GeForce MX230:
71 fps
100%
GeForce MX230:
22.9 fps
100%
GeForce MX230:
17.5 fps
100%
GeForce MX230:
10.4 fps
100%
GeForce MX230:
22.7 fps
100%
GeForce MX230:
12.3 fps
100%
GeForce MX230:
11.1 fps
100%
GeForce MX230:
9.8 fps
100%
GeForce MX230:
32 fps
378%
GeForce GTX 1070 Ti (Desktop):
121 [X] i7-7740X Asus X299 Prime Intel Core i7-7740X 4.3GHz
GeForce GTX 1070 Ti (Desktop)
min:
93 fps, max:
174 fps
fps
100%
GeForce MX230:
15 fps
713%
GeForce GTX 1070 Ti (Desktop):
107 [X] i7-7740X Asus X299 Prime Intel Core i7-7740X 4.3GHz
GeForce GTX 1070 Ti (Desktop)
min:
83 fps, max:
140 fps
fps
100%
GeForce MX230:
13 fps
792%
GeForce GTX 1070 Ti (Desktop):
103 [X] i7-7740X Asus X299 Prime Intel Core i7-7740X 4.3GHz
GeForce GTX 1070 Ti (Desktop)
min:
84 fps, max:
132 fps
fps
100%
GeForce MX230:
12 fps
775%
GeForce GTX 1070 Ti (Desktop):
93 [X] i7-7740X Asus X299 Prime Intel Core i7-7740X 4.3GHz
GeForce GTX 1070 Ti (Desktop)
min:
72 fps, max:
127 fps
fps
GeForce GTX 1070 Ti (Desktop):
76 [X] i7-7740X Asus X299 Prime Intel Core i7-7740X 4.3GHz
GeForce GTX 1070 Ti (Desktop)
min:
60 fps, max:
95 fps
fps
GeForce GTX 1070 Ti (Desktop):
42 [X] i7-7740X Asus X299 Prime Intel Core i7-7740X 4.3GHz
GeForce GTX 1070 Ti (Desktop)
min:
34 fps, max:
51 fps
fps
100%
GeForce MX230:
25.9 fps
568%
GeForce GTX 1070 Ti (Desktop):
147 [X] i7-7740X Asus X299 Prime Intel Core i7-7740X 4.3GHz
GeForce GTX 1070 Ti (Desktop)
min:
77.86 fps, max:
237.53 fps
fps
100%
GeForce MX230:
4.8 fps
1729%
GeForce GTX 1070 Ti (Desktop):
83 [X] i7-7740X Asus X299 Prime Intel Core i7-7740X 4.3GHz
GeForce GTX 1070 Ti (Desktop)
min:
40.8 fps, max:
146.74 fps
fps
100%
GeForce MX230:
3.3 fps
1909%
GeForce GTX 1070 Ti (Desktop):
63 [X] i7-7740X Asus X299 Prime Intel Core i7-7740X 4.3GHz
GeForce GTX 1070 Ti (Desktop)
min:
32.59 fps, max:
112.4 fps
fps
100%
GeForce MX230:
4.5 fps
1162%
GeForce GTX 1070 Ti (Desktop):
52.3 [X] i7-7740X Asus X299 Prime Intel Core i7-7740X 4.3GHz
GeForce GTX 1070 Ti (Desktop)
min:
28.83 fps, max:
88.2 fps
fps
GeForce GTX 1070 Ti (Desktop):
40.2 [X] i7-7740X Asus X299 Prime Intel Core i7-7740X 4.3GHz
GeForce GTX 1070 Ti (Desktop)
min:
24.15 fps, max:
62.69 fps
fps
GeForce GTX 1070 Ti (Desktop):
24.6 [X] i7-7740X Asus X299 Prime Intel Core i7-7740X 4.3GHz
GeForce GTX 1070 Ti (Desktop)
min:
16.12 fps, max:
36.5 fps
fps
100%
GeForce MX230:
45.8 fps
314%
GeForce GTX 1070 Ti (Desktop):
144 [X] i7-7740X Asus X299 Prime Intel Core i7-7740X 4.3GHz
GeForce GTX 1070 Ti (Desktop)
min:
143 fps, max:
145 fps
fps
100%
GeForce MX230:
17.8 fps
775%
GeForce GTX 1070 Ti (Desktop):
138 [X] i7-7740X Asus X299 Prime Intel Core i7-7740X 4.3GHz
GeForce GTX 1070 Ti (Desktop)
min:
128 fps, max:
145 fps
fps
100%
GeForce MX230:
14.4 fps
854%
GeForce GTX 1070 Ti (Desktop):
123 [X] i7-7740X Asus X299 Prime Intel Core i7-7740X 4.3GHz
GeForce GTX 1070 Ti (Desktop)
min:
110 fps, max:
145 fps
fps
100%
GeForce MX230:
12.4 fps
976%
GeForce GTX 1070 Ti (Desktop):
121 [X] i7-7740X Asus X299 Prime Intel Core i7-7740X 4.3GHz
GeForce GTX 1070 Ti (Desktop)
min:
109 fps, max:
145 fps
fps
GeForce GTX 1070 Ti (Desktop):
81 [X] i7-7740X Asus X299 Prime Intel Core i7-7740X 4.3GHz
GeForce GTX 1070 Ti (Desktop)
min:
63 fps, max:
100 fps
fps
GeForce GTX 1070 Ti (Desktop):
42.4 [X] i7-7740X Asus X299 Prime Intel Core i7-7740X 4.3GHz
GeForce GTX 1070 Ti (Desktop)
min:
37 fps, max:
52 fps
fps
100%
GeForce MX230:
30.9 fps
100%
GeForce MX230:
17.4 fps
100%
GeForce MX230:
12.7 fps
100%
GeForce MX230:
10.9 fps
807%
GeForce GTX 1070 Ti (Desktop):
88 [X] i7-7740X Asus X299 Prime Intel Core i7-7740X 4.3GHz
GeForce GTX 1070 Ti (Desktop)
min:
82 fps, max:
94 fps
fps
GeForce GTX 1070 Ti (Desktop):
64 [X] i7-7740X Asus X299 Prime Intel Core i7-7740X 4.3GHz
GeForce GTX 1070 Ti (Desktop)
min:
58 fps, max:
68 fps
fps
GeForce GTX 1070 Ti (Desktop):
35.3 [X] i7-7740X Asus X299 Prime Intel Core i7-7740X 4.3GHz
GeForce GTX 1070 Ti (Desktop)
min:
32 fps, max:
38 fps
fps
100%
GeForce MX230:
69.3 fps
100%
GeForce MX230:
19.8 fps
100%
GeForce MX230:
15.9 fps
100%
GeForce MX230:
13.4 fps
821%
GeForce GTX 1070 Ti (Desktop):
110 [X] i7-7740X Asus X299 Prime Intel Core i7-7740X 4.3GHz
GeForce GTX 1070 Ti (Desktop)
min:
84 fps, max:
125 fps
fps
GeForce GTX 1070 Ti (Desktop):
74 [X] i7-7740X Asus X299 Prime Intel Core i7-7740X 4.3GHz
GeForce GTX 1070 Ti (Desktop)
min:
62 fps, max:
84 fps
fps
GeForce GTX 1070 Ti (Desktop):
35.4 [X] i7-7740X Asus X299 Prime Intel Core i7-7740X 4.3GHz
GeForce GTX 1070 Ti (Desktop)
min:
27 fps, max:
41 fps
fps
100%
GeForce MX230:
38.3 fps
100%
GeForce MX230:
20.2 fps
100%
GeForce MX230:
16 fps
100%
GeForce MX230:
12 fps
925%
GeForce GTX 1070 Ti (Desktop):
111 [X] i7-7740X Asus X299 Prime Intel Core i7-7740X 4.3GHz
GeForce GTX 1070 Ti (Desktop)
min:
90 fps, max:
162 fps
fps
GeForce GTX 1070 Ti (Desktop):
83 [X] i7-7740X Asus X299 Prime Intel Core i7-7740X 4.3GHz
GeForce GTX 1070 Ti (Desktop)
min:
67 fps, max:
124 fps
fps
GeForce GTX 1070 Ti (Desktop):
47.1 [X] i7-7740X Asus X299 Prime Intel Core i7-7740X 4.3GHz
GeForce GTX 1070 Ti (Desktop)
min:
37 fps, max:
72 fps
fps
100%
GeForce MX230:
122.3 fps
100%
GeForce MX230:
48.6 fps
100%
GeForce MX230:
23.8 fps
100%
GeForce MX230:
17.6 fps
100%
GeForce MX230:
29.3 fps
100%
GeForce MX230:
13.4 fps
100%
GeForce MX230:
10.7 fps
100%
GeForce MX230:
9.9 fps
100%
GeForce MX230:
36.8 fps
100%
GeForce MX230:
18.9 fps
100%
GeForce MX230:
13.8 fps
100%
GeForce MX230:
11.7 fps
1026%
GeForce GTX 1070 Ti (Desktop):
120 [X] i7-7740X Asus X299 Prime Intel Core i7-7740X 4.3GHz
GeForce GTX 1070 Ti (Desktop)
min:
94 fps, max:
156 fps
fps
GeForce GTX 1070 Ti (Desktop):
80 [X] i7-7740X Asus X299 Prime Intel Core i7-7740X 4.3GHz
GeForce GTX 1070 Ti (Desktop)
min:
61 fps, max:
105 fps
fps
GeForce GTX 1070 Ti (Desktop):
40.1 [X] i7-7740X Asus X299 Prime Intel Core i7-7740X 4.3GHz
GeForce GTX 1070 Ti (Desktop)
min:
28 fps, max:
53 fps
fps
100%
GeForce MX230:
26 fps
100%
GeForce MX230:
13 fps
100%
GeForce MX230:
10 fps
1050%
GeForce GTX 1070 Ti (Desktop):
63 [X] i7-7740X Asus X299 Prime Intel Core i7-7740X 4.3GHz
GeForce GTX 1070 Ti (Desktop)
min:
35 fps, max:
124 fps
fps
GeForce GTX 1070 Ti (Desktop):
48 [X] i7-7740X Asus X299 Prime Intel Core i7-7740X 4.3GHz
GeForce GTX 1070 Ti (Desktop)
min:
24 fps, max:
81 fps
fps
GeForce GTX 1070 Ti (Desktop):
27 [X] i7-7740X Asus X299 Prime Intel Core i7-7740X 4.3GHz
GeForce GTX 1070 Ti (Desktop)
min:
13 fps, max:
63 fps
fps
100%
GeForce MX230:
46 fps
100%
GeForce MX230:
21 fps
100%
GeForce MX230:
16 fps
100%
GeForce MX230:
12 fps
833%
GeForce GTX 1070 Ti (Desktop):
100 [X] i7-7740X Asus X299 Prime Intel Core i7-7740X 4.3GHz
GeForce GTX 1070 Ti (Desktop)
min:
87 fps, max:
129 fps
fps
GeForce GTX 1070 Ti (Desktop):
81 [X] i7-7740X Asus X299 Prime Intel Core i7-7740X 4.3GHz
GeForce GTX 1070 Ti (Desktop)
min:
73 fps, max:
103 fps
fps
GeForce GTX 1070 Ti (Desktop):
55 [X] i7-7740X Asus X299 Prime Intel Core i7-7740X 4.3GHz
GeForce GTX 1070 Ti (Desktop)
min:
49 fps, max:
68 fps
fps
100%
GeForce MX230:
80.5 fps
100%
GeForce MX230:
58.6 fps
100%
GeForce MX230:
52.6 fps
100%
GeForce MX230:
52.2 fps
511%
GeForce GTX 1070 Ti (Desktop):
267 [X] i7-7740X Asus X299 Prime Intel Core i7-7740X 4.3GHz
GeForce GTX 1070 Ti (Desktop)
min:
248 fps, max:
287 fps
fps
GeForce GTX 1070 Ti (Desktop):
141 [X] i7-7740X Asus X299 Prime Intel Core i7-7740X 4.3GHz
GeForce GTX 1070 Ti (Desktop)
min:
114 fps, max:
165 fps
fps
100%
GeForce MX230:
32 fps
100%
GeForce MX230:
10 fps
100%
GeForce MX230:
7 (!) fps
1200%
GeForce GTX 1070 Ti (Desktop):
84 [X] i7-7740X Asus X299 Prime Intel Core i7-7740X 4.3GHz
GeForce GTX 1070 Ti (Desktop)
min:
67 fps, max:
142 fps
fps
GeForce GTX 1070 Ti (Desktop):
51 [X] i7-7740X Asus X299 Prime Intel Core i7-7740X 4.3GHz
GeForce GTX 1070 Ti (Desktop)
min:
46 fps, max:
87 fps
fps
GeForce GTX 1070 Ti (Desktop):
28 [X] i7-7740X Asus X299 Prime Intel Core i7-7740X 4.3GHz
GeForce GTX 1070 Ti (Desktop)
min:
24 fps, max:
43 fps
fps
100%
GeForce MX230:
48 fps
100%
GeForce MX230:
23 fps
100%
GeForce MX230:
18 fps
100%
GeForce MX230:
12 fps
808%
GeForce GTX 1070 Ti (Desktop):
97 [X] i7-7740X Asus X299 Prime Intel Core i7-7740X 4.3GHz
GeForce GTX 1070 Ti (Desktop)
min:
85 fps, max:
102 fps
fps
GeForce GTX 1070 Ti (Desktop):
78 [X] i7-7740X Asus X299 Prime Intel Core i7-7740X 4.3GHz
GeForce GTX 1070 Ti (Desktop)
min:
70 fps, max:
82 fps
fps
GeForce GTX 1070 Ti (Desktop):
49 [X] i7-7740X Asus X299 Prime Intel Core i7-7740X 4.3GHz
GeForce GTX 1070 Ti (Desktop)
min:
44 fps, max:
51 fps
fps
100%
GeForce MX230:
34.1 fps
100%
GeForce MX230:
12.9 fps
100%
GeForce MX230:
10.9 fps
100%
GeForce MX230:
8.3 fps
940%
GeForce GTX 1070 Ti (Desktop):
78 [X] i7-7740X Asus X299 Prime Intel Core i7-7740X 4.3GHz
GeForce GTX 1070 Ti (Desktop)
min:
64 fps, max:
99 fps
fps
GeForce GTX 1070 Ti (Desktop):
48.5 [X] i7-7740X Asus X299 Prime Intel Core i7-7740X 4.3GHz
GeForce GTX 1070 Ti (Desktop)
min:
41 fps, max:
59 fps
fps
GeForce GTX 1070 Ti (Desktop):
23.8 [X] i7-7740X Asus X299 Prime Intel Core i7-7740X 4.3GHz
GeForce GTX 1070 Ti (Desktop)
min:
21 fps, max:
28 fps
fps
100%
GeForce MX230:
31 fps
435%
GeForce GTX 1070 Ti (Desktop):
135 [X] i7-7740X Asus X299 Prime Intel Core i7-7740X 4.3GHz
GeForce GTX 1070 Ti (Desktop)
min:
111 fps, max:
171 fps
fps
355%
GeForce GTX 1060 Max-Q:
110 [X] Dell G5 15 5587 Intel Core i5-8300H 2.3GHz
GeForce GTX 1060 Max-Q
min:
89 fps, max:
137 fps
fps
100%
GeForce MX230:
15 fps
760%
GeForce GTX 1070 Ti (Desktop):
114 [X] i7-7740X Asus X299 Prime Intel Core i7-7740X 4.3GHz
GeForce GTX 1070 Ti (Desktop)
min:
95 fps, max:
132 fps
fps
467%
GeForce GTX 1060 Max-Q:
70 [X] Dell G5 15 5587 Intel Core i5-8300H 2.3GHz
GeForce GTX 1060 Max-Q
min:
5 fps, max:
84 fps
fps
100%
GeForce MX230:
13 fps
831%
GeForce GTX 1070 Ti (Desktop):
108 [X] i7-7740X Asus X299 Prime Intel Core i7-7740X 4.3GHz
GeForce GTX 1070 Ti (Desktop)
min:
95 fps, max:
122 fps
fps
500%
GeForce GTX 1060 Max-Q:
65 [X] Dell G5 15 5587 Intel Core i5-8300H 2.3GHz
GeForce GTX 1060 Max-Q
min:
58 fps, max:
79 fps
fps
100%
GeForce MX230:
12 fps
850%
GeForce GTX 1070 Ti (Desktop):
102 [X] i7-7740X Asus X299 Prime Intel Core i7-7740X 4.3GHz
GeForce GTX 1070 Ti (Desktop)
min:
79 fps, max:
116 fps
fps
400%
GeForce GTX 1060 Max-Q:
48 [X] Dell G5 15 5587 Intel Core i5-8300H 2.3GHz
GeForce GTX 1060 Max-Q
min:
4 fps, max:
71 fps
fps
GeForce GTX 1070 Ti (Desktop):
75 [X] i7-7740X Asus X299 Prime Intel Core i7-7740X 4.3GHz
GeForce GTX 1070 Ti (Desktop)
min:
67 fps, max:
85 fps
fps
GeForce GTX 1070 Ti (Desktop):
39 [X] i7-7740X Asus X299 Prime Intel Core i7-7740X 4.3GHz
GeForce GTX 1070 Ti (Desktop)
min:
34 fps, max:
45 fps
fps
GeForce GTX 1060 Max-Q:
20 [X] Dell G5 15 5587 Intel Core i5-8300H 2.3GHz
GeForce GTX 1060 Max-Q
min:
17 fps, max:
24 fps
fps
100%
GeForce MX230:
235 fps
100%
GeForce MX230:
54.4 fps
100%
GeForce MX230:
17.9 fps
100%
GeForce MX230:
48.4 fps
209%
GeForce GTX 1070 Ti (Desktop):
101 [X] Intel Core i7-4790K 4GHz
GeForce GTX 1070 Ti (Desktop)
fps
100%
GeForce MX230:
36.3 fps
245%
GeForce GTX 1070 Ti (Desktop):
89 [X] Intel Core i7-4790K 4GHz
GeForce GTX 1070 Ti (Desktop)
fps
100%
GeForce MX230:
32.9 fps
226%
GeForce GTX 1070 Ti (Desktop):
74.5 [X] Intel Core i7-4790K 4GHz
GeForce GTX 1070 Ti (Desktop)
fps
GeForce GTX 1070 Ti (Desktop):
66.7 [X] Intel Core i7-4790K 4GHz
GeForce GTX 1070 Ti (Desktop)
fps
100%
GeForce MX230:
31.5 fps
489%
GeForce GTX 1070 Ti (Desktop):
154 [X] Intel Core i7-4790K 4GHz
GeForce GTX 1070 Ti (Desktop)
min:
101 fps, max:
189 fps
fps
270%
GeForce GTX 1060 Max-Q:
60 110 [X] Dell G5 15 5587 Intel Core i5-8300H 2.3GHz
GeForce GTX 1060 Max-Q
min:
90 fps, max:
131 fps
~ 85 fps
100%
GeForce MX230:
13.8 fps
725%
GeForce GTX 1070 Ti (Desktop):
100 [X] Intel Core i7-4790K 4GHz
GeForce GTX 1070 Ti (Desktop)
min:
77 fps, max:
115 fps
fps
449%
GeForce GTX 1060 Max-Q:
58 66.8 [X] Dell G5 15 5587 Intel Core i5-8300H 2.3GHz
GeForce GTX 1060 Max-Q
min:
55 fps, max:
74 fps
~ 62 fps
100%
GeForce MX230:
11.6 fps
707%
GeForce GTX 1070 Ti (Desktop):
82 [X] Intel Core i7-4790K 4GHz
GeForce GTX 1070 Ti (Desktop)
min:
58 fps, max:
97 fps
fps
466%
GeForce GTX 1060 Max-Q:
52.7 [X] Dell G5 15 5587 Intel Core i5-8300H 2.3GHz
GeForce GTX 1060 Max-Q
min:
45 fps, max:
61 fps
56 ~ 54 fps
844%
GeForce GTX 1070 Ti (Desktop):
59.1 [X] Intel Core i7-4790K 4GHz
GeForce GTX 1070 Ti (Desktop)
min:
44 fps, max:
74 fps
fps
571%
GeForce GTX 1060 Max-Q:
38 [X] Dell G5 15 5587 Intel Core i5-8300H 2.3GHz
GeForce GTX 1060 Max-Q
min:
30 fps, max:
45 fps
41 ~ 40 fps
GeForce GTX 1070 Ti (Desktop):
42.4 [X] Intel Core i7-4790K 4GHz
GeForce GTX 1070 Ti (Desktop)
min:
33 fps, max:
50 fps
fps
GeForce GTX 1070 Ti (Desktop):
22.7 [X] Intel Core i7-4790K 4GHz
GeForce GTX 1070 Ti (Desktop)
min:
18 fps, max:
27 fps
fps
GeForce GTX 1060 Max-Q:
12 [X] Dell G5 15 5587 Intel Core i5-8300H 2.3GHz
GeForce GTX 1060 Max-Q
min:
10 fps, max:
14 fps
fps
100%
GeForce MX230:
26 fps
562%
GeForce GTX 1070 Ti (Desktop):
146 [X] Intel Core i7-4790K 4GHz
GeForce GTX 1070 Ti (Desktop)
min:
93 fps, max:
194 fps
fps
350%
GeForce GTX 1060 Max-Q:
73 109 ~ 91 fps
100%
GeForce MX230:
11.4 fps
763%
GeForce GTX 1070 Ti (Desktop):
87 [X] Intel Core i7-4790K 4GHz
GeForce GTX 1070 Ti (Desktop)
min:
69 fps, max:
110 fps
fps
465%
GeForce GTX 1060 Max-Q:
47.2 59 ~ 53 fps
100%
GeForce MX230:
7.4 fps
851%
GeForce GTX 1070 Ti (Desktop):
63 [X] Intel Core i7-4790K 4GHz
GeForce GTX 1070 Ti (Desktop)
max:
92 fps
fps
514%
GeForce GTX 1060 Max-Q:
33.9 43 ~ 38 fps
GeForce GTX 1070 Ti (Desktop):
27.7 [X] Intel Core i7-4790K 4GHz
GeForce GTX 1070 Ti (Desktop)
max:
42 fps
fps
GeForce GTX 1060 Max-Q:
14.6 fps
100%
GeForce MX230:
84.7 fps
210%
GeForce GTX 1060 Max-Q:
178 [X] Dell G5 15 5587 Intel Core i5-8300H 2.3GHz
GeForce GTX 1060 Max-Q
min:
133 fps, max:
220 fps
fps
100%
GeForce MX230:
33.2 fps
399%
GeForce GTX 1060 Max-Q:
132.6 [X] Dell G5 15 5587 Intel Core i5-8300H 2.3GHz
GeForce GTX 1060 Max-Q
min:
101 fps, max:
157 fps
fps
100%
GeForce MX230:
19.5 fps
593%
GeForce GTX 1060 Max-Q:
115.7 [X] Dell G5 15 5587 Intel Core i5-8300H 2.3GHz
GeForce GTX 1060 Max-Q
min:
101 fps, max:
127 fps
fps
100%
GeForce MX230:
15.6 fps
699%
GeForce GTX 1070 Ti (Desktop):
109 [X] Intel Core i7-4790K 4GHz
GeForce GTX 1070 Ti (Desktop)
min:
78 fps, max:
132 fps
fps
467%
GeForce GTX 1060 Max-Q:
72.8 [X] Dell G5 15 5587 Intel Core i5-8300H 2.3GHz
GeForce GTX 1060 Max-Q
min:
64 fps, max:
79 fps
fps
GeForce GTX 1070 Ti (Desktop):
72 [X] Intel Core i7-4790K 4GHz
GeForce GTX 1070 Ti (Desktop)
min:
61 fps, max:
89 fps
fps
GeForce GTX 1070 Ti (Desktop):
36 [X] Intel Core i7-4790K 4GHz
GeForce GTX 1070 Ti (Desktop)
min:
32 fps, max:
39 fps
fps
GeForce GTX 1060 Max-Q:
135.5 [X] Dell G5 15 5587 Intel Core i5-8300H 2.3GHz
GeForce GTX 1060 Max-Q
min:
97 fps, max:
192 fps
fps
GeForce GTX 1060 Max-Q:
93.4 [X] Dell G5 15 5587 Intel Core i5-8300H 2.3GHz
GeForce GTX 1060 Max-Q
min:
66 fps, max:
107 fps
fps
GeForce GTX 1060 Max-Q:
81.5 [X] Dell G5 15 5587 Intel Core i5-8300H 2.3GHz
GeForce GTX 1060 Max-Q
min:
66 fps, max:
95 fps
fps
GeForce GTX 1070 Ti (Desktop):
117 [X] Intel Core i7-4790K 4GHz
GeForce GTX 1070 Ti (Desktop)
min:
106 fps, max:
130 fps
fps
GeForce GTX 1060 Max-Q:
62.2 [X] Dell G5 15 5587 Intel Core i5-8300H 2.3GHz
GeForce GTX 1060 Max-Q
min:
54 fps, max:
71 fps
fps
GeForce GTX 1070 Ti (Desktop):
77 [X] Intel Core i7-4790K 4GHz
GeForce GTX 1070 Ti (Desktop)
min:
70 fps, max:
85 fps
fps
GeForce GTX 1070 Ti (Desktop):
38 [X] Intel Core i7-4790K 4GHz
GeForce GTX 1070 Ti (Desktop)
min:
34 fps, max:
44 fps
fps
GeForce GTX 1060 Max-Q:
117.9 [X] Dell G5 15 5587 Intel Core i5-8300H 2.3GHz
GeForce GTX 1060 Max-Q
min:
76 fps, max:
169 fps
fps
GeForce GTX 1060 Max-Q:
89.1 [X] Dell G5 15 5587 Intel Core i5-8300H 2.3GHz
GeForce GTX 1060 Max-Q
min:
65 fps, max:
113 fps
fps
GeForce GTX 1060 Max-Q:
78.5 [X] Dell G5 15 5587 Intel Core i5-8300H 2.3GHz
GeForce GTX 1060 Max-Q
min:
53 fps, max:
96 fps
fps
GeForce GTX 1070 Ti (Desktop):
122 [X] Intel Core i7-4790K 4GHz
GeForce GTX 1070 Ti (Desktop)
min:
86 fps, max:
155 fps
fps
GeForce GTX 1060 Max-Q:
66.6 [X] Dell G5 15 5587 Intel Core i5-8300H 2.3GHz
GeForce GTX 1060 Max-Q
min:
42 fps, max:
92 fps
fps
GeForce GTX 1070 Ti (Desktop):
85 [X] Intel Core i7-4790K 4GHz
GeForce GTX 1070 Ti (Desktop)
min:
57 fps, max:
102 fps
fps
GeForce GTX 1070 Ti (Desktop):
45 [X] Intel Core i7-4790K 4GHz
GeForce GTX 1070 Ti (Desktop)
min:
30 fps, max:
52 fps
fps
GeForce GTX 1060 Max-Q:
23.8 [X] Dell G5 15 5587 Intel Core i5-8300H 2.3GHz
GeForce GTX 1060 Max-Q
min:
16 fps, max:
27 fps
fps
GeForce GTX 1060 Max-Q:
174.9 [X] Dell G5 15 5587 Intel Core i5-8300H 2.3GHz
GeForce GTX 1060 Max-Q
min:
118 fps, max:
251 fps
fps
GeForce GTX 1060 Max-Q:
163.3 [X] Dell G5 15 5587 Intel Core i5-8300H 2.3GHz
GeForce GTX 1060 Max-Q
min:
110 fps, max:
227 fps
fps
GeForce GTX 1060 Max-Q:
91.9 [X] Dell G5 15 5587 Intel Core i5-8300H 2.3GHz
GeForce GTX 1060 Max-Q
min:
68 fps, max:
112 fps
fps
GeForce GTX 1060 Max-Q:
70.9 [X] Dell G5 15 5587 Intel Core i5-8300H 2.3GHz
GeForce GTX 1060 Max-Q
min:
53 fps, max:
88 fps
fps
GeForce GTX 1060 Max-Q:
31.3 [X] Dell G5 15 5587 Intel Core i5-8300H 2.3GHz
GeForce GTX 1060 Max-Q
min:
24 fps, max:
38 fps
fps
GeForce GTX 1070 Ti (Desktop):
103 [X] Intel Core i7-4790K 4GHz
GeForce GTX 1070 Ti (Desktop)
min:
60 fps, max:
143 fps
fps
GeForce GTX 1060 Max-Q:
77 fps
GeForce GTX 1070 Ti (Desktop):
92 [X] Intel Core i7-4790K 4GHz
GeForce GTX 1070 Ti (Desktop)
min:
55 fps, max:
133 fps
fps
GeForce GTX 1060 Max-Q:
67 fps
GeForce GTX 1070 Ti (Desktop):
88 [X] Intel Core i7-4790K 4GHz
GeForce GTX 1070 Ti (Desktop)
min:
53 fps, max:
126 fps
fps
GeForce GTX 1060 Max-Q:
62 fps
GeForce GTX 1070 Ti (Desktop):
75 [X] Intel Core i7-4790K 4GHz
GeForce GTX 1070 Ti (Desktop)
min:
30 fps, max:
117 fps
fps
GeForce GTX 1060 Max-Q:
52 fps
GeForce GTX 1070 Ti (Desktop):
58 [X] Intel Core i7-4790K 4GHz
GeForce GTX 1070 Ti (Desktop)
min:
33 fps, max:
104 fps
fps
GeForce GTX 1070 Ti (Desktop):
34 [X] Intel Core i7-4790K 4GHz
GeForce GTX 1070 Ti (Desktop)
min:
24 fps, max:
51 fps
fps
GeForce GTX 1060 Max-Q:
21 fps
100%
GeForce MX230:
44.9 fps
100%
GeForce MX230:
23.9 fps
396%
GeForce GTX 1060 Max-Q:
94.7 fps
100%
GeForce MX230:
22 fps
388%
GeForce GTX 1060 Max-Q:
85.4 fps
100%
GeForce MX230:
17.5 fps
408%
GeForce GTX 1060 Max-Q:
71.4 fps
GeForce GTX 1060 Max-Q:
17.6 fps
GeForce GTX 1060 Max-Q:
108.1 fps
GeForce GTX 1060 Max-Q:
83.5 fps
GeForce GTX 1060 Max-Q:
69.6 fps
GeForce GTX 1060 Max-Q:
57.2 fps
GeForce GTX 1060 Max-Q:
17 fps
100%
GeForce MX230:
50 fps
330%
GeForce GTX 1070 Ti (Desktop):
165 [X] Intel Core i7-4790K 4GHz
GeForce GTX 1070 Ti (Desktop)
min:
76 fps, max:
225 fps
fps
256%
GeForce GTX 1060 Max-Q:
128 fps
100%
GeForce MX230:
18 fps
756%
GeForce GTX 1070 Ti (Desktop):
136 [X] Intel Core i7-4790K 4GHz
GeForce GTX 1070 Ti (Desktop)
min:
66 fps, max:
190 fps
fps
456%
GeForce GTX 1060 Max-Q:
81 82 84 ~ 82 fps
100%
GeForce MX230:
12 fps
908%
GeForce GTX 1070 Ti (Desktop):
109 [X] Intel Core i7-4790K 4GHz
GeForce GTX 1070 Ti (Desktop)
min:
49 fps, max:
169 fps
fps
517%
GeForce GTX 1060 Max-Q:
60 62 65 ~ 62 fps
944%
GeForce GTX 1070 Ti (Desktop):
85 [X] Intel Core i7-4790K 4GHz
GeForce GTX 1070 Ti (Desktop)
min:
43 fps, max:
169 fps
fps
522%
GeForce GTX 1060 Max-Q:
46 46 48 ~ 47 fps
GeForce GTX 1070 Ti (Desktop):
34 [X] Intel Core i7-4790K 4GHz
GeForce GTX 1070 Ti (Desktop)
min:
21 fps, max:
50 fps
fps
GeForce GTX 1060 Max-Q:
17 27 ~ 22 fps
GeForce GTX 1060 Max-Q:
290.6 [X] Dell G5 15 5587 Intel Core i5-8300H 2.3GHz
GeForce GTX 1060 Max-Q
min:
266 fps, max:
334 fps
fps
GeForce GTX 1060 Max-Q:
277.9 [X] Dell G5 15 5587 Intel Core i5-8300H 2.3GHz
GeForce GTX 1060 Max-Q
min:
249 fps, max:
315 fps
fps
GeForce GTX 1060 Max-Q:
252.3 [X] Dell G5 15 5587 Intel Core i5-8300H 2.3GHz
GeForce GTX 1060 Max-Q
min:
217 fps, max:
289 fps
fps
GeForce GTX 1060 Max-Q:
245.7 [X] Dell G5 15 5587 Intel Core i5-8300H 2.3GHz
GeForce GTX 1060 Max-Q
min:
199 fps, max:
279 fps
fps
GeForce GTX 1060 Max-Q:
130 [X] Dell G5 15 5587 Intel Core i5-8300H 2.3GHz
GeForce GTX 1060 Max-Q
min:
113 fps, max:
150 fps
fps
GeForce GTX 1060 Max-Q:
109 fps
GeForce GTX 1060 Max-Q:
48 fps
GeForce GTX 1060 Max-Q:
35.5 fps
GeForce GTX 1070 Ti (Desktop):
47.1 [X] Intel Core i7-4790K 4GHz
GeForce GTX 1070 Ti (Desktop)
min:
44 fps, max:
51 fps
fps
GeForce GTX 1060 Max-Q:
25.6 fps
GeForce GTX 1070 Ti (Desktop):
17.3 [X] Intel Core i7-4790K 4GHz
GeForce GTX 1070 Ti (Desktop)
min:
16 fps, max:
18 fps
fps
GeForce GTX 1060 Max-Q:
8.5 fps
GeForce GTX 1060 Max-Q:
94 fps
GeForce GTX 1060 Max-Q:
77 98 ~ 88 fps
GeForce GTX 1070 Ti (Desktop):
106 [X] Intel Core i7-4790K 4GHz
GeForce GTX 1070 Ti (Desktop)
min:
95 fps, max:
113 fps
fps
GeForce GTX 1060 Max-Q:
56 60 ~ 58 fps
GeForce GTX 1070 Ti (Desktop):
52 [X] Intel Core i7-4790K 4GHz
GeForce GTX 1070 Ti (Desktop)
min:
47 fps, max:
55 fps
fps
GeForce GTX 1060 Max-Q:
26 fps
100%
GeForce MX230:
58.5 fps
243%
GeForce GTX 1060 Max-Q:
141.9 [X] Dell G5 15 5587 Intel Core i5-8300H 2.3GHz
GeForce GTX 1060 Max-Q
min:
126 fps, max:
145 fps
fps
100%
GeForce MX230:
23.8 fps
389%
GeForce GTX 1060 Max-Q:
92.5 [X] Dell G5 15 5587 Intel Core i5-8300H 2.3GHz
GeForce GTX 1060 Max-Q
min:
85 fps, max:
101 fps
fps
100%
GeForce MX230:
21 fps
408%
GeForce GTX 1060 Max-Q:
85.6 [X] Dell G5 15 5587 Intel Core i5-8300H 2.3GHz
GeForce GTX 1060 Max-Q
min:
63 fps, max:
100 fps
fps
100%
GeForce MX230:
17.3 fps
366%
GeForce GTX 1060 Max-Q:
63.3 [X] Dell G5 15 5587 Intel Core i5-8300H 2.3GHz
GeForce GTX 1060 Max-Q
min:
53 fps, max:
69 fps
fps
GeForce GTX 1060 Max-Q:
12.9 [X] Dell G5 15 5587 Intel Core i5-8300H 2.3GHz
GeForce GTX 1060 Max-Q
min:
1 fps, max:
25 fps
fps
100%
GeForce MX230:
96 fps
100%
GeForce MX230:
91.4 fps
100%
GeForce MX230:
68.8 fps
100%
GeForce MX230:
62.9 fps
GeForce GTX 1070 Ti (Desktop):
152 [X] Intel Core i7-4790K 4GHz
GeForce GTX 1070 Ti (Desktop)
min:
130 fps
fps
GeForce GTX 1070 Ti (Desktop):
57.9 [X] Intel Core i7-4790K 4GHz
GeForce GTX 1070 Ti (Desktop)
min:
51 fps, max:
69 fps
fps
GeForce GTX 1060 Max-Q:
28.8 fps
100%
GeForce MX230:
152.6 fps
164%
GeForce GTX 1060 Max-Q:
250 fps
100%
GeForce MX230:
77.7 fps
264%
GeForce GTX 1060 Max-Q:
194 216 ~ 205 fps
100%
GeForce MX230:
72.7 fps
307%
GeForce GTX 1070 Ti (Desktop):
223 [X] Intel Core i7-4790K 4GHz
GeForce GTX 1070 Ti (Desktop)
min:
176 fps, max:
252 fps
fps
199%
GeForce GTX 1060 Max-Q:
134 155 ~ 145 fps
GeForce GTX 1070 Ti (Desktop):
92 [X] Intel Core i7-4790K 4GHz
GeForce GTX 1070 Ti (Desktop)
min:
76 fps, max:
133 fps
fps
GeForce GTX 1060 Max-Q:
56.5 fps
100%
GeForce MX230:
90.9 fps
100%
GeForce MX230:
34.7 fps
349%
GeForce GTX 1060 Max-Q:
116 126 ~ 121 fps
100%
GeForce MX230:
25.3 fps
415%
GeForce GTX 1060 Max-Q:
92.9 101 120 ~ 105 fps
100%
GeForce MX230:
21.3 fps
100%
GeForce MX230:
35.5 fps
100%
GeForce MX230:
15.2 fps
428%
GeForce GTX 1060 Max-Q:
65 fps
100%
GeForce MX230:
13 fps
452%
GeForce GTX 1060 Max-Q:
58.7 fps
100%
GeForce MX230:
3.5 fps
1549%
GeForce GTX 1070 Ti (Desktop):
54.2 [X] Intel Core i7-4790K 4GHz
GeForce GTX 1070 Ti (Desktop)
min:
47 fps, max:
62 fps
fps
949%
GeForce GTX 1060 Max-Q:
33.2 fps
GeForce GTX 1070 Ti (Desktop):
35.8 [X] Intel Core i7-4790K 4GHz
GeForce GTX 1070 Ti (Desktop)
min:
27 fps, max:
40 fps
fps
GeForce GTX 1060 Max-Q:
19.4 fps
100%
GeForce MX230:
63 fps
100%
GeForce MX230:
21 fps
440%
GeForce GTX 1060 Max-Q:
92.3 fps
100%
GeForce MX230:
18.7 fps
834%
GeForce GTX 1070 Ti (Desktop):
156 [X] Intel Core i7-4790K 4GHz
GeForce GTX 1070 Ti (Desktop)
min:
92 fps, max:
189 fps
fps
470%
GeForce GTX 1060 Max-Q:
87.8 fps
100%
GeForce MX230:
15 fps
813%
GeForce GTX 1070 Ti (Desktop):
122 [X] Intel Core i7-4790K 4GHz
GeForce GTX 1070 Ti (Desktop)
min:
75 fps, max:
163 fps
fps
426%
GeForce GTX 1060 Max-Q:
63.9 fps
GeForce GTX 1070 Ti (Desktop):
47.9 [X] Intel Core i7-4790K 4GHz
GeForce GTX 1070 Ti (Desktop)
min:
39 fps, max:
60 fps
fps
GeForce GTX 1060 Max-Q:
25.7 fps
GeForce GTX 1060 Max-Q:
169 fps
GeForce GTX 1060 Max-Q:
93 fps
GeForce GTX 1060 Max-Q:
76.1 fps
GeForce GTX 1060 Max-Q:
25.1 fps
GeForce GTX 1060 Max-Q:
101 fps
GeForce GTX 1060 Max-Q:
56.8 fps
GeForce GTX 1060 Max-Q:
39.4 fps
GeForce GTX 1060 Max-Q:
18.9 fps
GeForce GTX 1060 Max-Q:
85.4 fps
GeForce GTX 1060 Max-Q:
64.7 fps
GeForce GTX 1060 Max-Q:
54.8 fps
GeForce GTX 1060 Max-Q:
23.7 fps
GeForce GTX 1060 Max-Q:
124 fps
GeForce GTX 1060 Max-Q:
91.6 fps
GeForce GTX 1060 Max-Q:
81.7 fps
GeForce GTX 1070 Ti (Desktop):
67.8 [X] Intel Core i7-4790K 4GHz
GeForce GTX 1070 Ti (Desktop)
min:
51 fps, max:
97 fps
fps
GeForce GTX 1060 Max-Q:
34.6 fps
GeForce GTX 1060 Max-Q:
144 fps
GeForce GTX 1060 Max-Q:
79 fps
GeForce GTX 1060 Max-Q:
67.3 fps
GeForce GTX 1060 Max-Q:
24.8 fps
GeForce GTX 1070 Ti (Desktop):
80 [X] Intel Core i7-4790K 4GHz
GeForce GTX 1070 Ti (Desktop)
min:
79 fps, max:
81 fps
fps
GeForce GTX 1060 Max-Q:
154 fps
GeForce GTX 1060 Max-Q:
76 fps
GeForce GTX 1060 Max-Q:
67.8 fps
GeForce GTX 1060 Max-Q:
25.3 fps
100%
GeForce MX230:
86 fps
100%
GeForce MX230:
45.6 fps
100%
GeForce MX230:
14.7 fps
100%
GeForce MX230:
10.6 fps
1019%
GeForce GTX 1070 Ti (Desktop):
108 [X] Intel Core i7-4790K 4GHz
GeForce GTX 1070 Ti (Desktop)
min:
86 fps, max:
184 fps
fps
GeForce GTX 1070 Ti (Desktop):
91 [X] Intel Core i7-4790K 4GHz
GeForce GTX 1070 Ti (Desktop)
min:
70 fps, max:
133 fps
fps
GeForce GTX 1060 Max-Q:
55.7 [X] Lenovo Legion Y520-15IKBM 80YY001APB Intel Core i5-7300HQ 2.5GHz
GeForce GTX 1060 Max-Q
fps
GeForce GTX 1060 Max-Q:
36.2 40.7 [X] Lenovo Legion Y520-15IKBM 80YY001APB Intel Core i5-7300HQ 2.5GHz
GeForce GTX 1060 Max-Q
~ 38 fps
GeForce GTX 1060 Max-Q:
330 fps
GeForce GTX 1060 Max-Q:
250 fps
GeForce GTX 1060 Max-Q:
248 fps
GeForce GTX 1060 Max-Q:
95.2 fps
GeForce GTX 1060 Max-Q:
110.3 fps
GeForce GTX 1060 Max-Q:
93 93.8 ~ 93 fps
GeForce GTX 1060 Max-Q:
50.2 52 ~ 51 fps
GeForce GTX 1070 Ti (Desktop):
67.9 [X] DX11
Intel Core i7-4790K 4GHz
GeForce GTX 1070 Ti (Desktop)
min:
53 fps, max:
87 fps
fps
GeForce GTX 1060 Max-Q:
26.7 27.6 ~ 27 fps
GeForce GTX 1070 Ti (Desktop):
31.9 [X] DX11
Intel Core i7-4790K 4GHz
GeForce GTX 1070 Ti (Desktop)
min:
27 fps, max:
38 fps
fps
GeForce GTX 1060 Max-Q:
15.8 16.3 ~ 16 fps
GeForce GTX 1060 Max-Q:
130 fps
GeForce GTX 1060 Max-Q:
66.4 fps
GeForce GTX 1060 Max-Q:
59.6 fps
GeForce GTX 1060 Max-Q:
20.5 fps
100%
GeForce MX230:
90 101 ~ 96 fps
312%
GeForce GTX 1060 Max-Q:
299.2 fps
100%
GeForce MX230:
78.3 83 ~ 81 fps
329%
GeForce GTX 1060 Max-Q:
266.2 fps
434%
GeForce GTX 1060 Max-Q:
165 165.8 ~ 165 fps
100%
GeForce MX230:
16.6 23 ~ 20 fps
910%
GeForce GTX 1070 Ti (Desktop):
182 [X] Intel Core i7-4790K 4GHz
GeForce GTX 1070 Ti (Desktop)
min:
149 fps, max:
213 fps
fps
GeForce GTX 1070 Ti (Desktop):
88.7 [X] Intel Core i7-4790K 4GHz
GeForce GTX 1070 Ti (Desktop)
min:
77 fps, max:
103 fps
fps
GeForce GTX 1060 Max-Q:
50.3 fps
100%
GeForce MX230:
56.4 fps
100%
GeForce MX230:
45.9 fps
277%
GeForce GTX 1060 Max-Q:
127 fps
100%
GeForce MX230:
19.3 fps
472%
GeForce GTX 1060 Max-Q:
91.1 fps
100%
GeForce MX230:
15.6 fps
553%
GeForce GTX 1060 Max-Q:
86.2 fps
GeForce GTX 1060 Max-Q:
28.4 fps
100%
GeForce MX230:
18.4 fps
412%
GeForce GTX 1060 Max-Q:
75.8 fps
100%
GeForce MX230:
10.6 fps
575%
GeForce GTX 1060 Max-Q:
59.8 62.2 ~ 61 fps
589%
GeForce GTX 1060 Max-Q:
52.9 53.2 ~ 53 fps
GeForce GTX 1060 Max-Q:
20.8 21 ~ 21 fps
GeForce GTX 1060 Max-Q:
127 fps
GeForce GTX 1060 Max-Q:
61.9 fps
GeForce GTX 1070 Ti (Desktop):
94.6 [X] Intel Core i7-4790K 4GHz
GeForce GTX 1070 Ti (Desktop)
min:
53 fps, max:
133 fps
fps
GeForce GTX 1060 Max-Q:
48.8 fps
GeForce GTX 1070 Ti (Desktop):
45.6 [X] Intel Core i7-4790K 4GHz
GeForce GTX 1070 Ti (Desktop)
min:
21 fps, max:
59 fps
fps
GeForce GTX 1060 Max-Q:
22.1 fps
GeForce GTX 1060 Max-Q:
81 fps
GeForce GTX 1060 Max-Q:
71 fps
GeForce GTX 1070 Ti (Desktop):
98 [X] Intel Core i7-4790K 4GHz
GeForce GTX 1070 Ti (Desktop)
min:
80 fps, max:
113 fps
fps
GeForce GTX 1060 Max-Q:
53 fps
GeForce GTX 1070 Ti (Desktop):
41 [X] Intel Core i7-4790K 4GHz
GeForce GTX 1070 Ti (Desktop)
min:
39 fps, max:
45 fps
fps
GeForce GTX 1060 Max-Q:
22 fps
GeForce GTX 1070 Ti (Desktop):
111 [X] DX11
Intel Core i7-4790K 4GHz
GeForce GTX 1070 Ti (Desktop)
min:
101 fps, max:
119 fps
fps
GeForce GTX 1070 Ti (Desktop):
46.5 [X] DX11
Intel Core i7-4790K 4GHz
GeForce GTX 1070 Ti (Desktop)
min:
41 fps, max:
52 fps
fps
100%
GeForce MX230:
85.9 fps
100%
GeForce MX230:
61.9 fps
362%
GeForce GTX 1060 Max-Q:
224 fps
100%
GeForce MX230:
32.2 fps
391%
GeForce GTX 1060 Max-Q:
126 fps
100%
GeForce MX230:
22.5 fps
787%
GeForce GTX 1070 Ti (Desktop):
177 [X] Intel Core i7-4790K 4GHz
GeForce GTX 1070 Ti (Desktop)
min:
106 fps, max:
305 fps
fps
453%
GeForce GTX 1060 Max-Q:
102 fps
GeForce GTX 1070 Ti (Desktop):
77 [X] Intel Core i7-4790K 4GHz
GeForce GTX 1070 Ti (Desktop)
min:
54 fps, max:
113 fps
fps
GeForce GTX 1060 Max-Q:
37.3 fps
GeForce GTX 1060 Max-Q:
188 fps
GeForce GTX 1060 Max-Q:
93 fps
GeForce GTX 1060 Max-Q:
80.9 fps
GeForce GTX 1060 Max-Q:
29.3 fps
GeForce GTX 1060 Max-Q:
82.6 fps
GeForce GTX 1060 Max-Q:
65.8 fps
GeForce GTX 1060 Max-Q:
29.4 fps
GeForce GTX 1060 Max-Q:
22.2 fps
GeForce GTX 1060 Max-Q:
73.9 78.4 ~ 76 fps
GeForce GTX 1060 Max-Q:
61.3 64.6 ~ 63 fps
GeForce GTX 1060 Max-Q:
25.8 fps
100%
GeForce MX230:
101.2 fps
100%
GeForce MX230:
84.1 fps
100%
GeForce MX230:
52.8 fps
100%
GeForce MX230:
33.2 fps
GeForce GTX 1060 Max-Q:
60 fps
GeForce GTX 1060 Max-Q:
60 60 ~ 60 fps
GeForce GTX 1060 Max-Q:
42 fps
100%
GeForce MX230:
126.7 fps
113%
GeForce GTX 1070 Ti (Desktop):
142.7 [X] Intel Core i7-4790K 4GHz
GeForce GTX 1070 Ti (Desktop)
min:
125.8 fps
fps
100%
GeForce MX230:
113 fps
119%
GeForce GTX 1070 Ti (Desktop):
134.2 [X] Intel Core i7-4790K 4GHz
GeForce GTX 1070 Ti (Desktop)
min:
115.5 fps
fps
100%
GeForce MX230:
58 fps
218%
GeForce GTX 1070 Ti (Desktop):
126.6 [X] Intel Core i7-4790K 4GHz
GeForce GTX 1070 Ti (Desktop)
min:
111.1 fps
fps
100%
GeForce MX230:
43.2 fps
281%
GeForce GTX 1070 Ti (Desktop):
121.2 [X] Intel Core i7-4790K 4GHz
GeForce GTX 1070 Ti (Desktop)
min:
105.8 fps
fps
GeForce GTX 1070 Ti (Desktop):
105 [X] Intel Core i7-4790K 4GHz
GeForce GTX 1070 Ti (Desktop)
min:
95 fps
fps
100%
GeForce MX230:
44 fps
100%
GeForce MX230:
38 fps
339%
GeForce GTX 1060 Max-Q:
129 129 ~ 129 fps
100%
GeForce MX230:
16 fps
481%
GeForce GTX 1060 Max-Q:
72 [X] Lenovo Legion Y520-15IKBM 80YY001APB Intel Core i5-7300HQ 2.5GHz
GeForce GTX 1060 Max-Q
74 81 81 ~ 77 fps
100%
GeForce MX230:
11 fps
464%
GeForce GTX 1060 Max-Q:
48 [X] Lenovo Legion Y520-15IKBM 80YY001APB Intel Core i5-7300HQ 2.5GHz
GeForce GTX 1060 Max-Q
49 53 54 ~ 51 fps
GeForce GTX 1060 Max-Q:
26 26 ~ 26 fps
623%
GeForce GTX 1070 Ti (Desktop):
293 [X] Intel Core i7-4790K 4GHz
GeForce GTX 1070 Ti (Desktop)
min:
269 fps, max:
321 fps
fps
100%
GeForce MX230:
7.7 9.9 ~ 9 fps
798%
GeForce GTX 1070 Ti (Desktop):
71.8 [X] Intel Core i7-4790K 4GHz
GeForce GTX 1070 Ti (Desktop)
min:
61 fps, max:
80 fps
fps
400%
GeForce GTX 1060 Max-Q:
34.6 34.9 [X] Dell G5 15 5587 Intel Core i5-8300H 2.3GHz
GeForce GTX 1060 Max-Q
min:
29 fps, max:
39 fps
35 35.1 [X] Lenovo Legion Y520-15IKBM 80YY001APB Intel Core i5-7300HQ 2.5GHz
GeForce GTX 1060 Max-Q
35.2 36.8 37 37 38.5 ~ 36 fps
GeForce GTX 1070 Ti (Desktop):
47.1 [X] Intel Core i7-4790K 4GHz
GeForce GTX 1070 Ti (Desktop)
min:
42 fps, max:
51 fps
fps
100%
GeForce MX230:
71.5 fps
219%
GeForce GTX 1060 Max-Q:
156.8 fps
100%
GeForce MX230:
64.5 fps
235%
GeForce GTX 1060 Max-Q:
151.6 fps
100%
GeForce MX230:
26.9 fps
396%
GeForce GTX 1060 Max-Q:
106.5 fps
100%
GeForce MX230:
10.6 fps
583%
GeForce GTX 1060 Max-Q:
61.8 fps
GeForce GTX 1070 Ti (Desktop):
67 [X] i7-7740X Asus X299 Prime Intel Core i7-7740X 4.3GHz
GeForce GTX 1070 Ti (Desktop)
min:
11.7 fps, P1:
27 fps, max:
202 fps
fps
GeForce GTX 1060 Max-Q:
53.7 fps
GeForce GTX 1060 Max-Q:
170.2 fps
GeForce GTX 1060 Max-Q:
139.9 fps
GeForce GTX 1060 Max-Q:
96.7 fps
GeForce GTX 1060 Max-Q:
76.9 fps
100%
GeForce MX230:
171.9 fps
100%
GeForce MX230:
110 fps
100%
GeForce MX230:
60.5 fps
100%
GeForce MX230:
48.7 fps
100%
GeForce MX230:
58.7 fps
200%
GeForce GTX 1060 Max-Q:
117.2 fps
100%
GeForce MX230:
39.4 fps
284%
GeForce GTX 1060 Max-Q:
112 fps
100%
GeForce MX230:
35.6 fps
302%
GeForce GTX 1060 Max-Q:
107.6 fps
100%
GeForce MX230:
18.3 fps
361%
GeForce GTX 1060 Max-Q:
60.2 [X] Lenovo Legion Y520-15IKBM 80YY001APB Intel Core i5-7300HQ 2.5GHz
GeForce GTX 1060 Max-Q
64.6 69 70.4 ~ 66 fps
GeForce GTX 1060 Max-Q:
53.7 [X] Lenovo Legion Y520-15IKBM 80YY001APB Intel Core i5-7300HQ 2.5GHz
GeForce GTX 1060 Max-Q
fps
GeForce GTX 1060 Max-Q:
68.9 fps
GeForce GTX 1060 Max-Q:
65.7 fps
GeForce GTX 1060 Max-Q:
63.4 fps
GeForce GTX 1060 Max-Q:
40 fps
GeForce GTX 1060 Max-Q:
210.8 fps
GeForce GTX 1060 Max-Q:
152.8 fps
GeForce GTX 1060 Max-Q:
143.3 fps
GeForce GTX 1060 Max-Q:
116.7 fps
GeForce GTX 1060 Max-Q:
64.3 74 ~ 69 fps
273%
GeForce GTX 1060 Max-Q:
159.5 [X] Lenovo Legion Y520-15IKBM 80YY001APB Intel Core i5-7300HQ 2.5GHz
GeForce GTX 1060 Max-Q
180.1 211.6 213.3 213.4 215 ~ 199 fps
455%
GeForce GTX 1070 Ti (Desktop):
132 [X] Intel Core i7-4790K 4GHz
GeForce GTX 1070 Ti (Desktop)
min:
58 fps, max:
235 fps
fps
100%
GeForce MX230:
150.8 fps
205%
GeForce GTX 1060 Max-Q:
308.4 fps
100%
GeForce MX230:
74.4 fps
373%
GeForce GTX 1060 Max-Q:
277.7 fps
100%
GeForce MX230:
55.4 fps
308%
GeForce GTX 1060 Max-Q:
170.5 fps
100%
GeForce MX230:
26.1 fps
443%
GeForce GTX 1060 Max-Q:
115.6 fps
GeForce GTX 1060 Max-Q:
105.8 fps
GeForce GTX 1060 Max-Q:
101 fps
GeForce GTX 1060 Max-Q:
88.7 fps
GeForce GTX 1060 Max-Q:
70 fps
GeForce GTX 1060 Max-Q:
45.7 fps
100%
GeForce MX230:
178.1 fps
100%
GeForce MX230:
127.1 fps
100%
GeForce MX230:
90.7 fps
100%
GeForce MX230:
64.9 fps
GeForce GTX 1060 Max-Q:
218.4 fps
GeForce GTX 1060 Max-Q:
192.7 fps
GeForce GTX 1060 Max-Q:
164.7 fps
GeForce GTX 1060 Max-Q:
69.5 fps
100%
GeForce MX230:
142.6 fps
100%
GeForce MX230:
114.2 fps
100%
GeForce MX230:
96.1 fps
100%
GeForce MX230:
52.6 fps
GeForce GTX 1060 Max-Q:
140.1 fps
GeForce GTX 1060 Max-Q:
126.3 fps
GeForce GTX 1060 Max-Q:
112.2 fps
GeForce GTX 1060 Max-Q:
64.5 fps
100%
GeForce MX230:
234.3 fps
100%
GeForce MX230:
111.7 fps
100%
GeForce MX230:
85.9 fps
100%
GeForce MX230:
41.4 fps
Average Gaming NVIDIA GeForce MX230 → 100% Average Gaming 30-70 fps → 100%
Average Gaming NVIDIA GeForce GTX 1070 Ti (Desktop) → 775% Average Gaming 30-70 fps → 1289%
Average Gaming NVIDIA GeForce GTX 1060 Max-Q → 398% Average Gaming 30-70 fps → 496%
 Deutsch
 English
 Español
 Français
 Italiano
 Nederlands
 Polski
 Português
 Русский
 Türkçe
 Svenska
 Chinese
 Magyar