Intel Core i7-3960X vs Intel Core i5-8250U
Intel Core i7-3960X ► remove from comparison
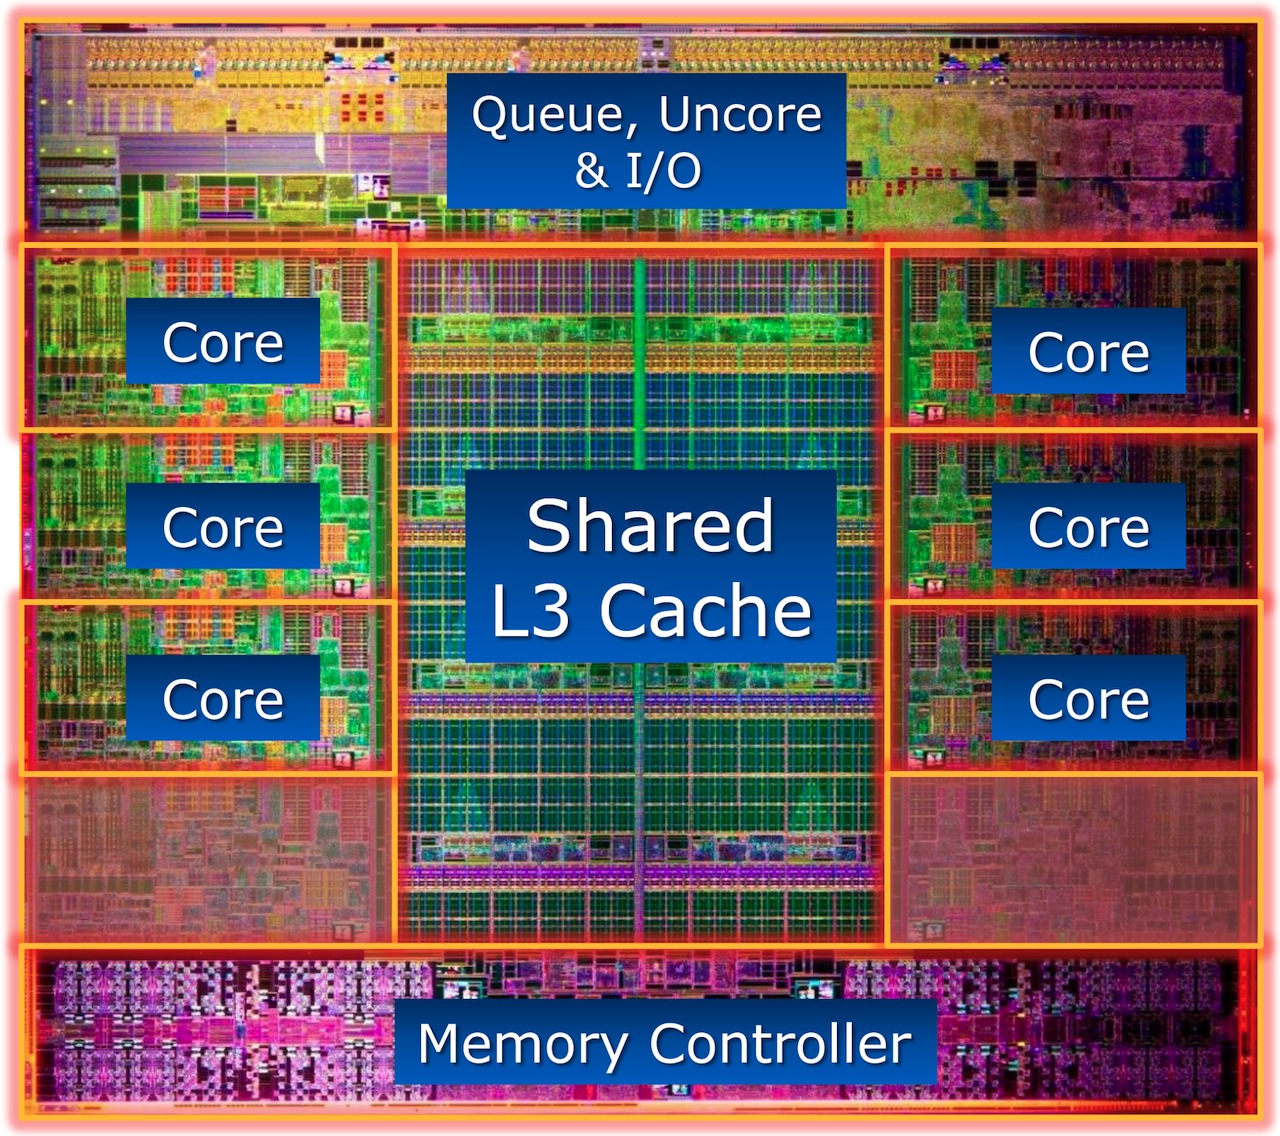
The Intel Core i7-3960X is a high-end desktop processor of the Sandy-Bridge-E series with 6 processor cores and 15 MB level 3 cache. It offers no integrated graphics card and the TDP of 130 Watt suites the CPU only for large desktops. The integrated quad-channel DDR3-1600 memory controller supports up to 64 GB RAM.
Thanks to the six cores, the performance in theoretical benchmarks is clearly above the fastest Ivy-Bridge and Haswell quad cores. However, in applications and games that wont use all six cores, these consumer CPUs are usually faster.
The first C1 stepping of the CPU had no support for VT-d virtualization, later edition do however.
Intel Core i5-8250U ► remove from comparison
The Intel Core i5-8250U is a power efficient quad-core SoC for notebooks and Ultrabooks based on the Kaby Lake Refresh generation and was announced in August 2017. Contrary to its direct predecessor the Core i5-7200U , which were still dual-cores, the i7-8250U is equipped with four cores but at a lower base frequency of 1.6 GHz. The Turbo Boost can go up to 3,4 GHz and therefore also offer good short term single core speeds. The GPU is now named Intel UHD Graphics 620 but otherwise identical to the Intel HD Graphics 620. The integrated memory controller supports DDR4-2400 / LPDDR3-2133 and dual channel memory.
Architecture
Intel basically uses the same micro architecture compared to Skylake, so the per-MHz performance does not differ. The manufacturer only reworked the Speed Shift technology for faster dynamic adjustments of voltages and clocks, and the improved 14nm process allows much higher frequencies combined with better efficiency than before.
Performance
According to Intel, the new quad core models are up to 40% faster than their dual core predecessors. Due to the reduced TDP and the same 14nm+ process, the long term performance and throttling behavior will be interesting and depending on the laptop design. Therefore, the older 35 Watt quad-core models should be faster in applications that demand longer CPU loads.
Graphics
The integrated Intel UHD Graphics 620 (Intel Gen 9.5) is untouched from the 8th Gen Kaby Lake chips. With fast dual-channel memory it can reach the performance of a dedicated GeForce 920M .
Contrary to Skylake, Kaby lake now also supports H.265/HEVC Main 10 with a 10-bit color depth as well as Google's VP9 codec. The dual-core Kaby Lake processors announced in January should also support HDCP 2.2.
Power Consumption
The chip is manufactured in an improved 14nm process with FinFET transistors (14nm+), the same as the 7th Gen Kaby Lake processors. Intel still specifies the TDP with 15 Watts, which is typical for ULV chips. Depending on the usage scenario, the TDP can vary between 7.5 (cTDP Down) and 25 Watts.
Model Intel Core i7-3960X Intel Core i5-8250U Series Intel Core i7 (Desktop) Intel Kaby Lake Refresh Codename Sandy Bridge-E Kaby Lake Refresh Clock 3300 - 3900 MHz 1600 - 3400 MHz L1 Cache 384 KB 256 KB L2 Cache 1.5 MB 1 MB L3 Cache 15 MB 6 MB Cores / Threads 6 / 12 4 / 8 TDP 130 Watt 15 Watt Transistors 2270 Million Technology 32 nm, 0.6-1.35 14 nm Die Size 435 mm2 Socket FCLGA2011 BGA1356 Features Quad-Channel DDR3 Memory Controller, Hyper-Threading, AES, Enhanced Speedstep, SSE1-4.2 Dual-Channel DDR4 Memory Controller, HyperThreading, AVX, AVX2, Quick Sync, Virtualization, AES-NI Architecture x86 x86 $999 U.S. $297 U.S. Announced Manufacturer ark.intel.com Series: Kaby Lake Refresh Kaby Lake Refresh iGPU Intel UHD Graphics 620 (300 - 1100 MHz)
Benchmarks Performance Rating - CB R15 + R20 + 7-Zip + X265 + Blender + 3DM11 CPU - i5-8250U
26.2 pt (36%)
...
...
Cinebench R23 - Cinebench R23 Multi Core
min: 3022 avg: 3108 median: 3108 (3%) max: 3194 Points
CPU TDP ? TDP 29 W 100% 95%
Cinebench R23 - Cinebench R23 Single Core
min: 840 avg: 874 median: 873.5 (37%) max: 907 Points
CPU TDP ? TDP 29 W 93% 100%
Cinebench R20 - Cinebench R20 CPU (Single Core)
min: 332 avg: 349.2 median: 353 (39%) max: 355 Points
CPU TDP ? TDP 15 W TDP 29 W 97% 100% 99%
Cinebench R20 - Cinebench R20 CPU (Multi Core)
min: 846 avg: 1148 median: 1171 (3%) max: 1325 Points
CPU TDP ? TDP 15 W TDP 29 W 85% 100% 91%
Cinebench R15 - Cinebench R15 CPU Multi 64 Bit
1158 Points (7%)
Model CPU GPU RAM Value 3960X 1158
min: 320 avg: 570 median: 562 (4%) max: 730 Points
CPU TDP ? TDP 15 W TDP 29 W 100% 95% 81%
Cinebench R15 - Cinebench R15 CPU Single 64 Bit
159 Points (48%)
Model CPU GPU RAM Value 3960X 159
min: 81 avg: 141.1 median: 143 (43%) max: 147 Points
CPU TDP ? TDP 15 W TDP 29 W 100% 100% 100%
Cinebench R11.5 - Cinebench R11.5 CPU Multi 64 Bit
min: 10.5 avg: 10.7 median: 10.5 (14%) max: 11.35 Points
min: 3.15 avg: 6 median: 5.9 (8%) max: 7.76 Points
Cinebench R11.5 - Cinebench R11.5 CPU Single 64 Bit
min: 1.46 avg: 1.5 median: 1.5 (38%) max: 1.57 Points
min: 0.91 avg: 1.6 median: 1.6 (41%) max: 1.79 Points
Cinebench R10 - Cinebench R10 Rend. Single (32bit)
min: 4995 avg: 5014 median: 5013.5 (30%) max: 5032 Points
min: 5349 avg: 5631 median: 5533 (33%) max: 8356 Points
Cinebench R10 - Cinebench R10 Rend. Multi (32bit)
min: 27087 avg: 27190 median: 27189.5 (20%) max: 27292 Points
min: 14148 avg: 18261 median: 17987 (13%) max: 22097 Points
Cinebench R10 - Cinebench R10 Rend. Multi (64bit)
min: 32120 avg: 32404 median: 32328 (22%) max: 32763 Points
min: 11245 avg: 23585 median: 23873 (17%) max: 28932 Points
Cinebench R10 - Cinebench R10 Rend. Single (64bit)
min: 5868 avg: 6121 median: 6190 (8%) max: 6305 Points
min: 5163 avg: 6972 median: 7174 (9%) max: 8153 Points
wPrime 2.10 - wPrime 2.0 1024m *
min: 146.5 avg: 152.8 median: 152.8 (2%) max: 159.1 s
min: 243.3 avg: 308.6 median: 306.2 (4%) max: 402.1 s
wPrime 2.10 - wPrime 2.0 32m *
min: 4.88 avg: 5.1 median: 5.1 (1%) max: 5.351 s
min: 7.394 avg: 8.9 median: 8.1 (2%) max: 13.75 s
wPrime 1.55 - wPrime 1.55 1024m *
143 s (1%)
wPrime 1.55 - wPrime 1.55 32m *
4.9 s (3%)
min: 4198 avg: 4205 median: 4204.5 (7%) max: 4211 Points
min: 3632 avg: 3991 median: 3991 (6%) max: 4350 Points
7-Zip 18.03 - 7-Zip 18.03 Multli Thread 4 runs
min: 11546 avg: 15262 median: 15365.5 (9%) max: 17405 MIPS
CPU TDP ? TDP 15 W TDP 29 W 87% 100% 93%
7-Zip 18.03 - 7-Zip 18.03 Single Thread 4 runs
min: 3641 avg: 3726 median: 3706 (44%) max: 3925 MIPS
CPU TDP ? TDP 15 W TDP 29 W 100% 98% 97%
X264 HD Benchmark 4.0 - x264 Pass 2
min: 54.1 avg: 54.6 median: 54.8 (19%) max: 54.8 fps
min: 29.5 avg: 32.8 median: 32 (11%) max: 37.7 fps
X264 HD Benchmark 4.0 - x264 Pass 1
min: 171 avg: 172.6 median: 173 (40%) max: 173.9 fps
min: 124.6 avg: 139.3 median: 137.5 (32%) max: 157.6 fps
HWBOT x265 Benchmark v2.2 - HWBOT x265 4k Preset
min: 3.02 avg: 4.2 median: 4.3 (8%) max: 4.78 fps
CPU TDP ? TDP 15 W TDP 29 W 92% 100% 94%
TrueCrypt - TrueCrypt Serpent
min: 0.481 avg: 0.5 median: 0.5 (0%) max: 0.488 GB/s
min: 0.336 avg: 0.4 median: 0.4 (0%) max: 0.415 GB/s
TrueCrypt - TrueCrypt Twofish
min: 0.819 avg: 0.9 median: 0.9 (15%) max: 0.868 GB/s
min: 0.58 avg: 0.6 median: 0.7 (12%) max: 0.714 GB/s
TrueCrypt - TrueCrypt AES
5.2 GB/s (14%)
min: 2.9 avg: 3.5 median: 3.5 (9%) max: 4 GB/s
Blender - Blender 2.79 BMW27 CPU *
min: 813 avg: 948 median: 899.5 (6%) max: 1209 Seconds
CPU TDP ? TDP 15 W TDP 29 W 100% 101% 101%
R Benchmark 2.5 - R Benchmark 2.5 *
min: 0.818 avg: 0.8 median: 0.8 (18%) max: 0.843 sec
CPU TDP ? TDP 15 W TDP 29 W 100% 100% 100%
3DMark 06 - CPU - 3DMark 06 - CPU
min: 8294 avg: 8362 median: 8330 (18%) max: 8463 Points
min: 4775 avg: 6370 median: 6348 (14%) max: 7575 Points
Super Pi mod 1.5 XS 1M - Super Pi mod 1.5 XS 1M *
min: 9.69 avg: 9.8 median: 9.7 (2%) max: 10 s
min: 10.9 avg: 11.7 median: 11.1 (2%) max: 15.77 s
Super Pi mod 1.5 XS 2M - Super Pi mod 1.5 XS 2M *
min: 21.7 avg: 21.8 median: 21.8 (1%) max: 22 s
min: 24.9 avg: 26.3 median: 25.2 (1%) max: 34.28 s
Super Pi Mod 1.5 XS 32M - Super Pi mod 1.5 XS 32M *
min: 541 avg: 552 median: 542 (2%) max: 574 s
min: 601 avg: 631 median: 613 (3%) max: 783 s
SiSoft Sandra Dhrystone (MIPS) - SiSoft Sandra Dhrystone (MIPS)
min: 164000 avg: 193900 median: 207000 (98%) max: 210700 MIPS
SiSoft Sandra Whetstone (MFLOPS) - SiSoft Sandra Whetstone (MFLOPS)
min: 128590 avg: 129540 median: 129690 (100%) max: 130340 MFLOPS
Windows 7 Experience Index - Win7 CPU
7.8 Points (100%)
3DMark Vantage - 3DM Vant. Perf. CPU no Physx
min: 36298 avg: 36650 median: 36668 (32%) max: 36985 Points
min: 15198 avg: 20933 median: 21899 (19%) max: 24736 Points
3DMark 11 - 3DM11 Performance Physics
min: 12028 avg: 12052 median: 12052 (33%) max: 12076 Points
min: 3233 avg: 6318 median: 6276 (17%) max: 8014 Points
CPU TDP ? TDP 15 W 100% 97%
3DMark - 3DMark Ice Storm Physics
62187 Points (51%)
min: 24077 avg: 44593 median: 45968.5 (37%) max: 50962 Points
3DMark - 3DMark Ice Storm Extreme Physics
61764 Points (50%)
min: 24155 avg: 44127 median: 45251 (37%) max: 50910 Points
3DMark - 3DMark Ice Storm Unlimited Physics
63470 Points (53%)
min: 34294 avg: 49389 median: 50347.5 (42%) max: 52066 Points
CPU TDP ? TDP 15 W 100% 93%
3DMark - 3DMark Cloud Gate Physics
9839 Points (25%)
min: 3002 avg: 5863 median: 5774 (15%) max: 7695 Points
CPU TDP ? TDP 15 W 100% 100%
3DMark - 3DMark Fire Strike Standard Physics
14908 Points (27%)
min: 4495 avg: 8511 median: 8453 (15%) max: 10727 Points
CPU TDP ? TDP 15 W 99% 100%
3DMark - 3DMark Time Spy CPU
min: 1956 avg: 2709 median: 2663 (11%) max: 3723 Points
Geekbench 5.5 - Geekbench 5.1 - 5.4 64 Bit Single-Core
min: 882 avg: 914 median: 925 (39%) max: 936 Points
CPU TDP ? TDP 15 W TDP 29 W 98% 100% 100%
Geekbench 5.5 - Geekbench 5.1 - 5.4 64 Bit Multi-Core
min: 2265 avg: 3162 median: 3427 (6%) max: 3516 Points
CPU TDP ? TDP 15 W TDP 29 W 84% 99% 100%
Geekbench 5.0 - Geekbench 5.0 64 Bit Single-Core
min: 923 avg: 927 median: 927 (4%) max: 931 Points
CPU TDP ? TDP 29 W 100% 99%
Geekbench 5.0 - Geekbench 5.0 64 Bit Multi-Core
min: 3105 avg: 3298 median: 3298 (10%) max: 3491 Points
CPU TDP ? TDP 29 W 89% 100%
Geekbench 4.4 - Geekbench 4.1 - 4.4 64 Bit Single-Core
min: 3453 avg: 4116 median: 4095 (41%) max: 4330 Points
CPU TDP ? TDP 29 W 100% 83%
Geekbench 4.4 - Geekbench 4.1 - 4.4 64 Bit Multi-Core
min: 11269 avg: 12833 median: 12751 (14%) max: 14228 Points
CPU TDP ? TDP 29 W 93% 100%
Geekbench 4.0 - Geekbench 4.0 64 Bit Single-Core
min: 3924 avg: 4076 median: 4029 (55%) max: 4243 Points
Geekbench 4.0 - Geekbench 4.0 64 Bit Multi-Core
min: 10751 avg: 12210 median: 12131 (30%) max: 13486 Points
Geekbench 3 - Geekbench 3 64 Bit Multi-Core
19300 Points (30%)
Model CPU GPU RAM Value 3960X 19300
min: 14363 avg: 14408 median: 14407.5 (23%) max: 14452 Points
Geekbench 3 - Geekbench 3 64 Bit Single-Core
3314 Points (50%)
Model CPU GPU RAM Value 3960X 3314
min: 3759 avg: 3829 median: 3828.5 (57%) max: 3898 Points
Geekbench 3 - Geekbench 3 32 Bit Multi-Core
min: 10893 avg: 12606 median: 12742 (23%) max: 13553 Points
Geekbench 3 - Geekbench 3 32 Bit Single-Core
min: 3148 avg: 3302 median: 3242 (63%) max: 3503 Points
Mozilla Kraken 1.1 - Kraken 1.1 Total Score *
min: 986 avg: 1221 median: 1259 (1%) max: 1532 ms
CPU TDP ? TDP 15 W TDP 29 W 100% 100% 100%
Sunspider - Sunspider 1.0 Total Score *
min: 74.8 avg: 107.9 median: 91 (1%) max: 265.6 ms
Octane V2 - Octane V2 Total Score
min: 22772 avg: 30123 median: 29871 (27%) max: 35817 Points
WebXPRT 3 - WebXPRT 3 Score
min: 163 avg: 169.5 median: 167.5 (35%) max: 180 Points
CPU TDP ? TDP 29 W 99% 100%
CrossMark - CrossMark Overall
768 Points (29%)
Power Consumption - Prime95 Power Consumption - external Monitor *
min: 25.9 avg: 27.9 median: 28.3 (5%) max: 29.3 Watt
CPU TDP ? TDP 15 W 100% 100%
Power Consumption - Cinebench R15 Multi Power Consumption - external Monitor *
min: 27.7 avg: 29.5 median: 29.8 (5%) max: 30.8 Watt
CPU TDP ? TDP 15 W 100% 100%
Power Consumption - Cinebench R15 Multi Power Efficiency - external Monitor
min: 16.8 avg: 18.1 median: 18.4 (14%) max: 18.8 Points per Watt
CPU TDP ? TDP 15 W 100% 99%
Average Benchmarks Intel Core i7-3960X → 100% n=24 Average Benchmarks Intel Core i5-8250U → 84% n=24
- Range of benchmark values for this graphics card
- Average benchmark values for this graphics card
* Smaller numbers mean a higher performance
1 This benchmark is not used for the average calculation
v1.27
log 17. 13:27:55
#0 checking url part for id 3005 +0s ... 0s
#1 checking url part for id 9206 +0s ... 0s
#2 not redirecting to Ajax server +0s ... 0s
#3 did not recreate cache, as it is less than 5 days old! Created at Sun, 16 Jun 2024 05:37:17 +0200 +0.001s ... 0.001s
#4 composed specs +0.016s ... 0.017s
#5 did output specs +0s ... 0.017s
#6 getting avg benchmarks for device 3005 +0.003s ... 0.02s
#7 got single benchmarks 3005 +0.016s ... 0.036s
#8 getting avg benchmarks for device 9206 +0.02s ... 0.056s
#9 got single benchmarks 9206 +0.358s ... 0.414s
#10 got avg benchmarks for devices +0s ... 0.414s
#11 No cached benchmark found, getting uncached values +0.211s ... 0.624s
#12 No cached benchmark found, getting uncached values +0.013s ... 0.638s
#13 No cached benchmark found, getting uncached values +0.013s ... 0.65s
#14 No cached benchmark found, getting uncached values +0.013s ... 0.664s
#15 No cached benchmark found, getting uncached values +0.014s ... 0.678s
#16 min, max, avg, median took s +0.088s ... 0.765s
#17 return log +0.059s ... 0.824s
Please share our article, every link counts!
Redaktion, 2017-09- 8 (Update: 2023-07- 1)
 Deutsch
 English
 Español
 Français
 Italiano
 Nederlands
 Polski
 Português
 Русский
 Türkçe
 Svenska
 Chinese
 Magyar