AMD Radeon R5 (Stoney Ridge) vs Intel Iris Plus Graphics 650 vs Intel Iris Plus Graphics 655
AMD Radeon R5 (Stoney Ridge) ► remove from comparison
The AMD Radeon R5 (Stoney Ridge) is an integrated graphics adapter of the weaker mobile dual-core Stoney Ridge APUs. At its launch, it is being used in the AMD A9-9410 and has 3 active Compute Cores (384 shaders). Depending on the model, the maximum clock is 800 MHz. The performance can vary heavily depending on the configured TDP and the system memory. Compared to the Radeon R5 from the Bristol Ridge series, it only has 3 instead of 6 GCN cores (and is the full configuration of the Stoney Ridge chip).
Architecture and Features
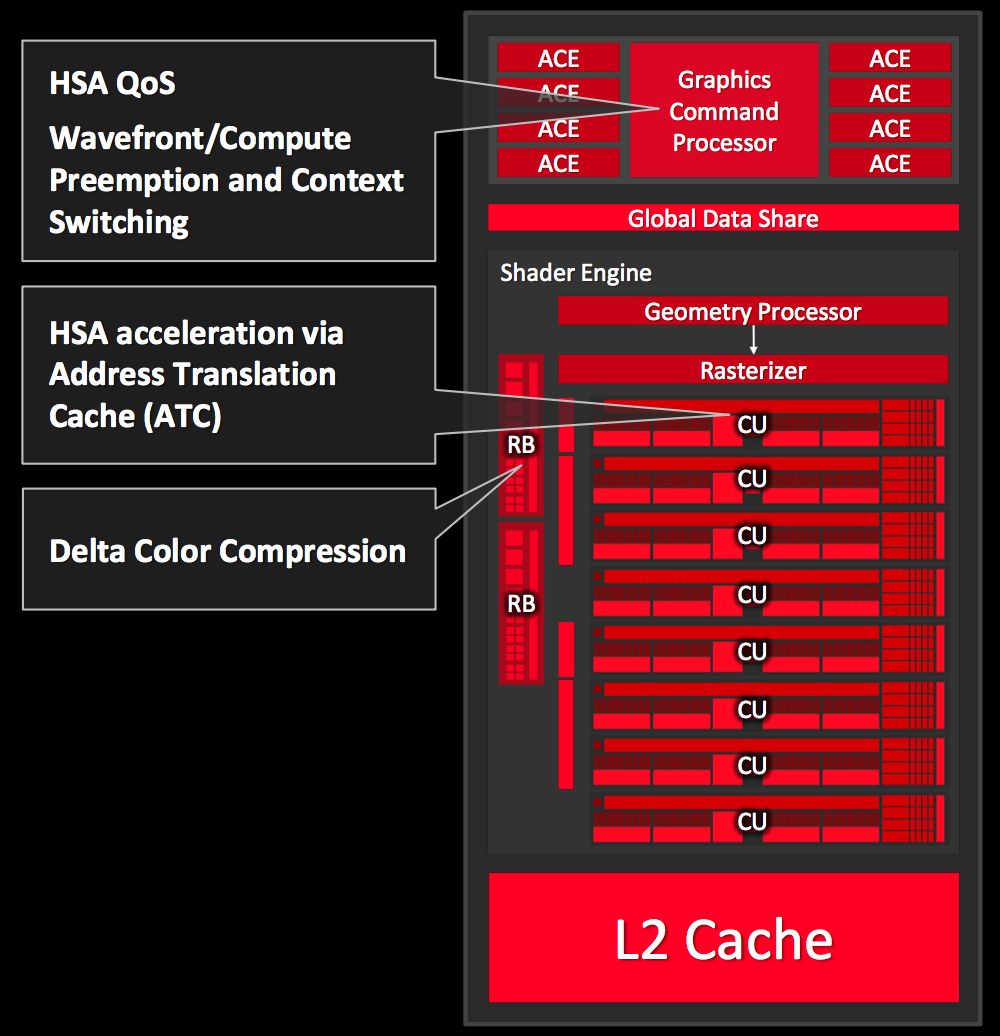
The Radeon R5 is equipped with three cores from the third GCN generation (often called GCN 1.2 or 2.0 by the press). This means it is very similar to the Tonga desktop chip and supports DirectX 12 (FL 12_0), but the graphics cores can also be accessed via Mantle, OpenGL, and OpenCL. The GPU supports the HSA 1.0 standard as well and can therefore use the connection with the CPU cores very efficiently. The technical specifications are identical to the Carrizo predecessor.
The video unit includes the UVD 6 (Unified Video Decoder), which can decode HEVC/H.265 and 4K with support from the hardware. More details are available in our dedicated Stoney Ridge article .
Power Consumption
Depending on the model and configured TDP (cTDP), the 28 nm chip is specified with 10 up to 25 Watts. This means it can also be used for thin and light notebooks.
Intel Iris Plus Graphics 650 ► remove from comparison
The Intel Iris Plus Graphics 650 (GT3e) is a processor graphics card for Kaby Lake models announced in January 2017. As the successor to the Intel Iris Graphics 550 (Skylake), the Iris Plus Graphics 650 is used for 28-Watt models and is equipped with 64 MB eDRAM cache. There should not be any big changes compared to the Iris Graphics 550.
The so called GT3e version of the Kaby Lake GPU probably still has 48 Execution Units (EUs), which can reach up to 1100 MHz depending on the model. Besides eDRAM cache, the Iris 650 can also access the system memory (2x 64 Bit DDR3L-1600/DDR4-2400) via processor interface.
Compared to the Iris Plus 640 from the 15-Watt models, the Iris 650 only has a slightly higher maximum clock as well as almost twice the TDP, which allows a better utilization of the Turbo Boost potential.
Performance
The exact performance of the Iris Plus Graphics 650 depends on the CPU model, because maximum clock as well as the size of the L3 cache can differ a bit. The system memory (DDR3/DDR4) will influence the performance as well.
The fastest chips are high-clocked Core i7 models like the Core i7-7567U . Depending on the game, the Iris Plus 650 will probably be on par with a dedicated GeForce 930M and can handle smooth gameplay in modern titles in low up to medium settings.
Features
The reworked video engine now fully supports hardware decoding of H.265/HEVC videos. Contrary to Skylake, however, Kaby Lake can now also decode H.265/HEVC Main 10 with a 10-bit color depth as well as Google's VP9 codec. The video output is possible via DP 1.2/eDP 1.3 (up to 3840 x 2160 @60 Hz), whereas HDMI is also supported in the older 1.4a standard. An HDMI 2.0 output can be added via converter from DisplayPort. The GPU can drive up to three displays simultaneously.
Power Consumption
The Iris Plus Graphics 650 is used for 28-Watt processor and therefore medium-sized notebooks.
Intel Iris Plus Graphics 655 ► remove from comparison
The Intel Iris Plus Graphics 655 (GT3e) is a processor graphics card announced in September 2017. As the successor to the Intel Iris Graphics 650 (Kaby Lake), the Iris Plus Graphics 655 is used for 28-Watt Coffee Lake-U models. The biggest difference is the doubled eDRAM-cache at 128 MB. There should not be any big changes compared to the Iris Graphics 650.
The so called GT3e version of the Kaby Lake GPU still has 48 Execution Units (EUs), which can reach up to 1200 MHz (previously 1100 MHz) depending on the model. Besides eDRAM cache, the Iris 655 can also access the system memory (2x 64 Bit DDR3L-2133/DDR4-2400) via processor interface.
Compared to the Iris Plus 640 from the 15-Watt models, the Iris 655 only has a slightly higher maximum clock as well as almost twice the TDP, which allows a better utilization of the Turbo Boost potential.
The exact performance of the Iris Plus Graphics 655 depends on the CPU model, because maximum clock as well as the size of the L3 cache can differ a bit. The system memory (DDR3/DDR4) will influence the performance as well.
The fastest chips are high-clocked Core i7 models like the Core i7-8559U. Depending on the game, the Iris Plus 655 will probably be on par with a dedicated GeForce 930M or GeForce 940MX and can handle smooth gameplay in modern titles in low up to medium settings.
The reworked video engine now fully supports hardware decoding of H.265/HEVC videos. Contrary to Skylake, however, Kaby Lake can now also decode H.265/HEVC Main 10 with a 10-bit color depth as well as Google's VP9 codec. The video output is possible via DP 1.2/eDP 1.3 (up to 3840 x 2160 @60 Hz), whereas HDMI is also supported in the older 1.4a standard. An HDMI 2.0 output can be added via converter from DisplayPort. The GPU can drive up to three displays simultaneously.
The Iris Plus Graphics 655 is used for 28-Watt processor and therefore small/medium-sized notebooks.
AMD Radeon R5 (Stoney Ridge) Intel Iris Plus Graphics 650 Intel Iris Plus Graphics 655 Gen. 9.5 Series Codename Stoney Ridge Kaby Lake GT3e Kaby Lake GT3e Architecture GCN 1.2/2.0 Gen. 9.5 Kaby Lake Gen. 9.5 Kaby Lake Pipelines 192 - unified 48 - unified 48 - unified Core Speed 800 (Boost) MHz 300 - 1100 (Boost) MHz 300 - 1200 (Boost) MHz Memory Bus Width 64 Bit 64/128 Bit Shared Memory yes yes yes API DirectX 12 (FL 12_0), OpenGL 4.4 DirectX 12_1, OpenGL 4.4 DirectX 12_1, OpenGL 4.5 Power Consumption 12-45 Watt technology 28 nm 14 nm 14 nm Features UVD 6, VCE QuickSync QuickSync Notebook Size medium sized Date of Announcement 01.06.2016 03.01.2017 01.09.2017 Memory Type DDR4 DDR3/DDR4
CPU in Radeon R5 (Stoney Ridge) GPU Base Speed GPU Boost / Turbo AMD A9-9425 2 x 3100 MHz, 15 W ? MHz 900 MHz AMD A9-9420e 2 x ? MHz ? MHz ? MHz AMD A9-9420 2 x 3000 MHz, 10-25 W ? MHz 800 MHz » show 2 more AMD A9-9410 2 x 2900 MHz, 10-25 W ? MHz 800 MHz AMD A6-9220C 2 x 1800 MHz, 6 W ? MHz 720 MHz min. - max. ? MHz 720 - 900 MHz
CPU in Iris Plus Graphics 650 GPU Base Speed GPU Boost / Turbo Intel Core i7-7567U 2 x 3500 MHz, 28 W 300 MHz 1100 MHz Intel Core i5-7287U 2 x 3300 MHz, 28 W 300 MHz 1100 MHz Intel Core i5-7267U 2 x 3100 MHz, 28 W 300 MHz 1050 MHz Intel Core i3-7167U 2 x 2800 MHz, 28 W 300 MHz 1000 MHz min. - max. 300 - ? MHz 720 - 1100 MHz
CPU in Iris Plus Graphics 655 GPU Base Speed GPU Boost / Turbo Intel Core i7-8559U 4 x 2700 MHz, 28 W 300 MHz 1200 MHz Intel Core i5-8269U 4 x 2600 MHz, 28 W 300 MHz 1100 MHz Intel Core i5-8279U 4 x 2400 MHz, 28 W 300 MHz 1150 MHz » show 2 more Intel Core i5-8259U 4 x 2300 MHz, 28 W 300 MHz 1050 MHz Intel Core i3-8109U 2 x 3000 MHz, 28 W 300 MHz 1050 MHz min. - max. 300 - ? MHz 720 - 1200 MHz
Benchmarks Performance Rating - 3DMark 11 + Fire Strike + Time Spy - Radeon R5 (Stoney Ridge)
0.4 pt (1%)
...
AMD Radeon R5 (Stoney Ridge)
...
max:
Performance Rating - 3DMark 11 + Fire Strike + Time Spy - Iris Plus Graphics 655
0.9 pt (3%)
...
Intel Iris Plus Graphics 655
...
max:
3DMark - 3DMark Time Spy Score
min: 274 avg: 281.5 median: 281.5 (1%) max: 289 Points
623 Points (2%)
min: 348 avg: 647 median: 684 (2%) max: 722 Points
3DMark - 3DMark Time Spy Graphics
min: 247 avg: 254.5 median: 254.5 (1%) max: 262 Points
555 Points (1%)
min: 301 avg: 570 median: 604.5 (2%) max: 633 Points
3DMark - 3DMark Ice Storm Unlimited Graphics
min: 46978 avg: 50907 median: 51382 (6%) max: 54361 Points
161538 Points (18%)
min: 131607 avg: 139716 median: 137266 (16%) max: 152727 Points
3DMark - 3DMark Ice Storm Extreme Graphics
min: 32172 avg: 33058 median: 33057.5 (4%) max: 33943 Points
min: 57033 avg: 72655 median: 71073 (9%) max: 89859 Points
3DMark - 3DMark Cloud Gate Score
min: 2673 avg: 2893 median: 2995 (3%) max: 3010 Points
min: 8403 avg: 9150 median: 9149.5 (10%) max: 9896 Points
min: 6769 avg: 10798 median: 11622 (12%) max: 13037 Points
3DMark - 3DMark Cloud Gate Graphics
min: 3661 avg: 4439 median: 4755 (1%) max: 4902 Points
13153 Points (3%)
min: 6498 avg: 13736 median: 14343 (4%) max: 16698 Points
3DMark - 3DMark Fire Strike Standard Score
min: 596 avg: 688 median: 712 (1%) max: 757 Points
min: 1586 avg: 1655 median: 1655 (3%) max: 1724 Points
min: 852 avg: 1703 median: 1850 (3%) max: 2040 Points
3DMark - 3DMark Fire Strike Standard Graphics
min: 642 avg: 765 median: 772 (1%) max: 881 Points
1698 Points (2%)
min: 920 avg: 1836 median: 1983 (2%) max: 2260 Points
3DMark - 3DMark Ice Storm Graphics
min: 49964 avg: 51392 median: 51392 (6%) max: 52820 Points
min: 85405 avg: 107151 median: 110302 (13%) max: 122594 Points
3DMark 11 - 3DM11 Performance Score
min: 1103 avg: 1254 median: 1263 (2%) max: 1387 Points
2924 Points (4%)
min: 1548 avg: 2942 median: 3180.5 (4%) max: 3349 Points
3DMark 11 - 3DM11 Performance GPU
min: 1096 avg: 1245 median: 1264 (1%) max: 1356 Points
2762 Points (2%)
min: 1365 avg: 2707 median: 2894 (2%) max: 3081 Points
3DMark Vantage + AMD Radeon R5 (Stoney Ridge) 3DMark Vantage - 3DM Vant. Perf. total
3346 Points (1%)
3DM Vant. Perf. total + Intel Iris Plus Graphics 655
min: 12093 avg: 12287 median: 12287 (4%) max: 12481 Points
3DM Vant. Perf. GPU no PhysX + AMD Radeon R5 (Stoney Ridge) 3DMark Vantage - 3DM Vant. Perf. GPU no PhysX
3044 Points (2%)
3DM Vant. Perf. GPU no PhysX + Intel Iris Plus Graphics 655
min: 10337 avg: 10514 median: 10513.5 (6%) max: 10690 Points
3DMark 05 - 3DMark 05 - Standard
22740 Points (25%)
3DMark 06 3DMark 06 - Standard 1280x1024 + AMD Radeon R5 (Stoney Ridge)
min: 5141 avg: 5174 median: 5174 (7%) max: 5207 Points
3DMark 06 - Standard 1280x1024 + Intel Iris Plus Graphics 650
15175 Points (20%)
3DMark 06 - Standard 1280x1024 + Intel Iris Plus Graphics 655
min: 17176 avg: 17885 median: 17885 (23%) max: 18594 Points
Unigine Valley 1.0 - Unigine Valley 1.0 DX
8.2 fps (3%)
Unigine Heaven 3.0 - Unigine Heaven 3.0 DX 11
13.7 fps (5%)
Unigine Heaven 3.0 - Unigine Heaven 3.0 OpenGL
10.5 fps (5%)
Unigine Heaven 2.1 - Heaven 2.1 high
10.8 fps (2%)
SPECviewperf 12 + Intel Iris Plus Graphics 655 SPECviewperf 12 - specvp12 sw-03
28.2 fps (7%)
specvp12 snx-02 + Intel Iris Plus Graphics 655 SPECviewperf 12 - specvp12 snx-02
2.1 fps (0%)
specvp12 showcase-01 + Intel Iris Plus Graphics 655 SPECviewperf 12 - specvp12 showcase-01
10.3 fps (2%)
specvp12 mediacal-01 + Intel Iris Plus Graphics 655 SPECviewperf 12 - specvp12 mediacal-01
4.6 fps (1%)
specvp12 maya-04 + Intel Iris Plus Graphics 655 SPECviewperf 12 - specvp12 maya-04
20.4 fps (6%)
specvp12 energy-01 + Intel Iris Plus Graphics 655 SPECviewperf 12 - specvp12 energy-01
0.3 fps (0%)
specvp12 creo-01 + Intel Iris Plus Graphics 655 SPECviewperf 12 - specvp12 creo-01
14.9 fps (6%)
specvp12 catia-04 + Intel Iris Plus Graphics 655 SPECviewperf 12 - specvp12 catia-04
18.8 fps (3%)
specvp12 3dsmax-05 + Intel Iris Plus Graphics 655 SPECviewperf 12 - specvp12 3dsmax-05
18.1 fps (3%)
SPECviewperf 13 specvp13 sw-04 + Intel Iris Plus Graphics 655 SPECviewperf 13 - specvp13 sw-04
34.6 fps (9%)
specvp13 snx-03 + Intel Iris Plus Graphics 655 SPECviewperf 13 - specvp13 snx-03
3.8 fps (0%)
specvp13 showcase-02 + Intel Iris Plus Graphics 655 SPECviewperf 13 - specvp13 showcase-02
10.3 fps (2%)
specvp13 medical-02 + Intel Iris Plus Graphics 655 SPECviewperf 13 - specvp13 medical-02
3.8 fps (1%)
specvp13 maya-05 + Intel Iris Plus Graphics 655 SPECviewperf 13 - specvp13 maya-05
25.9 fps (3%)
specvp13 energy-02 + Intel Iris Plus Graphics 655 SPECviewperf 13 - specvp13 energy-02
1.1 fps (0%)
specvp13 creo-02 + Intel Iris Plus Graphics 655 SPECviewperf 13 - specvp13 creo-02
19.6 fps (3%)
specvp13 catia-05 + Intel Iris Plus Graphics 655 SPECviewperf 13 - specvp13 catia-05
26.4 fps (3%)
specvp13 3dsmax-06 + Intel Iris Plus Graphics 655 SPECviewperf 13 - specvp13 3dsmax-06
18.2 fps (3%)
SPECviewperf 2020 specvp2020 solidworks-05 4k + Intel Iris Plus Graphics 655 SPECviewperf 2020 - specvp2020 solidworks-05 4k
21.2 fps (6%)
specvp2020 snx-04 4k + Intel Iris Plus Graphics 655 SPECviewperf 2020 - specvp2020 snx-04 4k
3.8 fps (0%)
specvp2020 medical-03 4k + Intel Iris Plus Graphics 655 SPECviewperf 2020 - specvp2020 medical-03 4k
1.8 fps (2%)
specvp2020 maya-06 4k + Intel Iris Plus Graphics 655 SPECviewperf 2020 - specvp2020 maya-06 4k
32.7 fps (5%)
specvp2020 energy-03 4k + Intel Iris Plus Graphics 655 SPECviewperf 2020 - specvp2020 energy-03 4k
1.1 fps (0%)
specvp2020 creo-03 4k + Intel Iris Plus Graphics 655 SPECviewperf 2020 - specvp2020 creo-03 4k
12.1 fps (6%)
specvp2020 catia-06 4k + Intel Iris Plus Graphics 655 SPECviewperf 2020 - specvp2020 catia-06 4k
6.3 fps (4%)
specvp2020 3dsmax-07 4k + Intel Iris Plus Graphics 655 SPECviewperf 2020 - specvp2020 3dsmax-07 4k
8.4 fps (3%)
Cinebench R10 Cinebench R10 Shading (32bit) + AMD Radeon R5 (Stoney Ridge) Cinebench R10 - Cinebench R10 Shading (32bit)
min: 2752 avg: 3847 median: 3773 (3%) max: 5088 Points
Cinebench R10 Shading (32bit) + Intel Iris Plus Graphics 650
8773 Points (6%)
Cinebench R10 Shading (32bit) + Intel Iris Plus Graphics 655
min: 7836 avg: 9544 median: 10263 (7%) max: 10533 Points
Cinebench R11.5 Cinebench R11.5 OpenGL 64 Bit + AMD Radeon R5 (Stoney Ridge) Cinebench R11.5 - Cinebench R11.5 OpenGL 64 Bit
min: 16.4 avg: 17.8 median: 16.6 (6%) max: 20.39 fps
Cinebench R11.5 OpenGL 64 Bit + Intel Iris Plus Graphics 650
45.2 fps (16%)
Cinebench R11.5 OpenGL 64 Bit + Intel Iris Plus Graphics 655
min: 50.25 avg: 51.4 median: 51.6 (18%) max: 52.2 fps
Cinebench R15 + AMD Radeon R5 (Stoney Ridge) Cinebench R15 - Cinebench R15 OpenGL 64 Bit
min: 19.66 avg: 22.3 median: 23 (1%) max: 23.42 fps
Cinebench R15 OpenGL 64 Bit + Intel Iris Plus Graphics 650
min: 41.21 avg: 59.1 median: 59.1 (3%) max: 77 fps
Cinebench R15 OpenGL 64 Bit + Intel Iris Plus Graphics 655
min: 33.91 avg: 67 median: 74 (4%) max: 88 fps
Cinebench R15 OpenGL Ref. Match 64 Bit + AMD Radeon R5 (Stoney Ridge) Cinebench R15 - Cinebench R15 OpenGL Ref. Match 64 Bit
98 % (98%)
Cinebench R15 OpenGL Ref. Match 64 Bit + Intel Iris Plus Graphics 650
99.3 % (99%)
Cinebench R15 OpenGL Ref. Match 64 Bit + Intel Iris Plus Graphics 655
min: 97.8 avg: 98.1 median: 97.8 (98%) max: 99.3 %
GFXBench - GFXBench Car Chase Offscreen
15.6 fps (2%)
GFXBench 3.1 - GFXBench Manhattan ES 3.1 Offscreen
20.4 fps (0%)
min: 43.1 avg: 2387 median: 2387.1 (50%) max: 4731 fps
GFXBench 3.0 - GFXBench 3.0 Manhattan Offscreen
21.8 fps (1%)
199.6 fps (12%)
GFXBench (DX / GLBenchmark) 2.7 + AMD Radeon R5 (Stoney Ridge) GFXBench (DX / GLBenchmark) 2.7 - GFXBench T-Rex HD Offscreen C24Z16
67.8 fps (1%)
GFXBench T-Rex HD Offscreen C24Z16 + Intel Iris Plus Graphics 655
min: 199.6 avg: 6375 median: 6375.3 (51%) max: 12551 fps
LuxMark v2.0 64Bit - LuxMark v2.0 Room GPU
92 Samples/s (0%)
336 Samples/s (2%)
min: 359 avg: 419.5 median: 419.5 (2%) max: 480 Samples/s
LuxMark v2.0 64Bit - LuxMark v2.0 Sala GPU
124 Samples/s (0%)
813 Samples/s (1%)
min: 882 avg: 1038 median: 1038 (2%) max: 1194 Samples/s
ComputeMark v2.1 - ComputeMark v2.1 Result
min: 458 avg: 597 median: 597 (1%) max: 736 Points
1730 Points (2%)
min: 1584 avg: 1713 median: 1712.5 (2%) max: 1841 Points
Power Consumption - Furmark Stress Test Power Consumption - external Monitor *
51.4 Watt (7%)
min: 28.9 avg: 37.4 median: 39.2 (6%) max: 42.4 Watt
Power Consumption - The Witcher 3 Power Consumption - external Monitor *
51.4 Watt (7%)
min: 35.3 avg: 40.6 median: 39.4 (6%) max: 47.2 Watt
Power Consumption - Witcher 3 Power Consumption *
min: 39.4 avg: 43.3 median: 43.3 (10%) max: 47.2 Watt
Power Consumption - Witcher 3 ultra Power Efficiency
0.1 fps per Watt (14%)
Power Consumption - Witcher 3 ultra Power Efficiency - external Monitor
0.2 fps per Watt (13%)
Emissions Witcher 3 Fan Noise + Intel Iris Plus Graphics 650 Emissions - Witcher 3 Fan Noise
39.1 dB(A) (63%)
Witcher 3 Fan Noise + Intel Iris Plus Graphics 655
min: 32.5 avg: 36.2 median: 37.2 (60%) max: 39 dB(A)
Clock Speed - GPU Clock Witcher 3 ultra
998 MHz (39%)
998 MHz (39%)
Clock Speed - GPU Clock Speed Furmark
848 MHz (34%)
Average Benchmarks AMD Radeon R5 (Stoney Ridge) → 100% n=17 Average Benchmarks Intel Iris Plus Graphics 650 → 277% n=17 Average Benchmarks Intel Iris Plus Graphics 655 → 316% n=17
- Range of benchmark values for this graphics card
- Average benchmark values for this graphics card
* Smaller numbers mean a higher performance
1 This benchmark is not used for the average calculation
Game Benchmarks The following benchmarks stem from our benchmarks of review laptops. The performance depends on the used graphics memory, clock rate, processor, system settings, drivers, and operating systems. So the results don't have to be representative for all laptops with this GPU. For detailed information on the benchmark results, click on the fps number.
Iris Plus Graphics 655:
44.6 fps
Iris Plus Graphics 655:
21.6 fps
Iris Plus Graphics 655:
16.4 fps
Iris Plus Graphics 655:
10.2 fps
Iris Plus Graphics 655:
40.7 fps
Iris Plus Graphics 655:
19.1 fps
Iris Plus Graphics 655:
14.5 fps
Iris Plus Graphics 655:
9.6 fps
Iris Plus Graphics 655:
54.8 fps
Iris Plus Graphics 655:
17.3 fps
Iris Plus Graphics 655:
11.6 fps
Iris Plus Graphics 655:
0 (!) [X] Intel NUC8i7BE Intel Core i7-8559U 2.7GHz
Iris Plus Graphics 655
fps
Iris Plus Graphics 655:
29.1 [X] Intel NUC8i7BE Intel Core i7-8559U 2.7GHz
Iris Plus Graphics 655
min:
17 fps, max:
36 fps
fps
Iris Plus Graphics 655:
16.2 [X] Intel NUC8i7BE Intel Core i7-8559U 2.7GHz
Iris Plus Graphics 655
min:
11 fps, max:
22 fps
fps
Iris Plus Graphics 655:
14.1 [X] Intel NUC8i7BE Intel Core i7-8559U 2.7GHz
Iris Plus Graphics 655
min:
11 fps, max:
21 fps
fps
Iris Plus Graphics 655:
6.6 [X] Intel NUC8i7BE Intel Core i7-8559U 2.7GHz
Iris Plus Graphics 655
min:
3 fps, max:
9 fps
fps
Iris Plus Graphics 655:
59.8 [X] Intel NUC8i7BE Intel Core i7-8559U 2.7GHz
Iris Plus Graphics 655
min:
56 fps, max:
62 fps
fps
Iris Plus Graphics 655:
27.2 [X] Intel NUC8i7BE Intel Core i7-8559U 2.7GHz
Iris Plus Graphics 655
min:
20 fps, max:
31 fps
fps
Iris Plus Graphics 655:
15.8 [X] Intel NUC8i7BE Intel Core i7-8559U 2.7GHz
Iris Plus Graphics 655
min:
3.7 fps, P1:
6.17 fps, max:
130 fps
fps
Iris Plus Graphics 655:
0 (!) [X] Intel NUC8i7BE Intel Core i7-8559U 2.7GHz
Iris Plus Graphics 655
fps
Iris Plus Graphics 655:
36.3 (!) [X] Intel NUC8i7BE Intel Core i7-8559U 2.7GHz
Iris Plus Graphics 655
P1:
24.6 fps
fps
Iris Plus Graphics 655:
20.9 (!) [X] Intel NUC8i7BE Intel Core i7-8559U 2.7GHz
Iris Plus Graphics 655
P1:
14.5 fps
fps
Iris Plus Graphics 655:
0 (!) [X] Intel NUC8i7BE Intel Core i7-8559U 2.7GHz
Iris Plus Graphics 655
fps
Iris Plus Graphics 655:
92 [X] Intel NUC8i7BE DirectX 11
Intel Core i7-8559U 2.7GHz
Iris Plus Graphics 655
P1:
74.1 fps
fps
Iris Plus Graphics 655:
55.9 [X] Intel NUC8i7BE DirectX 11
Intel Core i7-8559U 2.7GHz
Iris Plus Graphics 655
P1:
47.4 fps
fps
Iris Plus Graphics 655:
46.3 [X] Intel NUC8i7BE DirectX 11
Intel Core i7-8559U 2.7GHz
Iris Plus Graphics 655
P1:
35.6 fps
fps
Iris Plus Graphics 655:
34.9 [X] Intel NUC8i7BE DirectX 11
Intel Core i7-8559U 2.7GHz
Iris Plus Graphics 655
P1:
31.3 fps
fps
Iris Plus Graphics 655:
26.5 [X] Intel NUC8i7BE DirectX 11
Intel Core i7-8559U 2.7GHz
Iris Plus Graphics 655
P1:
24 fps
fps
Iris Plus Graphics 655:
13.6 [X] Intel NUC8i7BE DirectX 11
Intel Core i7-8559U 2.7GHz
Iris Plus Graphics 655
P1:
12 fps
fps
Iris Plus Graphics 655:
22.5 23.5 ~ 23 fps
Iris Plus Graphics 655:
10.2 10.4 ~ 10 fps
Iris Plus Graphics 655:
6.4 6.7 ~ 7 fps
Iris Plus Graphics 655:
25.4 (!) [X] Intel NUC8i7BE Intel Core i7-8559U 2.7GHz
Iris Plus Graphics 655
min:
20 fps, max:
31 fps
fps
Iris Plus Graphics 655:
51.2 [X] Intel NUC8i7BE Intel Core i7-8559U 2.7GHz
Iris Plus Graphics 655
min:
46 fps, max:
56 fps
fps
Iris Plus Graphics 655:
21.9 [X] Intel NUC8i7BE Intel Core i7-8559U 2.7GHz
Iris Plus Graphics 655
min:
19 fps, max:
23 fps
fps
Iris Plus Graphics 655:
19.3 [X] Intel NUC8i7BE Intel Core i7-8559U 2.7GHz
Iris Plus Graphics 655
min:
17 fps, max:
21 fps
fps
Iris Plus Graphics 655:
56.7 [X] Intel NUC8i7BE Intel Core i7-8559U 2.7GHz
Iris Plus Graphics 655
min:
51 fps, max:
63 fps
fps
Iris Plus Graphics 655:
18.5 [X] Intel NUC8i7BE Intel Core i7-8559U 2.7GHz
Iris Plus Graphics 655
min:
14 fps, max:
24 fps
fps
Iris Plus Graphics 655:
10.5 [X] Intel NUC8i7BE Intel Core i7-8559U 2.7GHz
Iris Plus Graphics 655
min:
8 fps, max:
13 fps
fps
Iris Plus Graphics 655:
24.5 fps
Iris Plus Graphics 655:
30.2 [X] Intel NUC8i7BE Intel Core i7-8559U 2.7GHz
Iris Plus Graphics 655
min:
26 fps, max:
34 fps
fps
Iris Plus Graphics 655:
35 fps
100%
Radeon R5 (Stoney Ridge):
30.9 fps
207%
Iris Plus Graphics 655:
64 [X] Intel NUC8i7BE Intel Core i7-8559U 2.7GHz
Iris Plus Graphics 655
min:
57 fps, max:
76 fps
fps
100%
Radeon R5 (Stoney Ridge):
9.9 fps
230%
Iris Plus Graphics 655:
22.8 [X] Intel NUC8i7BE Intel Core i7-8559U 2.7GHz
Iris Plus Graphics 655
min:
20 fps, max:
25 fps
fps
Iris Plus Graphics 655:
16.6 [X] Intel NUC8i7BE Intel Core i7-8559U 2.7GHz
Iris Plus Graphics 655
min:
8 fps, max:
21 fps
fps
100%
Radeon R5 (Stoney Ridge):
6 fps
367%
Iris Plus Graphics 655:
21 22 [X] Intel NUC8i7BE Intel Core i7-8559U 2.7GHz
Iris Plus Graphics 655
min:
19 fps, max:
27 fps
~ 22 fps
100%
Radeon R5 (Stoney Ridge):
2 fps
550%
Iris Plus Graphics 655:
11 [X] Intel NUC8i7BE Intel Core i7-8559U 2.7GHz
Iris Plus Graphics 655
min:
10 fps, max:
14 fps
11 ~ 11 fps
Iris Plus Graphics 655:
10 fps
Iris Plus Graphics 655:
9 fps
100%
Radeon R5 (Stoney Ridge):
8.4 fps
226%
Iris Plus Graphics 655:
18.3 [X] Intel NUC8i7BE Intel Core i7-8559U 2.7GHz
Iris Plus Graphics 655
min:
10.36 fps, max:
31.73 fps
20.1 ~ 19 fps
100%
Radeon R5 (Stoney Ridge):
4.3 fps
235%
Iris Plus Graphics 655:
10.1 fps
Iris Plus Graphics 655:
7.4 fps
100%
Radeon R5 (Stoney Ridge):
15.4 fps
100%
Radeon R5 (Stoney Ridge):
7 fps
100%
Radeon R5 (Stoney Ridge):
12.3 fps
100%
Radeon R5 (Stoney Ridge):
7 fps
100%
Radeon R5 (Stoney Ridge):
22.5 fps
100%
Radeon R5 (Stoney Ridge):
11.8 fps
Iris Plus Graphics 655:
19.9 [X] Intel NUC8i7BE Intel Core i7-8559U 2.7GHz
Iris Plus Graphics 655
min:
1 fps, max:
33 fps
fps
100%
Radeon R5 (Stoney Ridge):
39 fps
100%
Radeon R5 (Stoney Ridge):
14 fps
100%
Radeon R5 (Stoney Ridge):
7.4 fps
100%
Radeon R5 (Stoney Ridge):
3.5 fps
Iris Plus Graphics 655:
0 (!) fps
100%
Radeon R5 (Stoney Ridge):
10 fps
160%
Iris Plus Graphics 655:
13 18 [X] Intel NUC8i7BE Intel Core i7-8559U 2.7GHz
Iris Plus Graphics 655
min:
7 fps, max:
26 fps
~ 16 fps
100%
Radeon R5 (Stoney Ridge):
4 fps
100%
Radeon R5 (Stoney Ridge):
13 fps
192%
Iris Plus Graphics 655:
25 fps
100%
Radeon R5 (Stoney Ridge):
5 fps
0%
Iris Plus Graphics 655:
0 (!) fps
Iris Plus Graphics 655:
82 [X] Intel NUC8i7BE Intel Core i7-8559U 2.7GHz
Iris Plus Graphics 655
min:
70 fps, max:
96 fps
fps
Iris Plus Graphics 655:
45.8 [X] Intel NUC8i7BE Intel Core i7-8559U 2.7GHz
Iris Plus Graphics 655
min:
39 fps, max:
51 fps
fps
Iris Plus Graphics 655:
40.3 [X] Intel NUC8i7BE Intel Core i7-8559U 2.7GHz
Iris Plus Graphics 655
min:
32 fps, max:
48 fps
fps
Iris Plus Graphics 655:
36.7 [X] Intel NUC8i7BE Intel Core i7-8559U 2.7GHz
Iris Plus Graphics 655
min:
30 fps, max:
45 fps
fps
100%
Radeon R5 (Stoney Ridge):
13 fps
100%
Radeon R5 (Stoney Ridge):
4 fps
300%
Iris Plus Graphics 655:
11 13 ~ 12 fps
Iris Plus Graphics 655:
8 10.1 ~ 9 fps
Iris Plus Graphics 655:
41.4 fps
Iris Plus Graphics 655:
17.6 fps
Iris Plus Graphics 655:
16.9 fps
Iris Plus Graphics 655:
14.5 fps
100%
Radeon R5 (Stoney Ridge):
12 fps
375%
Iris Plus Graphics 655:
45 fps
100%
Radeon R5 (Stoney Ridge):
12 fps
192%
Iris Plus Graphics 655:
23 fps
Iris Plus Graphics 655:
17 fps
Iris Plus Graphics 655:
12 12 ~ 12 fps
100%
Radeon R5 (Stoney Ridge):
4 fps
100%
Radeon R5 (Stoney Ridge):
1 fps
Iris Plus Graphics 655:
30.9 fps
100%
Radeon R5 (Stoney Ridge):
4 fps
550%
Iris Plus Graphics 655:
20 22 23 [X] Intel NUC8i7BE Intel Core i7-8559U 2.7GHz
Iris Plus Graphics 655
min:
20 fps, max:
28 fps
~ 22 fps
100%
Radeon R5 (Stoney Ridge):
1 fps
1100%
Iris Plus Graphics 655:
10 11 [X] Intel NUC8i7BE Intel Core i7-8559U 2.7GHz
Iris Plus Graphics 655
min:
10 fps, max:
14 fps
11 ~ 11 fps
Iris Plus Graphics 655:
10 fps
Iris Plus Graphics 655:
9 fps
Iris Plus Graphics 655:
15.7 250 ~ 133 fps
Iris Plus Graphics 655:
40.3 fps
100%
Radeon R5 (Stoney Ridge):
13.7 fps
100%
Radeon R5 (Stoney Ridge):
9.4 fps
100%
Radeon R5 (Stoney Ridge):
7.5 fps
100%
Radeon R5 (Stoney Ridge):
3 fps
100%
Radeon R5 (Stoney Ridge):
8.1 fps
100%
Radeon R5 (Stoney Ridge):
4.3 fps
100%
Radeon R5 (Stoney Ridge):
28 fps
184%
Iris Plus Graphics 655:
51.5 fps
100%
Radeon R5 (Stoney Ridge):
7 fps
309%
Iris Plus Graphics 655:
21.6 fps
Iris Plus Graphics 655:
13 fps
100%
Radeon R5 (Stoney Ridge):
10 fps
100%
Radeon R5 (Stoney Ridge):
6 fps
100%
Radeon R5 (Stoney Ridge):
6 fps
100%
Radeon R5 (Stoney Ridge):
8 fps
375%
Iris Plus Graphics 655:
30 fps
Iris Plus Graphics 655:
18 fps
Iris Plus Graphics 655:
14 fps
Iris Plus Graphics 655:
9 fps
100%
Radeon R5 (Stoney Ridge):
42.6 fps
100%
Radeon R5 (Stoney Ridge):
19.4 fps
100%
Radeon R5 (Stoney Ridge):
15 fps
100%
Radeon R5 (Stoney Ridge):
6.2 fps
100%
Radeon R5 (Stoney Ridge):
18 fps
100%
Radeon R5 (Stoney Ridge):
13 fps
100%
Radeon R5 (Stoney Ridge):
10 fps
100%
Radeon R5 (Stoney Ridge):
12.1 fps
100%
Radeon R5 (Stoney Ridge):
35.2 fps
364%
Iris Plus Graphics 655:
128 fps
100%
Radeon R5 (Stoney Ridge):
32.8 fps
381%
Iris Plus Graphics 655:
125 fps
Iris Plus Graphics 655:
113 fps
Iris Plus Graphics 655:
57.8 fps
Iris Plus Graphics 655:
34.4 fps
100%
Radeon R5 (Stoney Ridge):
32.8 fps
195%
Iris Plus Graphics 650:
64 fps
Iris Plus Graphics 650:
21.3 fps
Iris Plus Graphics 650:
14.2 fps
100%
Radeon R5 (Stoney Ridge):
41.4 47.8 ~ 45 fps
251%
Iris Plus Graphics 650:
113 fps
229%
Iris Plus Graphics 655:
78 97 133.3 ~ 103 fps
100%
Radeon R5 (Stoney Ridge):
19.9 25.6 ~ 23 fps
247%
Iris Plus Graphics 650:
56.8 fps
100%
Radeon R5 (Stoney Ridge):
16.3 fps
239%
Iris Plus Graphics 650:
38.9 fps
100%
Radeon R5 (Stoney Ridge):
21.5 fps
239%
Iris Plus Graphics 650:
51.4 fps
Iris Plus Graphics 650:
20.2 fps
100%
Radeon R5 (Stoney Ridge):
12.2 fps
211%
Iris Plus Graphics 650:
25.8 fps
Iris Plus Graphics 650:
10.5 fps
100%
Radeon R5 (Stoney Ridge):
10.9 fps
161%
Iris Plus Graphics 650:
17.6 fps
202%
Iris Plus Graphics 655:
20.4 22.7 [X] Intel NUC8i7BE Intel Core i7-8559U 2.7GHz
Iris Plus Graphics 655
min:
15 fps, max:
27 fps
~ 22 fps
100%
Radeon R5 (Stoney Ridge):
5.2 fps
196%
Iris Plus Graphics 655:
10.2 fps
100%
Radeon R5 (Stoney Ridge):
19.9 fps
199%
Iris Plus Graphics 650:
39.7 fps
106%
Iris Plus Graphics 655:
0 (!) 41.3 [X] Intel NUC8i7BE Intel Core i7-8559U 2.7GHz
Iris Plus Graphics 655
min:
31 fps, max:
65 fps
~ 21 fps
100%
Radeon R5 (Stoney Ridge):
7.3 fps
208%
Iris Plus Graphics 650:
15.2 fps
221%
Iris Plus Graphics 655:
16.1 [X] Intel NUC8i7BE Intel Core i7-8559U 2.7GHz
Iris Plus Graphics 655
min:
13 fps, max:
21 fps
fps
100%
Radeon R5 (Stoney Ridge):
28.6 fps
100%
Radeon R5 (Stoney Ridge):
13.2 fps
Iris Plus Graphics 650:
15 fps
Iris Plus Graphics 650:
32.4 fps
Iris Plus Graphics 650:
54.1 fps
Iris Plus Graphics 650:
37.9 fps
100%
Radeon R5 (Stoney Ridge):
53.4 fps
100%
Radeon R5 (Stoney Ridge):
36.1 fps
Iris Plus Graphics 650:
36.8 fps
Iris Plus Graphics 650:
19.9 fps
Iris Plus Graphics 650:
46.1 fps
Iris Plus Graphics 650:
29.5 fps
100%
Radeon R5 (Stoney Ridge):
29.4 fps
144%
Iris Plus Graphics 650:
42.2 fps
100%
Radeon R5 (Stoney Ridge):
12.1 fps
167%
Iris Plus Graphics 650:
20.2 fps
Iris Plus Graphics 650:
19.2 fps
Iris Plus Graphics 655:
28.7 [X] Intel NUC8i7BE Intel Core i7-8559U 2.7GHz
Iris Plus Graphics 655
min:
2.6 fps, max:
41.3 fps
fps
Iris Plus Graphics 650:
14.6 fps
Iris Plus Graphics 655:
21.1 [X] Intel NUC8i7BE Intel Core i7-8559U 2.7GHz
Iris Plus Graphics 655
min:
16 fps, max:
29 fps
fps
Iris Plus Graphics 650:
8.2 fps
100%
Radeon R5 (Stoney Ridge):
30.4 fps
261%
Iris Plus Graphics 650:
79.2 fps
299%
Iris Plus Graphics 655:
91 fps
100%
Radeon R5 (Stoney Ridge):
24.6 fps
233%
Iris Plus Graphics 650:
57.4 fps
276%
Iris Plus Graphics 655:
68 fps
Iris Plus Graphics 650:
25.6 fps
Iris Plus Graphics 655:
29.9 fps
Iris Plus Graphics 650:
21.4 fps
Iris Plus Graphics 655:
18.2 fps
100%
Radeon R5 (Stoney Ridge):
7 fps
277%
Iris Plus Graphics 655:
19.4 fps
Iris Plus Graphics 655:
11.3 fps
Iris Plus Graphics 655:
10.5 fps
100%
Radeon R5 (Stoney Ridge):
4 fps
100%
Radeon R5 (Stoney Ridge):
2 fps
100%
Radeon R5 (Stoney Ridge):
18.2 fps
165%
Iris Plus Graphics 650:
30 fps
188%
Iris Plus Graphics 655:
34.2 fps
100%
Radeon R5 (Stoney Ridge):
11.3 fps
188%
Iris Plus Graphics 655:
21.2 fps
Iris Plus Graphics 650:
32 fps
Iris Plus Graphics 650:
15 fps
100%
Radeon R5 (Stoney Ridge):
14 16.1 ~ 15 fps
173%
Iris Plus Graphics 650:
25.9 fps
220%
Iris Plus Graphics 655:
25.9 39.2 ~ 33 fps
100%
Radeon R5 (Stoney Ridge):
8 10.4 ~ 9 fps
203%
Iris Plus Graphics 650:
18.3 fps
222%
Iris Plus Graphics 655:
17.6 22.3 ~ 20 fps
Iris Plus Graphics 655:
10.8 fps
Iris Plus Graphics 655:
8.9 fps
100%
Radeon R5 (Stoney Ridge):
26.9 fps
201%
Iris Plus Graphics 650:
54.2 fps
282%
Iris Plus Graphics 655:
75.8 [X] Intel NUC8i7BE Intel Core i7-8559U 2.7GHz
Iris Plus Graphics 655
min:
12 fps, max:
128 fps
fps
100%
Radeon R5 (Stoney Ridge):
21.6 fps
165%
Iris Plus Graphics 650:
35.6 fps
0%
Iris Plus Graphics 655:
0 (!) [X] Intel NUC8i7BE Intel Core i7-8559U 2.7GHz
Iris Plus Graphics 655
fps
Iris Plus Graphics 650:
20.8 fps
100%
Radeon R5 (Stoney Ridge):
37.7 fps
100%
Radeon R5 (Stoney Ridge):
28.8 fps
100%
Radeon R5 (Stoney Ridge):
34.1 fps
100%
Radeon R5 (Stoney Ridge):
24.9 fps
100%
Radeon R5 (Stoney Ridge):
33.1 35.2 ~ 34 fps
279%
Iris Plus Graphics 650:
95 fps
100%
Radeon R5 (Stoney Ridge):
19.2 23.2 ~ 21 fps
305%
Iris Plus Graphics 650:
64 fps
Iris Plus Graphics 650:
29.7 fps
Iris Plus Graphics 650:
25 fps
Iris Plus Graphics 655:
11.6 12.2 ~ 12 fps
100%
Radeon R5 (Stoney Ridge):
8 fps
100%
Radeon R5 (Stoney Ridge):
5 fps
100%
Radeon R5 (Stoney Ridge):
9 fps
238%
Iris Plus Graphics 650:
21.4 fps
Iris Plus Graphics 655:
14.6 17.8 ~ 16 fps
Iris Plus Graphics 655:
10.1 10.9 ~ 11 fps
Iris Plus Graphics 655:
5.6 5.6 ~ 6 fps
100%
Radeon R5 (Stoney Ridge):
59.7 fps
100%
Radeon R5 (Stoney Ridge):
22 fps
Iris Plus Graphics 650:
56.5 fps
Iris Plus Graphics 655:
57 61 68 [X] Intel NUC8i7BE Intel Core i7-8559U 2.7GHz
Iris Plus Graphics 655
min:
17.5 fps, P1:
40 fps, max:
131 fps
~ 62 fps
Iris Plus Graphics 650:
49.9 fps
Iris Plus Graphics 655:
51.2 51.8 62.1 [X] Intel NUC8i7BE Intel Core i7-8559U 2.7GHz
Iris Plus Graphics 655
min:
15.1 fps, P1:
37 fps, max:
117 fps
~ 55 fps
Iris Plus Graphics 650:
11.6 fps
Iris Plus Graphics 655:
13.7 14.3 15.8 [X] Intel NUC8i7BE Intel Core i7-8559U 2.7GHz
Iris Plus Graphics 655
min:
8.44 fps, P1:
11.9 fps, max:
85.5 fps
~ 15 fps
Iris Plus Graphics 650:
5 fps
Iris Plus Graphics 655:
5.2 5.5 6.2 [X] Intel NUC8i7BE Intel Core i7-8559U 2.7GHz
Iris Plus Graphics 655
min:
3.37 fps, P1:
4.2 fps, max:
28.7 fps
~ 6 fps
Iris Plus Graphics 655:
4.2 [X] Intel NUC8i7BE Intel Core i7-8559U 2.7GHz
Iris Plus Graphics 655
min:
2.38 fps, P1:
2.82 fps, max:
99 fps
fps
100%
Radeon R5 (Stoney Ridge):
19.3 fps
100%
Radeon R5 (Stoney Ridge):
14.8 fps
100%
Radeon R5 (Stoney Ridge):
12 fps
100%
Radeon R5 (Stoney Ridge):
39 fps
100%
Radeon R5 (Stoney Ridge):
30 fps
100%
Radeon R5 (Stoney Ridge):
27 fps
100%
Radeon R5 (Stoney Ridge):
17 fps
100%
Radeon R5 (Stoney Ridge):
16 22.3 ~ 19 fps
100%
Radeon R5 (Stoney Ridge):
11 13.8 ~ 12 fps
100%
Radeon R5 (Stoney Ridge):
111.9 fps
100%
Radeon R5 (Stoney Ridge):
34.3 fps
100%
Radeon R5 (Stoney Ridge):
20.9 fps
100%
Radeon R5 (Stoney Ridge):
12.9 fps
100%
Radeon R5 (Stoney Ridge):
65.1 fps
100%
Radeon R5 (Stoney Ridge):
29.7 fps
100%
Radeon R5 (Stoney Ridge):
31.7 fps
100%
Radeon R5 (Stoney Ridge):
17.7 fps
100%
Radeon R5 (Stoney Ridge):
9.6 fps
100%
Radeon R5 (Stoney Ridge):
44 fps
100%
Radeon R5 (Stoney Ridge):
26 fps
100%
Radeon R5 (Stoney Ridge):
14 fps
100%
Radeon R5 (Stoney Ridge):
13 fps
100%
Radeon R5 (Stoney Ridge):
10 fps
100%
Radeon R5 (Stoney Ridge):
5 fps
100%
Radeon R5 (Stoney Ridge):
52.9 fps
100%
Radeon R5 (Stoney Ridge):
31.8 fps
100%
Radeon R5 (Stoney Ridge):
26 fps
100%
Radeon R5 (Stoney Ridge):
12.5 fps
100%
Radeon R5 (Stoney Ridge):
13 fps
100%
Radeon R5 (Stoney Ridge):
10 fps
100%
Radeon R5 (Stoney Ridge):
6 fps
195%
Iris Plus Graphics 650:
84 fps
228%
Iris Plus Graphics 655:
78.4 116.6 ~ 98 fps
286%
Iris Plus Graphics 650:
54.4 fps
316%
Iris Plus Graphics 655:
54.3 64.8 ~ 60 fps
291%
Iris Plus Graphics 650:
46.5 fps
325%
Iris Plus Graphics 655:
49.4 55 ~ 52 fps
100%
Radeon R5 (Stoney Ridge):
0 (!) 7.5 ~ 4 fps
333%
Iris Plus Graphics 650:
13.3 fps
400%
Iris Plus Graphics 655:
15.5 17 ~ 16 fps
100%
Radeon R5 (Stoney Ridge):
51.9 fps
100%
Radeon R5 (Stoney Ridge):
25.7 fps
100%
Radeon R5 (Stoney Ridge):
18.2 fps
100%
Radeon R5 (Stoney Ridge):
63.9 fps
100%
Radeon R5 (Stoney Ridge):
31 fps
100%
Radeon R5 (Stoney Ridge):
26.6 fps
100%
Radeon R5 (Stoney Ridge):
39.2 fps
100%
Radeon R5 (Stoney Ridge):
28.5 fps
100%
Radeon R5 (Stoney Ridge):
25 fps
375%
Iris Plus Graphics 655:
93.7 fps
Iris Plus Graphics 655:
49.6 fps
Iris Plus Graphics 655:
12.4 fps
100%
Radeon R5 (Stoney Ridge):
59.6 fps
100%
Radeon R5 (Stoney Ridge):
41.8 fps
100%
Radeon R5 (Stoney Ridge):
33.6 fps
100%
Radeon R5 (Stoney Ridge):
32.7 fps
100%
Radeon R5 (Stoney Ridge):
22.2 fps
100%
Radeon R5 (Stoney Ridge):
15.4 fps
100%
Radeon R5 (Stoney Ridge):
35 fps
100%
Radeon R5 (Stoney Ridge):
27 fps
100%
Radeon R5 (Stoney Ridge):
13 fps
100%
Radeon R5 (Stoney Ridge):
62.4 fps
100%
Radeon R5 (Stoney Ridge):
29 fps
100%
Radeon R5 (Stoney Ridge):
26 fps
100%
Radeon R5 (Stoney Ridge):
21 fps
100%
Radeon R5 (Stoney Ridge):
17 fps
100%
Radeon R5 (Stoney Ridge):
81.4 fps
100%
Radeon R5 (Stoney Ridge):
24.3 fps
100%
Radeon R5 (Stoney Ridge):
18.6 fps
100%
Radeon R5 (Stoney Ridge):
12.4 fps
100%
Radeon R5 (Stoney Ridge):
82.6 fps
100%
Radeon R5 (Stoney Ridge):
43.7 fps
Average Gaming AMD Radeon R5 (Stoney Ridge) → 100% Average Gaming 30-70 fps → 100%
Average Gaming Intel Iris Plus Graphics 650 → 224% Average Gaming 30-70 fps → 229%
Average Gaming Intel Iris Plus Graphics 655 → 272% Average Gaming 30-70 fps → 255%
For more games that might be playable and a list of all games and graphics cards visit our Gaming List
v1.26
log 11. 08:04:06
#0 checking url part for id 7447 +0s ... 0s
#1 checking url part for id 7655 +0s ... 0s
#2 checking url part for id 8828 +0s ... 0s
#3 not redirecting to Ajax server +0s ... 0s
#4 did not recreate cache, as it is less than 5 days old! Created at Fri, 10 May 2024 05:38:50 +0200 +0.001s ... 0.001s
#5 composed specs +0.216s ... 0.217s
#6 did output specs +0s ... 0.217s
#7 start showIntegratedCPUs +0s ... 0.217s
#8 getting avg benchmarks for device 7447 +0.092s ... 0.309s
#9 got single benchmarks 7447 +0.033s ... 0.341s
#10 getting avg benchmarks for device 7655 +0.002s ... 0.344s
#11 got single benchmarks 7655 +0.015s ... 0.358s
#12 getting avg benchmarks for device 8828 +0.024s ... 0.382s
#13 got single benchmarks 8828 +0.03s ... 0.412s
#14 got avg benchmarks for devices +0s ... 0.412s
#15 min, max, avg, median took s +0.577s ... 0.989s
#16 before gaming benchmark output +0s ... 0.989s
#17 Got 469 rows for game benchmarks. +0.081s ... 1.07s
#18 composed SQL query for gamebenchmarks +0s ... 1.07s
#19 got data and put it in $dataArray +0.083s ... 1.153s
#20 benchmarks composed for output. +0.257s ... 1.41s
#21 calculated avg scores. +0s ... 1.41s
#22 return log +0.003s ... 1.413s
Please share our article, every link counts!
Redaktion, 2017-09- 8 (Update: 2023-07- 1)
 Deutsch
 English
 Español
 Français
 Italiano
 Nederlands
 Polski
 Português
 Русский
 Türkçe
 Svenska
 Chinese
 Magyar