Notebookcheck Logo

NVIDIA GeForce GTX 970 vs NVIDIA GeForce GTX 1660 Ti Max-Q

NVIDIA GeForce GTX 970

► remove from comparison NVIDIA GeForce GTX 970

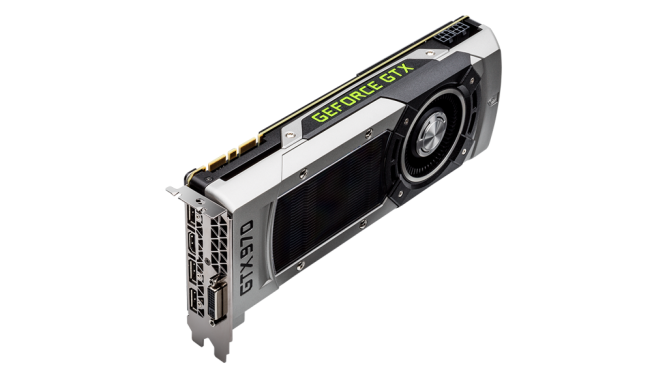
The Nvidia GeForce GTX 970 is a high end desktop graphics card based on the Maxwell architecture. As the faster GTX 980, the GTX 970 uses the GM204 chip, but with reduced shaders (2048 vs. 1664) and TMUs (128 vs 103). The graphics card is equipped with 4 GB GDDR5 (7 GHz effective). 3.5 GB of the 4 GB are connected with 224 Bit, the rest only with a 32 Bit interface. This can lead to some stuttering or reduced frame rates in games that use the full 4 GB. The similar named mobile GeForce GTX 970M is clearly slower as it features only 1280 shader cores.

Despite the unique memory configuration, the GTX 970 performs on average on par with the older GeForce GTX 780 Ti or a AMD Radeon R9 290X.

The GM204 supports CUDA, 3D Vision, PhysX, GeForce Experience, Surround, GameStream, GPU Boost 2.0, Adaptive Vertical Sync / G-SYNC, SLI, DSR, MFAA and Virtual Reality latency improvements.

The Maxwell architecture is very power efficient. While gaming, the card only uses as much power as the Radeon R9 285 which is more than 35% slower on average.

NVIDIA GeForce GTX 1660 Ti Max-Q

► remove from comparison NVIDIA GeForce GTX 1660 Ti Max-Q

The Nvidia GeForce GTX 1660 Ti with Max-Q Design is a mobile graphics card for laptops that is based on the Turing architecture (TU116 chip). It is designed for thin and light laptops and about 10-15% slower than a regular GTX 1660 Ti for laptops (depending on the cooling capabilities). According to the specifications, the Max-Q variant clocks 22% slower for the base speed and 16% for the boost speed.

Compared to the faster RTX 2000 GPUs (e.g. RTX 2060), the 1660Ti integrates no Raytracing or Tensor cores. The performance is similar to the old GTX 1070 (Max-Q) but at a reduced TGP of 60 Watt (versus 80 of the laptop version 115 Watt of the desktop version). 

In April 2020 Nvidia refreshed the GTX 1660 Ti with the new codename N18E-G0-A1 with similar specs and pin compatible to the refreshed RTX chips (e.g., RTX 2070 Super Mobile).

The Turing generation did not only introduce raytracing for the RTX cards, but also optimized the architecture of the cores and caches. According to Nvidia the CUDA cores offer now a concurrent execution of floating point and integer operations for increased performance in compute-heavy workloads of modern games. Furthermore, the caches were reworked (new unified memory architecture with twice the cache compared to Pascal). This leads to 50% more instructions per clock and a 40% more power efficient usage compared to Pascal.

Nvidia specifies a power consumption of 60 Watt TGP (Total Graphics Power) and therefore 20 Watts lower than a normal (Max-P) 1660Ti for laptops. Therefore, the Max-Q variant is well suited for thin and light gaming laptops. The TU116 chip is manufactured in 12nm FFN at TSMC.

NVIDIA GeForce GTX 970NVIDIA GeForce GTX 1660 Ti Max-Q
GeForce GTX 1600 Series
GeForce GTX 980 SLI (Laptop) compare 4096 @ 1.13 - 1.23 GHz256 Bit @ 3500 MHz
GeForce GTX 980 Ti compare 2816 @ 1 - 1.2 GHz256 Bit @ 7000 MHz
GeForce GTX 980 compare 2048 @ 1.13 - 1.22 GHz256 Bit @ 3500 MHz
GeForce GTX 980 (Laptop) compare 2048 @ 1.13 - 1.23 GHz256 Bit @ 3500 MHz
GeForce GTX 970 1664 @ 1.05 - 1.18 GHz224 + 32 Bit @ 3500 MHz
GeForce GTX 960 compare 1024 @ 1.13 - 1.18 GHz128 Bit @ 3500 MHz
GeForce GTX 950 compare 768 @ 1.02 - 1.19 GHz128 Bit @ 3300 MHz
GeForce GTX 1660 Ti (Desktop) compare 1536 @ 1.5 - 1.77 GHz192 Bit @ 12000 MHz
GeForce GTX 1660 Super (Desktop) compare 1408 @ 1.53 - 1.79 GHz192 Bit @ 14000 MHz
GeForce GTX 1660 Ti Mobile compare 1536 @ 1.46 - 1.59 GHz192 Bit @ 12000 MHz
GeForce GTX 1660 (Desktop) compare 1408 @ 1.53 - 1.79 GHz192 Bit @ 8000 MHz
GeForce GTX 1650 Super (Desktop) compare 1280 @ 1.53 GHz192 Bit @ 14000 MHz
GeForce GTX 1660 Ti Max-Q 1536 @ 1.14 - 1.34 GHz192 Bit @ 12000 MHz
GeForce GTX 1650 Ti Mobile compare 1024 @ 1.35 - 1.49 GHz128 Bit @ 12000 MHz
GeForce GTX 1650 (Desktop) compare 896 @ 1.49 - 1.67 GHz128 Bit @ 8000 MHz
GeForce GTX 1650 Mobile compare 1024 @ 1.38 - 1.56 GHz128 Bit @ 12000 MHz
GeForce GTX 1650 Ti Max-Q compare 1024 @ 1.04 - 1.2 GHz128 Bit @ 10000 MHz
GeForce GTX 1650 Max-Q compare 1024 @ 1.02 - 1.25 GHz128 Bit @ 8000 MHz
CodenameGM204N18E-G0
ArchitectureMaxwellTuring
Pipelines1664 - unified1536 - unified
Core Speed1050 - 1178 (Boost) MHz1140 - 1335 (Boost) MHz
Memory Speed3500 MHz12000 MHz
Memory Bus Width224 + 32 Bit192 Bit
Memory TypeGDDR5GDDR6
Max. Amount of Memory4 GB6 GB
Shared Memorynono
APIDirectX 12_1, OpenGL 4.5DirectX 12_1, OpenGL 4.6
Power Consumption145 Watt60 Watt
Transistors5.2 Billion
technology28 nm12 nm
FeaturesCUDA, 3D Vision, PhysX, GeForce Experience, Surround, GameStream, GPU Boost 2.0, Adaptive Vertical Sync, G-SYNC, SLI
Date of Announcement19.09.2014 23.04.2019
Link to Manufacturer Pagewww.geforce.comwww.nvidia.com
Notebook Sizemedium sized

Benchmarks

Performance Rating - 3DMark 11 + Fire Strike + Time Spy - GeForce GTX 970
4.5 pt (13%)
Restrict / Search: Model: Max. age: years
Performance Rating - 3DMark 11 + Fire Strike + Time Spy - GeForce GTX 1660 Ti Max-Q
5 pt (15%)
Restrict / Search: Model: Max. age: years
3DMark - 3DMark Time Spy Score
3693 Points (10%)
min: 4547     avg: 5197     median: 5072 (13%)     max: 6395 Points
3DMark - 3DMark Time Spy Graphics
3544 Points (7%)
min: 4867     avg: 5089     median: 5084.5 (10%)     max: 5440 Points
3DMark - 3DMark Ice Storm Unlimited Graphics
422295 Points (43%)
min: 220799     avg: 314100     median: 306910 (31%)     max: 414592 Points
3DMark - 3DMark Ice Storm Extreme Graphics
min: 76153     avg: 110626     median: 110626 (13%)     max: 145099 Points
3DMark - 3DMark Cloud Gate Score
min: 23657     avg: 25575     median: 25575 (24%)     max: 27493 Points
min: 16807     avg: 29350     median: 33027 (31%)     max: 39942 Points
3DMark - 3DMark Cloud Gate Graphics
min: 71472     avg: 72819     median: 72819 (18%)     max: 74166 Points
min: 38321     avg: 63736     median: 63086 (16%)     max: 89505 Points
3DMark - 3DMark Fire Strike Standard Score
min: 9399     avg: 9713     median: 9434 (14%)     max: 10307 Points
min: 10103     avg: 11548     median: 11615 (18%)     max: 12739 Points
3DMark - 3DMark Fire Strike Standard Graphics
min: 11155     avg: 11802     median: 11954 (11%)     max: 12296 Points
min: 12903     avg: 13356     median: 13355 (12%)     max: 13870 Points
3DMark - 3DMark Ice Storm Graphics
321805 Points (36%)
min: 59373     avg: 104094     median: 86295 (10%)     max: 166615 Points
3DMark 11 - 3DM11 Performance Score
min: 12033     avg: 13207     median: 13249 (16%)     max: 14339 Points
min: 12279     avg: 15364     median: 15913 (19%)     max: 17377 Points
3DMark 11 - 3DM11 Performance GPU
min: 15071     avg: 15780     median: 16033 (12%)     max: 16237 Points
min: 17010     avg: 17711     median: 17439 (13%)     max: 18653 Points
3DMark Vantage
3DM Vant. Perf. total + NVIDIA GeForce GTX 970
3DMark Vantage - 3DM Vant. Perf. total
42263 Points (12%)
3DM Vant. Perf. total + NVIDIA GeForce GTX 1660 Ti Max-Q
31845 Points (9%)
3DM Vant. Perf. GPU no PhysX + NVIDIA GeForce GTX 970
3DMark Vantage - 3DM Vant. Perf. GPU no PhysX
46855 Points (26%)
3DM Vant. Perf. GPU no PhysX + NVIDIA GeForce GTX 1660 Ti Max-Q
34951 Points (19%)
3DMark 06 3DMark 06 - Standard 1280x1024 + NVIDIA GeForce GTX 970
3DMark 06
37107 Points (48%)
3DMark 06 - Standard 1280x1024 + NVIDIA GeForce GTX 1660 Ti Max-Q
min: 24029     avg: 28247     median: 25211 (33%)     max: 38536 Points
Unigine Valley 1.0 - Unigine Valley 1.0 DX
59.1 fps (18%)
Cinebench R10 Cinebench R10 Shading (32bit) + NVIDIA GeForce GTX 1660 Ti Max-Q
Cinebench R10 - Cinebench R10 Shading (32bit)
min: 6820     avg: 9290     median: 8562.5 (6%)     max: 13213 Points
Cinebench R11.5 Cinebench R11.5 OpenGL 64 Bit + NVIDIA GeForce GTX 970
Cinebench R11.5 - Cinebench R11.5 OpenGL 64 Bit
64.9 fps (21%)
Cinebench R11.5 OpenGL 64 Bit + NVIDIA GeForce GTX 1660 Ti Max-Q
min: 49.83     avg: 59.5     median: 59.5 (20%)     max: 69.2 fps
Cinebench R15
Cinebench R15 OpenGL 64 Bit + NVIDIA GeForce GTX 970
Cinebench R15 - Cinebench R15 OpenGL 64 Bit
141.6 fps (8%)
Cinebench R15 OpenGL 64 Bit + NVIDIA GeForce GTX 1660 Ti Max-Q
min: 78.2     avg: 100.5     median: 96.9 (6%)     max: 130.7 fps
Cinebench R15 OpenGL Ref. Match 64 Bit + NVIDIA GeForce GTX 1660 Ti Max-Q
GFXBench - GFXBench 5.0 Aztec Ruins High Tier Offscreen
110.2 fps (20%)
GFXBench - GFXBench 5.0 Aztec Ruins Normal Tier Offscreen
253.8 fps (19%)
GFXBench - GFXBench Car Chase Offscreen
217 fps (21%)
227.4 fps (21%)
GFXBench 3.1 - GFXBench Manhattan ES 3.1 Offscreen
297 fps (6%)
345.8 fps (7%)
GFXBench 3.0 - GFXBench 3.0 Manhattan Offscreen
396 fps (17%)
360.6 fps (15%)
GFXBench (DX / GLBenchmark) 2.7
GFXBench T-Rex HD Offscreen C24Z16 + NVIDIA GeForce GTX 970
GFXBench (DX / GLBenchmark) 2.7 - GFXBench T-Rex HD Offscreen C24Z16
823 fps (7%)
GFXBench T-Rex HD Offscreen C24Z16 + NVIDIA GeForce GTX 1660 Ti Max-Q
943 fps (8%)
LuxMark v2.0 64Bit - LuxMark v2.0 Room GPU
1874 Samples/s (7%)
2141 Samples/s (8%)
LuxMark v2.0 64Bit - LuxMark v2.0 Sala GPU
3020 Samples/s (5%)
4254 Samples/s (7%)
ComputeMark v2.1 - ComputeMark v2.1 Result
8549 Points (7%)
10027 Points (8%)
Power Consumption - Furmark Stress Test Power Consumption - external Monitor *
316 Watt (43%)
min: 77.6     avg: 86.3     median: 86.3 (12%)     max: 95 Watt
Power Consumption - The Witcher 3 Power Consumption - external Monitor *
267 Watt (37%)
min: 92     avg: 96.6     median: 96.6 (13%)     max: 101.2 Watt
Power Consumption - Witcher 3 Power Consumption *
min: 94.2     avg: 104.8     median: 106.9 (24%)     max: 121 Watt
Power Consumption - Power Efficiency - Witcher 3 ultra
min: 0.4388     avg: 0.5     median: 0.5 (43%)     max: 0.537 fps per Watt
Power Consumption - Power Efficiency - Witcher 3 ultra external Monitor
0.2 fps per Watt (13%)
min: 0.4822     avg: 0.5     median: 0.5 (44%)     max: 0.578 fps per Watt
Emissions Witcher 3 Fan Noise + NVIDIA GeForce GTX 1660 Ti Max-Q
Emissions - Witcher 3 Fan Noise
min: 34     avg: 43.4     median: 43.7 (62%)     max: 53.8 dB(A)
Clock Speed - GPU Clock Witcher 3 ultra
1501 MHz (59%)
Clock Speed - GPU Clock Speed Furmark
1062 MHz (42%)

Average Benchmarks NVIDIA GeForce GTX 970 → 100% n=22

Average Benchmarks NVIDIA GeForce GTX 1660 Ti Max-Q → 102% n=22

- Range of benchmark values for this graphics card
red legend - Average benchmark values for this graphics card
* Smaller numbers mean a higher performance
1 This benchmark is not used for the average calculation

Game Benchmarks

The following benchmarks stem from our benchmarks of review laptops. The performance depends on the used graphics memory, clock rate, processor, system settings, drivers, and operating systems. So the results don't have to be representative for all laptops with this GPU. For detailed information on the benchmark results, click on the fps number.

low 1280x720
GeForce GTX 1660 Ti Max-Q:
55.1  fps
med. 1920x1080
GeForce GTX 1660 Ti Max-Q:
49.4  fps
high 1920x1080
GeForce GTX 1660 Ti Max-Q:
37.1  fps
ultra 1920x1080
GeForce GTX 1660 Ti Max-Q:
25.3  fps
low 1280x720
GeForce GTX 1660 Ti Max-Q:
119  fps
med. 1920x1080
GeForce GTX 1660 Ti Max-Q:
78  fps
high 1920x1080
GeForce GTX 1660 Ti Max-Q:
65  fps
ultra 1920x1080
GeForce GTX 1660 Ti Max-Q:
51  fps
low 1280x720
GeForce GTX 1660 Ti Max-Q:
136.1  fps
med. 1920x1080
GeForce GTX 1660 Ti Max-Q:
87.7  fps
high 1920x1080
GeForce GTX 1660 Ti Max-Q:
81.3  fps
ultra 1920x1080
GeForce GTX 1660 Ti Max-Q:
78.4  fps
F1 2020

F1 2020

2020
low 1280x720
GeForce GTX 1660 Ti Max-Q:
219  fps
med. 1920x1080
GeForce GTX 1660 Ti Max-Q:
130  fps
high 1920x1080
GeForce GTX 1660 Ti Max-Q:
112  fps
ultra 1920x1080
GeForce GTX 1660 Ti Max-Q:
79  fps
low 1280x720
GeForce GTX 1660 Ti Max-Q:
214.7  fps
med. 1920x1080
GeForce GTX 1660 Ti Max-Q:
130.2  fps
high 1920x1080
GeForce GTX 1660 Ti Max-Q:
79.9  fps
ultra 1920x1080
GeForce GTX 1660 Ti Max-Q:
56.1  fps
low 1280x720
GeForce GTX 1660 Ti Max-Q:
168.9  fps
med. 1920x1080
GeForce GTX 1660 Ti Max-Q:
101.7  fps
high 1920x1080
GeForce GTX 1660 Ti Max-Q:
95.4  fps
ultra 1920x1080
GeForce GTX 1660 Ti Max-Q:
93.4  fps
low 1280x720
GeForce GTX 1660 Ti Max-Q:
176.8  fps
med. 1920x1080
GeForce GTX 1660 Ti Max-Q:
81.2  fps
high 1920x1080
GeForce GTX 1660 Ti Max-Q:
63.3  fps
low 1280x720
GeForce GTX 1660 Ti Max-Q:
121.2  fps
med. 1920x1080
GeForce GTX 1660 Ti Max-Q:
98.3  fps
high 1920x1080
GeForce GTX 1660 Ti Max-Q:
90.5  fps
ultra 1920x1080
GeForce GTX 1660 Ti Max-Q:
87.7  fps
low 1280x720
GeForce GTX 1660 Ti Max-Q:
115.1  fps
med. 1920x1080
GeForce GTX 1660 Ti Max-Q:
71.7  fps
high 1920x1080
GeForce GTX 1660 Ti Max-Q:
47.2  fps
ultra 1920x1080
GeForce GTX 1660 Ti Max-Q:
29.4  fps
med. 1920x1080
GeForce GTX 1660 Ti Max-Q:
91.5  fps
high 1920x1080
GeForce GTX 1660 Ti Max-Q:
78.1  fps
ultra 1920x1080
GeForce GTX 1660 Ti Max-Q:
72.4  fps
low 1280x720
GeForce GTX 1660 Ti Max-Q:
95.8  fps
med. 1920x1080
GeForce GTX 1660 Ti Max-Q:
83  fps
high 1920x1080
GeForce GTX 1660 Ti Max-Q:
73.9  fps
ultra 1920x1080
GeForce GTX 1660 Ti Max-Q:
66.9  fps
low 1280x720
GeForce GTX 1660 Ti Max-Q:
135.2  fps
med. 1920x1080
GeForce GTX 1660 Ti Max-Q:
88  fps
high 1920x1080
GeForce GTX 1660 Ti Max-Q:
72.6  fps
ultra 1920x1080
GeForce GTX 1660 Ti Max-Q:
62.6  fps
GRID 2019

GRID 2019

2019
low 1280x720
GeForce GTX 1660 Ti Max-Q:
112.9  fps
med. 1920x1080
GeForce GTX 1660 Ti Max-Q:
86.5  fps
high 1920x1080
GeForce GTX 1660 Ti Max-Q:
72  fps
ultra 1920x1080
GeForce GTX 1660 Ti Max-Q:
58.7  fps
low 1280x720
GeForce GTX 1660 Ti Max-Q:
83 114 ~ 99 fps
med. 1920x1080
GeForce GTX 1660 Ti Max-Q:
68 72 ~ 70 fps
high 1920x1080
100%
GeForce GTX 970:
52  fps
127%
GeForce GTX 1660 Ti Max-Q:
65 66 ~ 66 fps
ultra 1920x1080
100%
GeForce GTX 970:
36  fps
139%
GeForce GTX 1660 Ti Max-Q:
48 51 ~ 50 fps
FIFA 20

FIFA 20

2019
low 1280x720
GeForce GTX 1660 Ti Max-Q:
147.9  fps
med. 1920x1080
GeForce GTX 1660 Ti Max-Q:
145.4  fps
high 1920x1080
GeForce GTX 1660 Ti Max-Q:
141  fps
ultra 1920x1080
GeForce GTX 1660 Ti Max-Q:
139.3  fps
QHD 2560x1440
100%
GeForce GTX 970:
153  fps
4K 3840x2160
100%
GeForce GTX 970:
86  fps
low 1280x720
GeForce GTX 1660 Ti Max-Q:
87 116.5 ~ 102 fps
med. 1920x1080
100%
GeForce GTX 970:
74  fps
104%
GeForce GTX 1660 Ti Max-Q:
72.1 81.5 ~ 77 fps
high 1920x1080
100%
GeForce GTX 970:
48.6  fps
111%
GeForce GTX 1660 Ti Max-Q:
52.9 54.9 ~ 54 fps
ultra 1920x1080
100%
GeForce GTX 970:
36.7  fps
114%
GeForce GTX 1660 Ti Max-Q:
41.5 42.3 ~ 42 fps
Control

Control

2019
low 1280x720
100%
GeForce GTX 970:
153  fps
103%
GeForce GTX 1660 Ti Max-Q:
158.3  fps
med. 1920x1080
100%
GeForce GTX 970:
50  fps
127%
GeForce GTX 1660 Ti Max-Q:
63.7  fps
high 1920x1080
100%
GeForce GTX 970:
36  fps
131%
GeForce GTX 1660 Ti Max-Q:
47.1  fps
QHD 2560x1440
100%
GeForce GTX 970:
22.8  fps
F1 2019

F1 2019

2019
low 1280x720
GeForce GTX 1660 Ti Max-Q:
155 183 ~ 169 fps
med. 1920x1080
GeForce GTX 1660 Ti Max-Q:
119 140 ~ 130 fps
high 1920x1080
100%
GeForce GTX 970:
110  fps
102%
GeForce GTX 1660 Ti Max-Q:
106 117 ~ 112 fps
ultra 1920x1080
100%
GeForce GTX 970:
72  fps
103%
GeForce GTX 1660 Ti Max-Q:
71 77 ~ 74 fps
QHD 2560x1440
100%
GeForce GTX 970:
49.3  fps
4K 3840x2160
100%
GeForce GTX 970:
30.3  fps
low 1280x720
GeForce GTX 1660 Ti Max-Q:
144.1 209.4 ~ 177 fps
med. 1920x1080
GeForce GTX 1660 Ti Max-Q:
76.5 93.1 ~ 85 fps
high 1920x1080
GeForce GTX 1660 Ti Max-Q:
54.7 57.1 ~ 56 fps
ultra 1920x1080
GeForce GTX 1660 Ti Max-Q:
41.1 41.6 ~ 41 fps
Rage 2

Rage 2

2019
low 1280x720
GeForce GTX 1660 Ti Max-Q:
146.4 154.7 ~ 151 fps
med. 1920x1080
GeForce GTX 1660 Ti Max-Q:
70.9 76.2 ~ 74 fps
high 1920x1080
GeForce GTX 1660 Ti Max-Q:
58.7 65.8 ~ 62 fps
ultra 1920x1080
GeForce GTX 1660 Ti Max-Q:
58.2 64.8 ~ 62 fps
Anno 1800

Anno 1800

2019
low 1280x720
GeForce GTX 1660 Ti Max-Q:
59.6 87.9 ~ 74 fps
med. 1920x1080
GeForce GTX 1660 Ti Max-Q:
58.7 83.2 ~ 71 fps
high 1920x1080
GeForce GTX 1660 Ti Max-Q:
45.3 64.1 ~ 55 fps
ultra 1920x1080
GeForce GTX 1660 Ti Max-Q:
26 33.2 ~ 30 fps
low 1280x720
GeForce GTX 1660 Ti Max-Q:
110 142 ~ 126 fps
med. 1920x1080
GeForce GTX 1660 Ti Max-Q:
80 87 ~ 84 fps
high 1920x1080
GeForce GTX 1660 Ti Max-Q:
66 69 ~ 68 fps
ultra 1920x1080
GeForce GTX 1660 Ti Max-Q:
49 50 ~ 50 fps
low 1280x720
GeForce GTX 1660 Ti Max-Q:
181.2 194.2 ~ 188 fps
med. 1920x1080
GeForce GTX 1660 Ti Max-Q:
102.6 139.9 ~ 121 fps
high 1920x1080
GeForce GTX 1660 Ti Max-Q:
88.7 103.2 ~ 96 fps
ultra 1920x1080
100%
GeForce GTX 970:
46.7  fps
124%
GeForce GTX 1660 Ti Max-Q:
57.3 59.2 ~ 58 fps
QHD 2560x1440
100%
GeForce GTX 970:
35  fps
4K 3840x2160
100%
GeForce GTX 970:
20.6  fps
Anthem

Anthem

2019
low 1280x720
GeForce GTX 1660 Ti Max-Q:
53.6  fps
med. 1920x1080
GeForce GTX 1660 Ti Max-Q:
48.9  fps
high 1920x1080
GeForce GTX 1660 Ti Max-Q:
48.8  fps
ultra 1920x1080
GeForce GTX 1660 Ti Max-Q:
46.4  fps
low 1280x720
GeForce GTX 1660 Ti Max-Q:
97  fps
med. 1920x1080
GeForce GTX 1660 Ti Max-Q:
81  fps
high 1920x1080
GeForce GTX 1660 Ti Max-Q:
78  fps
ultra 1920x1080
GeForce GTX 1660 Ti Max-Q:
71  fps
low 1280x720
100%
GeForce GTX 970:
99  fps
104%
GeForce GTX 1660 Ti Max-Q:
83.5 96.6 129.5 ~ 103 fps
med. 1920x1080
100%
GeForce GTX 970:
49  fps
122%
GeForce GTX 1660 Ti Max-Q:
53.9 60 66.5 ~ 60 fps
high 1920x1080
100%
GeForce GTX 970:
37.2  fps
126%
GeForce GTX 1660 Ti Max-Q:
45.1 46.6 49.1 ~ 47 fps
ultra 1920x1080
100%
GeForce GTX 970:
31.1  fps
119%
GeForce GTX 1660 Ti Max-Q:
35.1 36.8 38.3 ~ 37 fps
QHD 2560x1440
100%
GeForce GTX 970:
23.9  fps
4K 3840x2160
100%
GeForce GTX 970:
13.2  fps
low 1280x720
GeForce GTX 1660 Ti Max-Q:
144 144 ~ 144 fps
med. 1920x1080
GeForce GTX 1660 Ti Max-Q:
105.3 133.9 ~ 120 fps
high 1920x1080
GeForce GTX 1660 Ti Max-Q:
90.1 99.6 ~ 95 fps
ultra 1920x1080
100%
GeForce GTX 970:
70  fps
134%
GeForce GTX 1660 Ti Max-Q:
89 99.6 ~ 94 fps
QHD 2560x1440
100%
GeForce GTX 970:
45.5  fps
4K 3840x2160
100%
GeForce GTX 970:
23.3  fps
ultra 1920x1080
100%
GeForce GTX 970:
57.8  fps
4K 3840x2160
100%
GeForce GTX 970:
19.9  fps
low 1280x720
GeForce GTX 1660 Ti Max-Q:
135.6  fps
med. 1920x1080
GeForce GTX 1660 Ti Max-Q:
85.8  fps
high 1920x1080
GeForce GTX 1660 Ti Max-Q:
77.4  fps
ultra 1920x1080
100%
GeForce GTX 970:
68  fps
107%
GeForce GTX 1660 Ti Max-Q:
72.8  fps
4K 3840x2160
100%
GeForce GTX 970:
20.6  fps
low 1280x720
GeForce GTX 1660 Ti Max-Q:
94.3 117.4 152 ~ 121 fps
med. 1920x1080
GeForce GTX 1660 Ti Max-Q:
74.6 82.9 102.6 ~ 87 fps
high 1920x1080
GeForce GTX 1660 Ti Max-Q:
65.9 77.5 92.2 ~ 79 fps
ultra 1920x1080
100%
GeForce GTX 970:
47.5  fps
154%
GeForce GTX 1660 Ti Max-Q:
61 73 85 ~ 73 fps
4K 3840x2160
100%
GeForce GTX 970:
19.7  fps
192%
GeForce GTX 1660 Ti Max-Q:
37.9  fps
ultra 1920x1080
100%
GeForce GTX 970:
59.8  fps
QHD 2560x1440
100%
GeForce GTX 970:
47.9  fps
Hitman 2

Hitman 2

2018
ultra 1920x1080
100%
GeForce GTX 970:
58.1 61 ~ 60 fps
low 1280x720
GeForce GTX 1660 Ti Max-Q:
115.2  fps
med. 1920x1080
GeForce GTX 1660 Ti Max-Q:
87.9  fps
high 1920x1080
GeForce GTX 1660 Ti Max-Q:
84.6  fps
ultra 1920x1080
GeForce GTX 1660 Ti Max-Q:
83.1  fps
low 1280x720
GeForce GTX 1660 Ti Max-Q:
48 64 90 ~ 67 fps
med. 1920x1080
GeForce GTX 1660 Ti Max-Q:
43 56 71 ~ 57 fps
high 1920x1080
GeForce GTX 1660 Ti Max-Q:
39 51 60 ~ 50 fps
ultra 1920x1080
GeForce GTX 1660 Ti Max-Q:
33 42 44 ~ 40 fps
low 1280x720
GeForce GTX 1660 Ti Max-Q:
62 82 113 126 ~ 96 fps
med. 1920x1080
GeForce GTX 1660 Ti Max-Q:
53 57 83 85 ~ 70 fps
high 1920x1080
GeForce GTX 1660 Ti Max-Q:
52 53 74 75 ~ 64 fps
ultra 1920x1080
GeForce GTX 1660 Ti Max-Q:
49 49 64 67 ~ 57 fps
F1 2018

F1 2018

2018
high 1920x1080
100%
GeForce GTX 970:
98  fps
ultra 1920x1080
100%
GeForce GTX 970:
63  fps
4K 3840x2160
100%
GeForce GTX 970:
25.9  fps
low 1280x720
GeForce GTX 1660 Ti Max-Q:
66.9  fps
med. 1920x1080
GeForce GTX 1660 Ti Max-Q:
59.3  fps
high 1920x1080
GeForce GTX 1660 Ti Max-Q:
59.5  fps
ultra 1920x1080
GeForce GTX 1660 Ti Max-Q:
50.8  fps
Far Cry 5

Far Cry 5

2018
low 1280x720
GeForce GTX 1660 Ti Max-Q:
68 103 ~ 86 fps
med. 1920x1080
GeForce GTX 1660 Ti Max-Q:
54 84 ~ 69 fps
high 1920x1080
GeForce GTX 1660 Ti Max-Q:
53 79 ~ 66 fps
ultra 1920x1080
GeForce GTX 1660 Ti Max-Q:
50 74 ~ 62 fps
4K 3840x2160
GeForce GTX 1660 Ti Max-Q:
30  fps
World of Tanks enCore

World of Tanks enCore

2018
low 1366x768
GeForce GTX 1660 Ti Max-Q:
376.8  fps
med. 1920x1080
GeForce GTX 1660 Ti Max-Q:
215.9  fps
ultra 1920x1080
GeForce GTX 1660 Ti Max-Q:
117.3  fps
low 1280x720
GeForce GTX 1660 Ti Max-Q:
60.6 68.8 93.7 102.3 ~ 81 fps
med. 1920x1080
GeForce GTX 1660 Ti Max-Q:
54.5 62.9 80.4 88.1 ~ 71 fps
high 1920x1080
GeForce GTX 1660 Ti Max-Q:
47.8 55.4 67.8 75.4 ~ 62 fps
low 1280x720
GeForce GTX 1660 Ti Max-Q:
125.6  fps
med. 1920x1080
GeForce GTX 1660 Ti Max-Q:
91.7  fps
high 1920x1080
GeForce GTX 1660 Ti Max-Q:
77.3  fps
ultra 1920x1080
GeForce GTX 1660 Ti Max-Q:
53.7  fps
low 1280x720
100%
GeForce GTX 970:
101  fps
104%
GeForce GTX 1660 Ti Max-Q:
78.4 106.4 131 ~ 105 fps
med. 1920x1080
100%
GeForce GTX 970:
55.3  fps
123%
GeForce GTX 1660 Ti Max-Q:
60.3 70.3 74.1 ~ 68 fps
high 1920x1080
100%
GeForce GTX 970:
35.6  fps
140%
GeForce GTX 1660 Ti Max-Q:
44.9 50 54.6 ~ 50 fps
4K 3840x2160
100%
GeForce GTX 970:
12.8  fps
Fortnite

Fortnite

2018
low 1280x720
GeForce GTX 1660 Ti Max-Q:
138  fps
med. 1920x1080
GeForce GTX 1660 Ti Max-Q:
92.2  fps
high 1920x1080
100%
GeForce GTX 970:
82  fps
109%
GeForce GTX 1660 Ti Max-Q:
89.5  fps
ultra 1920x1080
100%
GeForce GTX 970:
60  fps
131%
GeForce GTX 1660 Ti Max-Q:
78.6  fps
4K 3840x2160
100%
GeForce GTX 970:
22  fps
ultra 1920x1080
100%
GeForce GTX 970:
66  fps
4K 3840x2160
100%
GeForce GTX 970:
9.4  fps
ultra 1920x1080
100%
GeForce GTX 970:
76  fps
4K 3840x2160
100%
GeForce GTX 970:
24.8  fps
low 1280x720
GeForce GTX 1660 Ti Max-Q:
91  fps
med. 1920x1080
GeForce GTX 1660 Ti Max-Q:
82  fps
high 1920x1080
GeForce GTX 1660 Ti Max-Q:
72  fps
ultra 1920x1080
GeForce GTX 1660 Ti Max-Q:
61  fps
ultra 1920x1080
100%
GeForce GTX 970:
52.1  fps
4K 3840x2160
100%
GeForce GTX 970:
17.8  fps
Dirt 4

Dirt 4

2017
ultra 1920x1080
100%
GeForce GTX 970:
46.5  fps
4K 3840x2160
100%
GeForce GTX 970:
28.6  fps
low 1280x720
GeForce GTX 1660 Ti Max-Q:
206.7 247.4 ~ 227 fps
med. 1920x1080
GeForce GTX 1660 Ti Max-Q:
160.8 212.1 ~ 186 fps
high 1920x1080
100%
GeForce GTX 970:
126  fps
125%
GeForce GTX 1660 Ti Max-Q:
141.7 173.7 ~ 158 fps
4K 3840x2160
100%
GeForce GTX 970:
60.8  fps
high 1920x1080
100%
GeForce GTX 970:
56.9  fps
ultra 1920x1080
100%
GeForce GTX 970:
50.5  fps
4K 3840x2160
100%
GeForce GTX 970:
20.2  fps
low 1280x720
100%
GeForce GTX 970:
138  fps
94%
GeForce GTX 1660 Ti Max-Q:
130.4  fps
med. 1920x1080
100%
GeForce GTX 970:
70.5  fps
111%
GeForce GTX 1660 Ti Max-Q:
78.1  fps
high 1920x1080
100%
GeForce GTX 970:
64.5  fps
112%
GeForce GTX 1660 Ti Max-Q:
72.4  fps
ultra 1920x1080
100%
GeForce GTX 970:
33.8  fps
123%
GeForce GTX 1660 Ti Max-Q:
41.5  fps
4K 3840x2160
100%
GeForce GTX 970:
22.1  fps
For Honor

For Honor

2017
4K 3840x2160
100%
GeForce GTX 970:
31.8  fps
ultra 1920x1080
100%
GeForce GTX 970:
88  fps
4K 3840x2160
100%
GeForce GTX 970:
30.7  fps
high 1920x1080
100%
GeForce GTX 970:
65.5  fps
ultra 1920x1080
100%
GeForce GTX 970:
34.8  fps
4K 3840x2160
100%
GeForce GTX 970:
23.3  fps
low 1280x720
100%
GeForce GTX 970:
106  fps
med. 1366x768
100%
GeForce GTX 970:
100  fps
high 1920x1080
100%
GeForce GTX 970:
60  fps
ultra 1920x1080
100%
GeForce GTX 970:
57  fps
4K 3840x2160
100%
GeForce GTX 970:
28.5  fps
high 1920x1080
100%
GeForce GTX 970:
92  fps
ultra 1920x1080
100%
GeForce GTX 970:
87  fps
4K 3840x2160
100%
GeForce GTX 970:
32.6  fps
high 1920x1080
100%
GeForce GTX 970:
59.1  fps
ultra 1920x1080
100%
GeForce GTX 970:
87  fps
4K 3840x2160
100%
GeForce GTX 970:
76  fps
ultra 1920x1080
100%
GeForce GTX 970:
87  fps
4K 3840x2160
100%
GeForce GTX 970:
37.5  fps
ultra 1920x1080
100%
GeForce GTX 970:
68  fps
4K 3840x2160
100%
GeForce GTX 970:
57.5  fps
Mafia 3

Mafia 3

2016
med. 1366x768
100%
GeForce GTX 970:
59.9  fps
high 1920x1080
100%
GeForce GTX 970:
32  fps
4K 3840x2160
100%
GeForce GTX 970:
14.1  fps
FIFA 17

FIFA 17

2016
ultra 1920x1080
100%
GeForce GTX 970:
273  fps
4K 3840x2160
100%
GeForce GTX 970:
107  fps
high 1920x1080
100%
GeForce GTX 970:
51.9  fps
ultra 1920x1080
100%
GeForce GTX 970:
28.1  fps
4K 3840x2160
100%
GeForce GTX 970:
16.5  fps
low 1280x720
100%
GeForce GTX 970:
151.3  fps
med. 1366x768
100%
GeForce GTX 970:
136.8  fps
high 1920x1080
100%
GeForce GTX 970:
80.8  fps
ultra 1920x1080
100%
GeForce GTX 970:
72 73 ~ 73 fps
4K 3840x2160
100%
GeForce GTX 970:
26.1  fps
Overwatch

Overwatch

2016
low 1280x720
GeForce GTX 1660 Ti Max-Q:
193.7  fps
med. 1366x768
100%
GeForce GTX 970:
287.8  fps
high 1920x1080
100%
GeForce GTX 970:
187.5  fps
75%
GeForce GTX 1660 Ti Max-Q:
140.7  fps
ultra 1920x1080
100%
GeForce GTX 970:
107 109.9 ~ 108 fps
107%
GeForce GTX 1660 Ti Max-Q:
116  fps
4K 3840x2160
100%
GeForce GTX 970:
58.2  fps
Doom

Doom

2016
low 1280x720
100%
GeForce GTX 970:
170.1  fps
med. 1366x768
100%
GeForce GTX 970:
161.2  fps
high 1920x1080
100%
GeForce GTX 970:
108.8  fps
ultra 1920x1080
100%
GeForce GTX 970:
96 102.5 ~ 99 fps
4K 3840x2160
100%
GeForce GTX 970:
34.3  fps
low 1280x768
100%
GeForce GTX 970:
80.8  fps
med. 1920x1080
100%
GeForce GTX 970:
60.8  fps
70%
GeForce GTX 1660 Ti Max-Q:
42.4  fps
high 1920x1080
100%
GeForce GTX 970:
54.8  fps
74%
GeForce GTX 1660 Ti Max-Q:
40.7  fps
4K 3840x2160
100%
GeForce GTX 970:
20.6  fps
ultra 1920x1080
100%
GeForce GTX 970:
70  fps
4K 3840x2160
100%
GeForce GTX 970:
31  fps
low 1280x720
100%
GeForce GTX 970:
68.3  fps
med. 1366x768
100%
GeForce GTX 970:
67.2  fps
high 1920x1080
100%
GeForce GTX 970:
54.5  fps
ultra 1920x1080
100%
GeForce GTX 970:
52 52.3 ~ 52 fps
4K 3840x2160
100%
GeForce GTX 970:
23  fps
low 1280x720
100%
GeForce GTX 970:
191.1  fps
med. 1366x768
100%
GeForce GTX 970:
138.1  fps
high 1920x1080
100%
GeForce GTX 970:
72  fps
ultra 1920x1080
100%
GeForce GTX 970:
55 55.5 ~ 55 fps
4K 3840x2160
100%
GeForce GTX 970:
27  fps
low 1280x720
100%
GeForce GTX 970:
112  fps
med. 1920x1080
100%
GeForce GTX 970:
100  fps
high 1920x1080
100%
GeForce GTX 970:
80  fps
ultra 1920x1080
100%
GeForce GTX 970:
52 57 ~ 55 fps
4K 3840x2160
100%
GeForce GTX 970:
27  fps
XCOM 2

XCOM 2

2016
low 1280x720
100%
GeForce GTX 970:
88.2  fps
med. 1920x1080
100%
GeForce GTX 970:
75.5  fps
high 1920x1080
100%
GeForce GTX 970:
59.2  fps
ultra 1920x1080
100%
GeForce GTX 970:
27.3 27.9 ~ 28 fps
4K 3840x2160
100%
GeForce GTX 970:
15.9  fps
low 1024x768
100%
GeForce GTX 970:
159.1  fps
59%
GeForce GTX 1660 Ti Max-Q:
93.7  fps
med. 1366x768
100%
GeForce GTX 970:
127.7  fps
high 1920x1080
100%
GeForce GTX 970:
75.9  fps
96%
GeForce GTX 1660 Ti Max-Q:
72.7  fps
ultra 1920x1080
100%
GeForce GTX 970:
60.2 64.5 ~ 62 fps
104%
GeForce GTX 1660 Ti Max-Q:
64.5  fps
4K 3840x2160
100%
GeForce GTX 970:
25.3  fps
low 1024x768
100%
GeForce GTX 970:
248.3 315 ~ 282 fps
83%
GeForce GTX 1660 Ti Max-Q:
232.8  fps
med. 1366x768
100%
GeForce GTX 970:
215.6 244 ~ 230 fps
87%
GeForce GTX 1660 Ti Max-Q:
200.1  fps
high 1920x1080
100%
GeForce GTX 970:
142 142.9 ~ 142 fps
115%
GeForce GTX 1660 Ti Max-Q:
163.6  fps
ultra 1920x1080
100%
GeForce GTX 970:
120 121.6 ~ 121 fps
123%
GeForce GTX 1660 Ti Max-Q:
148.8  fps
4K 3840x2160
100%
GeForce GTX 970:
44.8  fps
med. 1366x768
100%
GeForce GTX 970:
101.1  fps
high 1920x1080
100%
GeForce GTX 970:
86.4  fps
ultra 1920x1080
100%
GeForce GTX 970:
77.4 80 ~ 79 fps
4K 3840x2160
100%
GeForce GTX 970:
33.5  fps
med. 1366x768
100%
GeForce GTX 970:
188.9  fps
high 1920x1080
100%
GeForce GTX 970:
110 112.9 ~ 111 fps
ultra 1920x1080
100%
GeForce GTX 970:
94 97.7 ~ 96 fps
4K 3840x2160
100%
GeForce GTX 970:
34.7  fps
low 1024x768
100%
GeForce GTX 970:
81.8  fps
med. 1366x768
100%
GeForce GTX 970:
75.5  fps
high 1920x1080
100%
GeForce GTX 970:
74.9  fps
ultra 1920x1080
100%
GeForce GTX 970:
31.9 32 ~ 32 fps
4K 3840x2160
100%
GeForce GTX 970:
25.2  fps
Fallout 4

Fallout 4

2015
med. 1366x768
100%
GeForce GTX 970:
131.7  fps
high 1920x1080
100%
GeForce GTX 970:
91.4  fps
ultra 1920x1080
100%
GeForce GTX 970:
73 74 ~ 74 fps
4K 3840x2160
100%
GeForce GTX 970:
30  fps
4K 3840x2160
100%
GeForce GTX 970:
29.7  fps
Anno 2205

Anno 2205

2015
med. 1366x768
100%
GeForce GTX 970:
126.2  fps
high 1920x1080
100%
GeForce GTX 970:
92  fps
ultra 1920x1080
100%
GeForce GTX 970:
26.8 27.7 ~ 27 fps
4K 3840x2160
100%
GeForce GTX 970:
34.1  fps
FIFA 16

FIFA 16

2015
ultra 1920x1080
100%
GeForce GTX 970:
243 264 ~ 254 fps
4K 3840x2160
100%
GeForce GTX 970:
114  fps
ultra 1920x1080
100%
GeForce GTX 970:
153  fps
4K 3840 x 2160
100%
GeForce GTX 970:
58.6  fps
low 1024x768
100%
GeForce GTX 970:
60  fps
100%
GeForce GTX 1660 Ti Max-Q:
60  fps
med. 1366x768
100%
GeForce GTX 970:
60  fps
high 1920x1080
100%
GeForce GTX 970:
60  fps
100%
GeForce GTX 1660 Ti Max-Q:
60  fps
ultra 1920x1080
100%
GeForce GTX 970:
59.9  fps
100%
GeForce GTX 1660 Ti Max-Q:
60  fps
4K 3840x2160
100%
GeForce GTX 970:
46  fps
Mad Max

Mad Max

2015
med. 1366x768
100%
GeForce GTX 970:
237.9  fps
high 1920x1080
100%
GeForce GTX 970:
139.3  fps
ultra 1920x1080
100%
GeForce GTX 970:
125 127.1 ~ 126 fps
4K 3840x2160
100%
GeForce GTX 970:
44  fps
low 1280x720
GeForce GTX 1660 Ti Max-Q:
93.3 113 119 ~ 108 fps
med. 1366x768
GeForce GTX 1660 Ti Max-Q:
88.7 102.1 112 ~ 101 fps
high 1920x1080
GeForce GTX 1660 Ti Max-Q:
81.4 93.8 106 ~ 94 fps
ultra 1920x1080
GeForce GTX 1660 Ti Max-Q:
75.7 86.3 103 ~ 88 fps
low 1280x720
GeForce GTX 1660 Ti Max-Q:
89  fps
high 1920x1080
GeForce GTX 1660 Ti Max-Q:
69  fps
ultra 1920x1080
GeForce GTX 1660 Ti Max-Q:
51  fps
low 1024x768
GeForce GTX 1660 Ti Max-Q:
138.4 144.5 186.8 243 256.8 257.5 258.3 ~ 212 fps
med. 1366x768
100%
GeForce GTX 970:
146.2  fps
105%
GeForce GTX 1660 Ti Max-Q:
111.4 142.6 162.6 166.4 166.5 173.3 ~ 154 fps
high 1920x1080
100%
GeForce GTX 970:
81.2  fps
108%
GeForce GTX 1660 Ti Max-Q:
64.4 83.9 89.9 92.1 94.5 95.2 95.3 ~ 88 fps
ultra 1920x1080
100%
GeForce GTX 970:
42.2 42.8 ~ 43 fps
116%
GeForce GTX 1660 Ti Max-Q:
44.8 48.5 48.8 51.3 52.2 53.1 53.2 ~ 50 fps
4K 3840x2160
100%
GeForce GTX 970:
29.1  fps
106%
GeForce GTX 1660 Ti Max-Q:
30.9  fps
med. 1366x768
100%
GeForce GTX 970:
139.3  fps
high 1920x1080
100%
GeForce GTX 970:
108.7  fps
ultra 1920x1080
100%
GeForce GTX 970:
90.3 97 ~ 94 fps
4K 3840x2160
100%
GeForce GTX 970:
143  fps
GTA V

GTA V

2015
low 1024x768
100%
GeForce GTX 970:
167.9  fps
96%
GeForce GTX 1660 Ti Max-Q:
161.3  fps
med. 1366x768
100%
GeForce GTX 970:
159  fps
95%
GeForce GTX 1660 Ti Max-Q:
151.5  fps
high 1920x1080
100%
GeForce GTX 970:
97.8  fps
117%
GeForce GTX 1660 Ti Max-Q:
114.6  fps
ultra 1920x1080
100%
GeForce GTX 970:
39.8 47.7 ~ 44 fps
135%
GeForce GTX 1660 Ti Max-Q:
59.6  fps
4K 3840x2160
100%
GeForce GTX 970:
41.3 51.4 ~ 46 fps
low 1024x768
100%
GeForce GTX 970:
176  fps
med. 1366x768
100%
GeForce GTX 970:
171.1  fps
high 1920x1080
100%
GeForce GTX 970:
129.1  fps
ultra 1920x1080
100%
GeForce GTX 970:
78.4  fps
Evolve

Evolve

2015
low 1024x768
100%
GeForce GTX 970:
211.4  fps
med. 1366x768
100%
GeForce GTX 970:
176.4  fps
high 1920x1080
100%
GeForce GTX 970:
94.6  fps
ultra 1920x1080
100%
GeForce GTX 970:
85.7  fps
low 1024x768
100%
GeForce GTX 970:
175.3  fps
med. 1366x768
100%
GeForce GTX 970:
171.4  fps
high 1920x1080
100%
GeForce GTX 970:
79.5  fps
ultra 1920x1080
100%
GeForce GTX 970:
54.2 67.4 ~ 61 fps
Far Cry 4

Far Cry 4

2014
low 1024x768
100%
GeForce GTX 970:
130.8  fps
med. 1366x768
100%
GeForce GTX 970:
130.6  fps
high 1920x1080
100%
GeForce GTX 970:
89.6  fps
ultra 1920x1080
100%
GeForce GTX 970:
67.9  fps
low 1024x768
100%
GeForce GTX 970:
219.4  fps
med. 1366x768
100%
GeForce GTX 970:
162  fps
high 1920x1080
100%
GeForce GTX 970:
125.3  fps
ultra 1920x1080
100%
GeForce GTX 970:
77  fps
F1 2014

F1 2014

2014
low 1024x768
100%
GeForce GTX 970:
118  fps
med. 1366x768
100%
GeForce GTX 970:
118  fps
high 1920x1080
100%
GeForce GTX 970:
118  fps
ultra 1920x1080
100%
GeForce GTX 970:
118  fps
low 1024x768
100%
GeForce GTX 970:
64  fps
med. 1366x768
100%
GeForce GTX 970:
63.7  fps
high 1920x1080
100%
GeForce GTX 970:
62.7  fps
ultra 1920x1080
100%
GeForce GTX 970:
61.4  fps
low 1024x768
100%
GeForce GTX 970:
291.6  fps
med. 1366x768
100%
GeForce GTX 970:
272.1  fps
high 1920x1080
100%
GeForce GTX 970:
160.5  fps
ultra 1920x1080
100%
GeForce GTX 970:
112.9  fps
low 1280x720
100%
GeForce GTX 970:
238.4  fps
med. 1344x756
100%
GeForce GTX 970:
186.9  fps
high 1920x1080
100%
GeForce GTX 970:
100.8  fps
ultra 1920x1080
100%
GeForce GTX 970:
76.9 80 ~ 78 fps
Fifa 15

Fifa 15

2014
low 1280x720
100%
GeForce GTX 970:
419.6  fps
high 1366x768
100%
GeForce GTX 970:
357.7  fps
ultra 1920x1080
100%
GeForce GTX 970:
297.2  fps
4K 3840x2160
100%
GeForce GTX 970:
150.5  fps
Sims 4

Sims 4

2014
low 1024x768
100%
GeForce GTX 970:
183.9  fps
med. 1366x768
100%
GeForce GTX 970:
167.7  fps
high 1920x1080
100%
GeForce GTX 970:
140  fps
ultra 1920x1080
100%
GeForce GTX 970:
127.3  fps
low 1024x768
100%
GeForce GTX 970:
403.8  fps
med. 1366x768
100%
GeForce GTX 970:
216.2  fps
high 1920x1080
100%
GeForce GTX 970:
187.8  fps
ultra 1920x1080
100%
GeForce GTX 970:
126.8  fps
low 1024x768
100%
GeForce GTX 970:
122.9  fps
med. 1366x768
100%
GeForce GTX 970:
102  fps
high 1920x1080
100%
GeForce GTX 970:
73.4  fps
ultra 1920x1080
100%
GeForce GTX 970:
53.9  fps
Thief

Thief

2014
low 1024x768
100%
GeForce GTX 970:
131  fps
med. 1366x768
100%
GeForce GTX 970:
126.9  fps
high 1366x768
100%
GeForce GTX 970:
121.6  fps
ultra 1920x1080
100%
GeForce GTX 970:
73  fps
low 1024x768
100%
GeForce GTX 970:
199.8  fps
med. 1366x768
100%
GeForce GTX 970:
199.7  fps
high 1366x768
100%
GeForce GTX 970:
195  fps
ultra 1920x1080
100%
GeForce GTX 970:
83.2 94 ~ 89 fps
4K 3840x2160
100%
GeForce GTX 970:
43 47.6 ~ 45 fps
low 1024x768
100%
GeForce GTX 970:
144.2  fps
med. 1366x768
100%
GeForce GTX 970:
143.9  fps
high 1366x768
100%
GeForce GTX 970:
130.9  fps
ultra 1920x1080
100%
GeForce GTX 970:
77.6 90 ~ 84 fps
low 1280x720
100%
GeForce GTX 970:
264.9  fps
98%
GeForce GTX 1660 Ti Max-Q:
183.4 224.2 263.2 294 331.3 ~ 259 fps
med. 1366x768
100%
GeForce GTX 970:
234.4  fps
107%
GeForce GTX 1660 Ti Max-Q:
195.6 249.5 271.9 282 ~ 250 fps
high 1366x768
100%
GeForce GTX 970:
219.2  fps
104%
GeForce GTX 1660 Ti Max-Q:
180.9 226.9 246.8 259.9 ~ 229 fps
ultra 1920x1080
100%
GeForce GTX 970:
107.6 118 ~ 113 fps
104%
GeForce GTX 1660 Ti Max-Q:
102.3 107.4 119.2 126.3 130 ~ 117 fps
low 1024x768
100%
GeForce GTX 970:
554  fps
62%
GeForce GTX 1660 Ti Max-Q:
343.8  fps
med. 1366x768
100%
GeForce GTX 970:
433  fps
75%
GeForce GTX 1660 Ti Max-Q:
322.9  fps
high 1366x768
100%
GeForce GTX 970:
285.8  fps
104%
GeForce GTX 1660 Ti Max-Q:
296.9  fps
ultra 1920x1080
100%
GeForce GTX 970:
122.1 147 ~ 135 fps
123%
GeForce GTX 1660 Ti Max-Q:
166.1  fps
Crysis 3

Crysis 3

2013
low 1024x768
100%
GeForce GTX 970:
167.6  fps
med. 1366x768
100%
GeForce GTX 970:
145.4  fps
high 1366x768
100%
GeForce GTX 970:
111.4  fps
ultra 1920x1080
100%
GeForce GTX 970:
50.6 55 ~ 53 fps

Average Gaming NVIDIA GeForce GTX 970 → 100%

Average Gaming 30-70 fps → 100%

Average Gaming NVIDIA GeForce GTX 1660 Ti Max-Q → 110%

Average Gaming 30-70 fps → 119%

NVIDIA GeForce GTX 970NVIDIA GeForce GTX 1660 Ti Max-Q
lowmed.highultraQHD4Klowmed.highultraQHD4K
Flight Simulator 202055.149.437.125.3
Horizon Zero Dawn119786551
Death Stranding136.187.781.378.4
F1 202021913011279
Gears Tactics214.7130.279.956.1
Doom Eternal168.9101.795.493.4
Hunt Showdown176.881.263.3
Escape from Tarkov121.298.390.587.7
Red Dead Redemption 2115.171.747.229.4
Star Wars Jedi Fallen Order91.578.172.4
Need for Speed Heat95.88373.966.9
Call of Duty Modern Warfare 2019135.28872.662.6
GRID 2019112.986.57258.7
Ghost Recon Breakpoint523699706650
FIFA 2015386147.9145.4141139.3
Borderlands 37448.636.7102775442
Control153503622.8158.363.747.1
F1 20191107249.330.316913011274
Total War: Three Kingdoms177855641
Rage 2151746262
Anno 180074715530
The Division 2126846850
Dirt Rally 2.046.73520.61881219658
Anthem53.648.948.846.4
Far Cry New Dawn97817871
Metro Exodus994937.231.123.913.2103604737
Apex Legends7045.523.31441209594
Darksiders III6820.6135.685.877.472.8
Battlefield V47.519.712187797337.9
Call of Duty Black Ops 4115.287.984.683.1
Assassin´s Creed Odyssey67575040
Shadow of the Tomb Raider96706457
Monster Hunter World66.959.359.550.8
Far Cry 58669666230
World of Tanks enCore376.8215.9117.3
X-Plane 11.11817162
Kingdom Come: Deliverance125.691.777.353.7
Final Fantasy XV Benchmark10155.335.612.81056850
Fortnite82602213892.289.578.6
Middle-earth: Shadow of War91827261
Rocket League12660.8227186158
Ghost Recon Wildlands13870.564.533.822.1130.478.172.441.5
Overwatch287.8187.510858.2193.7140.7116
Ashes of the Singularity80.860.854.820.642.440.7
Rise of the Tomb Raider159.1127.775.96225.393.772.764.5
Rainbow Six Siege28223014212144.8232.8200.1163.6148.8
Metal Gear Solid V60606059.946606060
Dota 2 Reborn1081019488
Batman: Arkham Knight896951
The Witcher 3146.281.24329.1212154885030.9
GTA V167.915997.84446161.3151.5114.659.6
BioShock Infinite264.9234.4219.2113259250229117
Tomb Raider554433285.8135343.8322.9296.9166.1
NVIDIA GeForce GTX 970NVIDIA GeForce GTX 1660 Ti Max-Q
lowmed.highultraQHD4Klowmed.highultraQHD4K
< 30 fps
< 60 fps
< 120 fps
≥ 120 fps


4
7

3
4
7

6
7
5

9
7
2
2
3

1
11
5
2
< 30 fps
< 60 fps
< 120 fps
≥ 120 fps

2
21
28

5
31
13

12
34
6
2
19
23
3


3

For more games that might be playable and a list of all games and graphics cards visit our Gaming List

Add one or more devices and compare

In the following list you can select (and also search for) devices that should be added to the comparison. You can select more than one device.

restrict list:
v1.33
log 29. 19:59:40

#0 ran 0s before starting gpusingle class +0s ... 0s

#1 checking url part for id 6279 +0s ... 0s

#2 checking url part for id 9832 +0s ... 0s

#3 redirected to Ajax server, took 1753811980s time from redirect:0 +0s ... 0s

#4 did not recreate cache, as it is less than 5 days old! Created at Mon, 28 Jul 2025 05:18:01 +0200 +0s ... 0s

#5 composed specs +0.005s ... 0.005s

#6 did output specs +0s ... 0.005s

#7 start showIntegratedCPUs +0s ... 0.005s

#8 getting avg benchmarks for device 6279 +0.018s ... 0.023s

#9 got single benchmarks 6279 +0.005s ... 0.027s

#10 getting avg benchmarks for device 9832 +0.003s ... 0.031s

#11 got single benchmarks 9832 +0.011s ... 0.042s

#12 got avg benchmarks for devices +0s ... 0.042s

#13 min, max, avg, median took s +0.03s ... 0.072s

#14 before gaming benchmark output +0s ... 0.072s

#15 Got 642 rows for game benchmarks. +0.021s ... 0.092s

#16 composed SQL query for gamebenchmarks +0s ... 0.092s

#17 got data and put it in $dataArray +0.004s ... 0.097s

#18 benchmarks composed for output. +0.033s ... 0.129s

#19 calculated avg scores. +0s ... 0.129s

#20 return log +0.003s ... 0.132s

Please share our article, every link counts!
Mail Logo
> Expert Reviews and News on Laptops, Smartphones and Tech Innovations > Benchmarks / Tech > Graphics Card Comparison - Head 2 Head
Redaktion, 2017-09- 8 (Update: 2023-07- 1)