NVIDIA T600 vs NVIDIA GeForce GTX 1050 Max-Q vs NVIDIA GeForce GTX 1050 Ti Max-Q
NVIDIA T600 ► remove from comparison
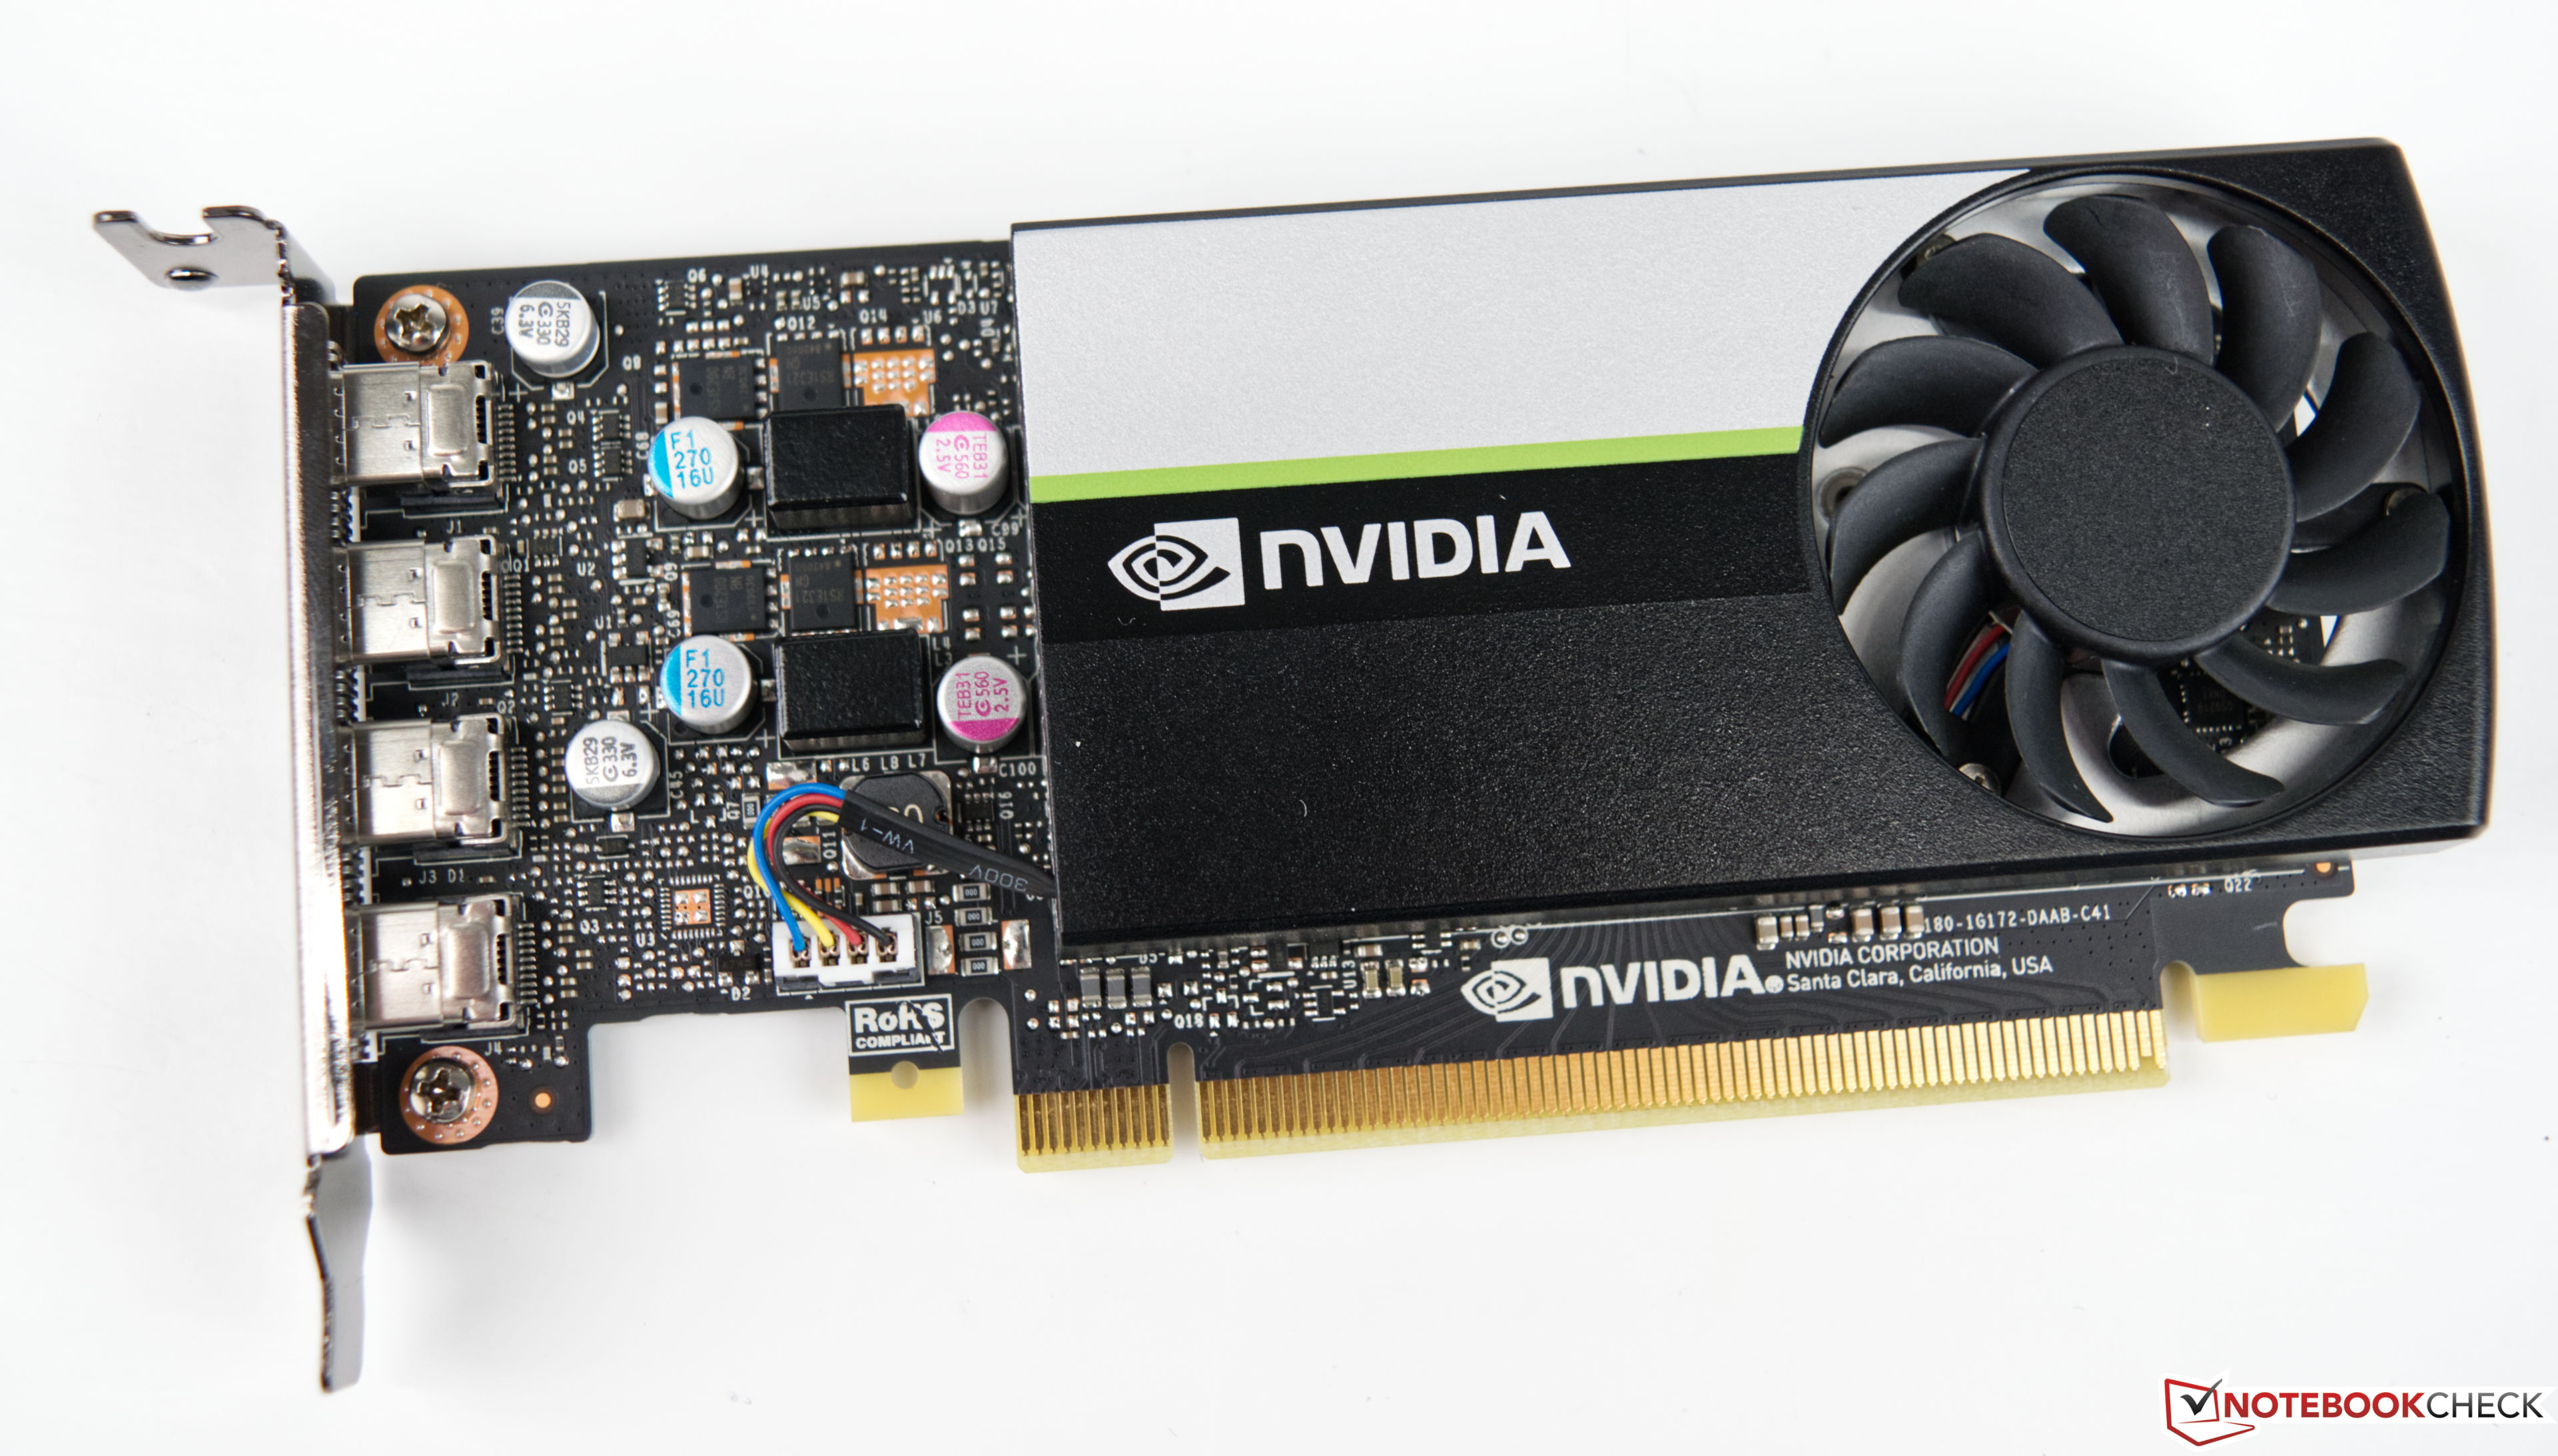
The Nvidia T600 Desktop GPU is a professional graphics card for workstations that is based on the Turing architecture (TU117 chip). The desktop version only offers 640 of the 1024 cores and therefore also less than the T600 mobile (896 CUDA cores). The card offers 4 GB GDDR6 graphics memory connected with a 128 bit bus (up to 160 GB/s bandwidth). The T600 supports certified drivers (former Quadro line) for professional applications like CAD, 3D modelling, DCC, medicine, or visualization applications.
The maximum power consumption of the card is rated at 40W.
NVIDIA GeForce GTX 1050 Max-Q ► remove from comparison
The Nvidia GeForce GTX 1050 with Max-Q design is a mainstream GPU based on the Pascal architecture and was announced in January 2018. Contrary to the faster models, the GTX 1050 uses the GP107 chip, which is manufactured in a 14 nm process at Samsung.
The clock is not the only difference compared to the regular GTX 1050 though. The drivers for the Max-Q version were optimized for efficiency (and not performance; only for Max-Q models), there are optimized voltage converters for 1V operation, high-end cooling methods, and a 40 dB limit for the fan noise (with clock adjustments to ensure this at all times).
Features
The GP107 chip is manufactured in a 14 nm FinFET process at Samsung and offers a number of new features, including support for DisplayPort 1.4 (ready), HDMI 2.0b, HDR, Simultaneous Multi-Projection (SMP) as well as improved H.265 video de- and encoding (PlayReady 3.0). A full list of improvements and the new Pascal desktop GPUs is available in our dedicated Pascal architecture article .
Performance
The performance of the GeForce GTX 1050 Max-Q should be around 10-15 % below a regular GTX 1050 for laptops. This means the GPU is most suited for full HD gaming at high settings (not maximum).
Power Consumption
The power consumption of the GeForce GTX 1050 Max-Q is rated at 34 to 40 Watt and therefore significantly lower than the normal laptop GTX 1050 (53 Watt). Therefore, the Max-Q variant is also suited for thin and light laptops.
NVIDIA GeForce GTX 1050 Ti Max-Q ► remove from comparison
The Nvidia GTX 1050 Ti with Max-Q design is a power efficient mainstream GPU for laptops based on the Pascal architecture and was announced in January 2017. Contrary to the faster models, the GTX 1050 uses the GP107 chip, which is manufactured in a 14 nm process at Samsung.
The clock is not the only difference compared to the regular GTX 1050 Ti though. The drivers for the Max-Q version were optimized for efficiency (and not performance; only for Max-Q models), there are optimized voltage converters for 1V operation, high-end cooling methods, and a 40 dB limit for the fan noise (with clock adjustments to ensure this at all times).
Features
The GP107 chip is manufactured in a 14 nm FinFET process at Samsung and offers a number of new features, including support for DisplayPort 1.4 (ready), HDMI 2.0b, HDR, Simultaneous Multi-Projection (SMP) as well as improved H.265 video de- and encoding (PlayReady 3.0). A full list of improvements and the new Pascal desktop GPUs is available in our dedicated Pascal architecture article .
Performance
The performance of the GeForce GTX 1050 Ti can vary quite a lot depending on the cooling performance of the laptop. Nvidia states that the Max-Q variant should be about 10 to 15% slower than a regular GTX 1050 Ti for laptops. Therefore, the GPU is most suited for Full HD and high quality settings for games of 2016.
Power Consumption
The power consumption of the GeForce GTX 1050 Ti with Max-Q design is rated at 40 to 46 Watt and therefore a lot lower than a regular GTX 1050 Ti for laptops (53 Watt). This means that the Max-Q GTX 1050 Ti is also suited for thin and light laptops.
NVIDIA T600 NVIDIA GeForce GTX 1050 Max-Q NVIDIA GeForce GTX 1050 Ti Max-Q GeForce GTX 1000 Series Architecture Turing Pascal Pascal Pipelines 640 - unified 640 - unified 768 - unified TMUs 40 ROPs 32 Core Speed 735 - 1335 (Boost) MHz 999 - 1189 - 1139 - 1328 (Boost) MHz 1151 – 1290 - 1290 – 1417 (Boost) MHz Memory Speed 10000 effective = 1250 MHz 7000 MHz 7000 MHz Memory Bus Width 128 Bit 128 Bit 128 Bit Memory Type GDDR6 GDDR5 GDDR5 Max. Amount of Memory 4 GB 4 GB 4 GB Shared Memory no no no Memory Bandwidth 160 GB/s API DirectX 12_1, Shader 6.6, OpenGL 4.6, OpenCL 3.0, Vulkan 1.3 DirectX 12_1, OpenGL 4.5 DirectX 12_1, OpenGL 4.5 Power Consumption 40 Watt 34 - 40 Watt 40 - 46 Watt Transistors 4.7 Billion Die Size 200 mm² technology 12 nm 14 nm 16 nm PCIe 3.0 x16 Displays 4 Displays (max.), DisplayPort 4x mini-DisplayPort 1.4a Date of Announcement 12.04.2021 03.01.2018 03.01.2018 Codename N17P-G0 Max-Q N17P-G1 Max-Q Notebook Size large medium sized Link to Manufacturer Page www.nvidia.com www.nvidia.com Features Multi-Projection, VR Ready, G-SYNC, Vulkan, Multi Monitor
Benchmarks Performance Rating - 3DMark 11 + Fire Strike + Time Spy - T600
3 pt (9%)
...
...
Performance Rating - 3DMark 11 + Fire Strike + Time Spy - GeForce GTX 1050 Max-Q
2.6 pt (8%)
...
NVIDIA GeForce GTX 1050 Max-Q
...
Performance Rating - 3DMark 11 + Fire Strike + Time Spy - GeForce GTX 1050 Ti Max-Q
3.3 pt (10%)
...
NVIDIA GeForce GTX 1050 Ti Max-Q
...
3DMark - 3DMark Time Spy Score
2496 Points (7%)
min: 1709 avg: 1754 median: 1753.5 (5%) max: 1798 Points
min: 2361 avg: 2453 median: 2485 (7%) max: 2513 Points
3DMark - 3DMark Time Spy Graphics
2195 Points (6%)
min: 1596 avg: 1615 median: 1615 (4%) max: 1634 Points
min: 2196 avg: 2245 median: 2261 (6%) max: 2278 Points
3DMark - 3DMark Ice Storm Unlimited Graphics
304731 Points (35%)
318811 Points (36%)
324705 Points (37%)
3DMark - 3DMark Ice Storm Extreme Graphics
152912 Points (20%)
22530 Points (3%)
39641 Points (5%)
3DMark - 3DMark Cloud Gate Score
31922 Points (34%)
min: 14739 avg: 17501 median: 18259.5 (20%) max: 18746 Points
min: 20755 avg: 24100 median: 24021 (26%) max: 28253 Points
3DMark - 3DMark Cloud Gate Graphics
40917 Points (11%)
min: 27059 avg: 33618 median: 35392 (9%) max: 36630 Points
min: 41871 avg: 46017 median: 46952 (12%) max: 50801 Points
3DMark - 3DMark Fire Strike Standard Score
6284 Points (11%)
min: 5114 avg: 5213 median: 5223 (9%) max: 5292 Points
min: 6175 avg: 6548 median: 6688 (12%) max: 6753 Points
3DMark - 3DMark Fire Strike Standard Graphics
6552 Points (7%)
min: 5616 avg: 5677 median: 5649.5 (6%) max: 5792 Points
min: 6957 avg: 7281 median: 7324 (8%) max: 7428 Points
3DMark - 3DMark Ice Storm Graphics
182459 Points (22%)
min: 36552 avg: 43792 median: 43792 (5%) max: 51032 Points
min: 41029 avg: 73224 median: 60442 (7%) max: 118202 Points
3DMark 11 - 3DM11 Performance Score
9497 Points (13%)
min: 7116 avg: 7354 median: 7347.5 (10%) max: 7603 Points
min: 8250 avg: 8936 median: 9106 (13%) max: 9414 Points
3DMark 11 - 3DM11 Performance GPU
8694 Points (7%)
min: 6874 avg: 7142 median: 7153.5 (6%) max: 7385 Points
min: 8317 avg: 8781 median: 8752 (8%) max: 9079 Points
3DMark Vantage + NVIDIA T600 3DMark Vantage - 3DM Vant. Perf. total
344838 Points (100%)
3DM Vant. Perf. total + NVIDIA GeForce GTX 1050 Max-Q
min: 26044 avg: 26081 median: 26080.5 (8%) max: 26117 Points
3DM Vant. Perf. total + NVIDIA GeForce GTX 1050 Ti Max-Q
min: 24827 avg: 29504 median: 29503.5 (9%) max: 34180 Points
3DM Vant. Perf. GPU no PhysX + NVIDIA T600 3DMark Vantage - 3DM Vant. Perf. GPU no PhysX
30400 Points (17%)
3DM Vant. Perf. GPU no PhysX + NVIDIA GeForce GTX 1050 Max-Q
min: 25008 avg: 25293 median: 25292.5 (14%) max: 25577 Points
3DM Vant. Perf. GPU no PhysX + NVIDIA GeForce GTX 1050 Ti Max-Q
min: 25707 avg: 29448 median: 29448 (17%) max: 33189 Points
3DMark 05 - 3DMark 05 - Standard
46380 Points (51%)
3DMark 06 3DMark 06 - Standard 1280x1024 + NVIDIA T600
43997 Points (57%)
3DMark 06 - Standard 1280x1024 + NVIDIA GeForce GTX 1050 Max-Q
min: 9694 avg: 19691 median: 19690.5 (26%) max: 29687 Points
3DMark 06 - Standard 1280x1024 + NVIDIA GeForce GTX 1050 Ti Max-Q
min: 26796 avg: 28797 median: 28797 (38%) max: 30798 Points
3DMark 06 - Standard 1024x768 + NVIDIA GeForce GTX 1050 Ti Max-Q
34786 Points (45%)
Unigine Valley 1.0 - Unigine Valley 1.0 DX
32.7 fps (11%)
30.8 fps (10%)
40.1 fps (13%)
Unigine Heaven 3.0 - Unigine Heaven 3.0 DX 11
70.2 fps (23%)
Unigine Heaven 3.0 - Unigine Heaven 3.0 OpenGL
65 fps (29%)
Unigine Heaven 2.1 - Heaven 2.1 high
min: 100.9 avg: 101.2 median: 101.2 (19%) max: 101.4 fps
86 fps (16%)
SPECviewperf 12 + NVIDIA T600 SPECviewperf 12 - specvp12 sw-03
115 fps (29%)
specvp12 snx-02 + NVIDIA T600 SPECviewperf 12 - specvp12 snx-02
68.6 fps (10%)
specvp12 showcase-01 + NVIDIA T600 SPECviewperf 12 - specvp12 showcase-01
35.3 fps (8%)
specvp12 mediacal-01 + NVIDIA T600 SPECviewperf 12 - specvp12 mediacal-01
19.5 fps (5%)
specvp12 maya-04 + NVIDIA T600 SPECviewperf 12 - specvp12 maya-04
67.4 fps (18%)
specvp12 energy-01 + NVIDIA T600 SPECviewperf 12 - specvp12 energy-01
5 fps (4%)
specvp12 creo-01 + NVIDIA T600 SPECviewperf 12 - specvp12 creo-01
78.5 fps (31%)
specvp12 catia-04 + NVIDIA T600 SPECviewperf 12 - specvp12 catia-04
76.9 fps (13%)
specvp12 3dsmax-05 + NVIDIA T600 SPECviewperf 12 - specvp12 3dsmax-05
80 fps (14%)
SPECviewperf 13 specvp13 sw-04 + NVIDIA T600 SPECviewperf 13 - specvp13 sw-04
114 fps (31%)
specvp13 snx-03 + NVIDIA T600 SPECviewperf 13 - specvp13 snx-03
122 fps (14%)
specvp13 showcase-02 + NVIDIA T600 SPECviewperf 13 - specvp13 showcase-02
34.9 fps (8%)
specvp13 medical-02 + NVIDIA T600 SPECviewperf 13 - specvp13 medical-02
35.7 fps (7%)
specvp13 maya-05 + NVIDIA T600 SPECviewperf 13 - specvp13 maya-05
99.8 fps (11%)
specvp13 energy-02 + NVIDIA T600 SPECviewperf 13 - specvp13 energy-02
12.6 fps (4%)
specvp13 creo-02 + NVIDIA T600 SPECviewperf 13 - specvp13 creo-02
98 fps (14%)
specvp13 3dsmax-06 + NVIDIA T600 SPECviewperf 13 - specvp13 3dsmax-06
79.9 fps (14%)
SPECviewperf 2020 specvp2020 solidworks-05 4k + NVIDIA T600 SPECviewperf 2020 - specvp2020 solidworks-05 4k
16.9 fps (5%)
specvp2020 snx-04 4k + NVIDIA T600 SPECviewperf 2020 - specvp2020 snx-04 4k
75.6 fps (8%)
specvp2020 medical-03 4k + NVIDIA T600 SPECviewperf 2020 - specvp2020 medical-03 4k
4.5 fps (4%)
specvp2020 maya-06 4k + NVIDIA T600 SPECviewperf 2020 - specvp2020 maya-06 4k
46.1 fps (8%)
specvp2020 energy-03 4k + NVIDIA T600 SPECviewperf 2020 - specvp2020 energy-03 4k
6.7 fps (1%)
specvp2020 creo-03 4k + NVIDIA T600 SPECviewperf 2020 - specvp2020 creo-03 4k
32.3 fps (15%)
specvp2020 catia-06 4k + NVIDIA T600 SPECviewperf 2020 - specvp2020 catia-06 4k
13.8 fps (9%)
specvp2020 3dsmax-07 4k + NVIDIA T600 SPECviewperf 2020 - specvp2020 3dsmax-07 4k
19.4 fps (8%)
Cinebench R10 Cinebench R10 Shading (32bit) + NVIDIA T600 Cinebench R10 - Cinebench R10 Shading (32bit)
6830 Points (5%)
Cinebench R10 Shading (32bit) + NVIDIA GeForce GTX 1050 Max-Q
min: 1803 avg: 5147 median: 6811 (5%) max: 6828 Points
Cinebench R10 Shading (32bit) + NVIDIA GeForce GTX 1050 Ti Max-Q
min: 4597 avg: 5340 median: 4972 (4%) max: 6451 Points
Cinebench R11.5 Cinebench R11.5 OpenGL 64 Bit + NVIDIA T600 Cinebench R11.5 - Cinebench R11.5 OpenGL 64 Bit
104.1 fps (36%)
Cinebench R11.5 OpenGL 64 Bit + NVIDIA GeForce GTX 1050 Max-Q
min: 20.54 avg: 47.4 median: 47.4 (16%) max: 74.3 fps
Cinebench R11.5 OpenGL 64 Bit + NVIDIA GeForce GTX 1050 Ti Max-Q
min: 66.9 avg: 71.7 median: 71.7 (25%) max: 76.5 fps
Cinebench R15 + NVIDIA T600 Cinebench R15 - Cinebench R15 OpenGL 64 Bit
227.1 fps (13%)
Cinebench R15 OpenGL 64 Bit + NVIDIA GeForce GTX 1050 Max-Q
min: 64.5 avg: 100.9 median: 109.5 (6%) max: 119.9 fps
Cinebench R15 OpenGL 64 Bit + NVIDIA GeForce GTX 1050 Ti Max-Q
min: 92.1 avg: 105.4 median: 102 (6%) max: 120.7 fps
Cinebench R15 OpenGL Ref. Match 64 Bit + NVIDIA T600 Cinebench R15 - Cinebench R15 OpenGL Ref. Match 64 Bit
99.6 % (100%)
Cinebench R15 OpenGL Ref. Match 64 Bit + NVIDIA GeForce GTX 1050 Max-Q
99.6 % (100%)
Cinebench R15 OpenGL Ref. Match 64 Bit + NVIDIA GeForce GTX 1050 Ti Max-Q
99.6 % (100%)
GFXBench - GFXBench 5.0 Aztec Ruins High Tier Offscreen
48.1 fps (9%)
49.5 fps (9%)
GFXBench - GFXBench 5.0 Aztec Ruins Normal Tier Offscreen
128.3 fps (10%)
119.1 fps (9%)
GFXBench - GFXBench Car Chase Offscreen
108.1 fps (12%)
min: 108.8 avg: 124.2 median: 124.2 (14%) max: 139.5 fps
GFXBench 3.1 - GFXBench Manhattan ES 3.1 Offscreen
165.2 fps (3%)
min: 168 avg: 184.9 median: 184.9 (4%) max: 201.7 fps
GFXBench 3.0 - GFXBench 3.0 Manhattan Offscreen
223 fps (13%)
min: 229.8 avg: 253.2 median: 253.2 (15%) max: 276.5 fps
GFXBench (DX / GLBenchmark) 2.7 + NVIDIA GeForce GTX 1050 Max-Q GFXBench (DX / GLBenchmark) 2.7 - GFXBench T-Rex HD Offscreen C24Z16
441.6 fps (4%)
GFXBench T-Rex HD Offscreen C24Z16 + NVIDIA GeForce GTX 1050 Ti Max-Q
min: 501 avg: 531 median: 531 (4%) max: 561 fps
LuxMark v2.0 64Bit - LuxMark v2.0 Room GPU
1121 Samples/s (5%)
min: 967 avg: 968 median: 967.5 (4%) max: 968 Samples/s
min: 1167 avg: 1201 median: 1200.5 (5%) max: 1234 Samples/s
LuxMark v2.0 64Bit - LuxMark v2.0 Sala GPU
2049 Samples/s (4%)
min: 1692 avg: 1702 median: 1702 (3%) max: 1712 Samples/s
min: 2100 avg: 2222 median: 2221.5 (4%) max: 2343 Samples/s
ComputeMark v2.1 - ComputeMark v2.1 Result
4825 Points (5%)
min: 4236 avg: 4343 median: 4342.5 (5%) max: 4449 Points
min: 4515 avg: 4879 median: 4879 (5%) max: 5243 Points
Power Consumption - Furmark Stress Test Power Consumption - external Monitor *
76.7 Watt (11%)
73.1 Watt (10%)
Power Consumption - The Witcher 3 Power Consumption - external Monitor *
83.5 Watt (12%)
75.8 Watt (11%)
Power Consumption - Witcher 3 Power Consumption *
68 Watt (15%)
min: 82 avg: 90 median: 85 (19%) max: 103 Watt
Power Consumption - Witcher 3 ultra Power Efficiency
0.3 fps per Watt (30%)
min: 0.2379 avg: 0.3 median: 0.3 (29%) max: 0.3073 fps per Watt
Power Consumption - Witcher 3 ultra Power Efficiency - external Monitor
0.3 fps per Watt (27%)
0.3 fps per Watt (27%)
Emissions Witcher 3 Fan Noise + NVIDIA GeForce GTX 1050 Max-Q Emissions - Witcher 3 Fan Noise
37.4 dB(A) (60%)
Witcher 3 Fan Noise + NVIDIA GeForce GTX 1050 Ti Max-Q
min: 36.4 avg: 40.2 median: 38.4 (61%) max: 47.6 dB(A)
Clock Speed - GPU Clock Witcher 3 ultra
1392 MHz (55%)
Average Benchmarks NVIDIA T600 → 100% n=22 Average Benchmarks NVIDIA GeForce GTX 1050 Max-Q → 70% n=22 Average Benchmarks NVIDIA GeForce GTX 1050 Ti Max-Q → 85% n=22
- Range of benchmark values for this graphics card
- Average benchmark values for this graphics card
* Smaller numbers mean a higher performance
1 This benchmark is not used for the average calculation
Game Benchmarks The following benchmarks stem from our benchmarks of review laptops. The performance depends on the used graphics memory, clock rate, processor, system settings, drivers, and operating systems. So the results don't have to be representative for all laptops with this GPU. For detailed information on the benchmark results, click on the fps number.
GeForce GTX 1050 Max-Q:
83.1 fps
GeForce GTX 1050 Max-Q:
32.5 fps
GeForce GTX 1050 Max-Q:
26.4 fps
GeForce GTX 1050 Max-Q:
15.4 fps
GeForce GTX 1050 Max-Q:
7.5 fps
GeForce GTX 1050 Max-Q:
35.1 fps
GeForce GTX 1050 Max-Q:
25.3 fps
GeForce GTX 1050 Max-Q:
16.1 fps
GeForce GTX 1050 Max-Q:
9.8 fps
GeForce GTX 1050 Max-Q:
43.6 fps
GeForce GTX 1050 Max-Q:
35.8 fps
GeForce GTX 1050 Max-Q:
31.1 fps
GeForce GTX 1050 Max-Q:
19.9 fps
GeForce GTX 1050 Max-Q:
9.9 fps
GeForce GTX 1050 Max-Q:
61.3 fps
GeForce GTX 1050 Max-Q:
34.4 fps
GeForce GTX 1050 Max-Q:
29.8 fps
GeForce GTX 1050 Max-Q:
27.7 fps
GeForce GTX 1050 Max-Q:
19.5 fps
GeForce GTX 1050 Max-Q:
10 fps
GeForce GTX 1050 Max-Q:
56.4 fps
GeForce GTX 1050 Max-Q:
36.1 fps
GeForce GTX 1050 Max-Q:
28.7 fps
GeForce GTX 1050 Max-Q:
25.7 fps
GeForce GTX 1050 Max-Q:
17.3 fps
GeForce GTX 1050 Max-Q:
9.1 fps
GeForce GTX 1050 Max-Q:
89.1 fps
GeForce GTX 1050 Max-Q:
41.2 fps
GeForce GTX 1050 Max-Q:
29.2 fps
GeForce GTX 1050 Max-Q:
21.3 fps
GeForce GTX 1050 Max-Q:
11.7 fps
GeForce GTX 1050 Max-Q:
7.3 fps
GeForce GTX 1050 Max-Q:
56 fps
GeForce GTX 1050 Max-Q:
31 fps
GeForce GTX 1050 Max-Q:
29 fps
GeForce GTX 1050 Max-Q:
19 fps
GeForce GTX 1050 Max-Q:
11 fps
GeForce GTX 1050 Max-Q:
6 fps
GeForce GTX 1050 Max-Q:
200.7 fps
GeForce GTX 1050 Max-Q:
105.2 fps
GeForce GTX 1050 Max-Q:
100.7 fps
GeForce GTX 1050 Max-Q:
86.4 fps
GeForce GTX 1050 Max-Q:
69.4 fps
GeForce GTX 1050 Max-Q:
47.1 fps
76%
GeForce GTX 1050 Max-Q:
81.3 fps
84%
GeForce GTX 1050 Max-Q:
35.3 fps
84%
GeForce GTX 1050 Max-Q:
22.5 fps
83%
GeForce GTX 1050 Max-Q:
16.5 fps
87%
GeForce GTX 1050 Max-Q:
11.6 fps
88%
GeForce GTX 1050 Max-Q:
4.9 fps
GeForce GTX 1050 Max-Q:
67.8 fps
GeForce GTX 1050 Max-Q:
23 fps
GeForce GTX 1050 Max-Q:
16.8 fps
GeForce GTX 1050 Max-Q:
10.5 fps
GeForce GTX 1050 Max-Q:
5.1 fps
GeForce GTX 1050 Max-Q:
134 fps
GeForce GTX 1050 Max-Q:
58 fps
GeForce GTX 1050 Max-Q:
49 fps
GeForce GTX 1050 Max-Q:
43 fps
GeForce GTX 1050 Max-Q:
27 fps
GeForce GTX 1050 Max-Q:
15 fps
GeForce GTX 1050 Max-Q:
119.3 fps
GeForce GTX 1050 Max-Q:
38.5 fps
GeForce GTX 1050 Max-Q:
23.2 fps
GeForce GTX 1050 Max-Q:
16.9 fps
GeForce GTX 1050 Max-Q:
6.5 fps
GeForce GTX 1050 Max-Q:
3.3 fps
GeForce GTX 1050 Max-Q:
69.5 fps
GeForce GTX 1050 Max-Q:
31.1 fps
GeForce GTX 1050 Max-Q:
26.6 fps
GeForce GTX 1050 Max-Q:
26 fps
GeForce GTX 1050 Max-Q:
16.3 fps
GeForce GTX 1050 Max-Q:
4.9 fps
GeForce GTX 1050 Max-Q:
73.2 fps
GeForce GTX 1050 Max-Q:
45.8 fps
GeForce GTX 1050 Max-Q:
26.5 fps
GeForce GTX 1050 Max-Q:
14.1 fps
GeForce GTX 1050 Max-Q:
10.1 fps
GeForce GTX 1050 Max-Q:
6.1 fps
GeForce GTX 1050 Max-Q:
73 fps
GeForce GTX 1050 Max-Q:
34 fps
GeForce GTX 1050 Max-Q:
27 fps
GeForce GTX 1050 Max-Q:
19 fps
GeForce GTX 1050 Max-Q:
12 fps
GeForce GTX 1050 Max-Q:
6 fps
GeForce GTX 1050 Max-Q:
142.1 fps
GeForce GTX 1050 Ti Max-Q:
133.2 fps
GeForce GTX 1050 Max-Q:
45.7 fps
GeForce GTX 1050 Ti Max-Q:
56.7 fps
GeForce GTX 1050 Max-Q:
38.8 fps
GeForce GTX 1050 Ti Max-Q:
44.3 fps
GeForce GTX 1050 Max-Q:
21.8 fps
GeForce GTX 1050 Ti Max-Q:
27.2 fps
GeForce GTX 1050 Max-Q:
16.1 fps
GeForce GTX 1050 Max-Q:
8.8 fps
GeForce GTX 1050 Ti Max-Q:
11.3 fps
GeForce GTX 1050 Max-Q:
58.2 fps
GeForce GTX 1050 Ti Max-Q:
67.1 fps
GeForce GTX 1050 Max-Q:
29.9 fps
GeForce GTX 1050 Ti Max-Q:
40.5 fps
GeForce GTX 1050 Max-Q:
28.6 fps
GeForce GTX 1050 Ti Max-Q:
34 fps
GeForce GTX 1050 Max-Q:
23.5 fps
GeForce GTX 1050 Ti Max-Q:
30.4 fps
GeForce GTX 1050 Max-Q:
13.5 fps
GeForce GTX 1050 Max-Q:
6.9 fps
GeForce GTX 1050 Ti Max-Q:
9 fps
GeForce GTX 1050 Max-Q:
69 fps
GeForce GTX 1050 Ti Max-Q:
83 89 [X] MSI GF75 8RD-001 Intel Core i7-8750H 2.2GHz
GeForce GTX 1050 Ti Max-Q
min:
61 fps, max:
89 fps
~ 86 fps
GeForce GTX 1050 Max-Q:
39 fps
GeForce GTX 1050 Ti Max-Q:
47 50 [X] MSI GF75 8RD-001 Intel Core i7-8750H 2.2GHz
GeForce GTX 1050 Ti Max-Q
min:
40 fps, max:
60 fps
~ 49 fps
GeForce GTX 1050 Max-Q:
37 fps
GeForce GTX 1050 Ti Max-Q:
43 46 [X] MSI GF75 8RD-001 Intel Core i7-8750H 2.2GHz
GeForce GTX 1050 Ti Max-Q
min:
38 fps, max:
56 fps
~ 45 fps
GeForce GTX 1050 Max-Q:
34 fps
GeForce GTX 1050 Ti Max-Q:
40 43 [X] MSI GF75 8RD-001 Intel Core i7-8750H 2.2GHz
GeForce GTX 1050 Ti Max-Q
min:
33 fps, max:
53 fps
~ 42 fps
GeForce GTX 1050 Max-Q:
24 fps
GeForce GTX 1050 Ti Max-Q:
29 [X] MSI GF75 8RD-001 Intel Core i7-8750H 2.2GHz
GeForce GTX 1050 Ti Max-Q
min:
24 fps, max:
37 fps
fps
GeForce GTX 1050 Max-Q:
12 fps
GeForce GTX 1050 Ti Max-Q:
14 15 [X] MSI GF75 8RD-001 Intel Core i7-8750H 2.2GHz
GeForce GTX 1050 Ti Max-Q
min:
11 fps, max:
19 fps
~ 15 fps
70%
GeForce GTX 1050 Max-Q:
52.1 fps
78%
GeForce GTX 1050 Ti Max-Q:
55.5 60.4 [X] MSI GF75 8RD-001 Intel Core i7-8750H 2.2GHz
GeForce GTX 1050 Ti Max-Q
min:
31.8 fps, max:
115.6 fps
~ 58 fps
73%
GeForce GTX 1050 Max-Q:
24.9 fps
121%
GeForce GTX 1050 Ti Max-Q:
31.4 [X] MSI GF75 8RD-001 Intel Core i7-8750H 2.2GHz
GeForce GTX 1050 Ti Max-Q
min:
15.8 fps, max:
53.7 fps
49.8 ~ 41 fps
78%
GeForce GTX 1050 Max-Q:
18.7 fps
125%
GeForce GTX 1050 Ti Max-Q:
23.5 [X] MSI GF75 8RD-001 Intel Core i7-8750H 2.2GHz
GeForce GTX 1050 Ti Max-Q
min:
12.1 fps, max:
39.8 fps
36.5 ~ 30 fps
75%
GeForce GTX 1050 Max-Q:
14.6 fps
124%
GeForce GTX 1050 Ti Max-Q:
19.3 [X] MSI GF75 8RD-001 Intel Core i7-8750H 2.2GHz
GeForce GTX 1050 Ti Max-Q
min:
10.4 fps, max:
19.3 fps
28.3 ~ 24 fps
77%
GeForce GTX 1050 Max-Q:
11.4 fps
84%
GeForce GTX 1050 Max-Q:
7.1 fps
55%
GeForce GTX 1050 Ti Max-Q:
4.7 fps
GeForce GTX 1050 Max-Q:
107.9 fps
GeForce GTX 1050 Max-Q:
44.4 fps
GeForce GTX 1050 Max-Q:
35.3 fps
GeForce GTX 1050 Max-Q:
35.3 fps
GeForce GTX 1050 Max-Q:
24.8 fps
GeForce GTX 1050 Max-Q:
12.7 fps
GeForce GTX 1050 Ti Max-Q:
73.2 fps
GeForce GTX 1050 Ti Max-Q:
47.9 fps
GeForce GTX 1050 Ti Max-Q:
36.1 fps
GeForce GTX 1050 Ti Max-Q:
35.3 fps
GeForce GTX 1050 Ti Max-Q:
12.9 fps
GeForce GTX 1050 Ti Max-Q:
134.5 fps
GeForce GTX 1050 Max-Q:
33.6 fps
GeForce GTX 1050 Ti Max-Q:
87.4 fps
GeForce GTX 1050 Max-Q:
37.2 fps
GeForce GTX 1050 Ti Max-Q:
73.7 fps
GeForce GTX 1050 Max-Q:
31.5 fps
GeForce GTX 1050 Ti Max-Q:
65 fps
GeForce GTX 1050 Ti Max-Q:
13.2 fps
GeForce GTX 1050 Ti Max-Q:
100.1 fps
GeForce GTX 1050 Max-Q:
46.1 fps
GeForce GTX 1050 Ti Max-Q:
57.3 fps
GeForce GTX 1050 Max-Q:
39.7 fps
GeForce GTX 1050 Ti Max-Q:
47.9 fps
GeForce GTX 1050 Max-Q:
36.5 fps
GeForce GTX 1050 Ti Max-Q:
44.8 fps
GeForce GTX 1050 Ti Max-Q:
17.3 fps
GeForce GTX 1050 Max-Q:
183.8 fps
GeForce GTX 1050 Ti Max-Q:
193.6 fps
GeForce GTX 1050 Max-Q:
104.8 fps
GeForce GTX 1050 Ti Max-Q:
128.7 fps
GeForce GTX 1050 Max-Q:
64.7 fps
GeForce GTX 1050 Ti Max-Q:
80.5 fps
GeForce GTX 1050 Max-Q:
46.6 fps
GeForce GTX 1050 Ti Max-Q:
61 fps
GeForce GTX 1050 Max-Q:
31.5 fps
GeForce GTX 1050 Max-Q:
15.5 fps
GeForce GTX 1050 Ti Max-Q:
22 fps
GeForce GTX 1050 Ti Max-Q:
64.8 fps
GeForce GTX 1050 Ti Max-Q:
41 fps
GeForce GTX 1050 Ti Max-Q:
37.5 fps
GeForce GTX 1050 Ti Max-Q:
35.9 fps
GeForce GTX 1050 Ti Max-Q:
11.3 fps
GeForce GTX 1050 Ti Max-Q:
118.7 fps
GeForce GTX 1050 Ti Max-Q:
46.3 fps
GeForce GTX 1050 Ti Max-Q:
45 fps
GeForce GTX 1050 Ti Max-Q:
37.5 fps
GeForce GTX 1050 Ti Max-Q:
10.1 fps
GeForce GTX 1050 Max-Q:
56 fps
GeForce GTX 1050 Ti Max-Q:
67 fps
GeForce GTX 1050 Max-Q:
37 fps
GeForce GTX 1050 Ti Max-Q:
43 fps
GeForce GTX 1050 Max-Q:
31 fps
GeForce GTX 1050 Ti Max-Q:
34 fps
GeForce GTX 1050 Max-Q:
16 fps
GeForce GTX 1050 Ti Max-Q:
18 fps
GeForce GTX 1050 Max-Q:
10 fps
GeForce GTX 1050 Max-Q:
6 fps
GeForce GTX 1050 Ti Max-Q:
7 fps
GeForce GTX 1050 Ti Max-Q:
122 fps
GeForce GTX 1050 Ti Max-Q:
67 fps
GeForce GTX 1050 Ti Max-Q:
61 fps
GeForce GTX 1050 Ti Max-Q:
47 fps
GeForce GTX 1050 Ti Max-Q:
20 fps
GeForce GTX 1050 Max-Q:
96.5 fps
GeForce GTX 1050 Max-Q:
100.8 fps
GeForce GTX 1050 Max-Q:
44 57 ~ 51 fps
GeForce GTX 1050 Ti Max-Q:
97 fps
GeForce GTX 1050 Max-Q:
27 33 ~ 30 fps
GeForce GTX 1050 Ti Max-Q:
39 fps
GeForce GTX 1050 Max-Q:
25 26 ~ 26 fps
GeForce GTX 1050 Ti Max-Q:
35 fps
GeForce GTX 1050 Max-Q:
22 23 ~ 23 fps
GeForce GTX 1050 Ti Max-Q:
29 fps
GeForce GTX 1050 Max-Q:
16 fps
GeForce GTX 1050 Max-Q:
8 fps
GeForce GTX 1050 Ti Max-Q:
11 fps
GeForce GTX 1050 Max-Q:
104 fps
GeForce GTX 1050 Ti Max-Q:
134 fps
GeForce GTX 1050 Max-Q:
63 fps
GeForce GTX 1050 Ti Max-Q:
80 fps
GeForce GTX 1050 Max-Q:
47 fps
GeForce GTX 1050 Ti Max-Q:
62 fps
GeForce GTX 1050 Max-Q:
29 fps
GeForce GTX 1050 Ti Max-Q:
38 fps
GeForce GTX 1050 Max-Q:
13 fps
GeForce GTX 1050 Ti Max-Q:
17 fps
GeForce GTX 1050 Max-Q:
73.7 fps
GeForce GTX 1050 Ti Max-Q:
100.3 fps
GeForce GTX 1050 Max-Q:
32 fps
GeForce GTX 1050 Ti Max-Q:
39.2 fps
GeForce GTX 1050 Max-Q:
24 fps
GeForce GTX 1050 Ti Max-Q:
34.9 fps
GeForce GTX 1050 Max-Q:
20 fps
GeForce GTX 1050 Ti Max-Q:
26.8 fps
GeForce GTX 1050 Max-Q:
5.8 fps
GeForce GTX 1050 Ti Max-Q:
8.3 fps
GeForce GTX 1050 Ti Max-Q:
60 fps
GeForce GTX 1050 Max-Q:
42 fps
GeForce GTX 1050 Ti Max-Q:
49.1 fps
GeForce GTX 1050 Max-Q:
37 fps
GeForce GTX 1050 Ti Max-Q:
45.3 fps
GeForce GTX 1050 Max-Q:
33.4 fps
GeForce GTX 1050 Ti Max-Q:
42 fps
GeForce GTX 1050 Max-Q:
10.4 fps
GeForce GTX 1050 Ti Max-Q:
14 fps
73%
GeForce GTX 1050 Max-Q:
66 71 ~ 69 fps
91%
GeForce GTX 1050 Ti Max-Q:
76 91 91 ~ 86 fps
80%
GeForce GTX 1050 Max-Q:
35 38 ~ 37 fps
102%
GeForce GTX 1050 Ti Max-Q:
45 48 48 ~ 47 fps
81%
GeForce GTX 1050 Max-Q:
33 35 ~ 34 fps
102%
GeForce GTX 1050 Ti Max-Q:
41 44 44 ~ 43 fps
79%
GeForce GTX 1050 Max-Q:
30 32 ~ 31 fps
100%
GeForce GTX 1050 Ti Max-Q:
38 38 41 ~ 39 fps
85%
GeForce GTX 1050 Max-Q:
22 fps
92%
GeForce GTX 1050 Max-Q:
10 11 ~ 11 fps
108%
GeForce GTX 1050 Ti Max-Q:
13 13 14 ~ 13 fps
GeForce GTX 1050 Max-Q:
429.1 fps
GeForce GTX 1050 Max-Q:
132.4 fps
GeForce GTX 1050 Max-Q:
51.4 fps
GeForce GTX 1050 Max-Q:
32.5 fps
GeForce GTX 1050 Max-Q:
16 fps
67%
GeForce GTX 1050 Max-Q:
88.8 fps
70%
GeForce GTX 1050 Ti Max-Q:
92.7 fps
76%
GeForce GTX 1050 Max-Q:
80.9 fps
75%
GeForce GTX 1050 Ti Max-Q:
80.3 fps
68%
GeForce GTX 1050 Max-Q:
65.1 fps
72%
GeForce GTX 1050 Ti Max-Q:
69.4 fps
74%
GeForce GTX 1050 Max-Q:
30.3 fps
97%
GeForce GTX 1050 Ti Max-Q:
39.5 fps
GeForce GTX 1050 Max-Q:
82.1 fps
GeForce GTX 1050 Max-Q:
36.8 fps
GeForce GTX 1050 Max-Q:
29.5 fps
GeForce GTX 1050 Max-Q:
21.5 fps
GeForce GTX 1050 Max-Q:
6 fps
80%
GeForce GTX 1050 Max-Q:
56.9 fps
96%
GeForce GTX 1050 Ti Max-Q:
61.5 75.1 ~ 68 fps
84%
GeForce GTX 1050 Max-Q:
29.3 fps
106%
GeForce GTX 1050 Ti Max-Q:
36.6 37.7 ~ 37 fps
82%
GeForce GTX 1050 Max-Q:
20.6 fps
96%
GeForce GTX 1050 Ti Max-Q:
23.3 25 ~ 24 fps
79%
GeForce GTX 1050 Max-Q:
7.9 fps
92%
GeForce GTX 1050 Ti Max-Q:
9.2 fps
GeForce GTX 1050 Max-Q:
142.8 fps
GeForce GTX 1050 Max-Q:
111.8 fps
GeForce GTX 1050 Max-Q:
49.4 fps
GeForce GTX 1050 Max-Q:
36.5 fps
GeForce GTX 1050 Max-Q:
9.3 fps
GeForce GTX 1050 Max-Q:
82.5 fps
GeForce GTX 1050 Ti Max-Q:
92.3 fps
GeForce GTX 1050 Max-Q:
56.5 fps
GeForce GTX 1050 Ti Max-Q:
42 fps
GeForce GTX 1050 Max-Q:
48.8 fps
GeForce GTX 1050 Ti Max-Q:
34.3 fps
GeForce GTX 1050 Max-Q:
32.7 fps
GeForce GTX 1050 Ti Max-Q:
30.4 fps
GeForce GTX 1050 Max-Q:
7.4 fps
GeForce GTX 1050 Max-Q:
144.8 fps
GeForce GTX 1050 Max-Q:
99.6 fps
GeForce GTX 1050 Max-Q:
46.7 fps
GeForce GTX 1050 Max-Q:
36.7 fps
GeForce GTX 1050 Max-Q:
16.1 fps
GeForce GTX 1050 Max-Q:
59 fps
GeForce GTX 1050 Ti Max-Q:
58 fps
GeForce GTX 1050 Max-Q:
40 fps
GeForce GTX 1050 Ti Max-Q:
41 fps
GeForce GTX 1050 Max-Q:
35 fps
GeForce GTX 1050 Ti Max-Q:
33 fps
GeForce GTX 1050 Max-Q:
28 fps
GeForce GTX 1050 Ti Max-Q:
27 fps
GeForce GTX 1050 Max-Q:
11 fps
GeForce GTX 1050 Ti Max-Q:
13 fps
GeForce GTX 1050 Max-Q:
82.2 fps
GeForce GTX 1050 Ti Max-Q:
119.5 fps
GeForce GTX 1050 Max-Q:
57.4 fps
GeForce GTX 1050 Ti Max-Q:
69.4 fps
GeForce GTX 1050 Max-Q:
51.6 fps
GeForce GTX 1050 Ti Max-Q:
64.3 fps
GeForce GTX 1050 Max-Q:
38.1 fps
GeForce GTX 1050 Ti Max-Q:
57.9 fps
GeForce GTX 1050 Max-Q:
13.5 fps
GeForce GTX 1050 Ti Max-Q:
18.9 fps
GeForce GTX 1050 Max-Q:
97 fps
GeForce GTX 1050 Ti Max-Q:
105 fps
GeForce GTX 1050 Max-Q:
44 fps
GeForce GTX 1050 Ti Max-Q:
55 fps
GeForce GTX 1050 Max-Q:
31 fps
GeForce GTX 1050 Ti Max-Q:
41 fps
GeForce GTX 1050 Max-Q:
24 fps
GeForce GTX 1050 Ti Max-Q:
31 fps
GeForce GTX 1050 Max-Q:
10 fps
GeForce GTX 1050 Ti Max-Q:
13 fps
GeForce GTX 1050 Max-Q:
254.7 fps
GeForce GTX 1050 Max-Q:
153.2 fps
GeForce GTX 1050 Max-Q:
127.5 fps
GeForce GTX 1050 Max-Q:
127 fps
GeForce GTX 1050 Max-Q:
55.5 fps
GeForce GTX 1050 Max-Q:
51.4 fps
GeForce GTX 1050 Max-Q:
33.6 fps
GeForce GTX 1050 Max-Q:
11.3 fps
GeForce GTX 1050 Max-Q:
136 fps
GeForce GTX 1050 Ti Max-Q:
129.8 fps
GeForce GTX 1050 Max-Q:
128 fps
GeForce GTX 1050 Ti Max-Q:
123.6 fps
GeForce GTX 1050 Max-Q:
120 fps
GeForce GTX 1050 Ti Max-Q:
115.7 fps
GeForce GTX 1050 Max-Q:
118 fps
GeForce GTX 1050 Ti Max-Q:
112.6 fps
GeForce GTX 1050 Max-Q:
55 fps
GeForce GTX 1050 Ti Max-Q:
65.2 fps
GeForce GTX 1050 Max-Q:
191.1 fps
GeForce GTX 1050 Max-Q:
88 fps
GeForce GTX 1050 Max-Q:
47.1 fps
GeForce GTX 1050 Max-Q:
26.2 fps
GeForce GTX 1050 Max-Q:
15.4 fps
GeForce GTX 1050 Max-Q:
240.3 fps
GeForce GTX 1050 Ti Max-Q:
249.1 fps
GeForce GTX 1050 Max-Q:
155.4 fps
GeForce GTX 1050 Ti Max-Q:
169.1 fps
GeForce GTX 1050 Max-Q:
98.8 fps
GeForce GTX 1050 Ti Max-Q:
112.5 fps
GeForce GTX 1050 Max-Q:
36.7 fps
GeForce GTX 1050 Ti Max-Q:
42.3 fps
GeForce GTX 1050 Ti Max-Q:
142.4 fps
GeForce GTX 1050 Ti Max-Q:
85.6 fps
GeForce GTX 1050 Ti Max-Q:
68.3 fps
GeForce GTX 1050 Ti Max-Q:
58.9 fps
GeForce GTX 1050 Ti Max-Q:
21.7 fps
GeForce GTX 1050 Max-Q:
80.6 fps
GeForce GTX 1050 Ti Max-Q:
68.6 96.7 ~ 83 fps
GeForce GTX 1050 Max-Q:
35.7 fps
GeForce GTX 1050 Max-Q:
32.5 fps
GeForce GTX 1050 Max-Q:
17.1 fps
GeForce GTX 1050 Max-Q:
10.5 fps
GeForce GTX 1050 Ti Max-Q:
13.9 14.5 ~ 14 fps
GeForce GTX 1050 Max-Q:
52.7 53.5 ~ 53 fps
GeForce GTX 1050 Ti Max-Q:
63.8 68.2 ~ 66 fps
GeForce GTX 1050 Max-Q:
49.8 49.8 ~ 50 fps
GeForce GTX 1050 Ti Max-Q:
64.9 65.5 ~ 65 fps
GeForce GTX 1050 Max-Q:
38.1 38.2 ~ 38 fps
GeForce GTX 1050 Ti Max-Q:
49.5 50.4 ~ 50 fps
GeForce GTX 1050 Max-Q:
14.7 15 ~ 15 fps
GeForce GTX 1050 Ti Max-Q:
19.2 19.2 ~ 19 fps
GeForce GTX 1050 Ti Max-Q:
137.3 fps
GeForce GTX 1050 Ti Max-Q:
104.6 fps
GeForce GTX 1050 Max-Q:
144.7 fps
GeForce GTX 1050 Ti Max-Q:
89.5 154.8 ~ 122 fps
GeForce GTX 1050 Max-Q:
89.2 fps
GeForce GTX 1050 Ti Max-Q:
85.2 120 ~ 103 fps
GeForce GTX 1050 Max-Q:
45 fps
GeForce GTX 1050 Ti Max-Q:
51.7 58.1 ~ 55 fps
GeForce GTX 1050 Max-Q:
41.3 fps
GeForce GTX 1050 Ti Max-Q:
49.8 53.1 ~ 51 fps
GeForce GTX 1050 Max-Q:
15.9 fps
GeForce GTX 1050 Ti Max-Q:
20.7 21.1 ~ 21 fps
GeForce GTX 1050 Max-Q:
141 fps
GeForce GTX 1050 Ti Max-Q:
112.5 fps
GeForce GTX 1050 Max-Q:
82.7 fps
GeForce GTX 1050 Ti Max-Q:
85.8 fps
GeForce GTX 1050 Max-Q:
35 fps
GeForce GTX 1050 Ti Max-Q:
51 fps
GeForce GTX 1050 Max-Q:
28.6 fps
GeForce GTX 1050 Ti Max-Q:
43 fps
GeForce GTX 1050 Max-Q:
23 fps
GeForce GTX 1050 Max-Q:
70.5 71.5 ~ 71 fps
GeForce GTX 1050 Max-Q:
52.6 54.8 ~ 54 fps
GeForce GTX 1050 Max-Q:
28.3 30.1 ~ 29 fps
GeForce GTX 1050 Max-Q:
20.3 21.4 ~ 21 fps
GeForce GTX 1050 Max-Q:
9 9.6 ~ 9 fps
GeForce GTX 1050 Max-Q:
256.9 fps
GeForce GTX 1050 Ti Max-Q:
285.4 fps
GeForce GTX 1050 Max-Q:
160 fps
GeForce GTX 1050 Ti Max-Q:
233.9 fps
GeForce GTX 1050 Max-Q:
80.5 fps
GeForce GTX 1050 Ti Max-Q:
117.7 fps
GeForce GTX 1050 Max-Q:
48.9 fps
GeForce GTX 1050 Ti Max-Q:
70.5 fps
GeForce GTX 1050 Max-Q:
26 fps
GeForce GTX 1050 Ti Max-Q:
37 fps
GeForce GTX 1050 Max-Q:
53.8 fps
GeForce GTX 1050 Ti Max-Q:
63 fps
GeForce GTX 1050 Max-Q:
33.5 fps
GeForce GTX 1050 Ti Max-Q:
41.3 fps
GeForce GTX 1050 Max-Q:
29.1 fps
GeForce GTX 1050 Ti Max-Q:
35.8 fps
GeForce GTX 1050 Max-Q:
18.9 fps
GeForce GTX 1050 Ti Max-Q:
15.7 fps
GeForce GTX 1050 Max-Q:
109.9 fps
GeForce GTX 1050 Max-Q:
69.8 fps
GeForce GTX 1050 Ti Max-Q:
83.4 89.5 ~ 86 fps
GeForce GTX 1050 Max-Q:
32.3 fps
GeForce GTX 1050 Ti Max-Q:
41.9 42.5 ~ 42 fps
GeForce GTX 1050 Max-Q:
24.8 fps
GeForce GTX 1050 Ti Max-Q:
32.2 34.8 ~ 34 fps
GeForce GTX 1050 Max-Q:
10.9 fps
GeForce GTX 1050 Ti Max-Q:
14.6 15.7 ~ 15 fps
GeForce GTX 1050 Max-Q:
98 105.5 ~ 102 fps
GeForce GTX 1050 Max-Q:
41.4 56 62 ~ 53 fps
GeForce GTX 1050 Max-Q:
12.9 fps
GeForce GTX 1050 Ti Max-Q:
16.8 17.1 ~ 17 fps
GeForce GTX 1050 Max-Q:
108 170.3 ~ 139 fps
GeForce GTX 1050 Max-Q:
67.5 80.4 ~ 74 fps
GeForce GTX 1050 Ti Max-Q:
90.2 92.7 ~ 91 fps
GeForce GTX 1050 Max-Q:
62.8 67 ~ 65 fps
GeForce GTX 1050 Ti Max-Q:
62.5 67.5 ~ 65 fps
GeForce GTX 1050 Max-Q:
22.1 26.1 ~ 24 fps
GeForce GTX 1050 Ti Max-Q:
27.7 29.3 ~ 29 fps
GeForce GTX 1050 Max-Q:
174.8 fps
GeForce GTX 1050 Ti Max-Q:
168.6 fps
GeForce GTX 1050 Max-Q:
140.9 fps
GeForce GTX 1050 Ti Max-Q:
143.9 fps
GeForce GTX 1050 Max-Q:
109.3 fps
GeForce GTX 1050 Ti Max-Q:
112.7 fps
GeForce GTX 1050 Max-Q:
83.3 fps
GeForce GTX 1050 Ti Max-Q:
101 fps
GeForce GTX 1050 Max-Q:
26.1 fps
GeForce GTX 1050 Ti Max-Q:
34.4 fps
92%
GeForce GTX 1050 Max-Q:
149.5 fps
69%
GeForce GTX 1050 Ti Max-Q:
111.9 fps
90%
GeForce GTX 1050 Max-Q:
134.1 fps
70%
GeForce GTX 1050 Ti Max-Q:
104.2 fps
96%
GeForce GTX 1050 Max-Q:
115.5 fps
81%
GeForce GTX 1050 Ti Max-Q:
98.1 fps
94%
GeForce GTX 1050 Max-Q:
104.1 fps
85%
GeForce GTX 1050 Ti Max-Q:
93.5 fps
94%
GeForce GTX 1050 Max-Q:
37.1 fps
116%
GeForce GTX 1050 Ti Max-Q:
46 fps
78%
GeForce GTX 1050 Max-Q:
34 34.5 41 ~ 37 fps
81%
GeForce GTX 1050 Max-Q:
12 13.1 ~ 13 fps
83%
GeForce GTX 1050 Ti Max-Q:
150.4 fps
82%
GeForce GTX 1050 Ti Max-Q:
143.3 fps
77%
GeForce GTX 1050 Max-Q:
61.8 62.1 ~ 62 fps
98%
GeForce GTX 1050 Ti Max-Q:
78.9 fps
71%
GeForce GTX 1050 Max-Q:
27 27.7 ~ 27 fps
90%
GeForce GTX 1050 Ti Max-Q:
34.5 fps
112%
GeForce GTX 1050 Max-Q:
26.1 29.1 ~ 28 fps
142%
GeForce GTX 1050 Ti Max-Q:
35.5 fps
GeForce GTX 1050 Max-Q:
106 fps
GeForce GTX 1050 Max-Q:
56.5 76 ~ 66 fps
GeForce GTX 1050 Max-Q:
57.2 66 ~ 62 fps
GeForce GTX 1050 Max-Q:
38 38.8 ~ 38 fps
GeForce GTX 1050 Max-Q:
79.7 fps
GeForce GTX 1050 Max-Q:
71.8 fps
GeForce GTX 1050 Max-Q:
48.7 fps
GeForce GTX 1050 Max-Q:
21.9 fps
GeForce GTX 1050 Max-Q:
333.8 fps
GeForce GTX 1050 Max-Q:
216.6 fps
GeForce GTX 1050 Max-Q:
157.8 fps
GeForce GTX 1050 Max-Q:
73.8 fps
GeForce GTX 1050 Max-Q:
316 fps
GeForce GTX 1050 Max-Q:
296.3 fps
GeForce GTX 1050 Max-Q:
233.3 fps
GeForce GTX 1050 Max-Q:
143.8 fps
GeForce GTX 1050 Max-Q:
93.5 fps
GeForce GTX 1050 Max-Q:
53.4 fps
GeForce GTX 1050 Ti Max-Q:
228.2 fps
GeForce GTX 1050 Ti Max-Q:
202.6 fps
GeForce GTX 1050 Ti Max-Q:
202.1 fps
GeForce GTX 1050 Ti Max-Q:
170.1 fps
GeForce GTX 1050 Ti Max-Q:
433.4 fps
GeForce GTX 1050 Ti Max-Q:
200.4 fps
GeForce GTX 1050 Ti Max-Q:
186.7 fps
GeForce GTX 1050 Ti Max-Q:
126.7 fps
Average Gaming NVIDIA T600 → 100% Average Gaming 30-70 fps → 100%
Average Gaming NVIDIA GeForce GTX 1050 Max-Q → 81% Average Gaming 30-70 fps → 78%
Average Gaming NVIDIA GeForce GTX 1050 Ti Max-Q → 95% Average Gaming 30-70 fps → 102%
 Deutsch
 English
 Español
 Français
 Italiano
 Nederlands
 Polski
 Português
 Русский
 Türkçe
 Svenska
 Chinese
 Magyar