Intel HD Graphics (Broadwell) vs Intel HD Graphics (Cherry Trail) vs Intel HD Graphics 4200
Intel HD Graphics (Broadwell) ► remove from comparison
The Intel HD Graphics (Broadwell) (GT1) is an integrated Broadwell graphics card revealed in Q1 2015. It can be found in several low-end CPUs such as the Pentium 3805U or Celeron 3755U . The so-called GT1 GPU offers 12 EUs (Execution Units) and therefore somewhat more shader power than the previous HD Graphics (Haswell) . The clock range may depend on the specific model it is built into.
Architecture and Features
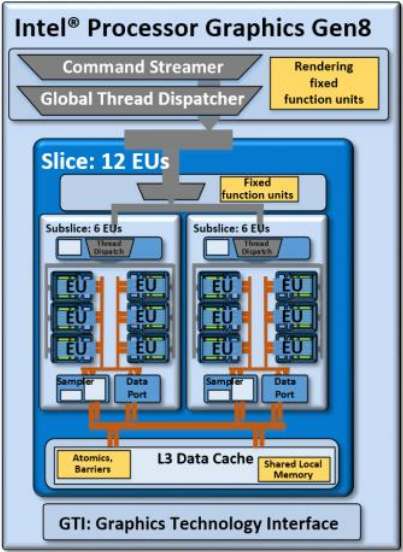
Broadwell features a GPU based on the Intel Gen8 architecture, which has been optimized in various aspects compared to the previous Gen7.5 (Haswell). In case of the GT1 version, the shader arrays called "subslice" have been reorganized and now offer 6 Execution Units (EUs) each. Two subslices form a "slice" for a total of 12 EUs. Combined with other improvements such as larger L1 caches and an optimized frontend, the integrated GPU has become faster and more efficient than its predecessor.
The HD Graphics (Broadwell) represents the low-end version of the Broadwell GPU family and consists of one slice with 12 EUs. Beyond that, there is also a mid-range variant (GT2, 24 EUs) as well as higher-end models (GT3/GT3e + eDRAM, 48 EUs).
All Broadwell GPUs support OpenCL 2.0 and DirectX 12 (FL 11_1). The video engine can now decode H.265 using both fixed function hardware as well as available GPU shaders. Up to three displays can be connected via DP 1.2/eDP 1.3 (max. 3840 x 2160 @ 60 Hz) or HDMI 1.4a (max. 3840 x 2160 @ 24 Hz). HDMI 2.0, however, is not supported.
Performance
Even though the HD Graphics (Broadwell) is clocked a bit lower, the performance should be clearly above the HD Graphics (Haswell) and similar to the HD Graphics 4000 . Nevertheless, only a few games as of 2014/2015 will run fluently at (very) low settings, e.g. Dota 2 or Sims 4.
Power Consumption
Utilizing a new 14 nm process, the HD Graphics (Broadwell) can be found in ULV models (15 W) as well as regular dual core CPUs (37 W, not yet presented). The TDP is flexible and can be further reduced, which has a significant impact on performance.
Intel HD Graphics (Cherry Trail) ► remove from comparison
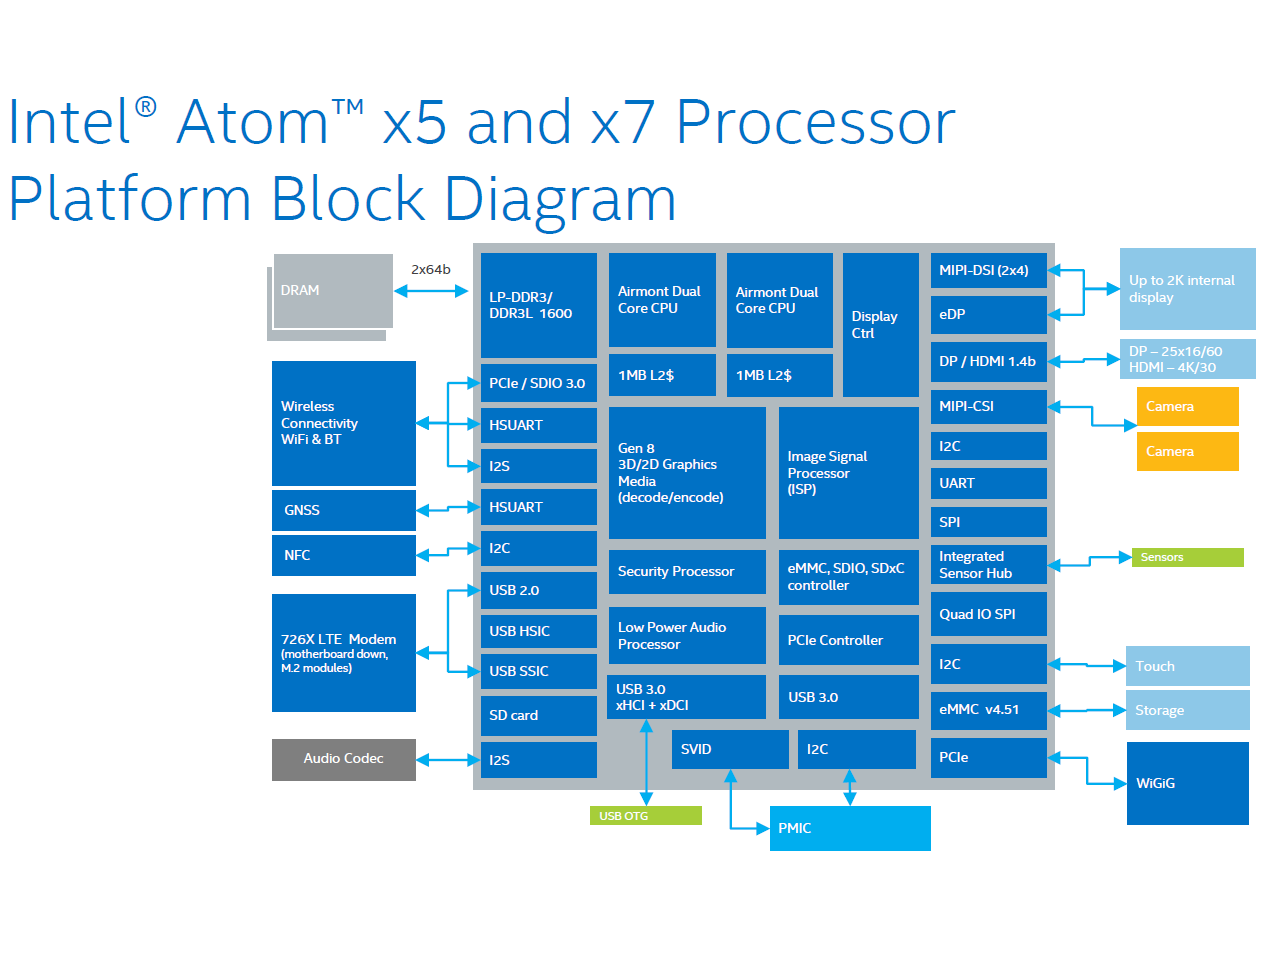
The Intel HD Graphics (Cherry Trail) is an integrated graphics card in the Cherry-Trail SoCs (e.g. Atom x7-Z8700). Based on a Broadwell GPU (Intel Gen8) and supports DirectX 11.2. Depending on the SoC offers 12 or 16 EUs.
Atom x7-Z8700: 16 EUs @ 200 - 600 MHz, dual-channel memory
In Windows, gaming is limited to less demanding or quite old games. Using Android, even high end 3D games should run fluently. For example Team Fortress 2 was running on the Surface 3 (x7-Z8700) only in lowest settings and 1280x720 fluently (11 - 69 fps range).
The integrated video decoder is able to display even 4K videos (H.264 tested) fluently.
The Intel HD Graphics GPU in our review sample of the MS Surface 3 (Atom x7-Z8700) only supported DisplayPort 1.1 as it seems, as 4K (3840x2160) with 30 Hz was the maximum Refresh Rate we could achieve (no 60 Hz selectable with the pre-installed drivers).
Intel HD Graphics 4200 ► remove from comparison
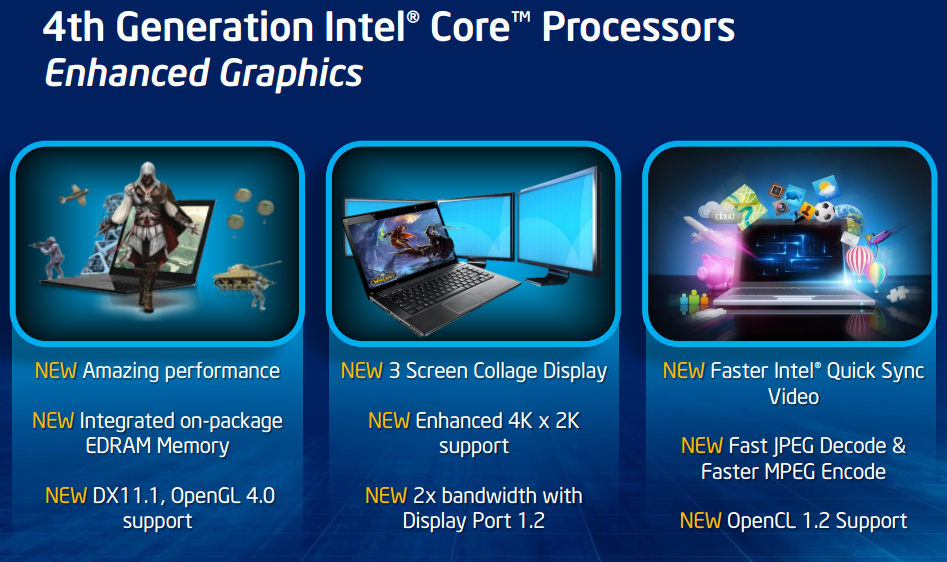
The Intel HD Graphics 4200 (GT2) is a processor graphics card that is included in some of the ULV Haswell processors of 2013 (4th generation core). The relatively low base clock can be automatically overclocked using Turbo Boost technology.
In comparison to the HD 4000, the graphics core has been modified in several details. The GPU supports DirectX 11.1, OpenCL 1.2 und OpenGL 4.0. It also features an improved decoder for 4K videos and the fast Quick Sync encoder.
The performance of the HD Graphics 4200 is clearly below the HD 4600 and HD 4400 , since the GPU is designed for ULV models of the Y-series (11.5 W). Therefore, the clock rates are relatively low. Compared to a similar clocked HD 4000 , the HD 4200 is somewhat faster due to architectural improvements and an increased number of execution units: The GT2 version integrates 20 EUs, compared to 16 EUs for the old HD 4000.
In simple games like Anno 2070 or Counter Strike: Global Offensive, the performance is sufficient to handle low settings and 1024 x 768 pixels. Many current titles like Battlefield 4, however, are not playable even at minimum graphic quality. Detailed benchmarks can be found below.
Due to the 22nm 3D Tri-Gate production process, the power consumption is relatively low and suitable even for tablets. In addition to the TDP of 11.5 watts, the Y-series CPUs are rated at an SDP (average power consumption) of 4.5 or 6 watts (depending on the model).
Intel HD Graphics (Broadwell) Intel HD Graphics (Cherry Trail) Intel HD Graphics 4200 HD Graphics Series Codename Broadwell GT1 Cherry Trail Haswell GT2 Architecture Gen. 8 Broadwell Gen. 8 Gen. 7.5 Haswell Pipelines 12 - unified 16 - unified 20 - unified Core Speed 100 - 850 (Boost) MHz 200 - 600 (Boost) MHz 200 - 850 (Boost) MHz Memory Bus Width 64/128 Bit 64/128 Bit 64/128 Bit Shared Memory yes yes yes API DirectX 12 (FL 11_1), OpenGL 4.3 DirectX 12 (FL 11_1), Shader 5.0, OpenGL 4.3 DirectX 11.1, Shader 5.0, OpenGL 4.0 technology 14 nm 14 nm 22 nm Features QuickSync QuickSync Date of Announcement 05.01.2015 02.03.2015 05.06.2013
CPU in HD Graphics (Broadwell) GPU Base Speed GPU Boost / Turbo Intel Pentium 3825U 2 x 1900 MHz, 15 W 100 MHz 850 MHz Intel Celeron 3765U 2 x 1900 MHz, 15 W 300 MHz 850 MHz Intel Pentium 3805U 2 x 1900 MHz, 15 W 100 MHz 800 MHz » show 3 more Intel Celeron 3755U 2 x 1700 MHz, 15 W 100 MHz 800 MHz Intel Celeron 3215U 2 x 1700 MHz, 15 W 300 MHz 850 MHz Intel Celeron 3205U 2 x 1500 MHz, 15 W 100 MHz 800 MHz min. - max. 100 - 300 MHz 800 - 850 MHz
CPU in HD Graphics (Cherry Trail) GPU Base Speed GPU Boost / Turbo Intel Atom x7-Z8700 4 x 1600 MHz 200 MHz 600 MHz Intel Atom x5-Z8500 4 x 1440 MHz 200 MHz 600 MHz Intel Atom x5-Z8350 4 x 1440 MHz 200 MHz 500 MHz » show 2 more Intel Atom x5-Z8300 4 x 1440 MHz 200 MHz 500 MHz Intel Atom x5-E8000 4 x 1040 MHz, 5 W 320 MHz ? MHz min. - max. 100 - 320 MHz ? - 850 MHz
CPU in HD Graphics 4200 GPU Base Speed GPU Boost / Turbo Intel Core i7-4610Y 2 x 1700 MHz, 11.5 W 200 MHz 850 MHz Intel Core i5-4300Y 2 x 1600 MHz, 11.5 W 200 MHz 850 MHz Intel Core i5-4302Y 2 x 1600 MHz, 11.5 W 200 MHz 850 MHz » show 8 more Intel Core i5-4202Y 2 x 1600 MHz, 11.5 W 200 MHz 850 MHz Intel Core i5-4220Y 2 x 1600 MHz, 11.5 W 200 MHz 850 MHz Intel Core i5-4210Y 2 x 1500 MHz, 11.5 W 200 MHz 850 MHz Intel Core i5-4200Y 2 x 1400 MHz, 11.5 W 200 MHz 850 MHz Intel Core i3-4030Y 2 x 1600 MHz, 11.5 W 200 MHz 850 MHz Intel Core i3-4020Y 2 x 1500 MHz, 11.5 W 200 MHz 850 MHz Intel Core i3-4012Y 2 x 1500 MHz, 11.5 W 200 MHz 850 MHz Intel Core i3-4010Y 2 x 1300 MHz, 11.5 W 200 MHz 850 MHz min. - max. 100 - 320 MHz 850 MHz
Benchmarks Performance Rating - 3DMark 11 + Fire Strike + Time Spy - HD Graphics (Broadwell)
0.2 pt (1%)
...
Intel HD Graphics (Broadwell)
...
max:
Performance Rating - 3DMark 11 + Fire Strike + Time Spy - HD Graphics (Cherry Trail)
0.1 pt (0%)
Intel HD Graphics (Cherry Trail)
...
max:
Performance Rating - 3DMark 11 + Fire Strike + Time Spy - HD Graphics 4200
0.2 pt (1%)
...
...
max:
3DMark - 3DMark Ice Storm Unlimited Graphics
min: 18563 avg: 20873 median: 19303 (2%) max: 27537 Points
41579 Points (5%)
3DMark - 3DMark Cloud Gate Score
3398 Points (4%)
min: 769 avg: 1454 median: 1488 (2%) max: 1905 Points
min: 1716 avg: 2853 median: 3027 (3%) max: 3754 Points
3DMark - 3DMark Cloud Gate Graphics
4015 Points (1%)
min: 1537 avg: 1851 median: 1783.5 (0%) max: 2272 Points
min: 2101 avg: 3793 median: 3807 (1%) max: 5239 Points
3DMark - 3DMark Fire Strike Standard Score
428 Points (1%)
min: 174 avg: 390.4 median: 248 (0%) max: 1059 Points
min: 199 avg: 369.6 median: 394.5 (1%) max: 512 Points
3DMark - 3DMark Fire Strike Standard Graphics
463 Points (1%)
min: 193 avg: 233 median: 225 (0%) max: 281 Points
min: 218 avg: 410.6 median: 431.5 (0%) max: 578 Points
3DMark - 3DMark Ice Storm Graphics
45539 Points (5%)
min: 7544 avg: 16078 median: 17063.5 (2%) max: 23395 Points
min: 17834 avg: 32317 median: 34087 (4%) max: 46175 Points
3DMark - 3DMark Sling Shot (ES 3.0) Unlimited
min: 1445 avg: 1525 median: 1525 (7%) max: 1605 Points
3DMark - 3DMark Sling Shot (ES 3.0) Unlimited Graphics
min: 1598 avg: 1684 median: 1684 (4%) max: 1770 Points
3DMark - 3DMark Sling Shot Extreme (ES 3.1) Unlimited
min: 1072 avg: 1215 median: 1159 (6%) max: 1414 Points
3DMark - 3DMark Sling Shot Extreme (ES 3.1) Unlimited Graphics
min: 1058 avg: 1251 median: 1142 (3%) max: 1554 Points
3DMark 11 - 3DM11 Performance Score
729 Points (1%)
min: 314 avg: 359.4 median: 343 (0%) max: 562 Points
min: 367 avg: 660 median: 712 (1%) max: 828 Points
3DMark 11 - 3DM11 Performance GPU
641 Points (1%)
min: 278 avg: 319.9 median: 298 (0%) max: 494 Points
min: 329 avg: 624 median: 638 (1%) max: 1060 Points
3DMark Vantage + Intel HD Graphics (Broadwell) 3DMark Vantage - 3DM Vant. Perf. total
2651 Points (1%)
3DM Vant. Perf. total + Intel HD Graphics 4200
min: 2165 avg: 2538 median: 2537.5 (1%) max: 2910 Points
3DM Vant. Perf. GPU no PhysX + Intel HD Graphics (Broadwell) 3DMark Vantage - 3DM Vant. Perf. GPU no PhysX
2196 Points (1%)
3DM Vant. Perf. GPU no PhysX + Intel HD Graphics 4200
min: 1678 avg: 1985 median: 1807 (1%) max: 2471 Points
3DMark 06 3DMark 06 - Standard 1280x1024 + Intel HD Graphics (Broadwell)
5077 Points (7%)
3DMark 06 - Standard 1280x1024 + Intel HD Graphics (Cherry Trail)
min: 2403 avg: 2833 median: 2595 (3%) max: 3330 Points
3DMark 06 - Standard 1280x1024 + Intel HD Graphics 4200
min: 2060 avg: 3529 median: 3383 (4%) max: 5020 Points
3DMark 06 - Standard 1024x768 + Intel HD Graphics (Cherry Trail)
2877 Points (4%)
Unigine Valley 1.0 - Unigine Valley 1.0 DX
1.2 fps (0%)
Unigine Heaven 2.1 - Heaven 2.1 high
10.9 fps (2%)
5.7 fps (1%)
Cinebench R10 Cinebench R10 Shading (32bit) + Intel HD Graphics (Broadwell) Cinebench R10 - Cinebench R10 Shading (32bit)
4886 Points (3%)
Cinebench R10 Shading (32bit) + Intel HD Graphics (Cherry Trail)
min: 1192 avg: 2009 median: 1973 (1%) max: 2551 Points
Cinebench R10 Shading (32bit) + Intel HD Graphics 4200
min: 1991 avg: 4602 median: 4514 (3%) max: 6367 Points
Cinebench R11.5 Cinebench R11.5 OpenGL 64 Bit + Intel HD Graphics (Broadwell) Cinebench R11.5 - Cinebench R11.5 OpenGL 64 Bit
12.8 fps (4%)
Cinebench R11.5 OpenGL 64 Bit + Intel HD Graphics (Cherry Trail)
min: 4.01 avg: 8.8 median: 8.4 (3%) max: 11.71 fps
Cinebench R11.5 OpenGL 64 Bit + Intel HD Graphics 4200
min: 7.65 avg: 14.1 median: 14.9 (5%) max: 19.67 fps
Cinebench R15 + Intel HD Graphics (Broadwell) Cinebench R15 - Cinebench R15 OpenGL 64 Bit
17.8 fps (1%)
Cinebench R15 OpenGL 64 Bit + Intel HD Graphics (Cherry Trail)
min: 6.64 avg: 10.3 median: 9.7 (1%) max: 15.52 fps
Cinebench R15 OpenGL 64 Bit + Intel HD Graphics 4200
min: 8.82 avg: 15.6 median: 17 (1%) max: 19.99 fps
Cinebench R15 OpenGL Ref. Match 64 Bit + Intel HD Graphics (Broadwell) Cinebench R15 - Cinebench R15 OpenGL Ref. Match 64 Bit
98 % (98%)
Cinebench R15 OpenGL Ref. Match 64 Bit + Intel HD Graphics (Cherry Trail)
min: 98 avg: 98 median: 98 (98%) max: 98.6 %
Cinebench R15 OpenGL Ref. Match 64 Bit + Intel HD Graphics 4200
min: 63.3 avg: 87.8 median: 98 (98%) max: 99.6 %
GFXBench - GFXBench Car Chase Offscreen
min: 6.3 avg: 7.3 median: 7 (1%) max: 9 fps
GFXBench 3.1 - GFXBench Manhattan ES 3.1 Offscreen
17.4 fps (0%)
min: 9.2 avg: 10.8 median: 11 (0%) max: 13 fps
GFXBench 3.0 - GFXBench 3.0 Manhattan Offscreen
21.5 fps (1%)
min: 8.4 avg: 13.8 median: 13.5 (1%) max: 18 fps
GFXBench (DX / GLBenchmark) 2.7 + Intel HD Graphics (Broadwell) GFXBench (DX / GLBenchmark) 2.7 - GFXBench T-Rex HD Offscreen C24Z16
47.1 fps (0%)
GFXBench T-Rex HD Offscreen C24Z16 + Intel HD Graphics (Cherry Trail) min: 22 avg: 30.5 median: 32 (0%) max: 38.5 fps
GFXBench T-Rex HD Offscreen C24Z16 + Intel HD Graphics 4200 min: 21 avg: 35.8 median: 37.5 (0%) max: 47 fps
LuxMark v2.0 64Bit - LuxMark v2.0 Room GPU
86 Samples/s (0%)
min: 48 avg: 58.7 median: 59 (0%) max: 69 Samples/s
min: 102 avg: 113.5 median: 113.5 (1%) max: 125 Samples/s
LuxMark v2.0 64Bit - LuxMark v2.0 Sala GPU
182 Samples/s (0%)
min: 69 avg: 87.7 median: 89 (0%) max: 105 Samples/s
min: 162 avg: 176.5 median: 176.5 (0%) max: 191 Samples/s
ComputeMark v2.1 - ComputeMark v2.1 Result
374 Points (0%)
277 Points (0%)
min: 469 avg: 486 median: 486 (1%) max: 503 Points
Average Benchmarks Intel HD Graphics (Broadwell) → 100% n=16 Average Benchmarks Intel HD Graphics (Cherry Trail) → 56% n=16 Average Benchmarks Intel HD Graphics 4200 → 97% n=16
- Range of benchmark values for this graphics card
- Average benchmark values for this graphics card
* Smaller numbers mean a higher performance
1 This benchmark is not used for the average calculation
Game Benchmarks The following benchmarks stem from our benchmarks of review laptops. The performance depends on the used graphics memory, clock rate, processor, system settings, drivers, and operating systems. So the results don't have to be representative for all laptops with this GPU. For detailed information on the benchmark results, click on the fps number.
HD Graphics (Cherry Trail):
21.4 fps
HD Graphics (Cherry Trail):
15.5 fps
HD Graphics (Cherry Trail):
22.6 [X] Chuwi Hi12 Intel Atom x5-Z8300 1.4GHz
HD Graphics (Cherry Trail)
min:
21 fps, max:
27 fps
fps
HD Graphics 4200:
11.2 fps
HD Graphics (Cherry Trail):
11.5 fps
HD Graphics 4200:
17.2 fps
HD Graphics (Cherry Trail):
7 fps
HD Graphics 4200:
10.7 fps
HD Graphics 4200:
11.3 fps
100%
HD Graphics (Broadwell):
15.3 fps
58%
HD Graphics (Cherry Trail):
8.8 fps
125%
HD Graphics 4200:
19.2 fps
100%
HD Graphics (Broadwell):
8.5 fps
56%
HD Graphics (Cherry Trail):
4.8 fps
135%
HD Graphics 4200:
11.5 fps
HD Graphics 4200:
14.9 fps
HD Graphics (Cherry Trail):
8.1 fps
HD Graphics (Cherry Trail):
3.9 fps
100%
HD Graphics (Broadwell):
38.1 fps
100%
HD Graphics (Broadwell):
20.6 fps
100%
HD Graphics (Broadwell):
29 fps
52%
HD Graphics (Cherry Trail):
13.9 [X] Chuwi Hi12 Intel Atom x5-Z8300 1.4GHz
HD Graphics (Cherry Trail)
min:
7 fps, max:
19 fps
16.8 ~ 15 fps
130%
HD Graphics 4200:
37.7 fps
100%
HD Graphics (Broadwell):
20.8 fps
119%
HD Graphics 4200:
24.8 fps
HD Graphics (Cherry Trail):
15.1 fps
HD Graphics 4200:
30.7 fps
HD Graphics (Cherry Trail):
9.8 fps
HD Graphics 4200:
20.5 fps
HD Graphics (Cherry Trail):
20 [X] Chuwi Hi12 Intel Atom x5-Z8300 1.4GHz
HD Graphics (Cherry Trail)
min:
18 fps
fps
HD Graphics (Cherry Trail):
15.2 [X] Chuwi Hi12 Intel Atom x5-Z8300 1.4GHz
HD Graphics (Cherry Trail)
min:
13 fps
fps
HD Graphics (Cherry Trail):
7.2 [X] Chuwi Hi12 Intel Atom x5-Z8300 1.4GHz
HD Graphics (Cherry Trail)
min:
6 fps
fps
100%
HD Graphics (Broadwell):
50 fps
40%
HD Graphics (Cherry Trail):
20.1 fps
136%
HD Graphics 4200:
67.9 fps
100%
HD Graphics (Broadwell):
13.5 fps
93%
HD Graphics (Cherry Trail):
12.5 fps
116%
HD Graphics 4200:
15.6 fps
HD Graphics (Cherry Trail):
10.8 (!) [X] Microsoft Surface 3 Intel Atom x7-Z8700 1.6GHz
HD Graphics (Cherry Trail)
fps
100%
HD Graphics (Broadwell):
23.9 fps
100%
HD Graphics (Broadwell):
16.4 fps
100%
HD Graphics (Broadwell):
13.9 fps
68%
HD Graphics (Cherry Trail):
9.5 fps
101%
HD Graphics 4200:
8.5 18.5 ~ 14 fps
100%
HD Graphics (Broadwell):
9.4 fps
61%
HD Graphics (Cherry Trail):
5.7 fps
96%
HD Graphics 4200:
5.7 11.8 ~ 9 fps
HD Graphics (Cherry Trail):
16.2 fps
HD Graphics (Cherry Trail):
6.1 fps
100%
HD Graphics (Broadwell):
34 fps
47%
HD Graphics (Cherry Trail):
16 fps
47%
HD Graphics 4200:
16 fps
100%
HD Graphics (Broadwell):
24 fps
50%
HD Graphics (Cherry Trail):
12 fps
50%
HD Graphics 4200:
12 fps
HD Graphics 4200:
12.9 fps
HD Graphics 4200:
3.4 4 ~ 4 fps
HD Graphics (Cherry Trail):
15.6 fps
HD Graphics 4200:
15.3 fps
HD Graphics 4200:
10.9 fps
100%
HD Graphics (Broadwell):
113.6 fps
78%
HD Graphics 4200:
89.1 fps
100%
HD Graphics (Broadwell):
26.3 fps
93%
HD Graphics 4200:
24.4 fps
HD Graphics (Cherry Trail):
5.5 10 ~ 8 fps
HD Graphics 4200:
19.9 fps
HD Graphics 4200:
11.7 fps
100%
HD Graphics (Broadwell):
57.6 fps
43%
HD Graphics (Cherry Trail):
22 27.3 ~ 25 fps
100%
HD Graphics 4200:
57.5 fps
100%
HD Graphics (Broadwell):
22.6 fps
58%
HD Graphics (Cherry Trail):
12.5 13.5 ~ 13 fps
84%
HD Graphics 4200:
18.9 fps
HD Graphics 4200:
27.2 fps
HD Graphics 4200:
21.9 fps
HD Graphics 4200:
43.1 fps
HD Graphics 4200:
23.4 fps
HD Graphics 4200:
11 14 ~ 13 fps
HD Graphics 4200:
5.3 7.1 ~ 6 fps
HD Graphics 4200:
26.2 fps
HD Graphics 4200:
13.9 fps
HD Graphics 4200:
14.1 fps
HD Graphics 4200:
18.4 fps
HD Graphics 4200:
12.7 fps
HD Graphics (Cherry Trail):
13.3 fps
HD Graphics 4200:
15.9 fps
HD Graphics 4200:
10.1 fps
HD Graphics 4200:
90.8 fps
HD Graphics 4200:
59.7 fps
HD Graphics 4200:
33.3 fps
HD Graphics 4200:
22.3 fps
HD Graphics 4200:
27.7 fps
HD Graphics 4200:
18.4 fps
HD Graphics 4200:
13.3 fps
HD Graphics 4200:
11.3 fps
HD Graphics 4200:
11.9 fps
HD Graphics 4200:
17.8 fps
HD Graphics 4200:
10.4 fps
HD Graphics (Cherry Trail):
58 fps
HD Graphics (Cherry Trail):
47 fps
HD Graphics (Cherry Trail):
29.7 fps
HD Graphics (Cherry Trail):
16.5 fps
HD Graphics (Cherry Trail):
24 fps
HD Graphics 4200:
51.1 fps
HD Graphics (Cherry Trail):
13.5 fps
HD Graphics 4200:
25.7 fps
HD Graphics 4200:
17.9 fps
100%
HD Graphics (Broadwell):
13.7 fps
93%
HD Graphics 4200:
12.7 fps
100%
HD Graphics (Broadwell):
10.7 fps
85%
HD Graphics 4200:
9.1 fps
100%
HD Graphics (Broadwell):
7 fps
76%
HD Graphics 4200:
5.3 fps
100%
HD Graphics (Broadwell):
25.3 fps
75%
HD Graphics (Cherry Trail):
16 18 18.9 [X] Medion Akoya E2215T Intel Atom x5-Z8350 1.4GHz
HD Graphics (Cherry Trail)
19.8 20.1 20.5 ~ 19 fps
100%
HD Graphics (Broadwell):
14.1 fps
64%
HD Graphics (Cherry Trail):
6.4 7.9 [X] Medion Akoya E2215T Intel Atom x5-Z8350 1.4GHz
HD Graphics (Cherry Trail)
9.3 9.8 10 10 ~ 9 fps
100%
HD Graphics (Broadwell):
11.7 fps
60%
HD Graphics (Cherry Trail):
5.6 5.7 [X] Medion Akoya E2215T Intel Atom x5-Z8350 1.4GHz
HD Graphics (Cherry Trail)
6.7 7.6 7.9 8.4 ~ 7 fps
HD Graphics (Cherry Trail):
2.4 2.6 ~ 2 fps
HD Graphics 4200:
95 109.2 ~ 102 fps
HD Graphics 4200:
31 38.8 ~ 35 fps
HD Graphics 4200:
20 22.7 ~ 21 fps
HD Graphics 4200:
18.8 fps
HD Graphics 4200:
10.1 fps
100%
HD Graphics (Broadwell):
34.7 fps
100%
HD Graphics (Broadwell):
17.7 fps
100%
HD Graphics (Broadwell):
11.7 fps
68%
HD Graphics (Cherry Trail):
7 8.3 9 ~ 8 fps
HD Graphics (Cherry Trail):
3.7 3.8 ~ 4 fps
HD Graphics 4200:
11.4 fps
HD Graphics 4200:
47.6 fps
HD Graphics 4200:
20.9 fps
HD Graphics 4200:
14.2 fps
HD Graphics (Cherry Trail):
34 fps
HD Graphics 4200:
26.2 fps
HD Graphics 4200:
16.5 fps
100%
HD Graphics (Broadwell):
15.6 fps
107%
HD Graphics 4200:
16.7 fps
100%
HD Graphics (Broadwell):
11.4 fps
100%
HD Graphics 4200:
11.4 fps
100%
HD Graphics (Broadwell):
5.3 fps
72%
HD Graphics 4200:
3.8 fps
HD Graphics 4200:
27.2 fps
HD Graphics 4200:
19.1 fps
HD Graphics 4200:
22.9 fps
HD Graphics 4200:
15.1 fps
HD Graphics (Cherry Trail):
15.2 fps
HD Graphics 4200:
17.8 fps
HD Graphics (Cherry Trail):
11.6 fps
HD Graphics 4200:
14.5 fps
HD Graphics 4200:
13.9 fps
HD Graphics 4200:
104.8 fps
HD Graphics 4200:
55.6 fps
HD Graphics 4200:
49.2 fps
HD Graphics 4200:
31.7 fps
HD Graphics (Cherry Trail):
0 (!) [X] Microsoft Surface 3 Intel Atom x7-Z8700 1.6GHz
HD Graphics (Cherry Trail)
fps
HD Graphics (Cherry Trail):
0 (!) [X] Microsoft Surface 3 Intel Atom x7-Z8700 1.6GHz
HD Graphics (Cherry Trail)
fps
HD Graphics 4200:
15.5 fps
100%
HD Graphics (Broadwell):
43.7 fps
162%
HD Graphics 4200:
70.7 fps
100%
HD Graphics (Broadwell):
31.5 fps
113%
HD Graphics 4200:
35.5 fps
100%
HD Graphics (Broadwell):
23.9 fps
85%
HD Graphics (Cherry Trail):
20.3 fps
79%
HD Graphics 4200:
18.9 fps
HD Graphics (Cherry Trail):
11.4 fps
HD Graphics 4200:
12.5 fps
HD Graphics 4200:
22.7 fps
HD Graphics 4200:
16.5 fps
HD Graphics 4200:
34.5 fps
HD Graphics 4200:
18.9 fps
HD Graphics 4200:
12.6 fps
100%
HD Graphics (Broadwell):
38.4 fps
73%
HD Graphics (Cherry Trail):
24.3 [X] Chuwi Hi12 Intel Atom x5-Z8300 1.4GHz
HD Graphics (Cherry Trail)
min:
20 fps, max:
29 fps
31.9 ~ 28 fps
100%
HD Graphics (Broadwell):
24.9 fps
72%
HD Graphics (Cherry Trail):
16 [X] Chuwi Hi12 Intel Atom x5-Z8300 1.4GHz
HD Graphics (Cherry Trail)
min:
13 fps, max:
19 fps
19 ~ 18 fps
100%
HD Graphics (Broadwell):
19.7 fps
91%
HD Graphics 4200:
16.9 19 ~ 18 fps
HD Graphics 4200:
28.2 fps
HD Graphics 4200:
19.5 fps
HD Graphics 4200:
11.1 fps
HD Graphics (Cherry Trail):
8 fps
HD Graphics (Cherry Trail):
15.5 18.9 ~ 17 fps
HD Graphics 4200:
24.4 fps
HD Graphics (Cherry Trail):
7.2 8.5 ~ 8 fps
HD Graphics 4200:
10.2 fps
HD Graphics 4200:
13.9 fps
HD Graphics (Cherry Trail):
25.6 fps
HD Graphics (Cherry Trail):
12 fps
HD Graphics 4200:
15.4 19 ~ 17 fps
HD Graphics (Cherry Trail):
28.1 fps
HD Graphics (Cherry Trail):
12.5 fps
HD Graphics 4200:
12 34.1 ~ 23 fps
HD Graphics 4200:
20.4 fps
HD Graphics 4200:
54.8 fps
HD Graphics (Cherry Trail):
18.7 fps
HD Graphics (Cherry Trail):
63.2 64 ~ 64 fps
HD Graphics (Cherry Trail):
18 18.8 ~ 18 fps
HD Graphics (Cherry Trail):
14 fps
HD Graphics (Cherry Trail):
7 fps
HD Graphics 4200:
32.2 fps
HD Graphics 4200:
24.5 fps
HD Graphics 4200:
15.6 fps
HD Graphics 4200:
37.5 fps
HD Graphics 4200:
19.5 fps
HD Graphics 4200:
56.5 fps
HD Graphics 4200:
22.8 fps
HD Graphics 4200:
121 [X] Panasonic ToughPad FZ-M1 Intel Core i5-4302Y 1.6GHz
HD Graphics 4200
130 ~ 126 fps
HD Graphics 4200:
43.9 46.9 [X] Panasonic ToughPad FZ-M1 Intel Core i5-4302Y 1.6GHz
HD Graphics 4200
~ 45 fps
HD Graphics (Cherry Trail):
44 50.9 [X] Chuwi Hi12 Intel Atom x5-Z8300 1.4GHz
HD Graphics (Cherry Trail)
min:
40 fps, max:
60 fps
~ 47 fps
HD Graphics 4200:
64.6 fps
HD Graphics (Cherry Trail):
18.3 [X] Chuwi Hi12 Intel Atom x5-Z8300 1.4GHz
HD Graphics (Cherry Trail)
min:
13 fps, max:
29 fps
fps
HD Graphics 4200:
53.4 fps
Average Gaming Intel HD Graphics (Broadwell) → 100% Average Gaming 30-70 fps → 100%
Average Gaming Intel HD Graphics (Cherry Trail) → 63% Average Gaming Intel HD Graphics 4200 → 97% Average Gaming 30-70 fps → 110%
Intel HD Graphics (Broadwell) low med. high ultra QHD 4K Star Wars Battlefront 15.3 8.5 FIFA 16 38.1 20.6 World of Warships 29 20.8 Dirt Rally 50 13.5 Battlefield Hardline 23.9 16.4 Dragon Age: Inquisition 13.9 9.4 F1 2014 34 24 Sims 4 113.6 26.3 GRID: Autosport 57.6 22.6 Metro: Last Light 13.7 10.7 7 BioShock Infinite 25.3 14.1 11.7 Tomb Raider 34.7 17.7 11.7 Hitman: Absolution 15.6 11.4 5.3 Counter-Strike: GO 43.7 31.5 23.9 Diablo III 38.4 24.9 19.7 < 30 fps < 60 fps < 120 fps ≥ 120 fps 7 7 1 13 1 7
For more games that might be playable and a list of all games and graphics cards visit our Gaming List
v1.26
log 30. 14:04:36
#0 checking url part for id 5979 +0s ... 0s
#1 checking url part for id 6197 +0s ... 0s
#2 checking url part for id 4576 +0s ... 0s
#3 not redirecting to Ajax server +0s ... 0s
#4 did not recreate cache, as it is less than 5 days old! Created at Tue, 28 May 2024 05:35:22 +0200 +0.001s ... 0.001s
#5 composed specs +0.126s ... 0.128s
#6 did output specs +0s ... 0.128s
#7 start showIntegratedCPUs +0s ... 0.128s
#8 getting avg benchmarks for device 5979 +0.061s ... 0.188s
#9 got single benchmarks 5979 +0.016s ... 0.205s
#10 getting avg benchmarks for device 6197 +0.014s ... 0.218s
#11 got single benchmarks 6197 +0.074s ... 0.293s
#12 getting avg benchmarks for device 4576 +0.013s ... 0.306s
#13 got single benchmarks 4576 +0.038s ... 0.344s
#14 got avg benchmarks for devices +0s ... 0.344s
#15 min, max, avg, median took s +0.369s ... 0.713s
#16 before gaming benchmark output +0s ... 0.713s
#17 Got 438 rows for game benchmarks. +0.043s ... 0.756s
#18 composed SQL query for gamebenchmarks +0s ... 0.756s
#19 got data and put it in $dataArray +0.056s ... 0.813s
#20 benchmarks composed for output. +0.189s ... 1.002s
#21 calculated avg scores. +0s ... 1.002s
#22 return log +0.003s ... 1.005s
Please share our article, every link counts!
Redaktion, 2017-09- 8 (Update: 2023-07- 1)
 Deutsch
 English
 Español
 Français
 Italiano
 Nederlands
 Polski
 Português
 Русский
 Türkçe
 Svenska
 Chinese
 Magyar