
Ryzen 3 Review: 1200 and 1300X for Desktop PCs
With AMD's Ryzen 3, the Zen architecture has trickled down into the entry-level market. Lacking SMT, the affordable CPUs did fairly well in our tests regardless, and are most certainly a viable alternative and worthy of a recommendation for entry-level systems.
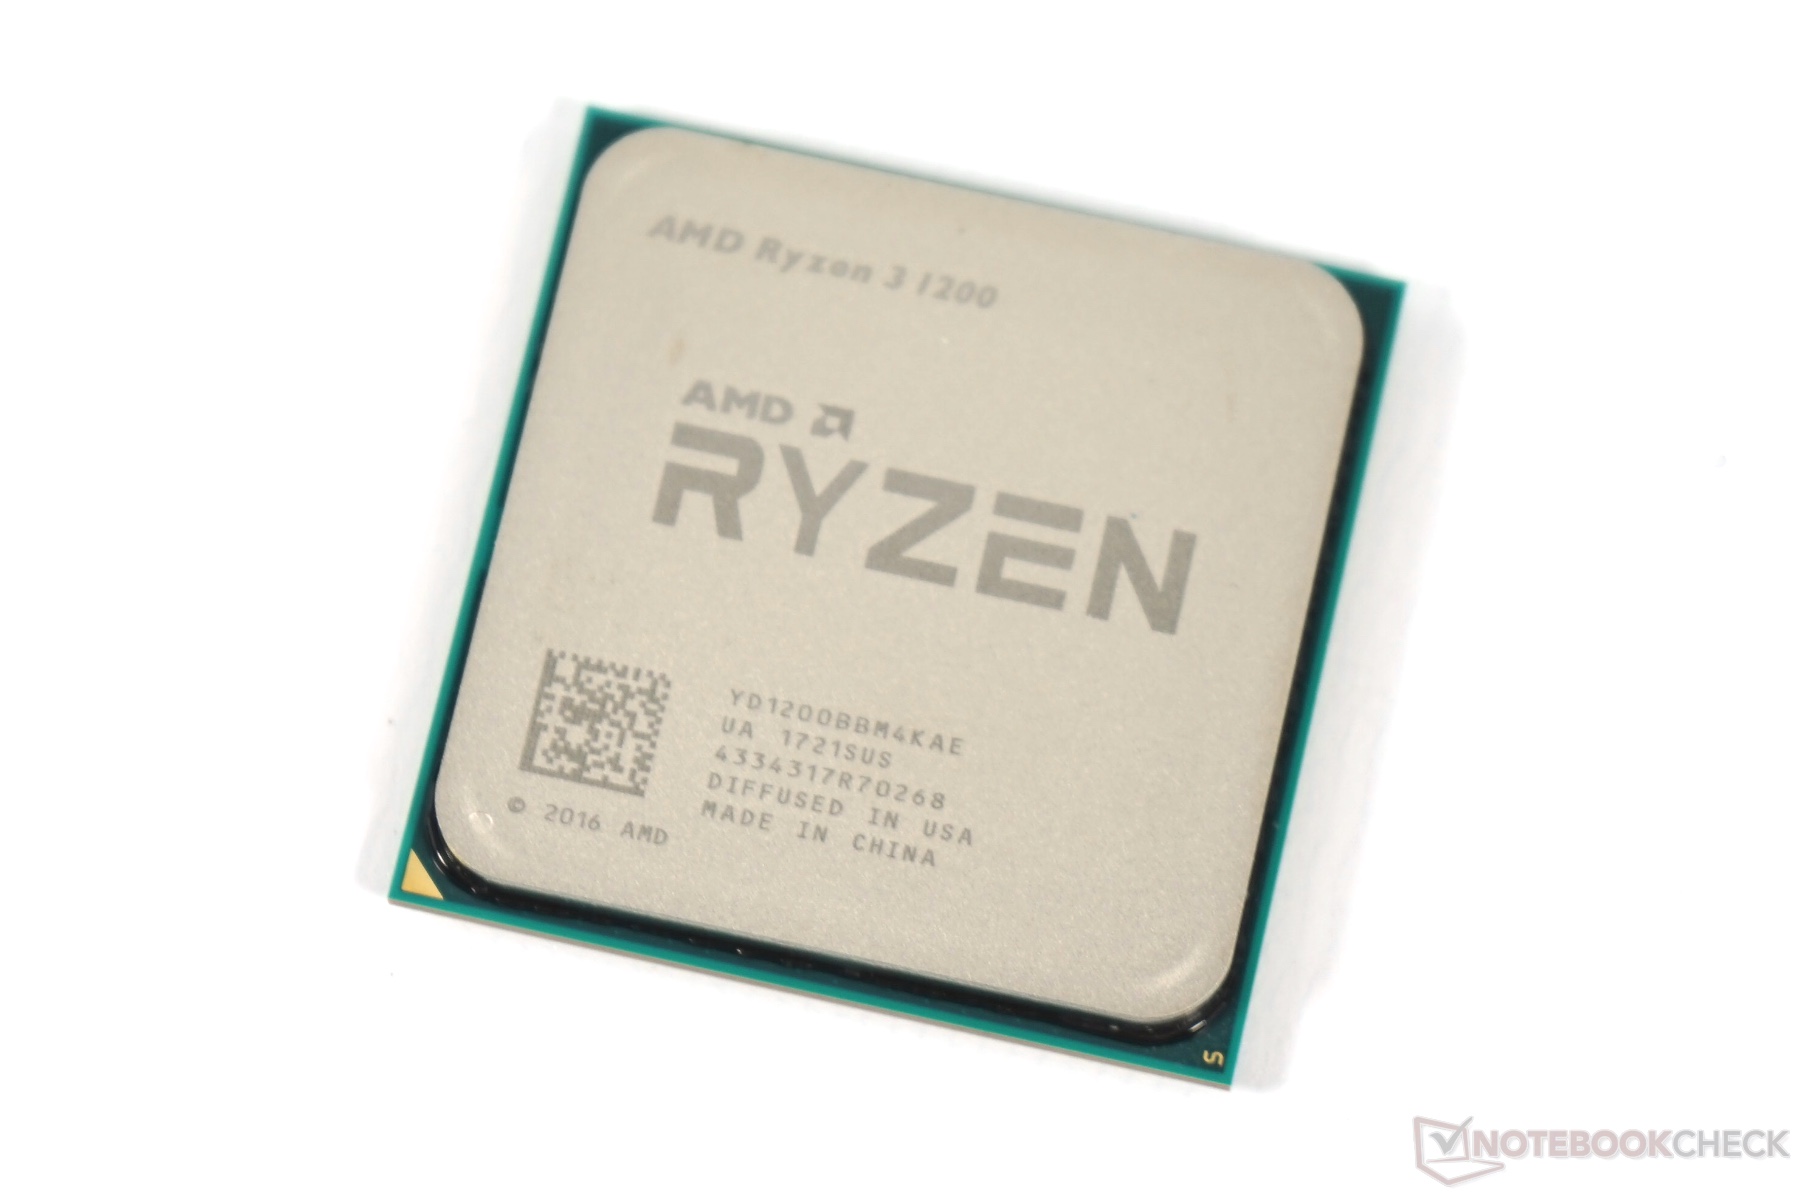
AMD Ryzen 3 1200, NVIDIA GeForce GTX 1080 Ti (Desktop)