Asus Zephyrus G14 Ryzen 9 GeForce RTX 2060 Max-Q Laptop Review: Kicking Core i9 to the Curb
If you ever wanted a gaming laptop and thought 15.6-inch solutions would be too big, then this latest Asus system might be for you. The Zephyrus G14 is one of the very few 14-inch gaming laptops in the market which will definitely help it stand out from the crowded 15.6-inch and 17.3-inch space. Other 14-inch laptops with dedicated GeForce graphics exist, but they have either been discontinued (MSI GS43VR) or are not "true" gaming laptops (MSI Prestige 14, ZenBook 14) in the traditional sense.
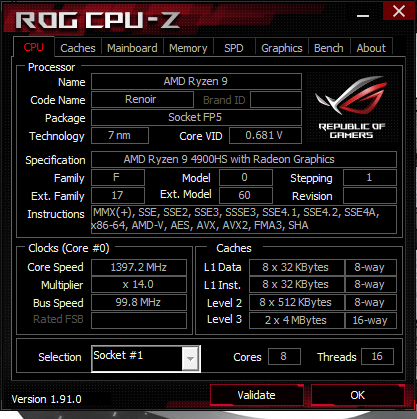
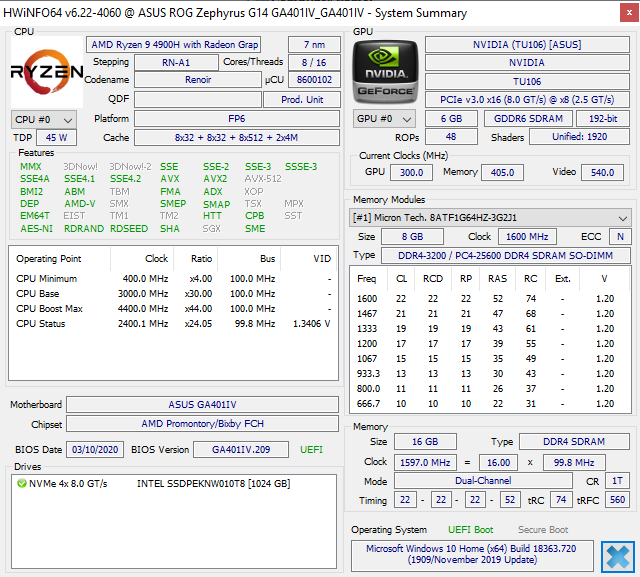
Aside from its uncommon screen size for the category, the Zephyrus G14 also carries the distinction of being the first laptop to ship with a next generation 7 nm AMD Renoir H-series CPU. Our particular test unit has been configured with the octa-core Ryzen 9 4900HS designed to compete directly with the octa-core Intel Core i9-9880H or Core i9-9980HK. The CPU comes paired with the new GeForce RTX 2060 Max-Q which we didn't expect to come to fruition.
Lesser SKUs with the Ryzen 7 4800HS CPU and GTX 1660 Ti GPU are expected to be made available at a future date and there are even plans for a WQHD (2560 x 1440) display option. Prices will range from $1049 to $1999 USD.
Direct competitors in the 14-inch gaming space are far and few between and so we will instead compare the Zephyrus G14 to upper mid-range and high-end ultrathin gaming laptops like the Razer Blade 15, MSI GS65, Aorus 15, Alienware m15 R2, and other Asus Zephyrus laptops.
A more traditional 15.6-inch Zephyrus G15 will also be coming for fans who want something larger than our 14-inch Zephyrus G14.
More Asus Zephyrus reviews:
Rating | Date | Model | Weight | Height | Size | Resolution | Price |
|---|---|---|---|---|---|---|---|
| 83.6 % v7 (old) | 03 / 2020 | Asus Zephyrus G14 GA401IV R9 4900HS, GeForce RTX 2060 Max-Q | 1.6 kg | 17.9 mm | 14.00" | 1920x1080 | |
| 82.9 % v7 (old) | 10 / 2019 | Asus ROG Zephyrus M15 GU502GU-XB74 i7-9750H, GeForce GTX 1660 Ti Mobile | 2 kg | 18.9 mm | 15.60" | 1920x1080 | |
| 84.2 % v7 (old) | 09 / 2019 | Razer Blade 15 GTX 1660 Ti i7-9750H, GeForce GTX 1660 Ti Mobile | 2.1 kg | 19.9 mm | 15.60" | 1920x1080 | |
| 83.8 % v7 (old) | 06 / 2019 | MSI GS65 Stealth 9SG i7-9750H, GeForce RTX 2080 Max-Q | 2 kg | 18 mm | 15.60" | 1920x1080 | |
| 83 % v7 (old) | 09 / 2019 | Alienware m15 R2 P87F i7-9750H, GeForce RTX 2080 Max-Q | 2.2 kg | 18.3 mm | 15.60" | 1920x1080 | |
| 84.2 % v7 (old) | 02 / 2020 | MSI Prestige 14 A10SC-009 i7-10710U, GeForce GTX 1650 Max-Q | 1.3 kg | 16 mm | 14.00" | 3840x2160 |
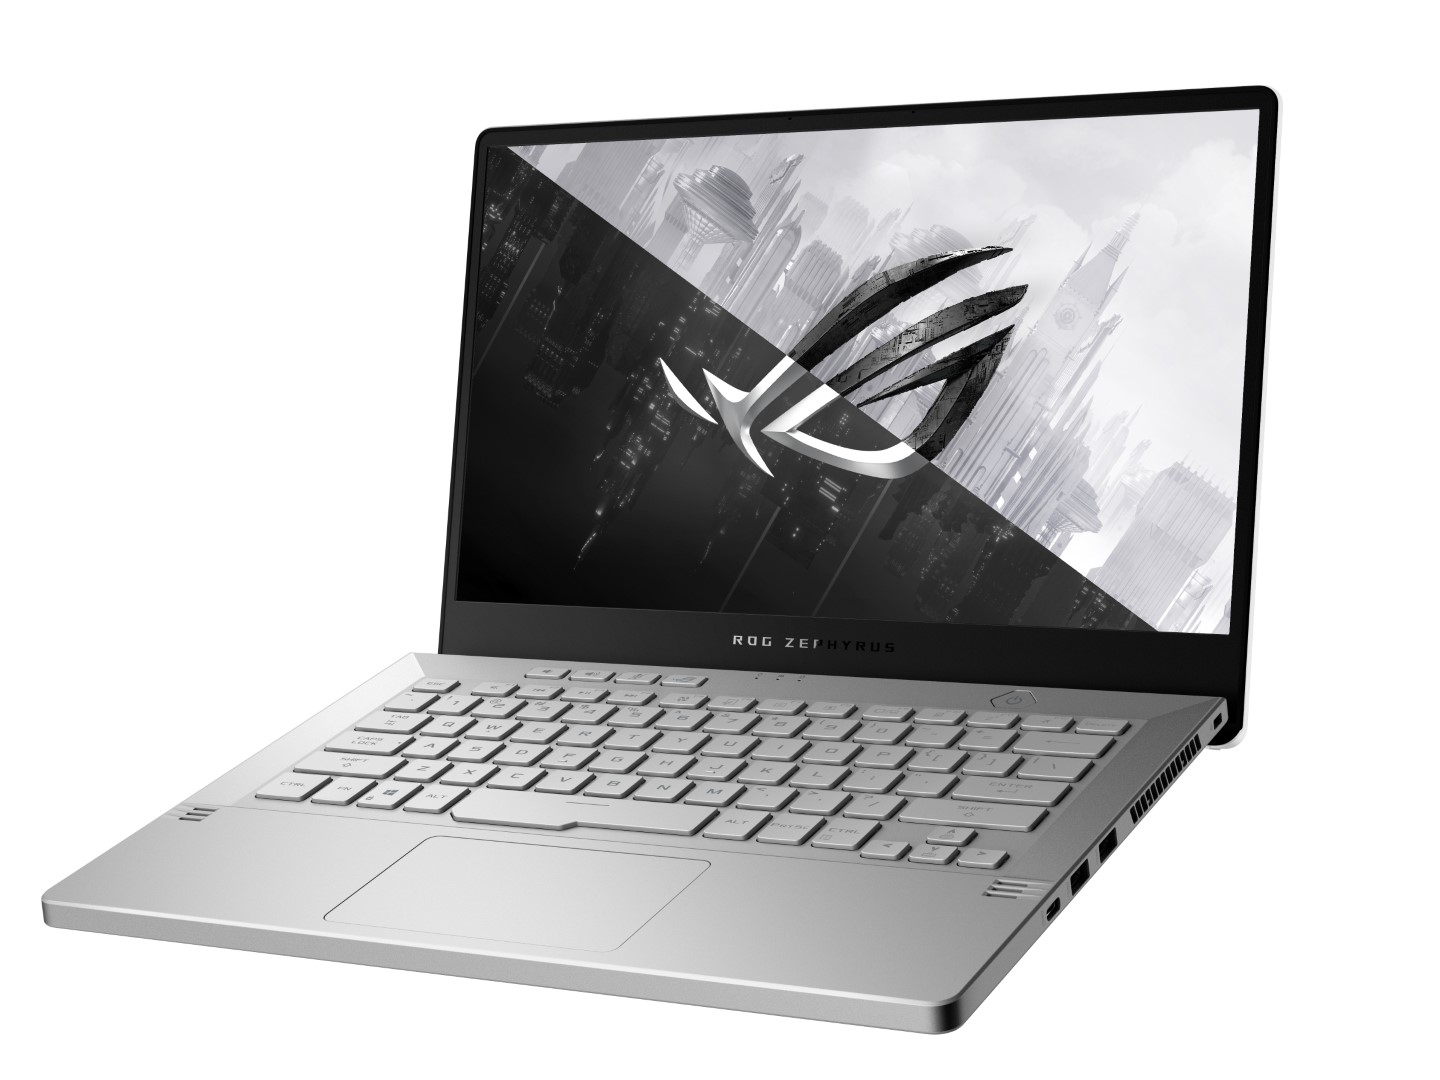
Case: A Miniature Zephyrus
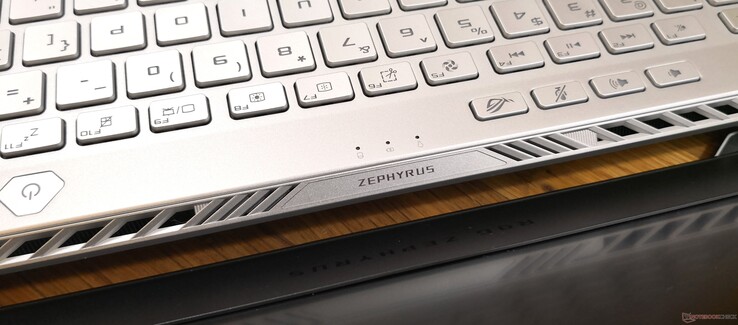
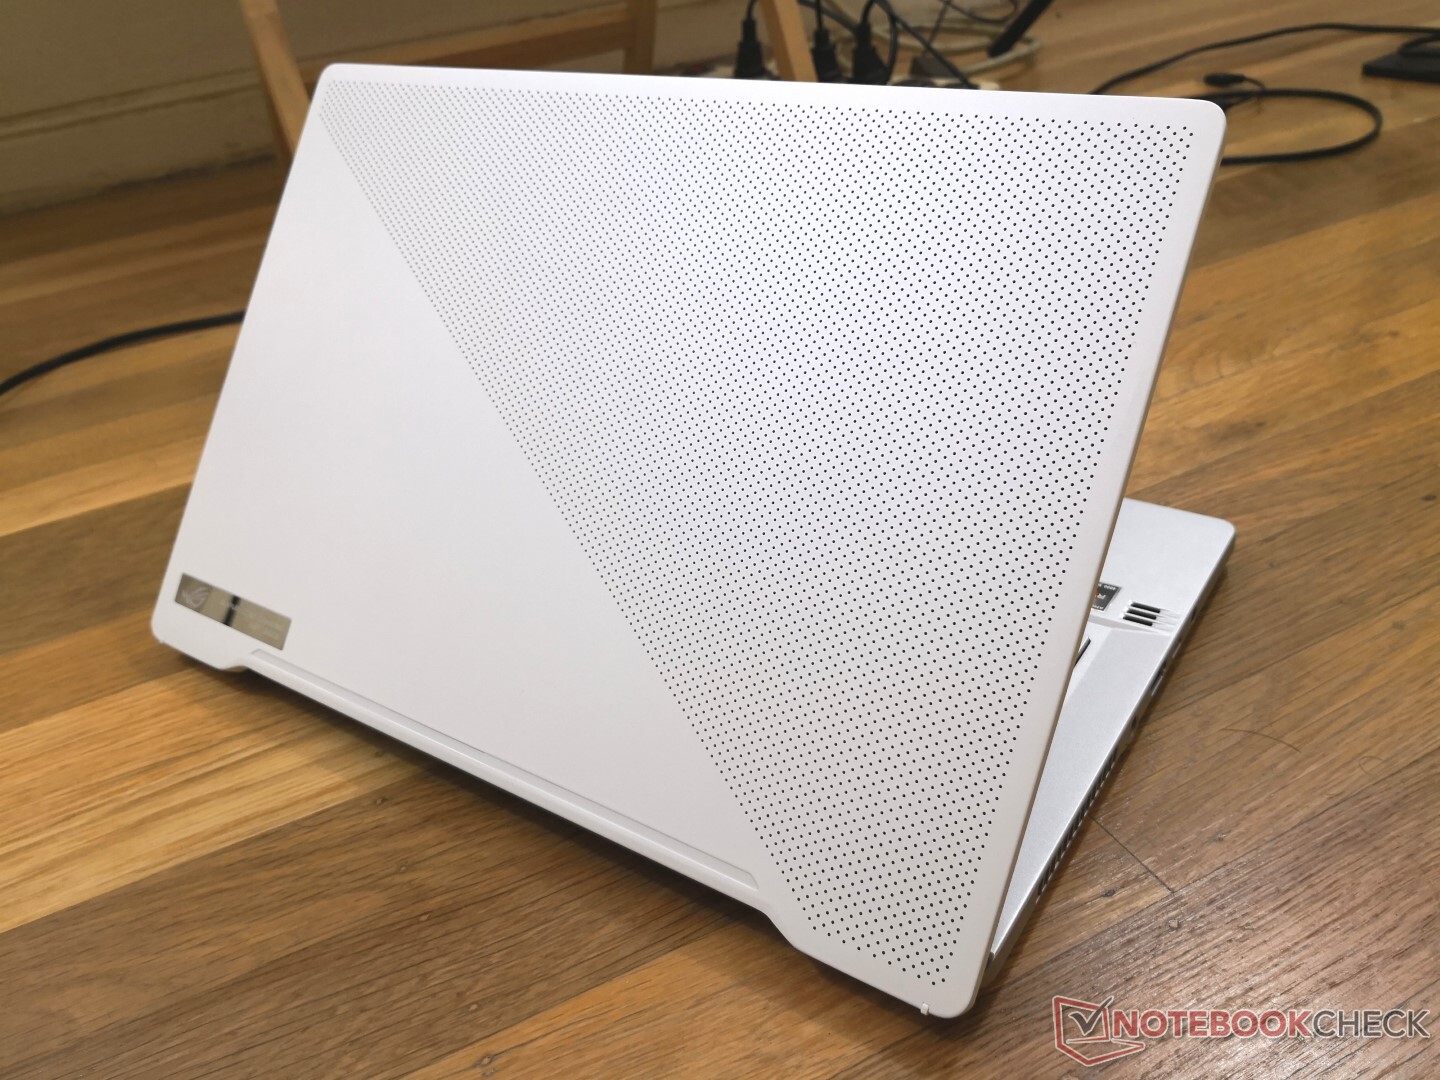
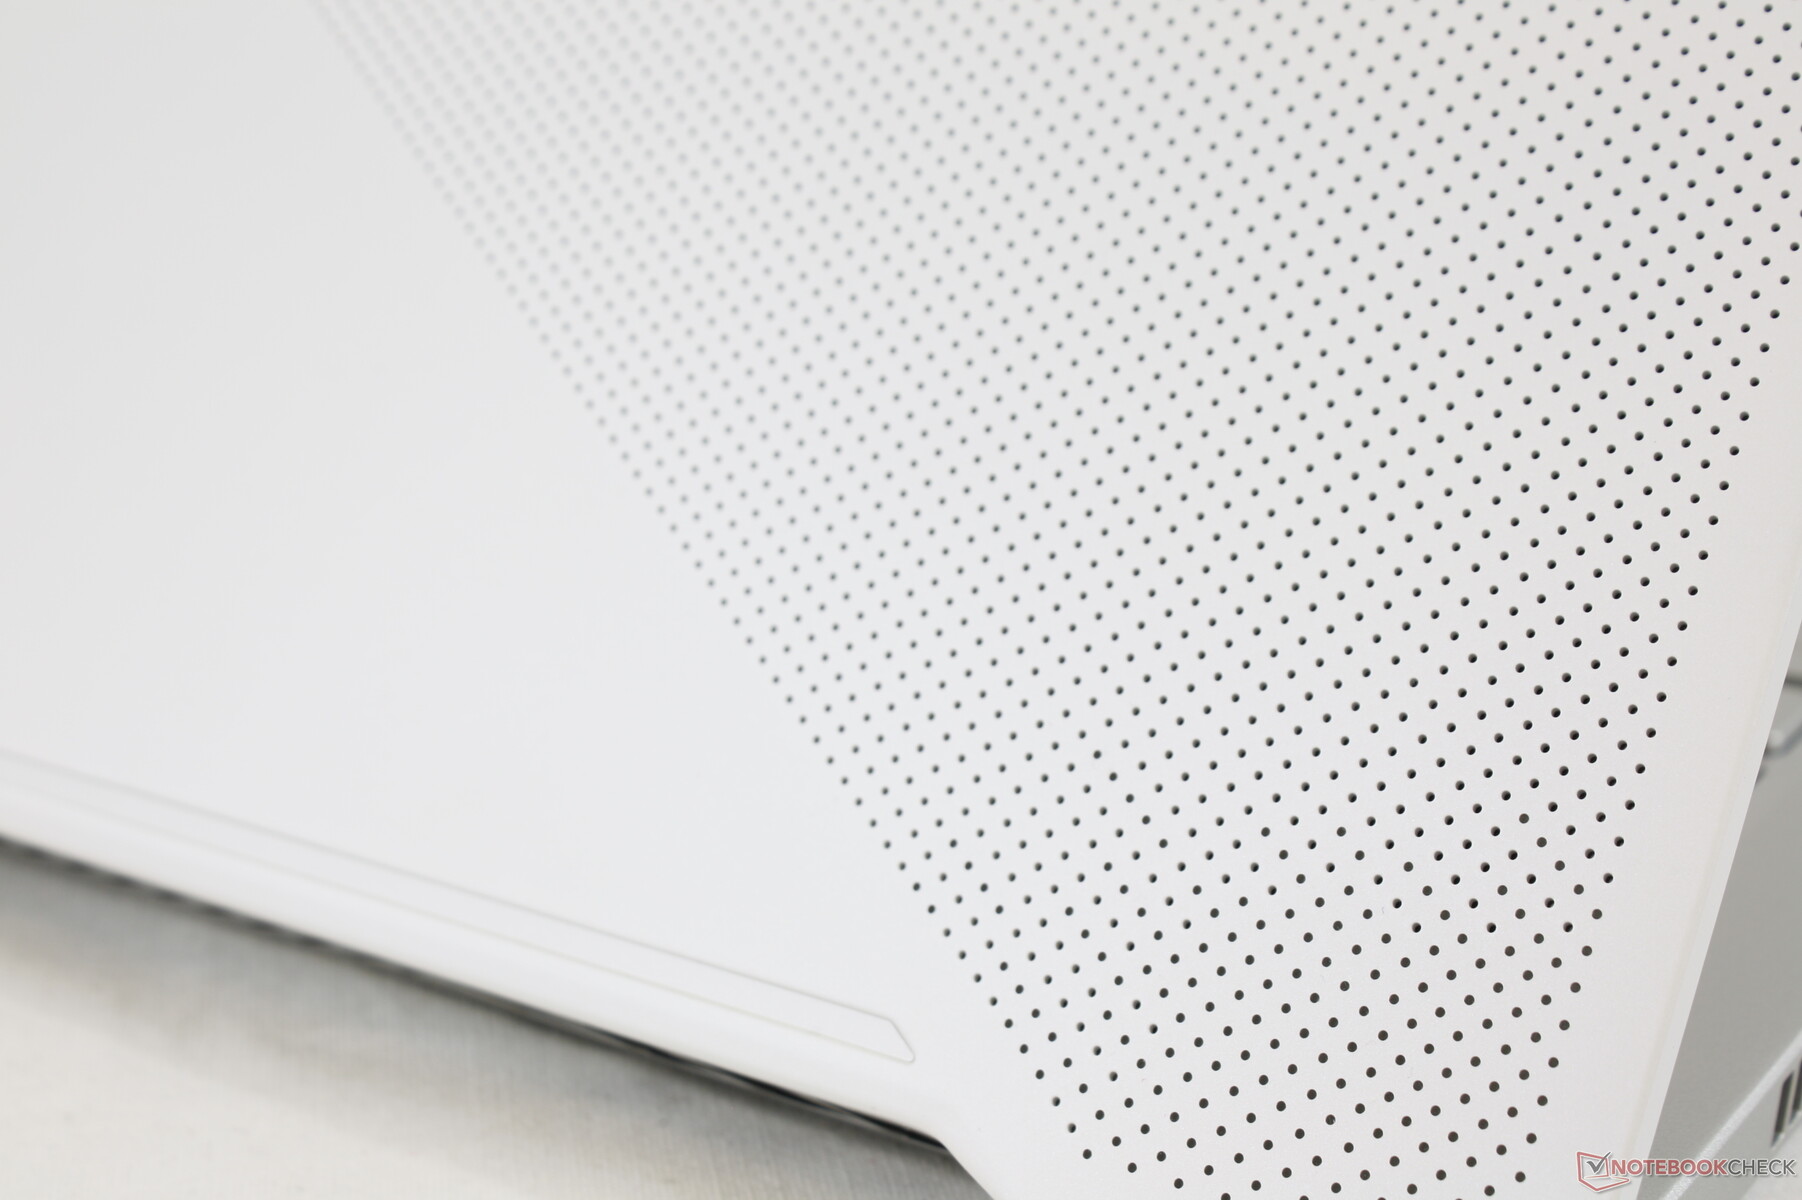
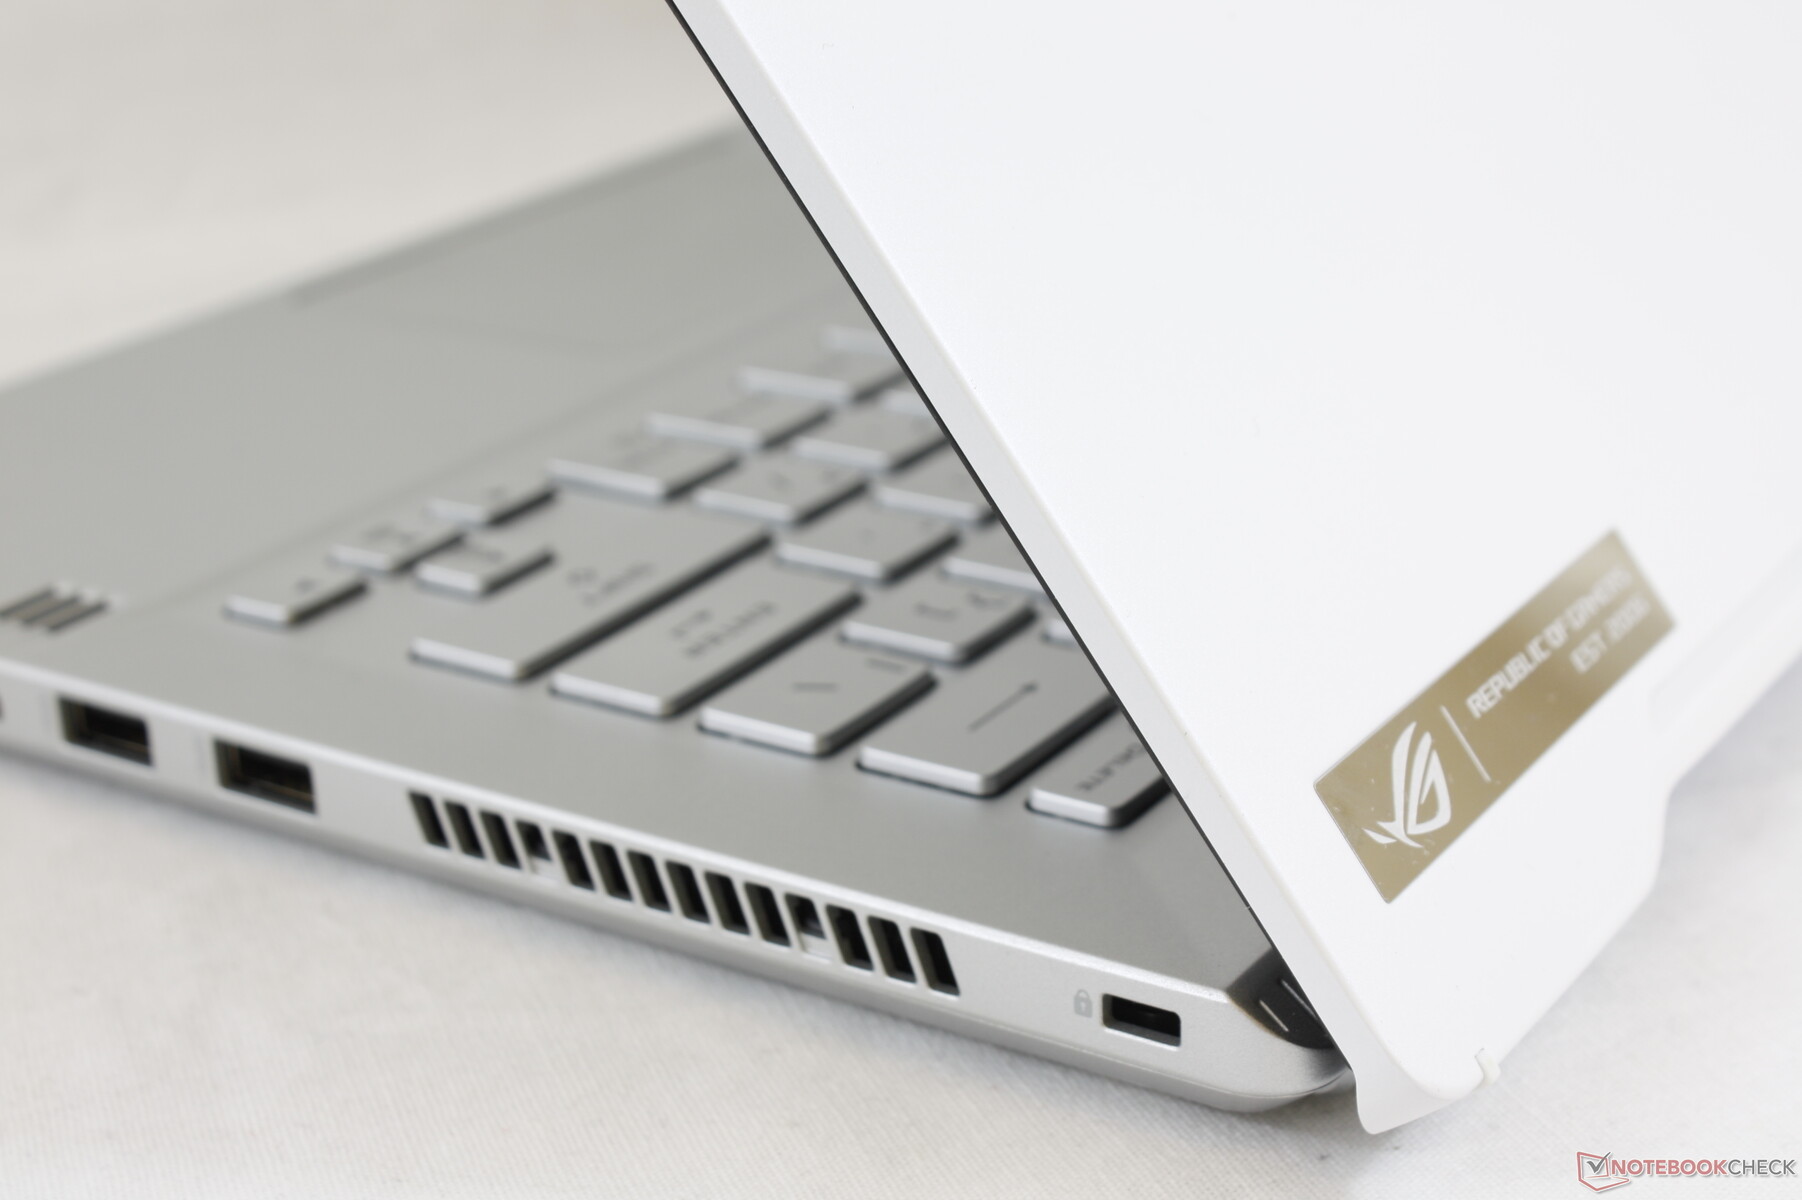
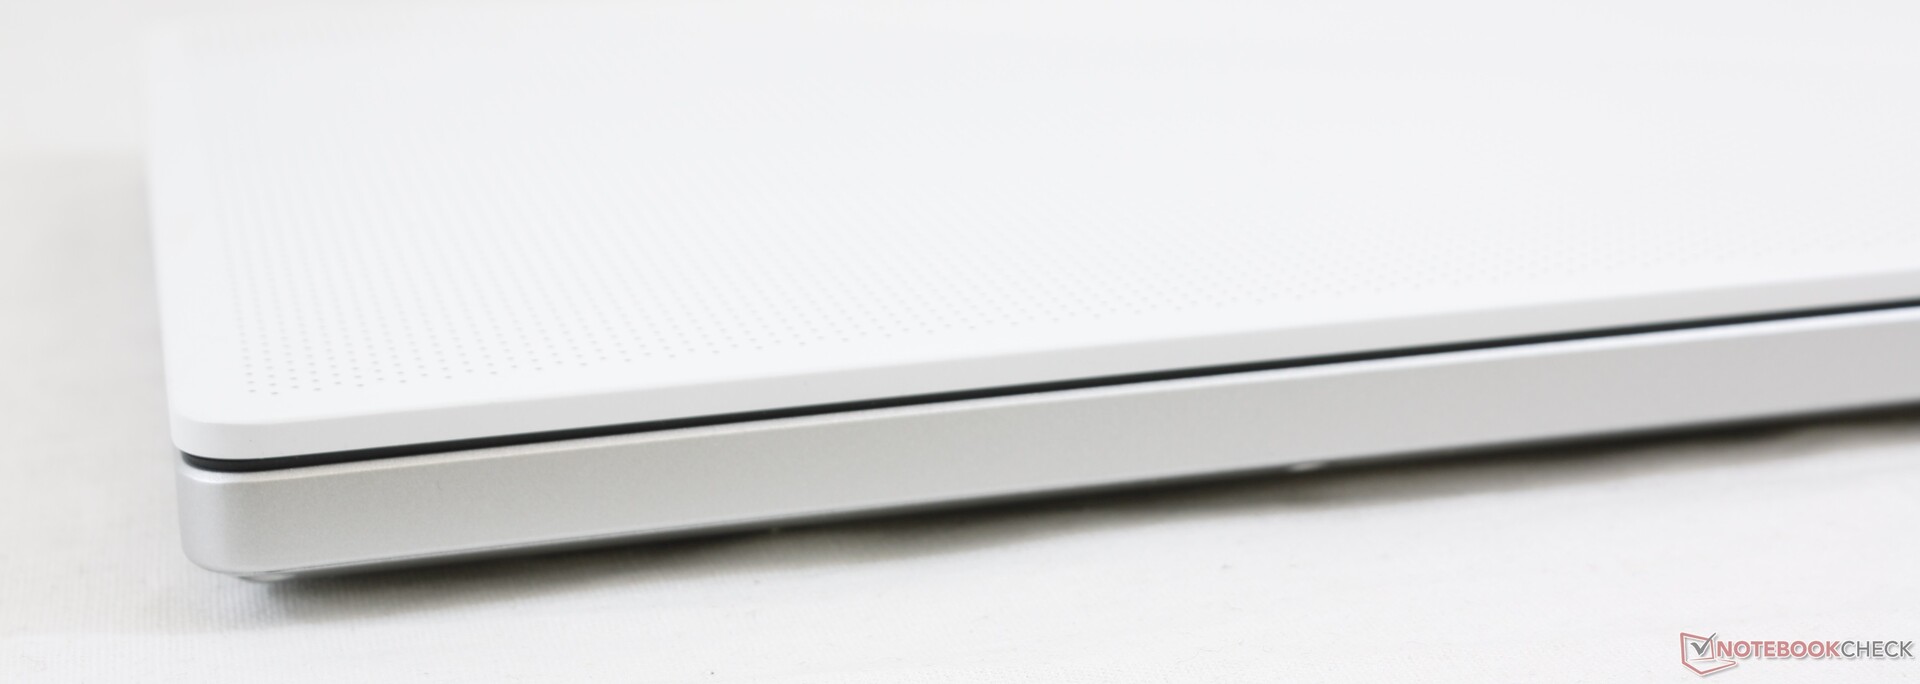
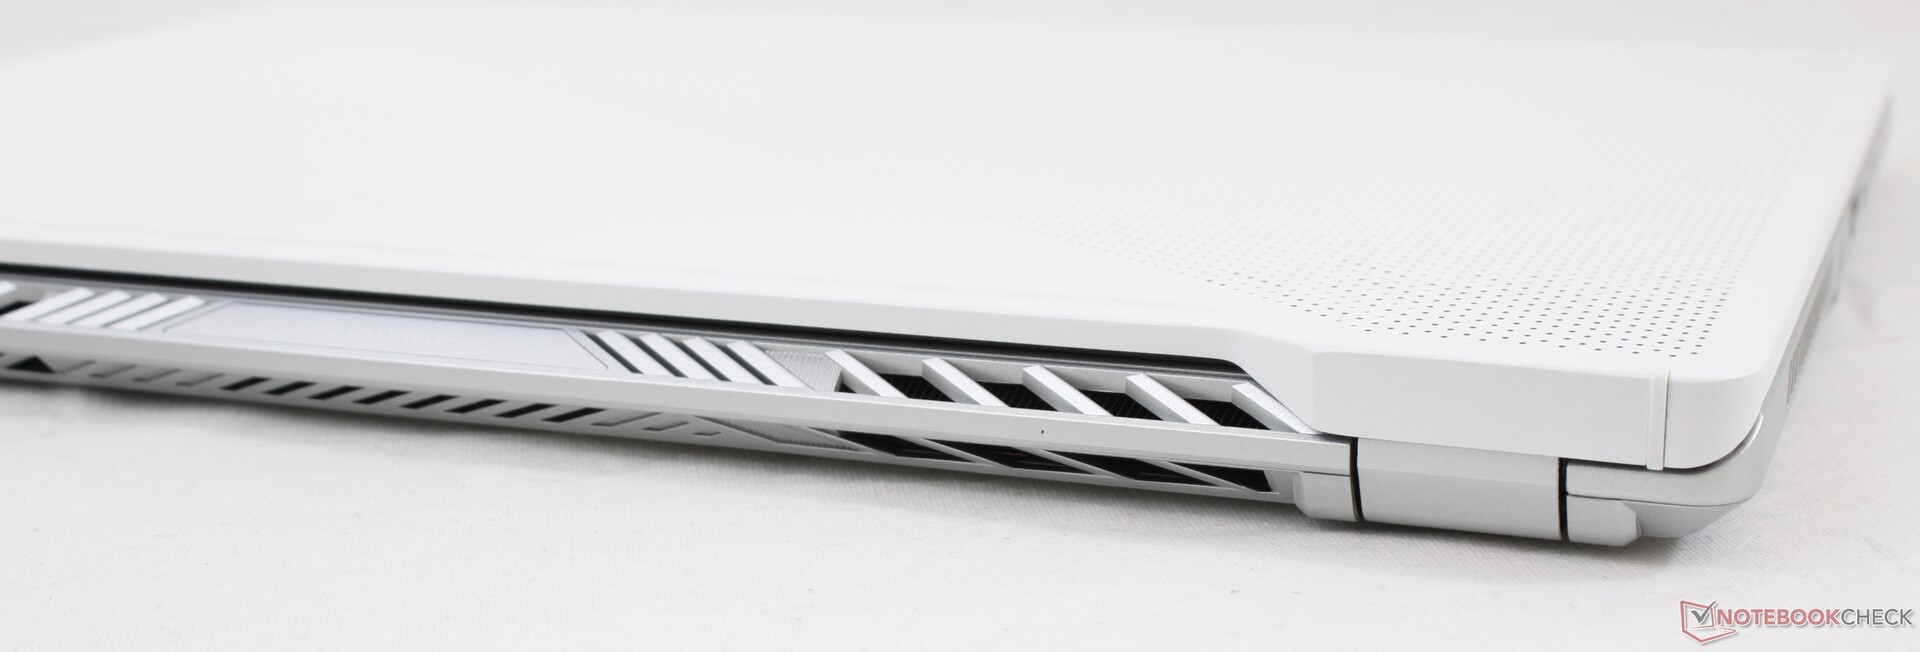
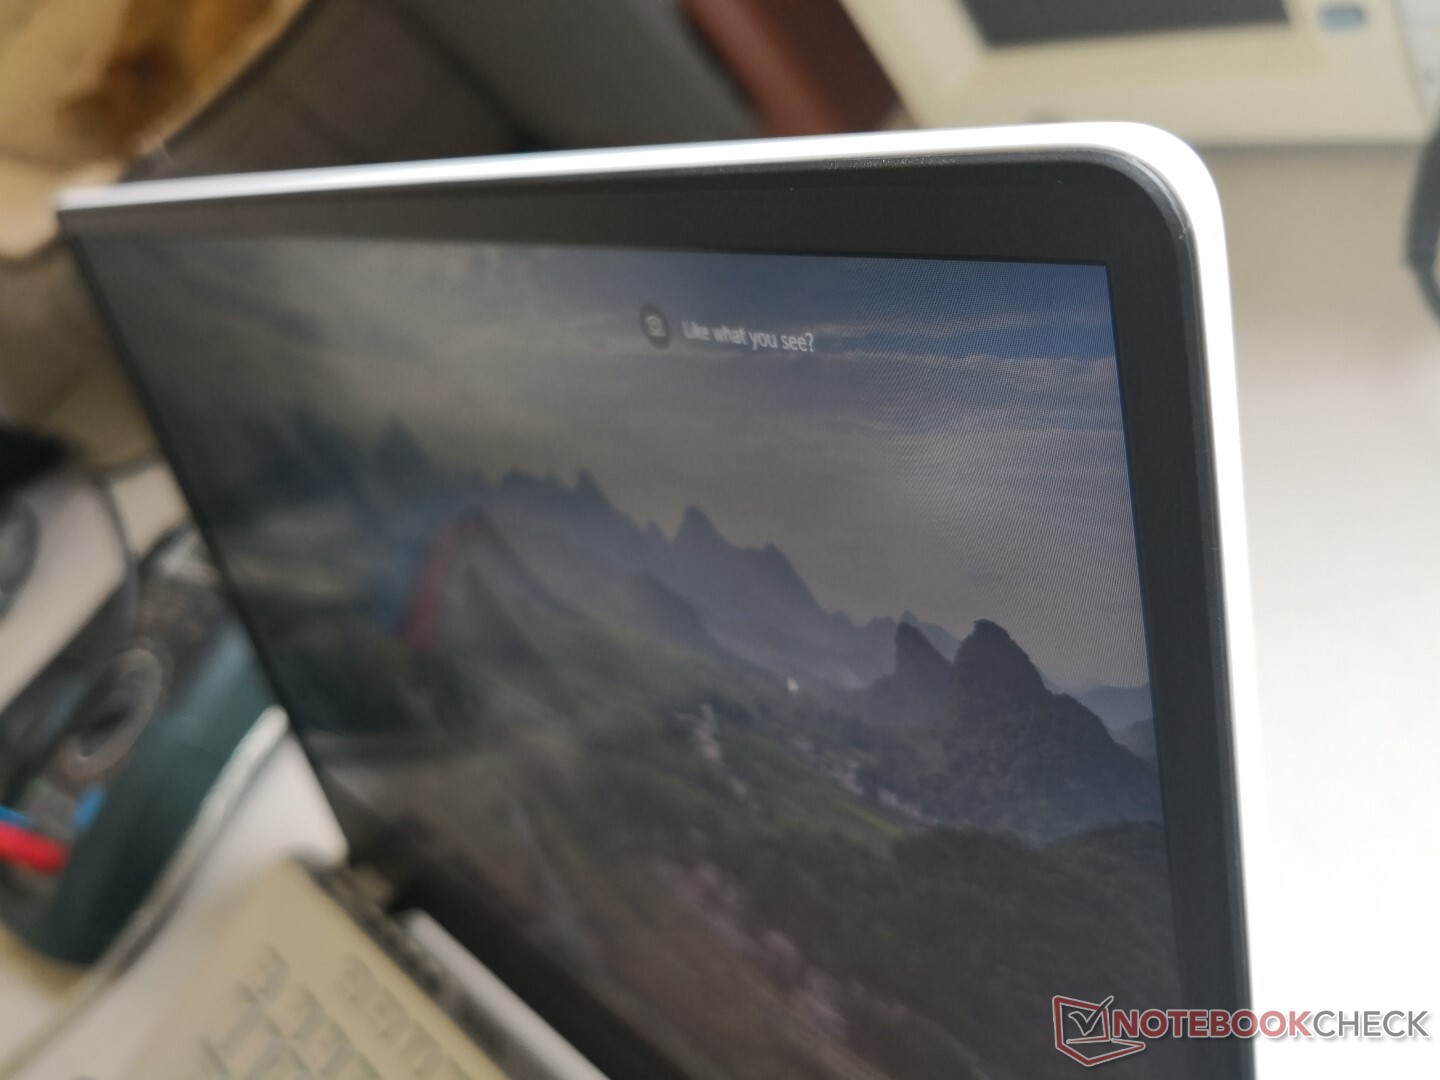
The visual design is an upgrade from existing Zephyrus laptops while incorporating the ErgoLift hinges from the consumer-centric ZenBook series. The chassis consists mostly of magnesium-aluminum with a smooth but slightly roughened texture that hides fingerprints very well. The perforations on the outer lid define the G14 as these can be illuminated with 1215 individual and customizable white Micro-LEDs. If successful with gamers, we suspect that Asus will expand the series to include RGB Micro-LEDs.
As for rigidity, the base is stronger than even some larger Zephyrus laptops like the Zephyrus GX501 with no twisting or creaking when attempting to bend its corners. The keyboard center yields only slightly with applied pressure and the hinges are satisfactory with no creaking as well. Unfortunately, the outer lid is more flexible than we would like as it bends more easily than the displays of other subnotebooks like the XPS 13, MateBook X Pro, MacBook Pro 13, or the Razer Blade Stealth. The lid is more similar to the MSI GS65, Lenovo Legion Y740, or the Zephyrus GX501 in that regard.
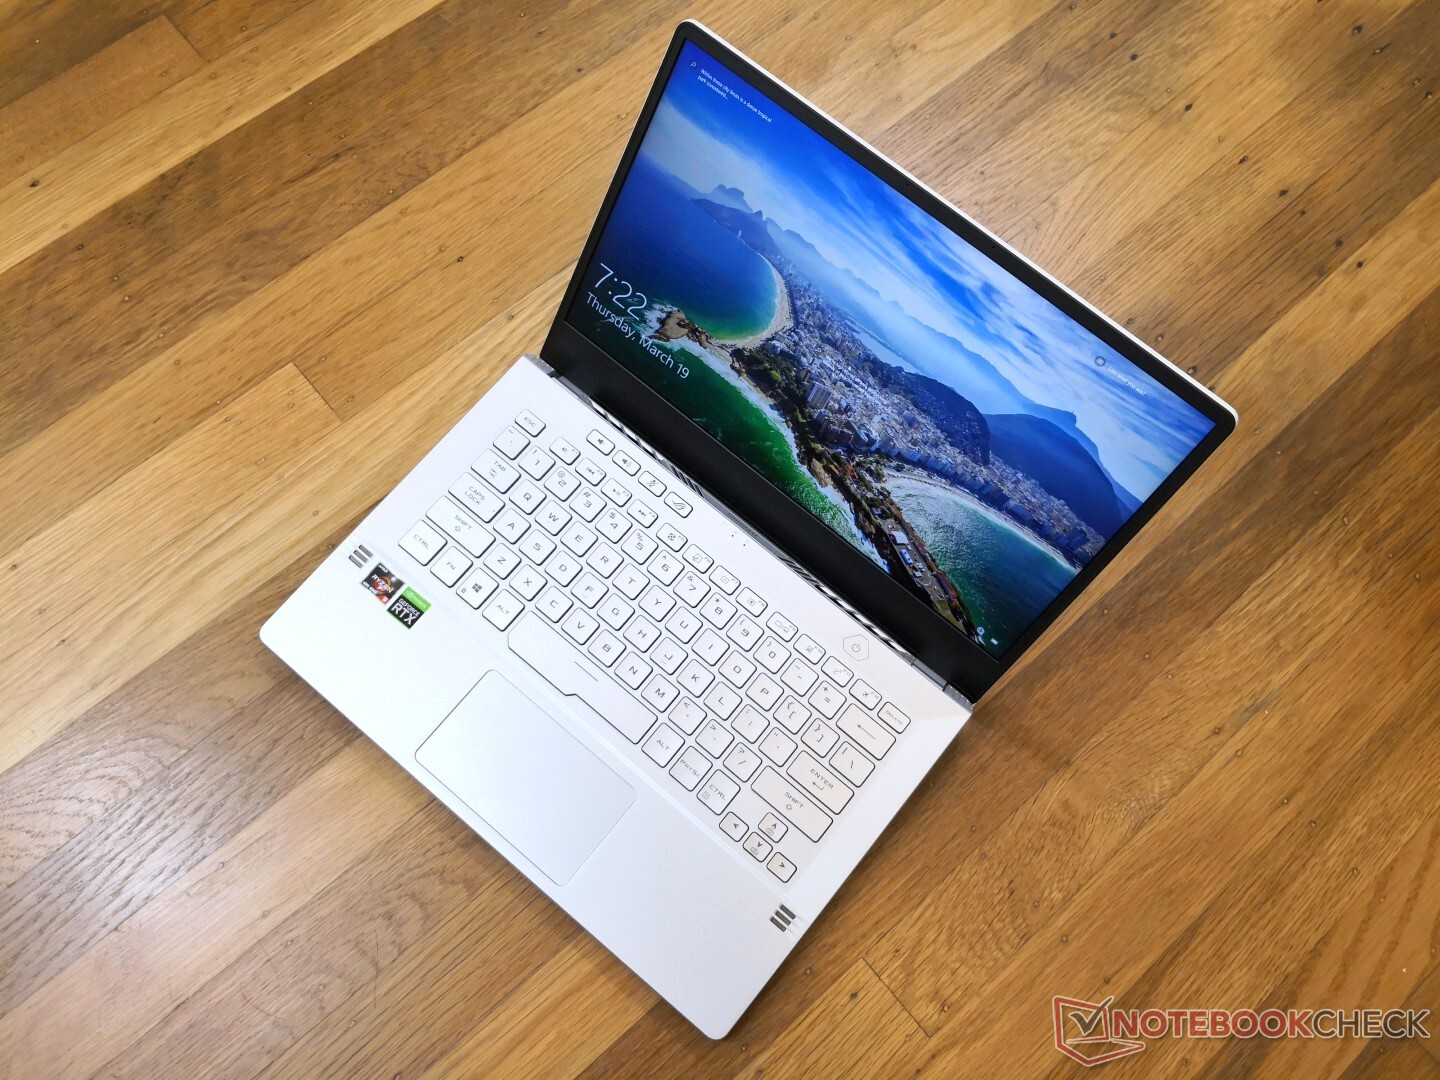
The small size and light weight are key selling points of the Zephyrus G14. It's not quite the size of a ZenBook 14, but it's very close. The system is just slightly larger than the 14-inch MSI Prestige 14 while housing significantly faster processors for an insane level of performance considering the size. The MSI GS65, which is one of the lightest 15.6-inch gaming laptops currently available, still weighs about 400 g more than our Asus even though both are almost identical in thickness.
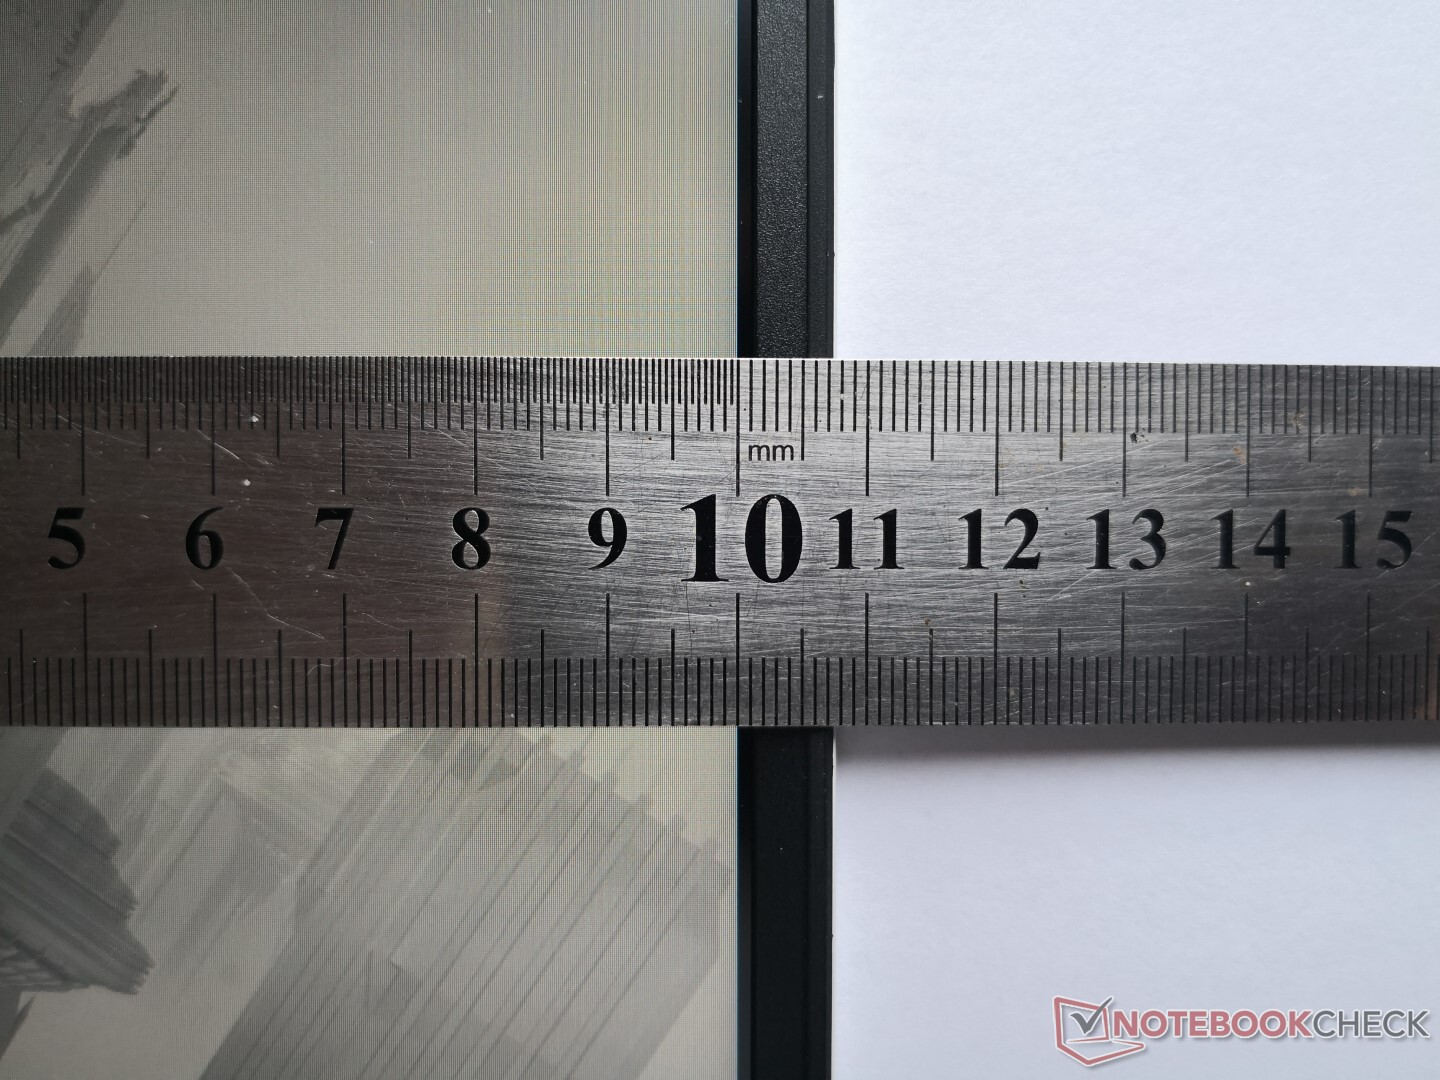
Note that configurations with the Micro-LED-enabled outer lid will have a slightly thicker lid than the configurations without it by 0.2 cm. Our test unit does not have the Micro-LED feature.
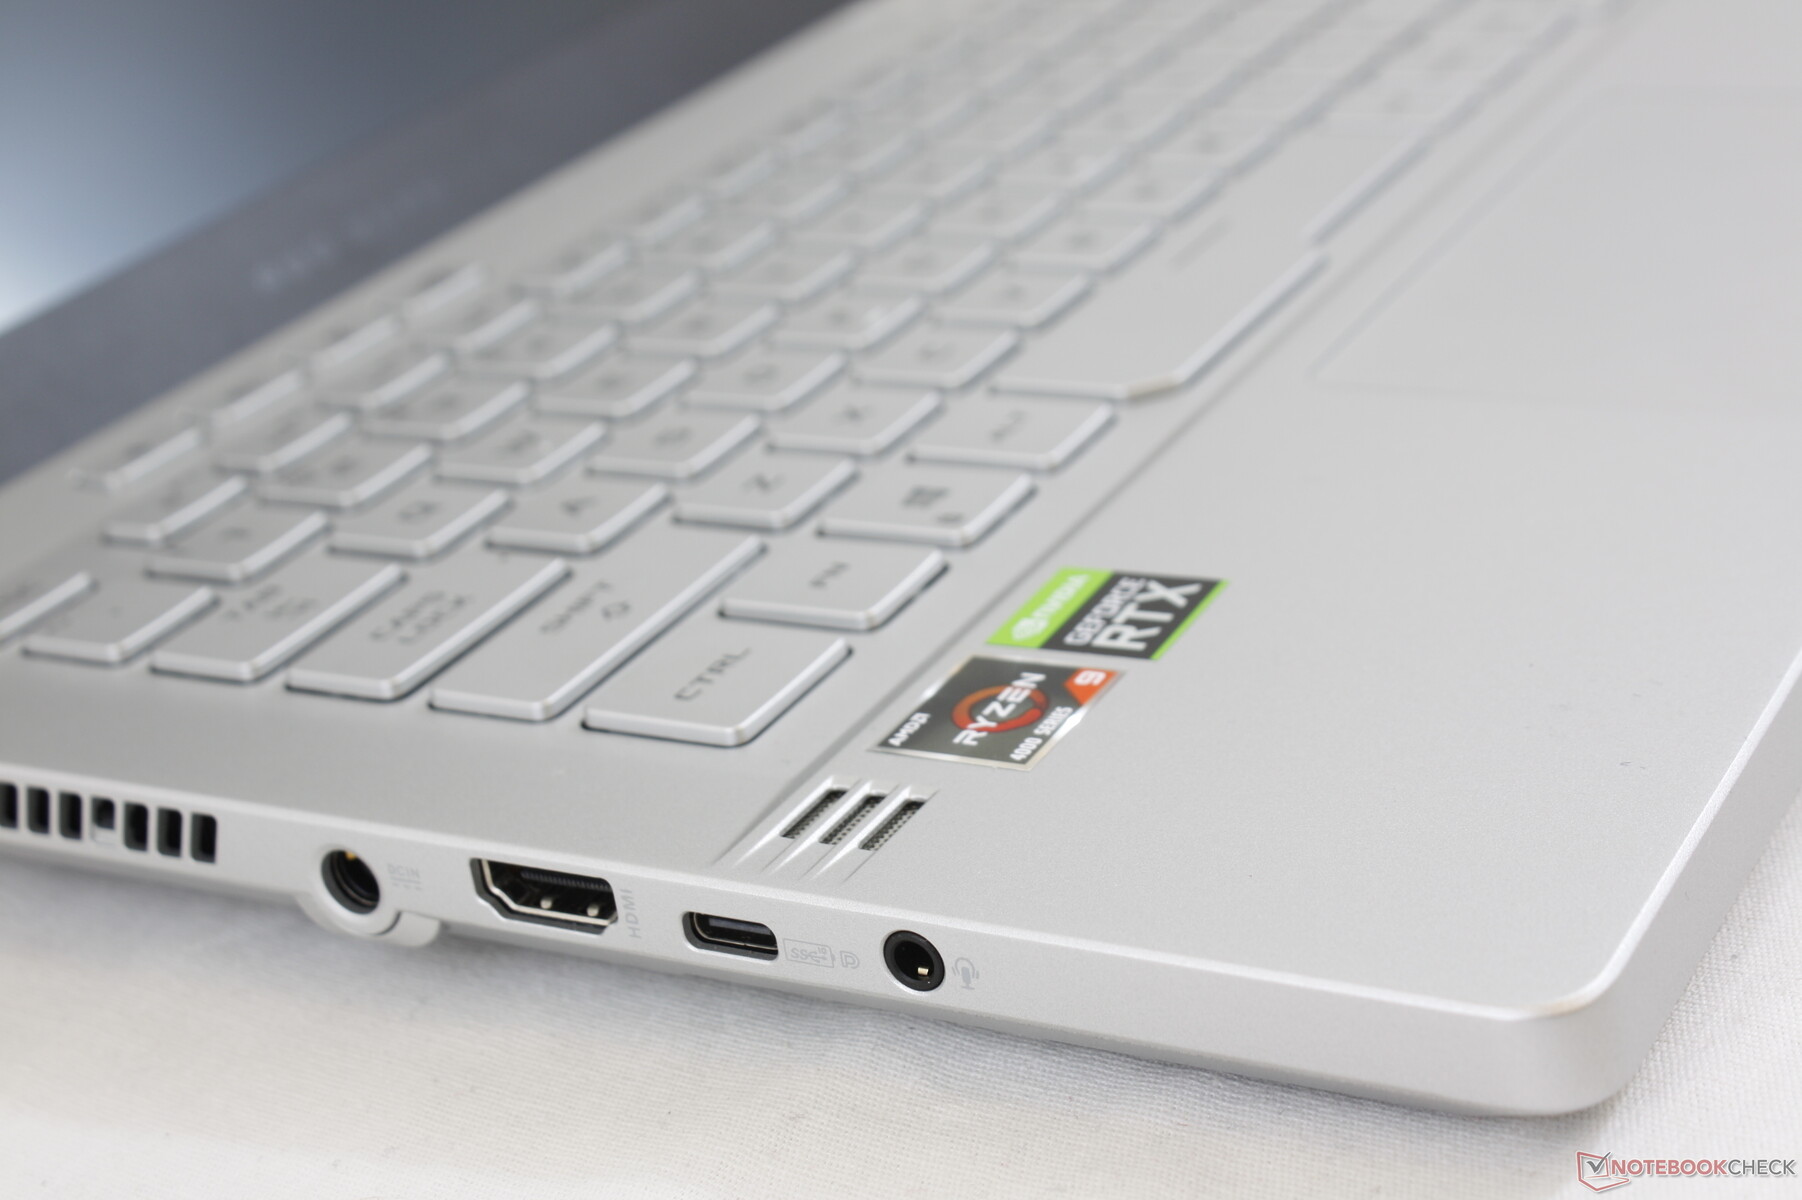
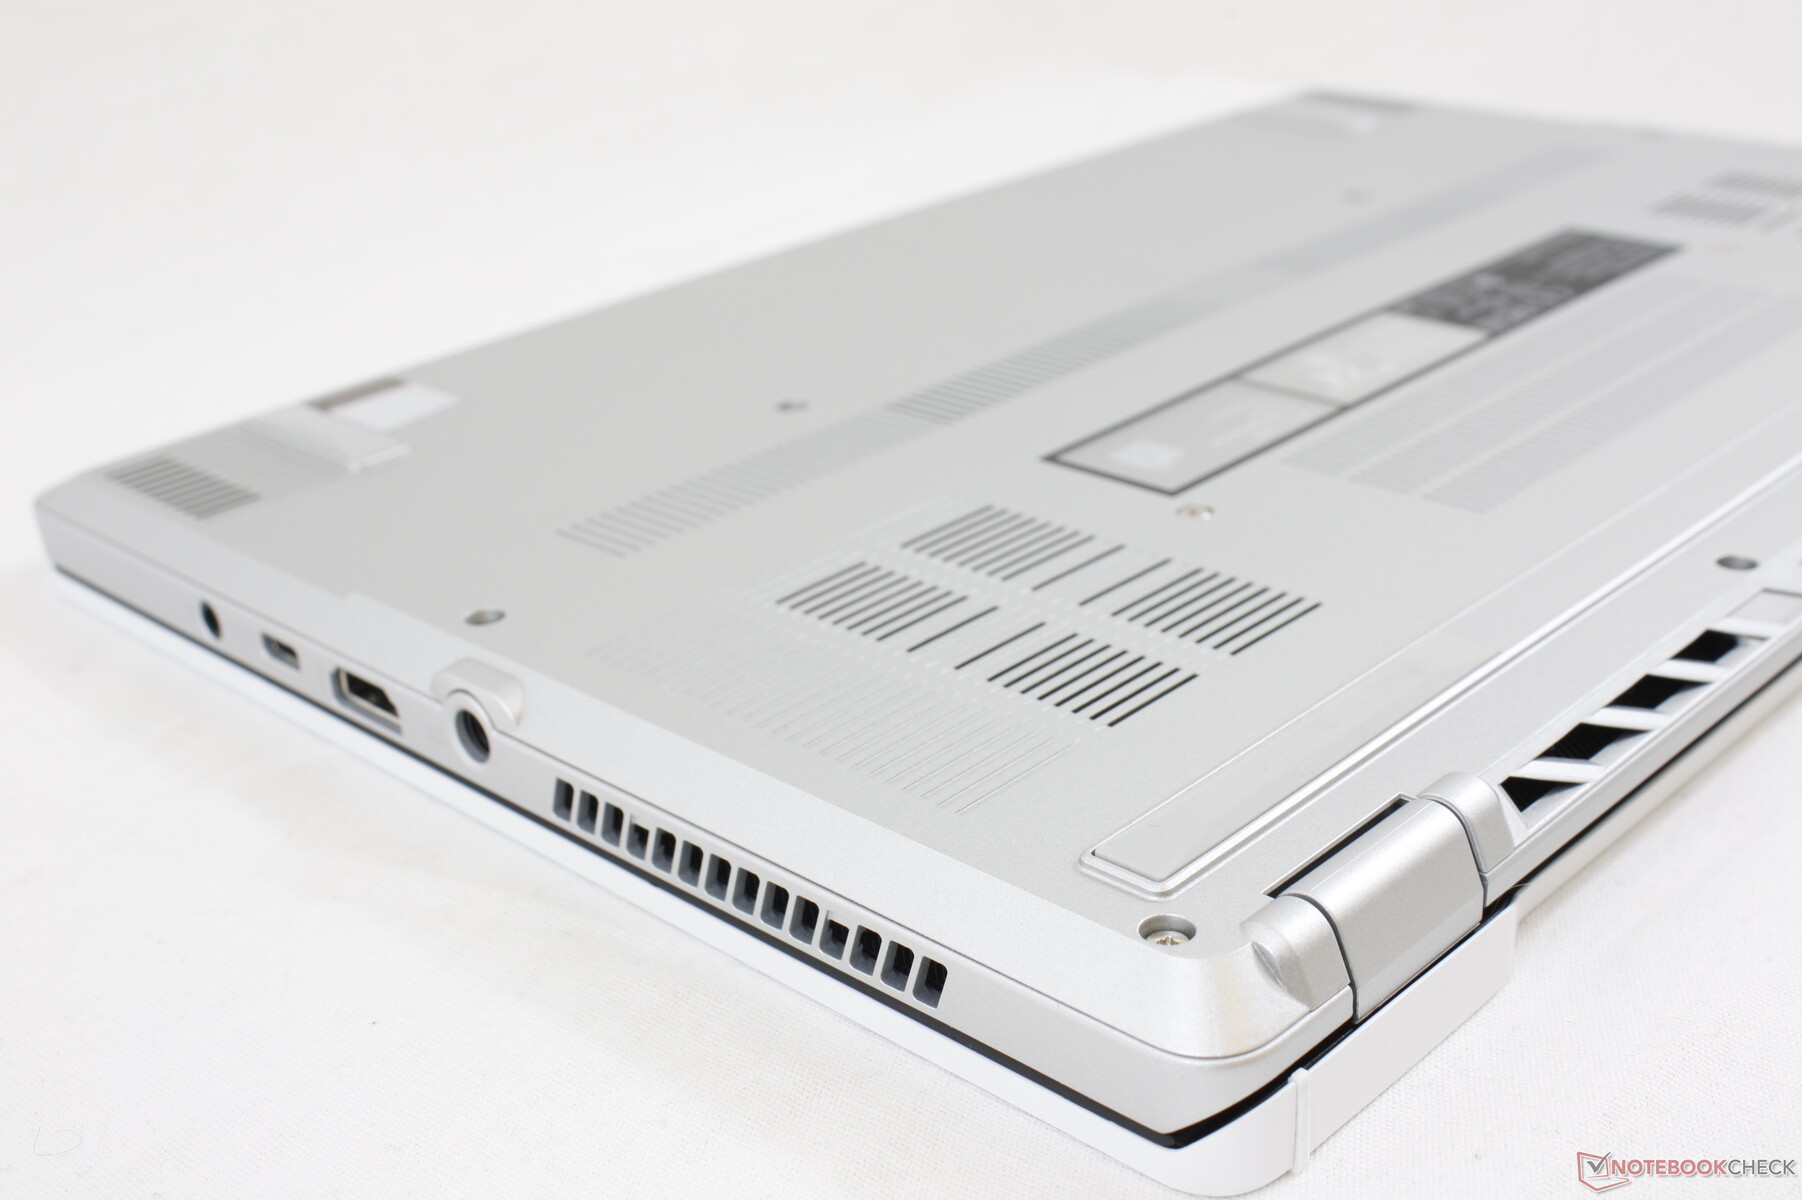
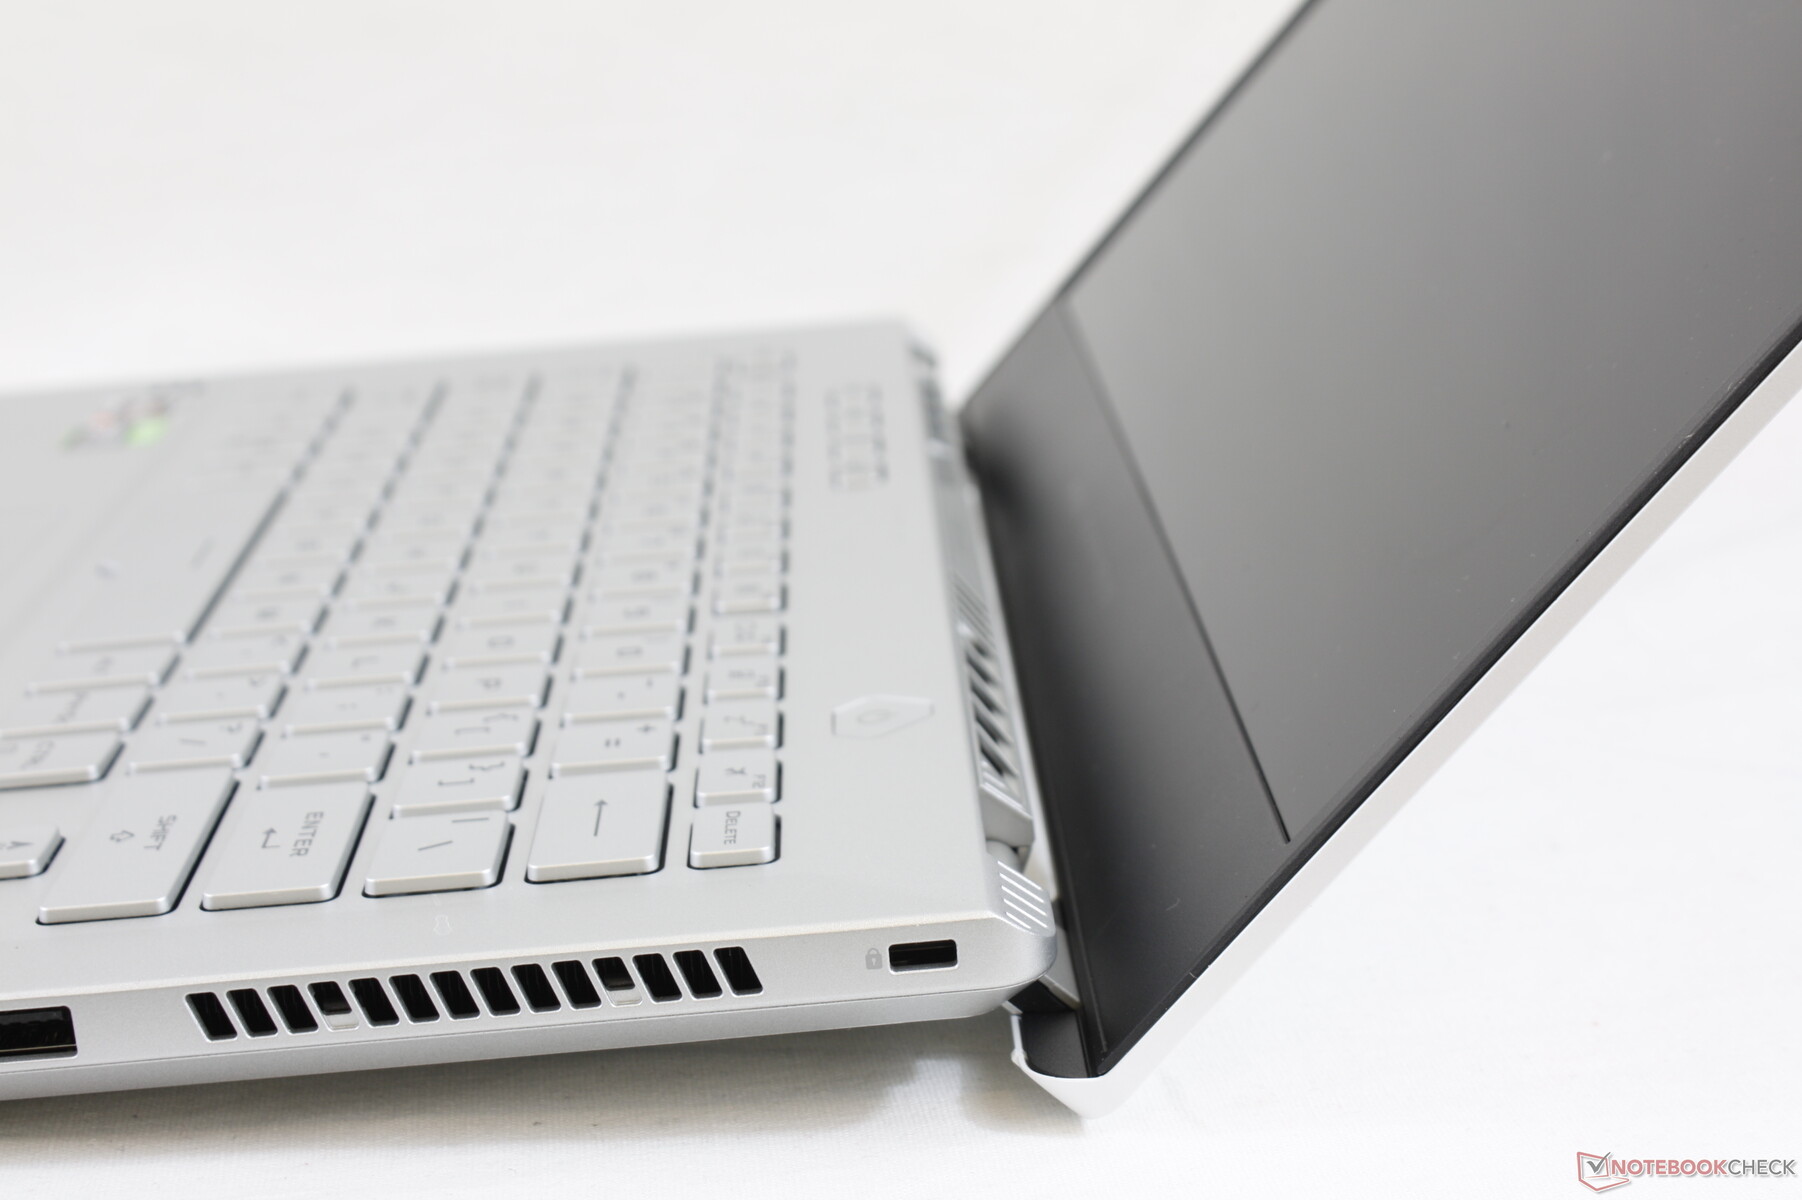
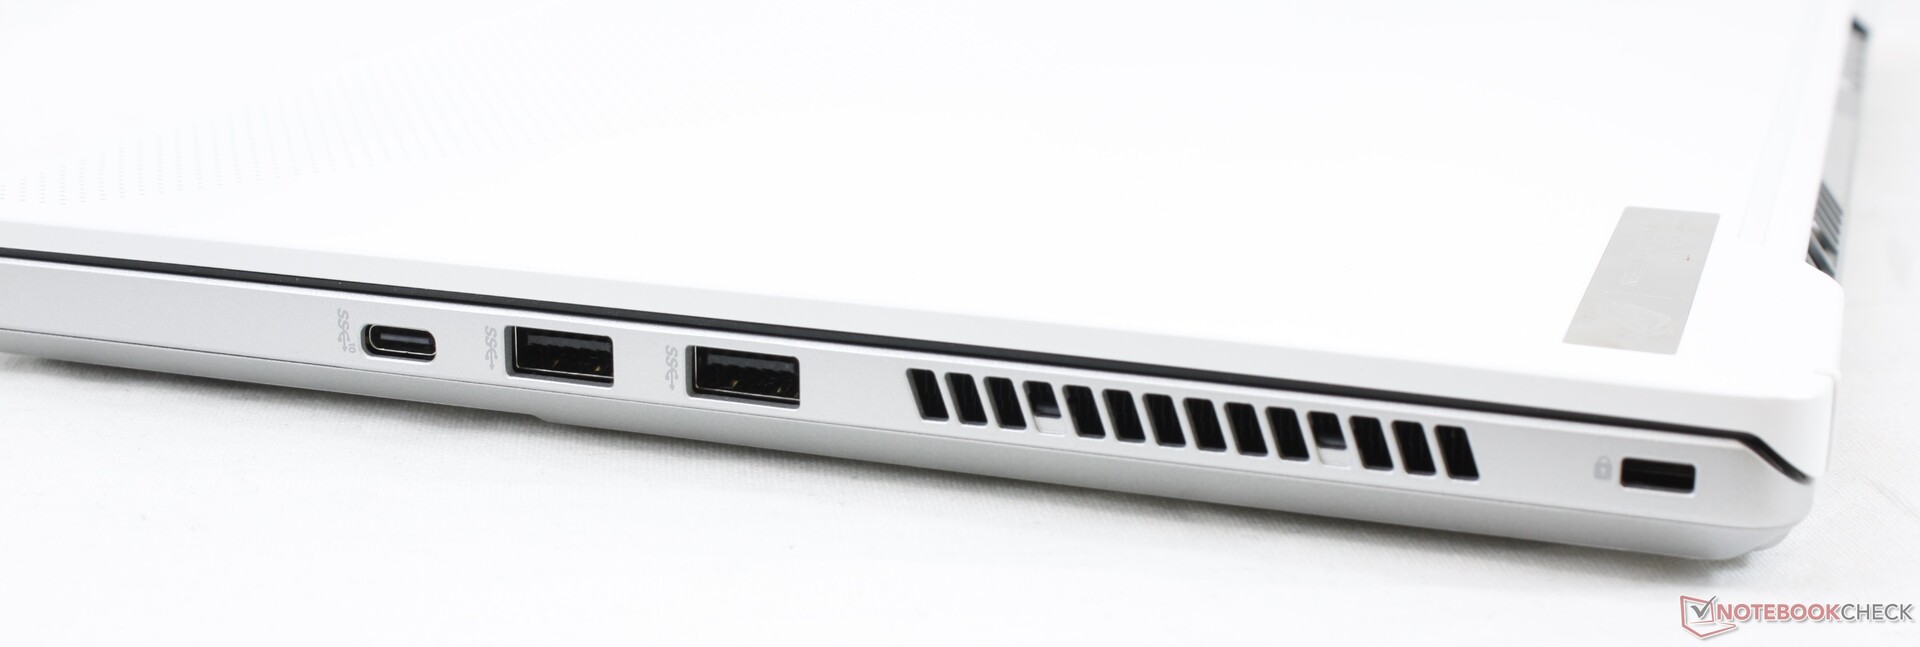
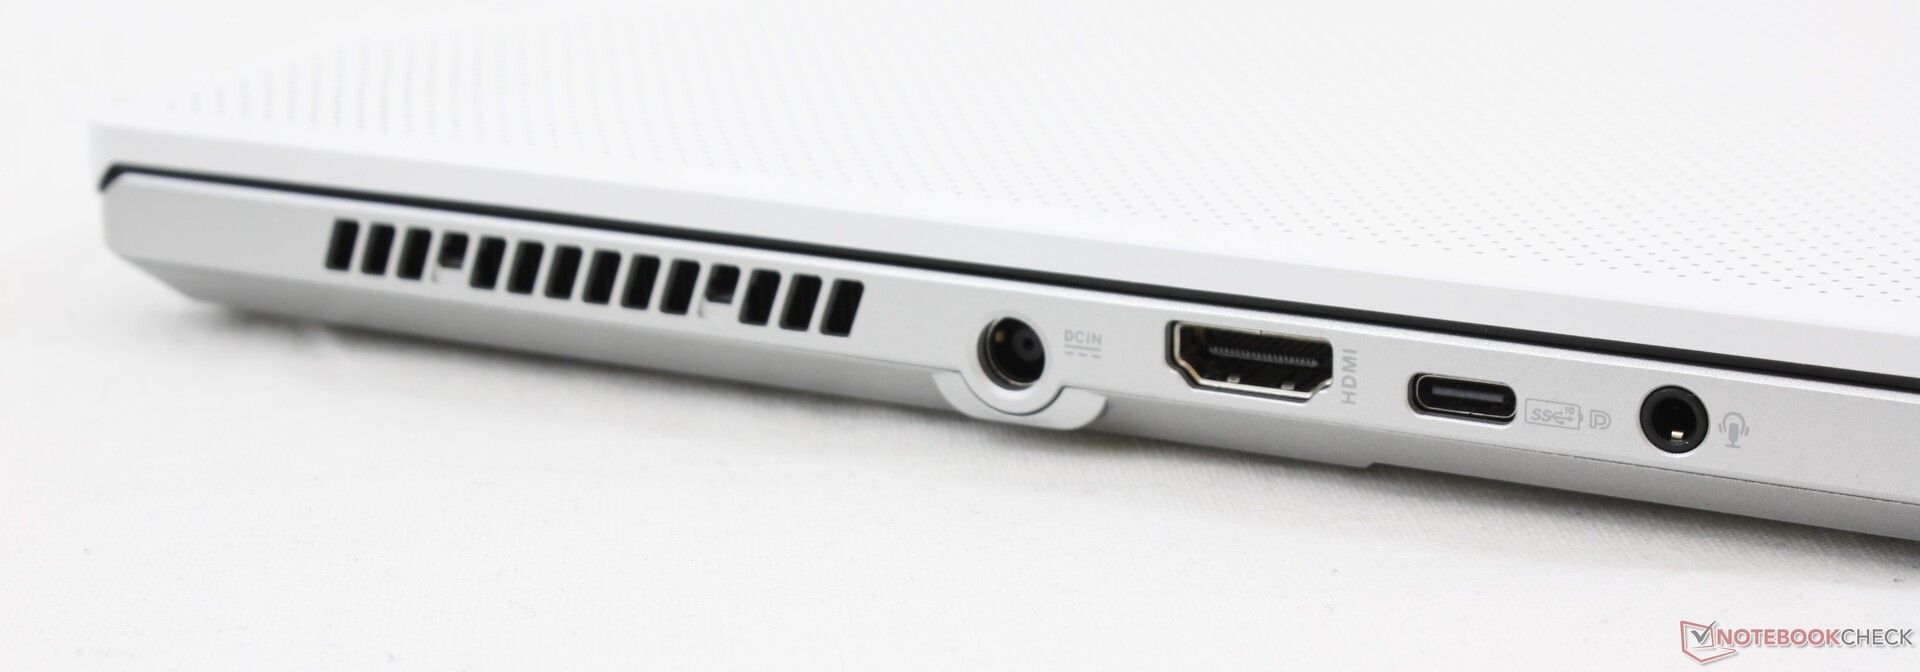
Connectivity: Charging with USB Type-C is Possible
Owners get dual USB Type-A ports, dual USB Type-C ports, and HDMI 2.0b. Users who want RJ-45, Thunderbolt 3, or an SD card reader will have to look elsewhere. The positioning of the ports here are a mixed bag because the ventilation grilles take up so much space along the rear and sides. While each port is easy to reach, they are also very close up front where cables can get in the way of table space.
Communication
The Intel AX200 comes standard for 802.11ax (or Wi-Fi 6) and Bluetooth 5 connectivity. We're able to record a real-world average transfer rate of 1.2 to 1.7 Gbps when standing one meter away from our Wi-Fi 6-enabled Netgear RAX200 router and 2.5 Gbps server line. We experienced no connectivity issues during our time with the test unit.
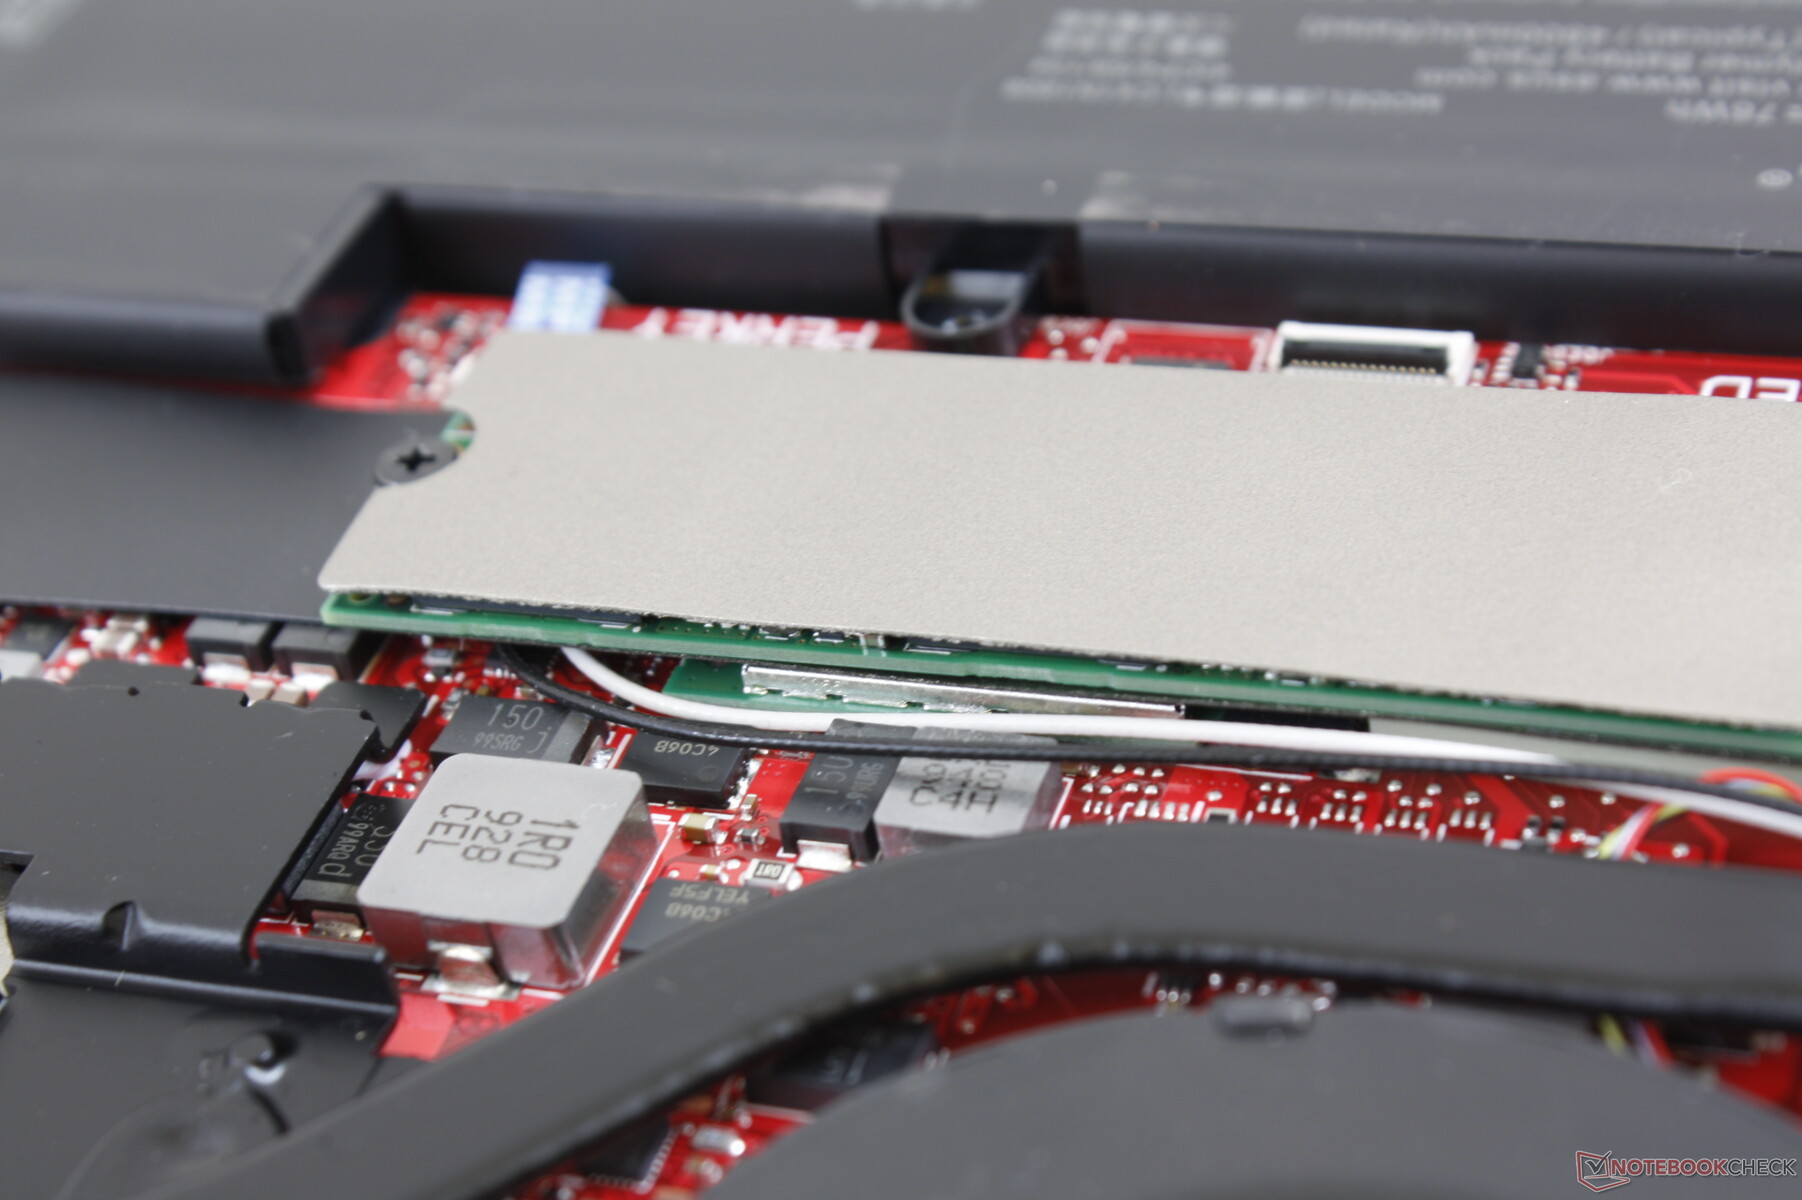
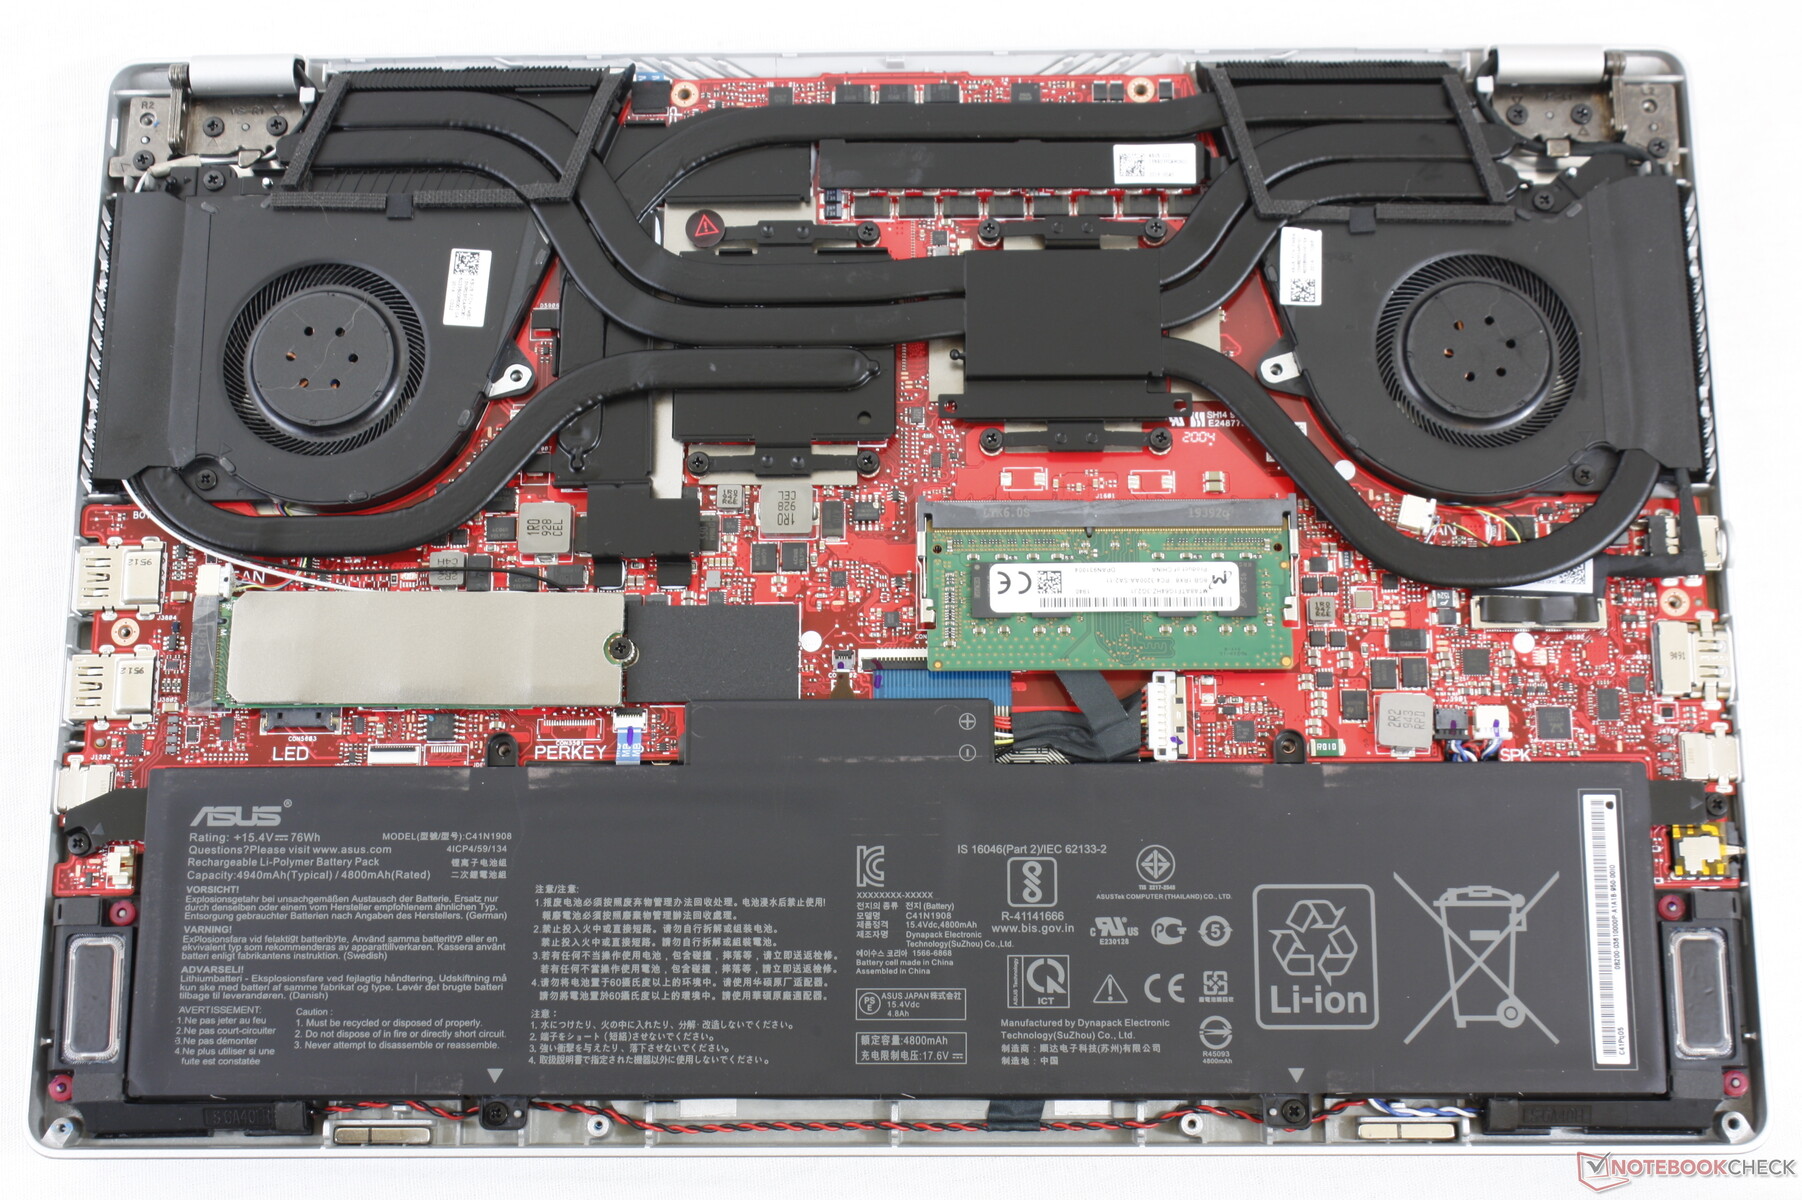
Maintenance
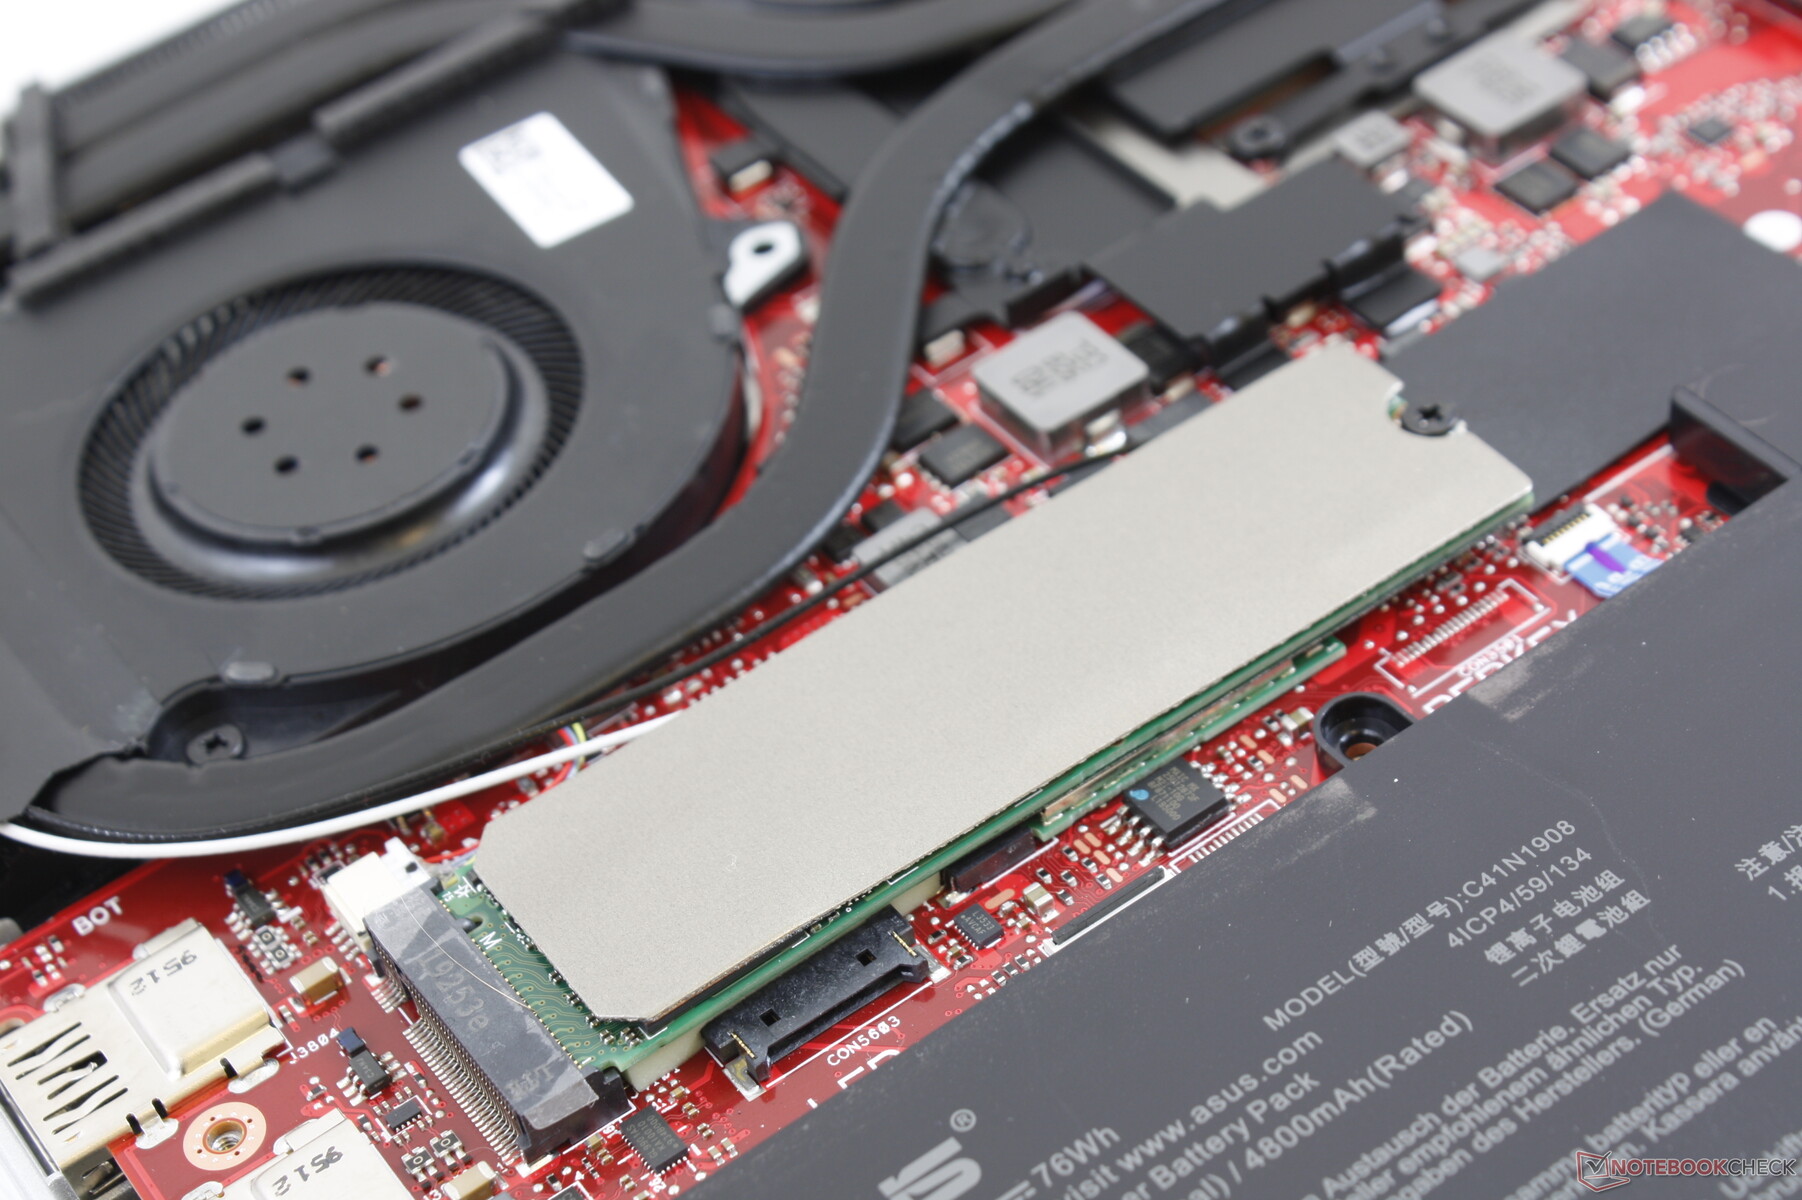
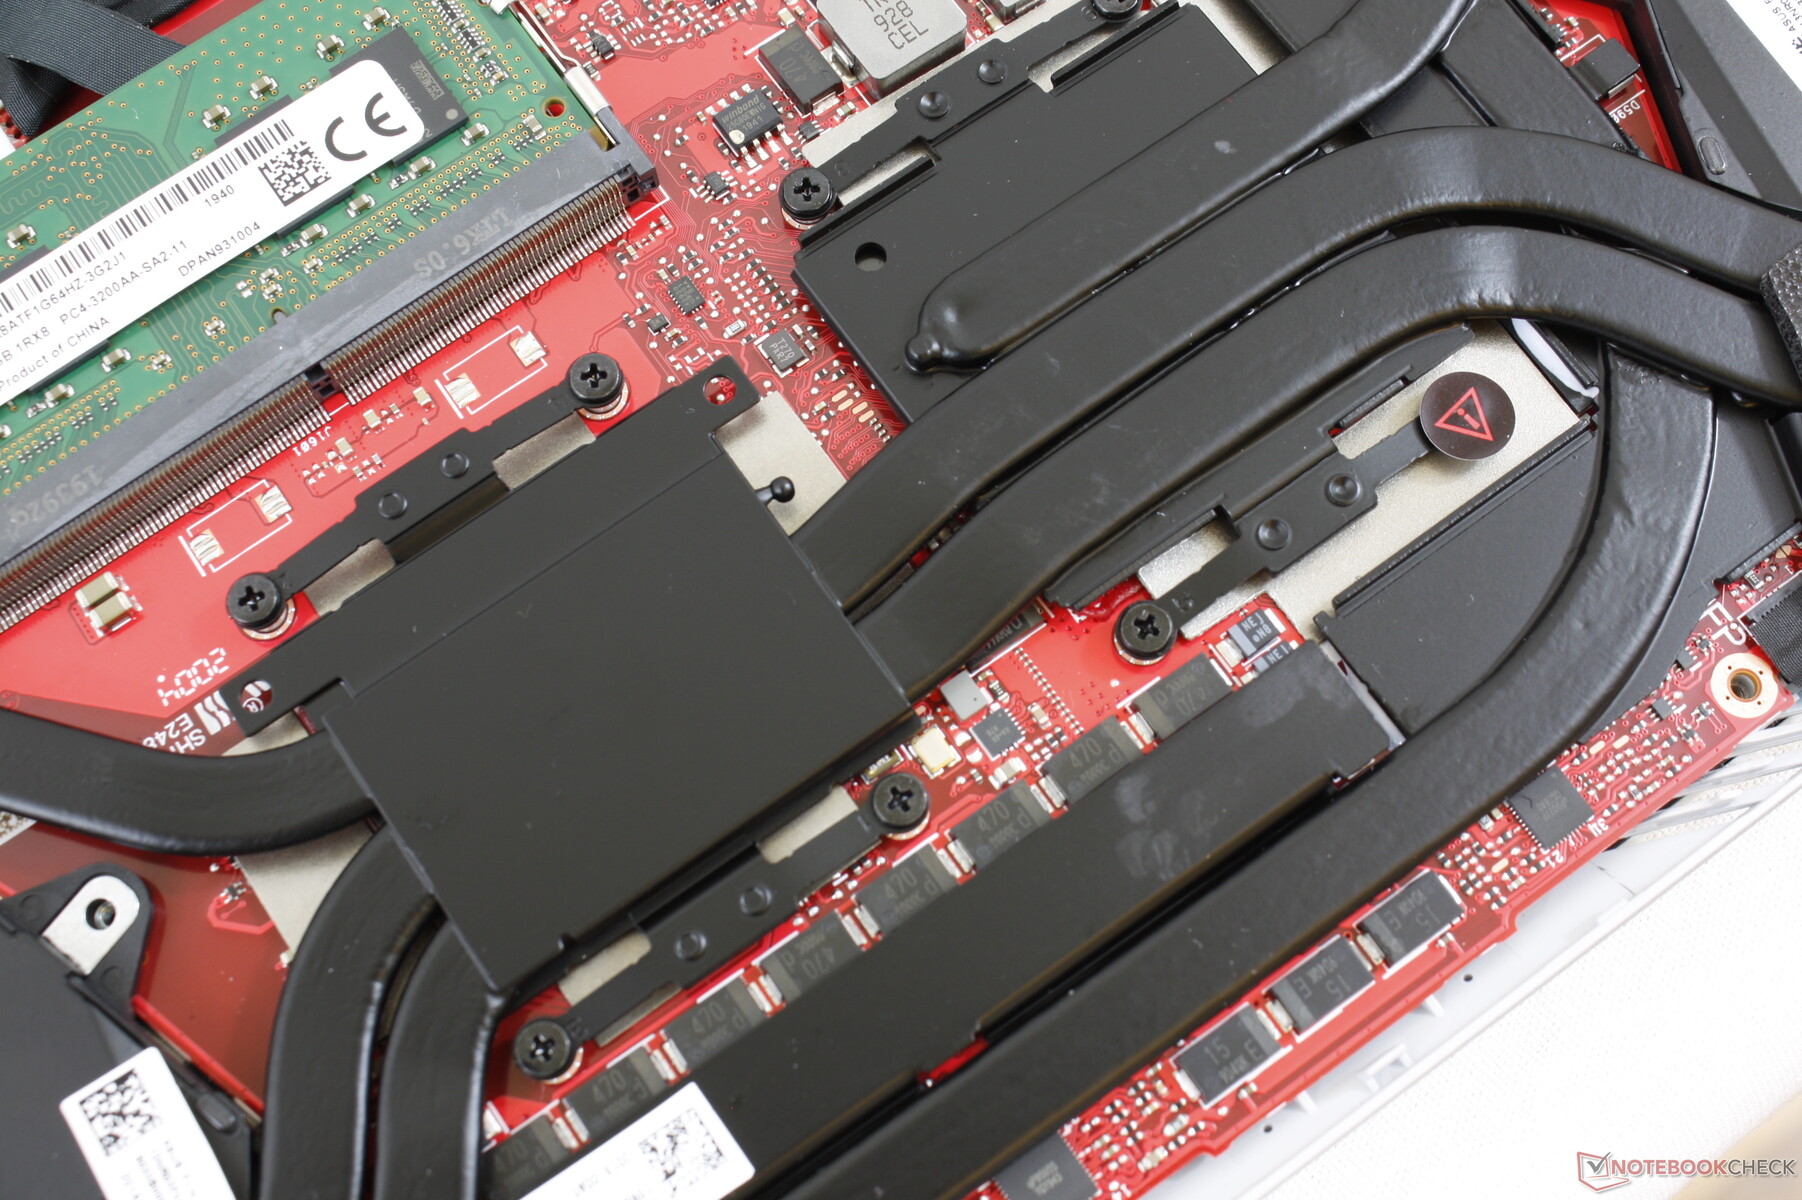
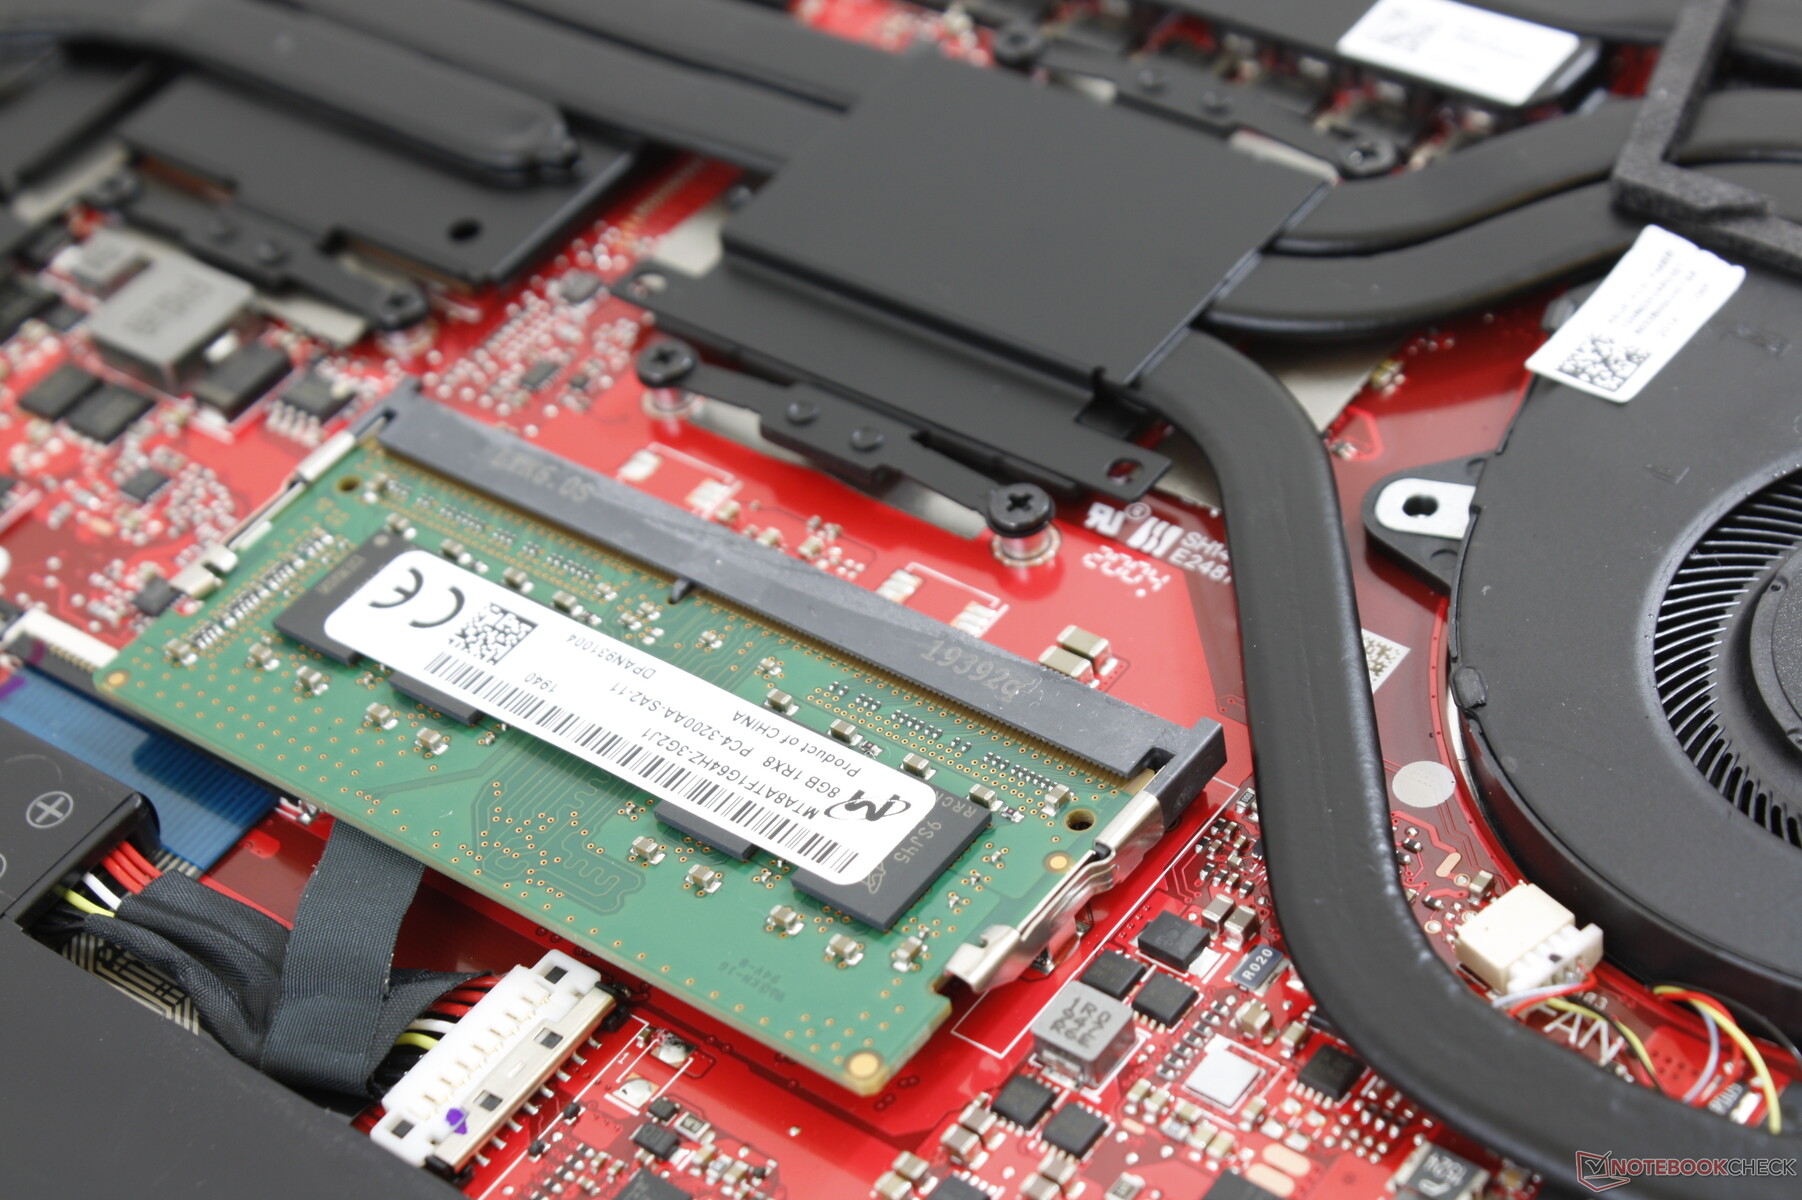
The bottom panel is easy to remove once the 14 Philips screws are loosened. Users will have direct access to the SODIMM slot, M.2 SSD, battery, and the WLAN module underneath the SSD.
Accessories and Warranty
There are no extras in the box other than the AC adapter and usual paperwork. The standard one-year limited warranty applies.
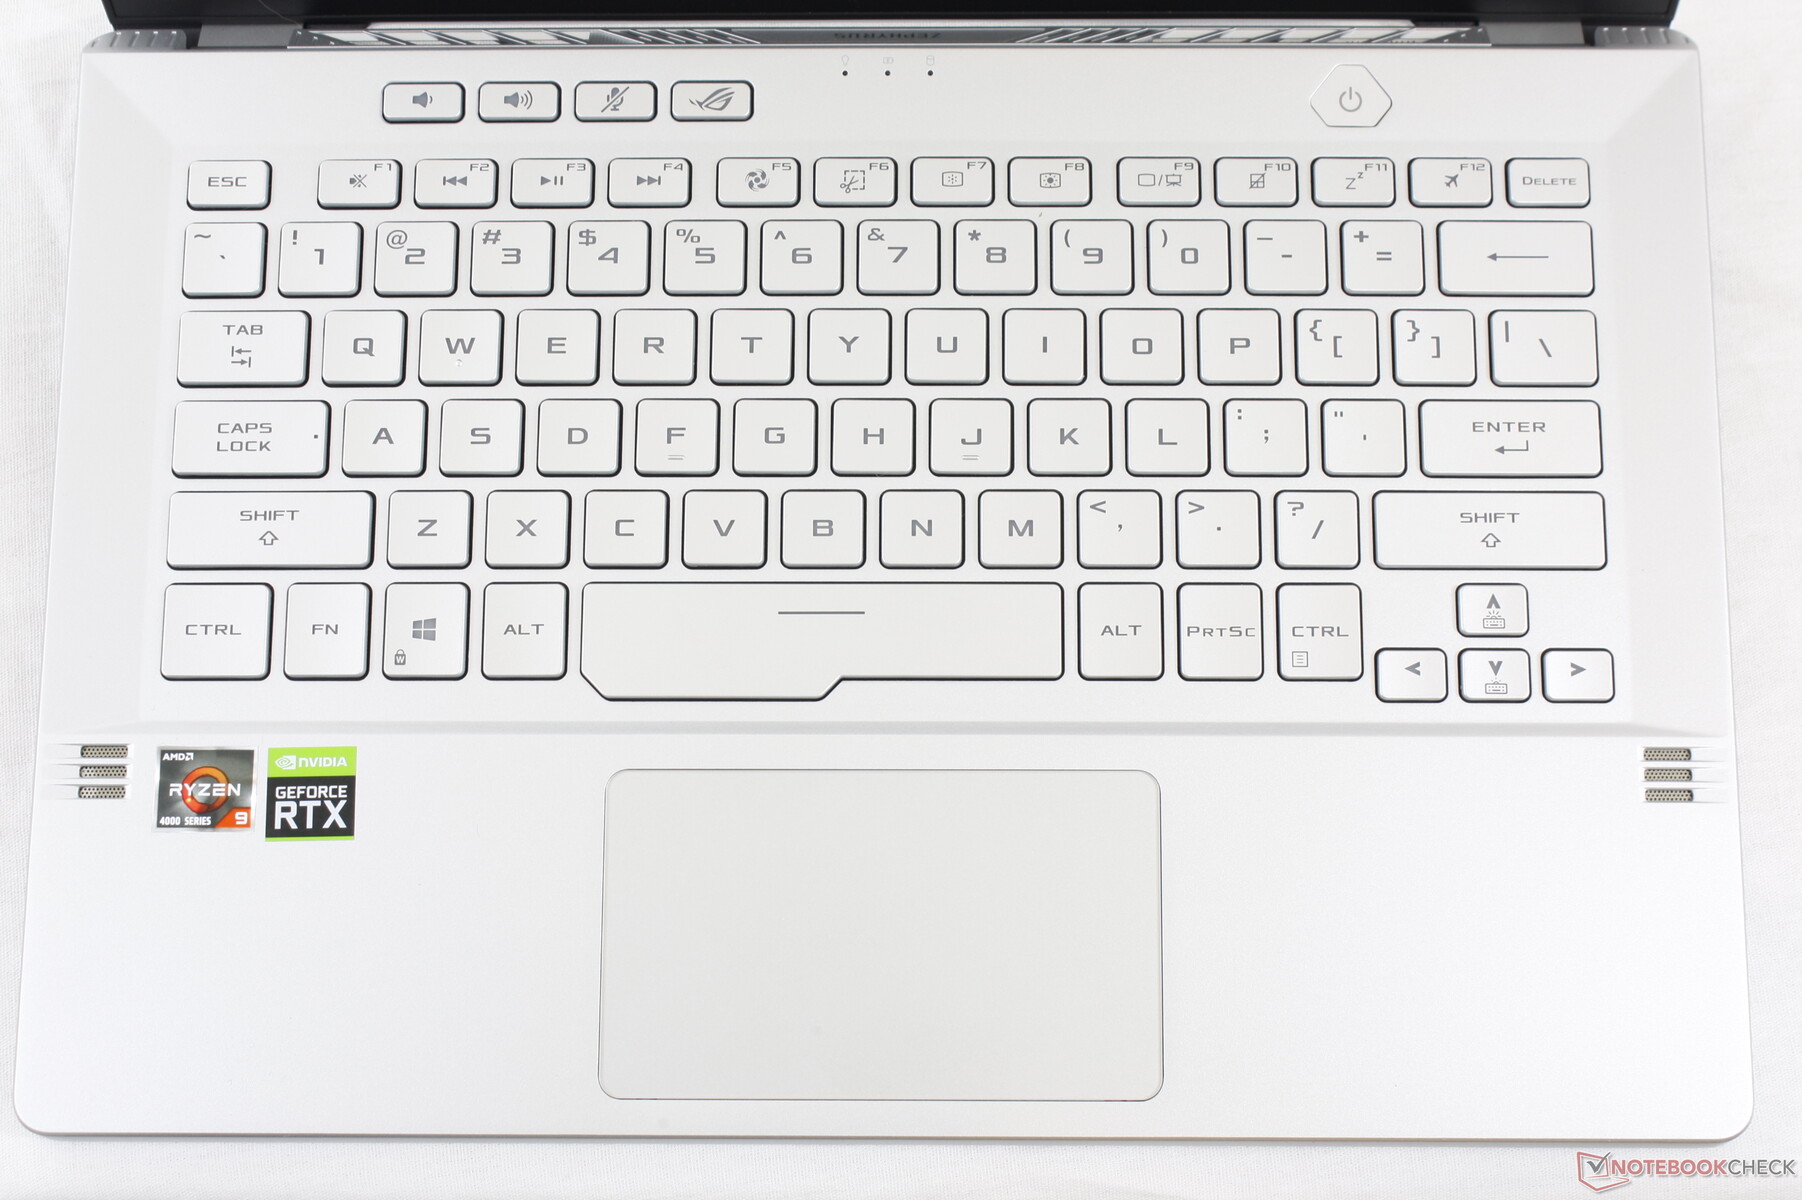
Input Devices: Firmer Key Feedback than an Ultrabook
Keyboard
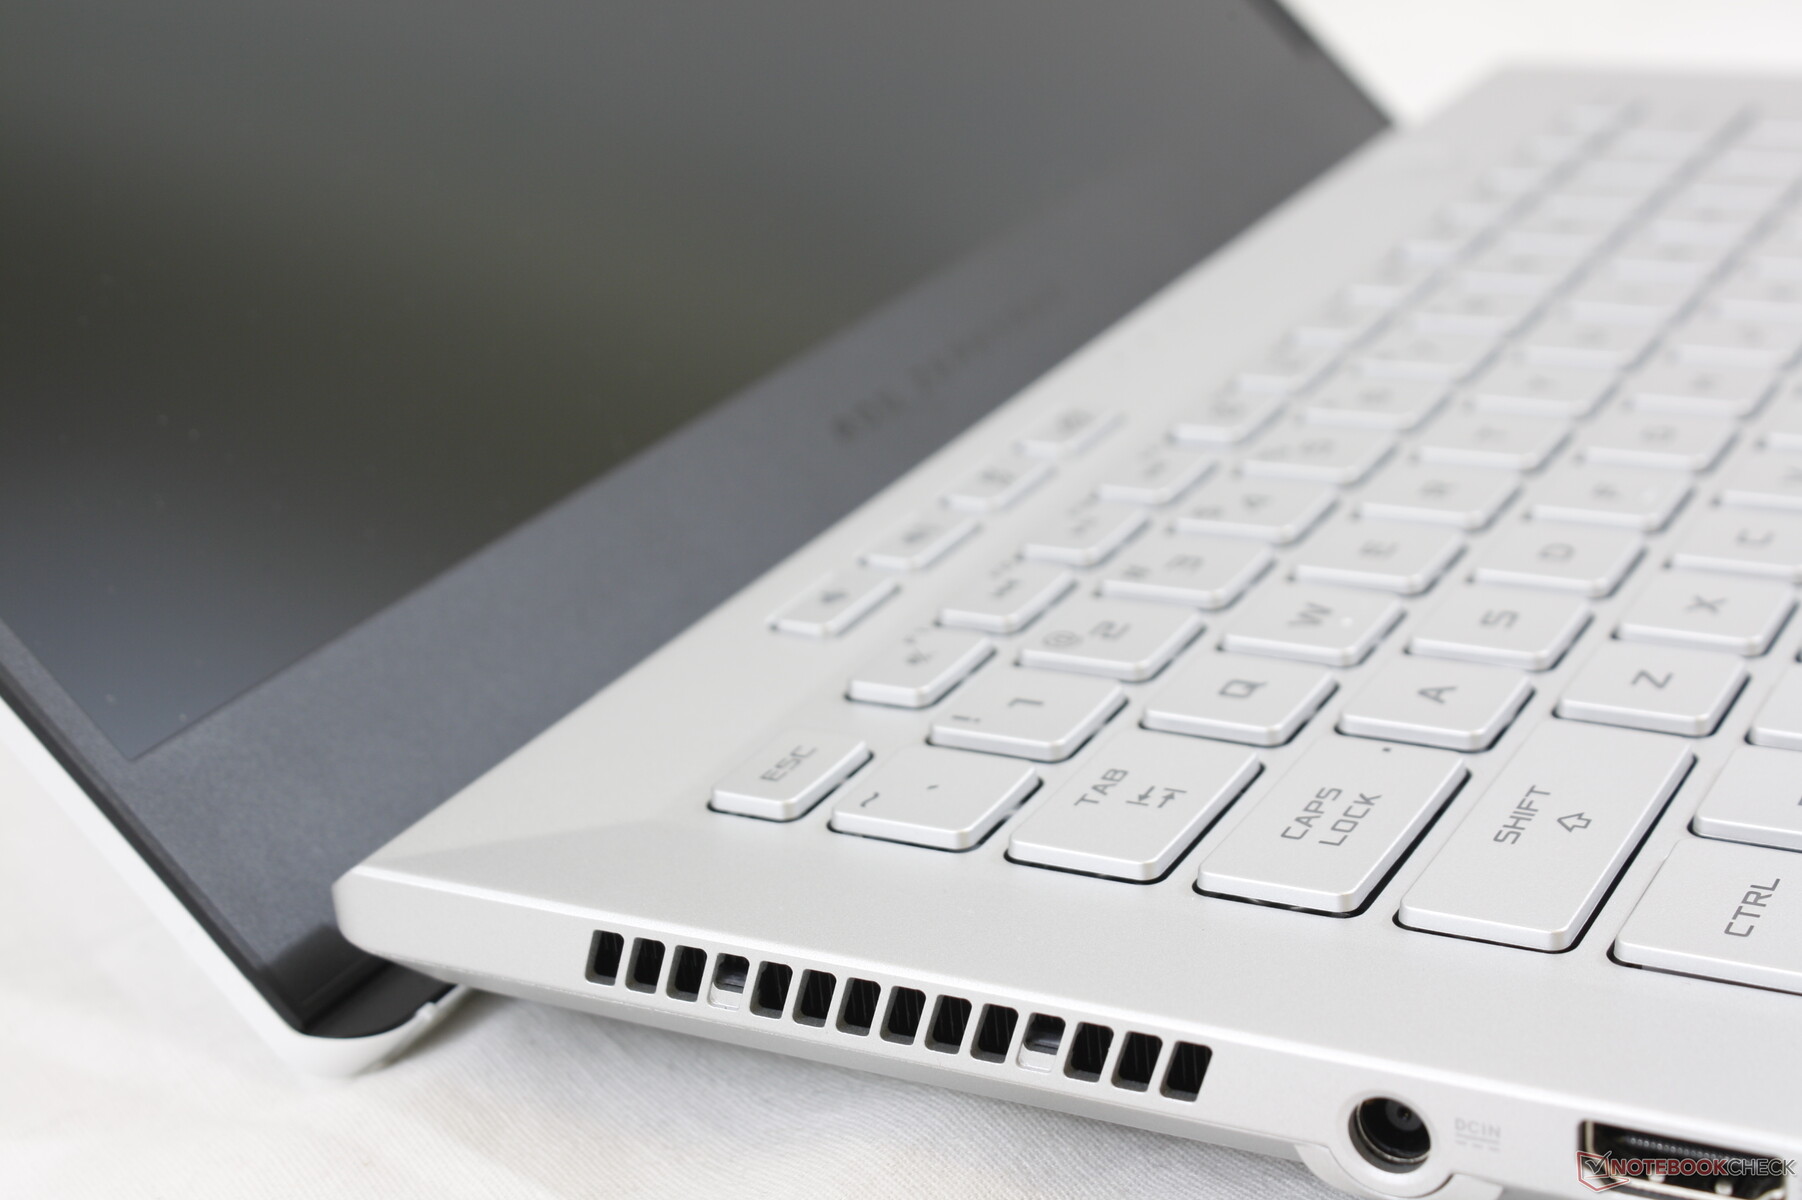
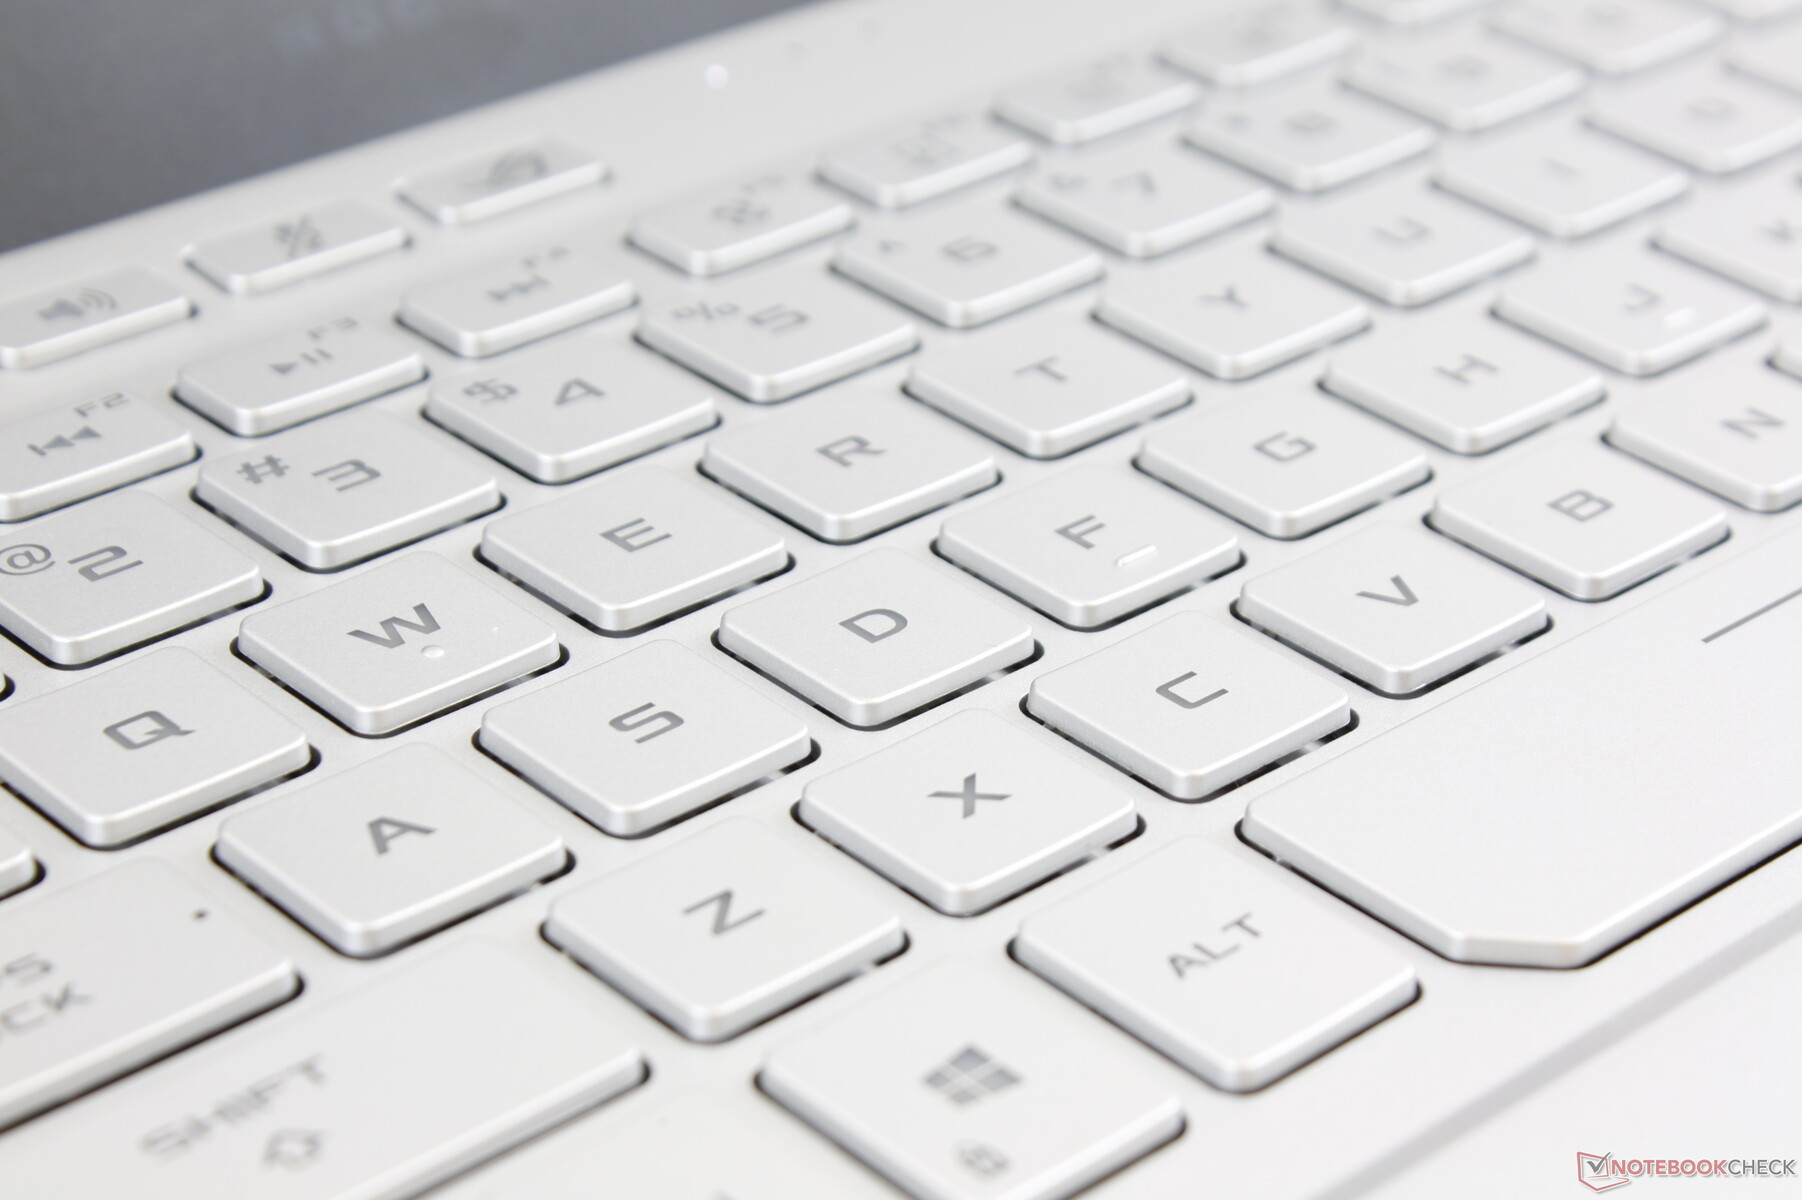
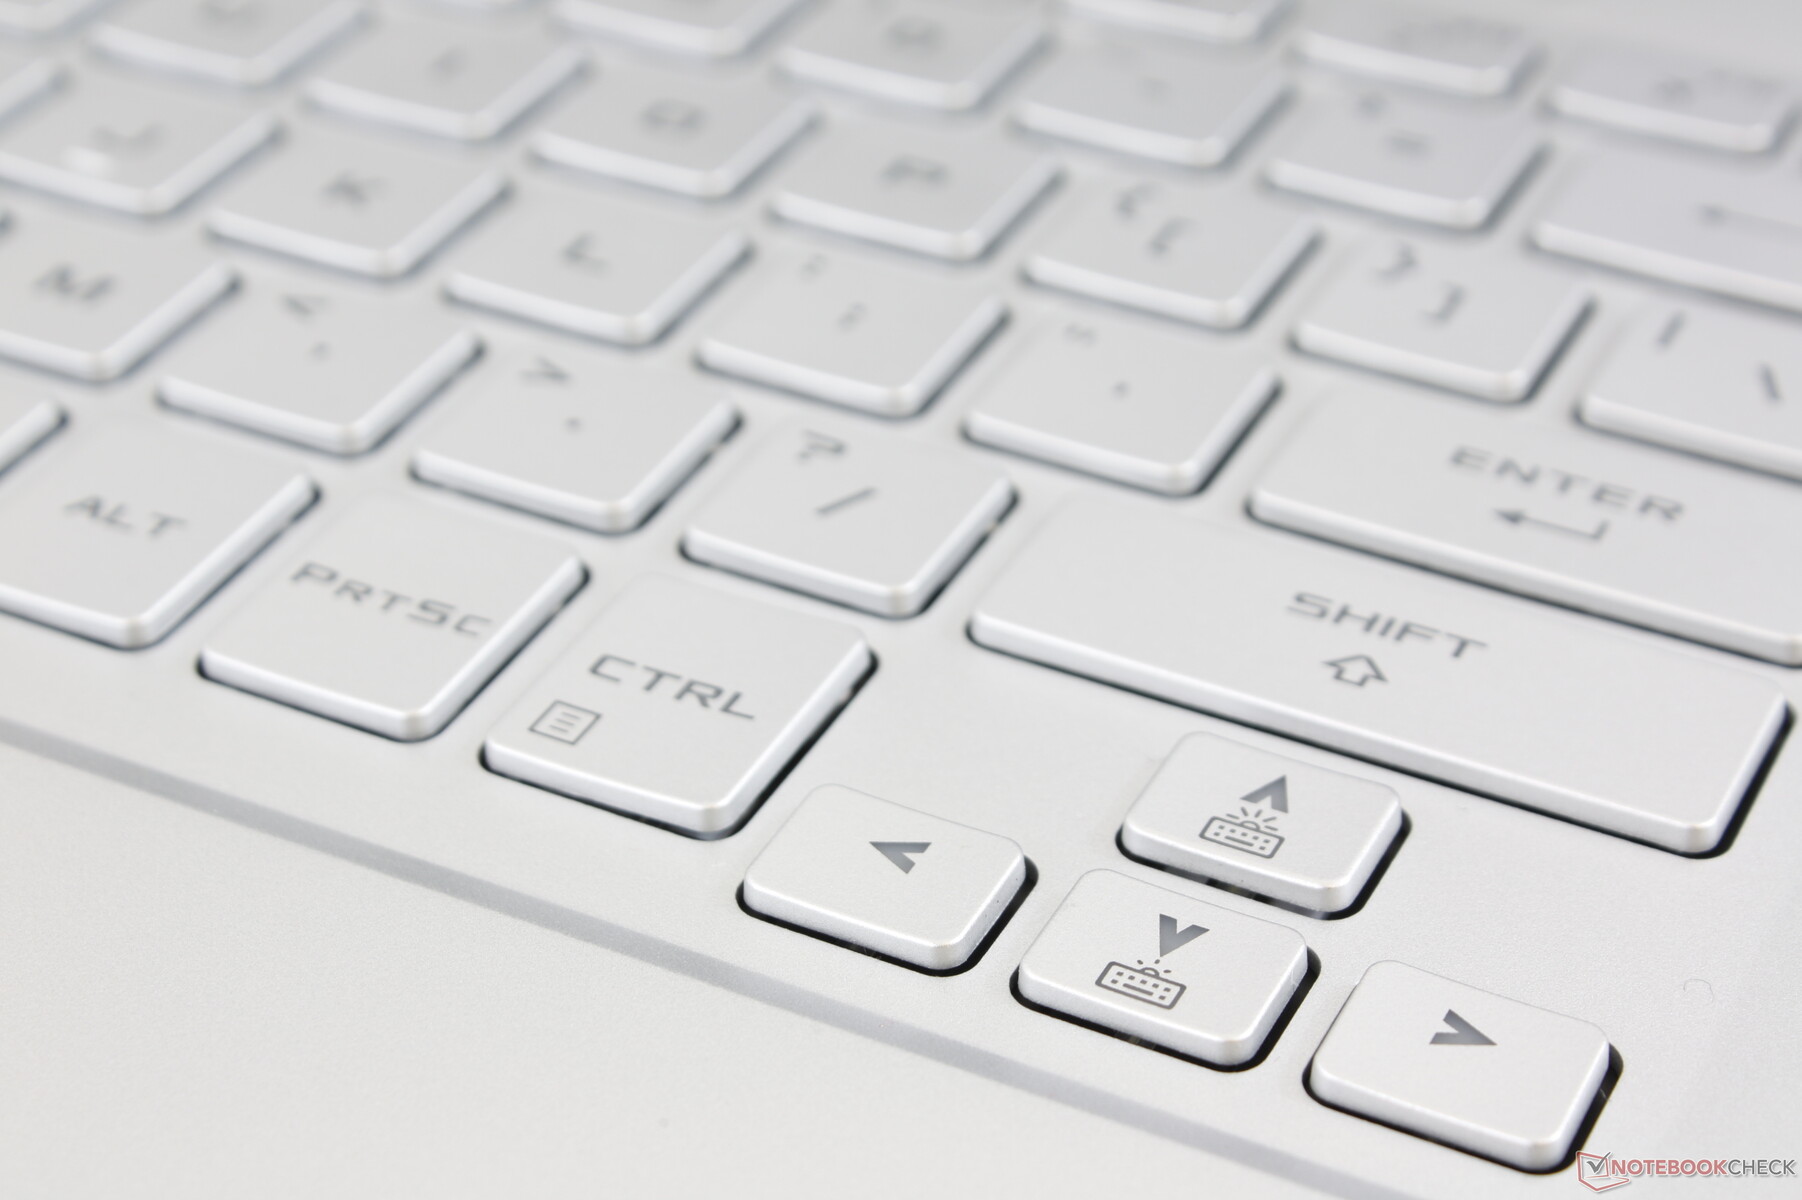
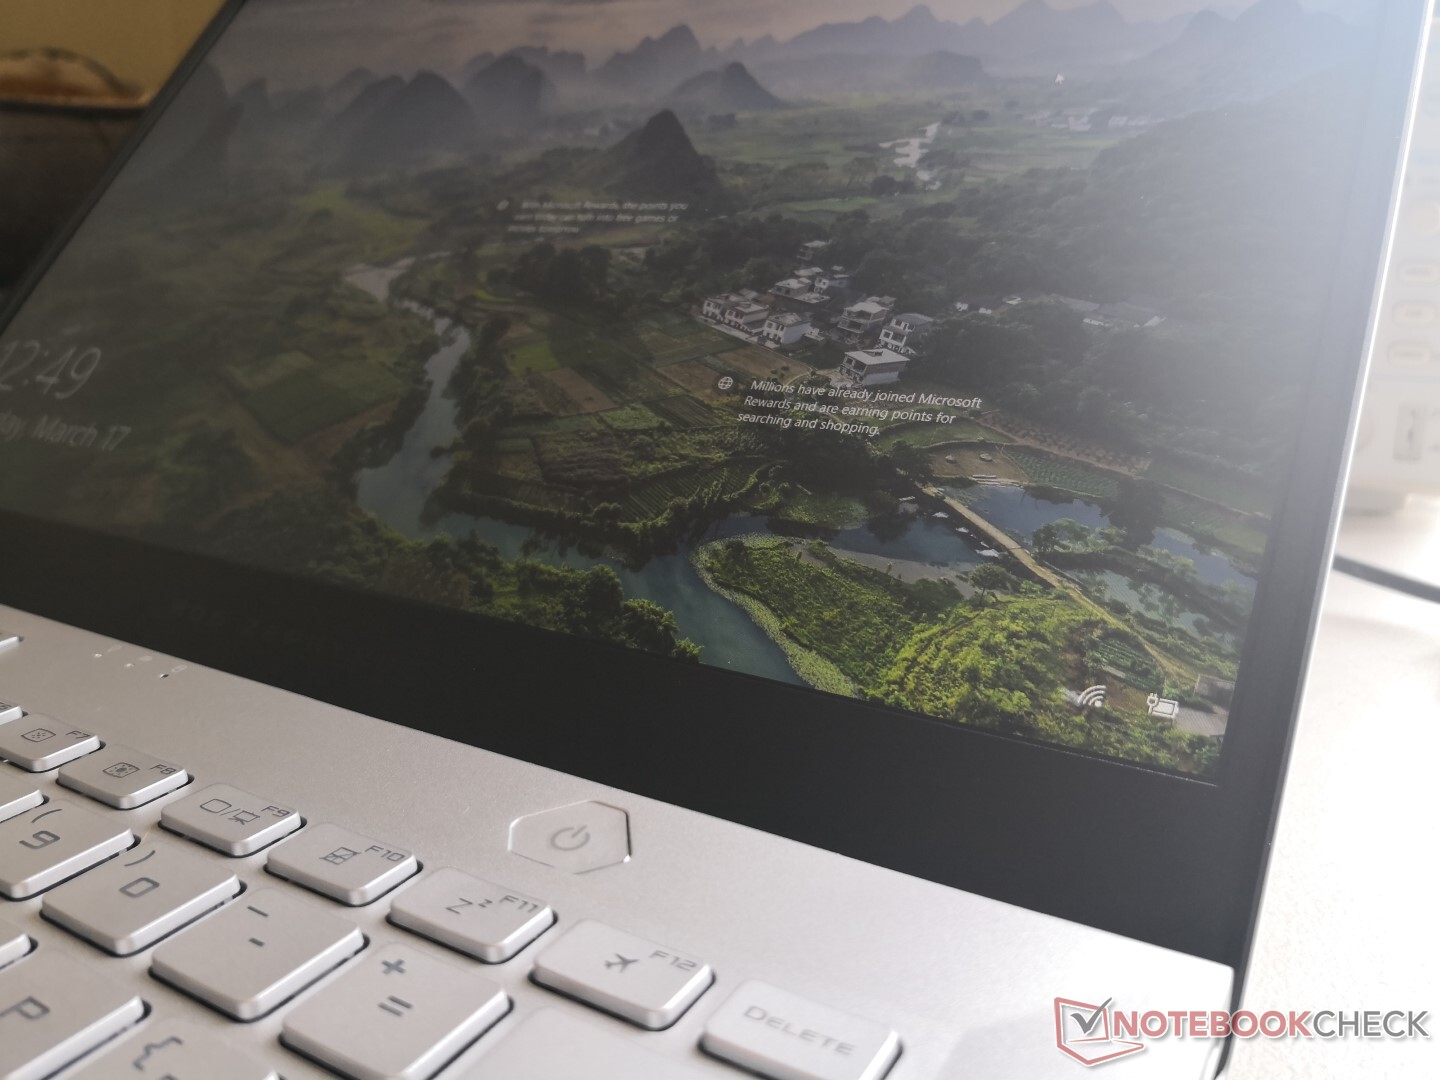
The visual style of the keyboard is in line with the larger Zephyrus laptops including the directional keys and the row of four auxiliary keys along the top. Travel and feedback actually feel deeper and stronger, respectively, than the keyboards on the slimmer ZenBook S series. Even feedback from the Function keys and directional keys feel just as strong as the main QWERTY keys whereas these are typically spongier on most other laptops. One complaint, however, is that clatter from the Space, Enter, and Backspace keys is louder than the main QWERTY keys for an overall louder typing experience than the XPS 13 or ThinkPad T or X series.
Another complaint relates to the poor contrast between the silver key caps and the gray key font. Similar to the white HP Spectre laptops, the font here can be difficult to see and this only becomes worse when the white backlight is on. The black color option for the Zephyrus G14 will not have this same problem. Per-key RGB lighting options like on the Razer Blade Stealth would have alleviated this somewhat.
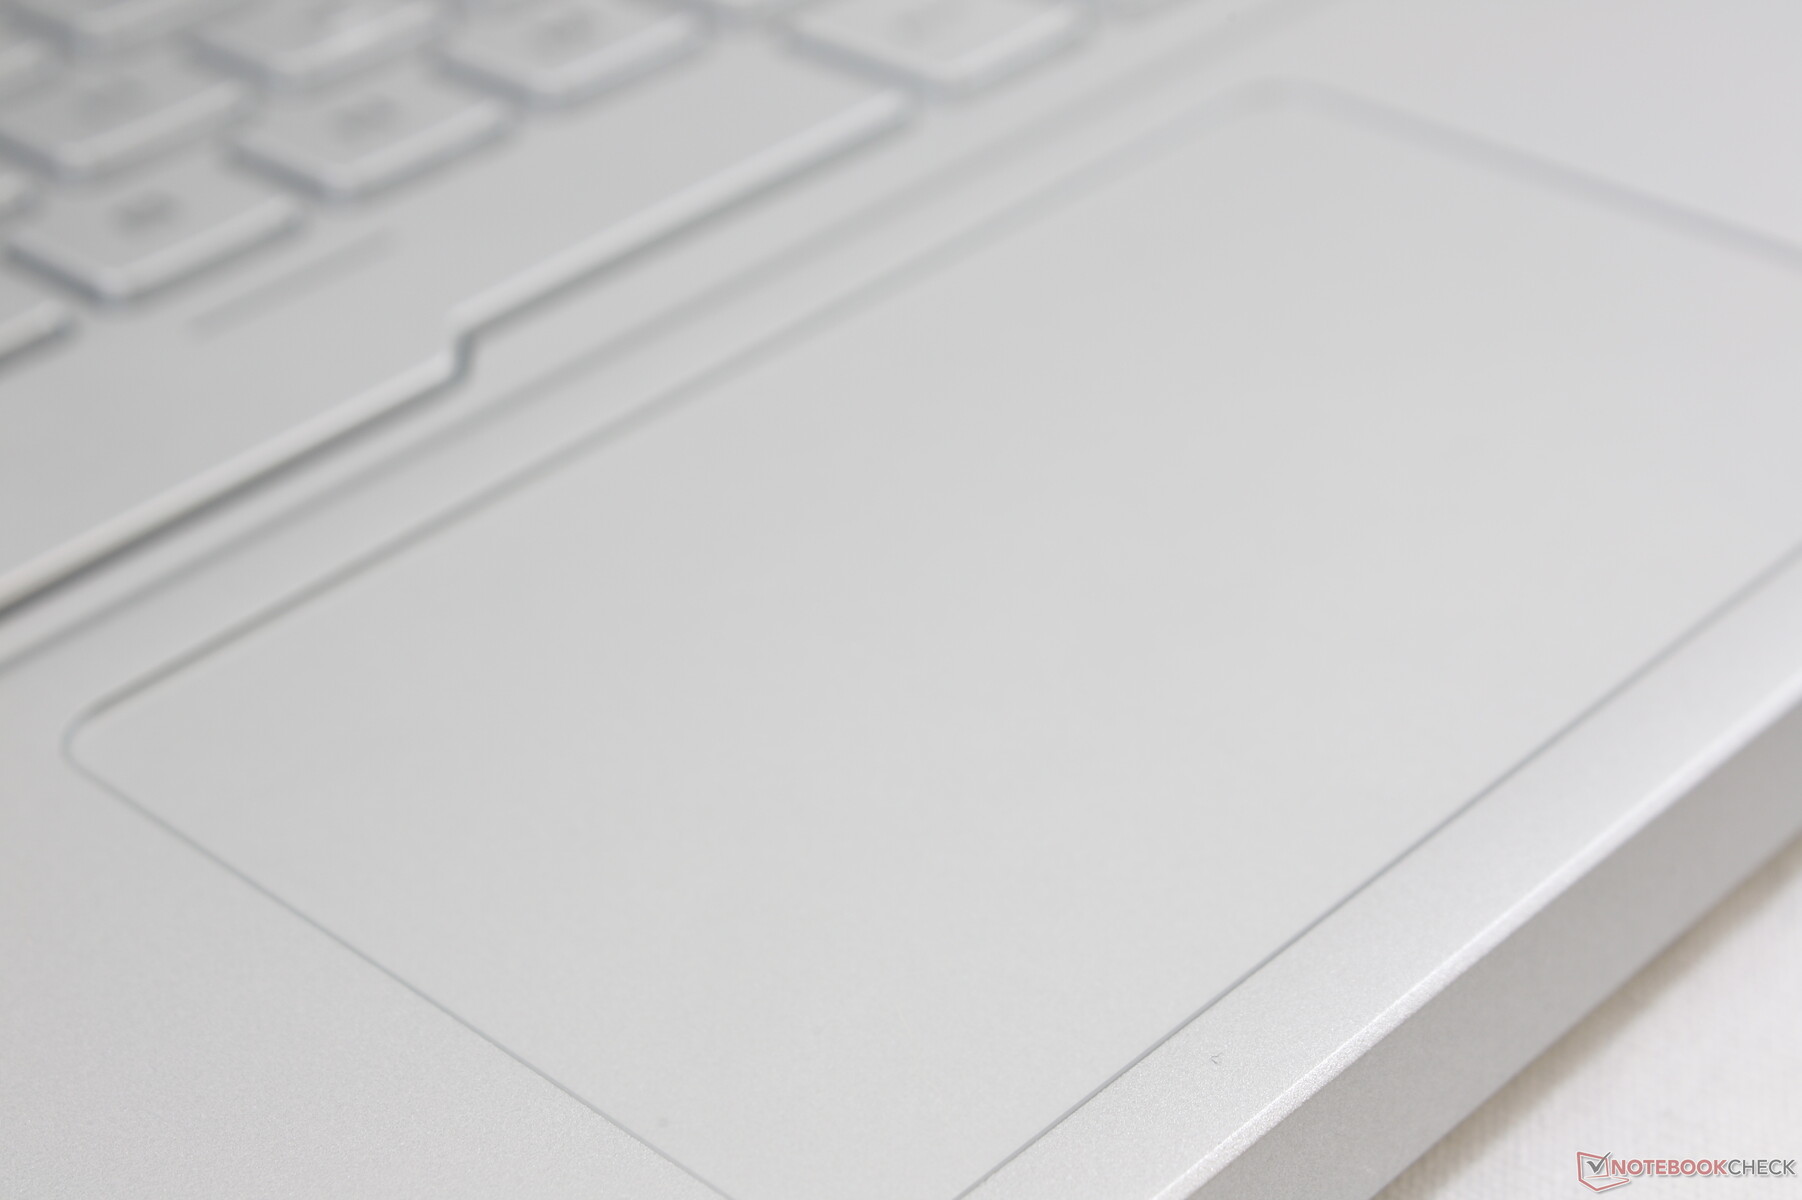
Touchpad
The Precision-enabled clickpad (10.5 x 6 cm) is slightly smaller then the clickpad on the 15.6-inch Zephyrus M (10.5 x 7.5 cm) and almost the same size as the clickpad on the ZenBook 14 (10.5 x 6.2 cm). Glide is very smooth with almost no sticking even when moving at slow speeds and the fast 120 Hz display makes cursor control feel more responsive when compared to Ultrabooks. The integrated mouse clicks, however, are too soft and far too shallow with unsatisfying feedback when pressed. Actions like dragging and dropping are more difficult as a result.
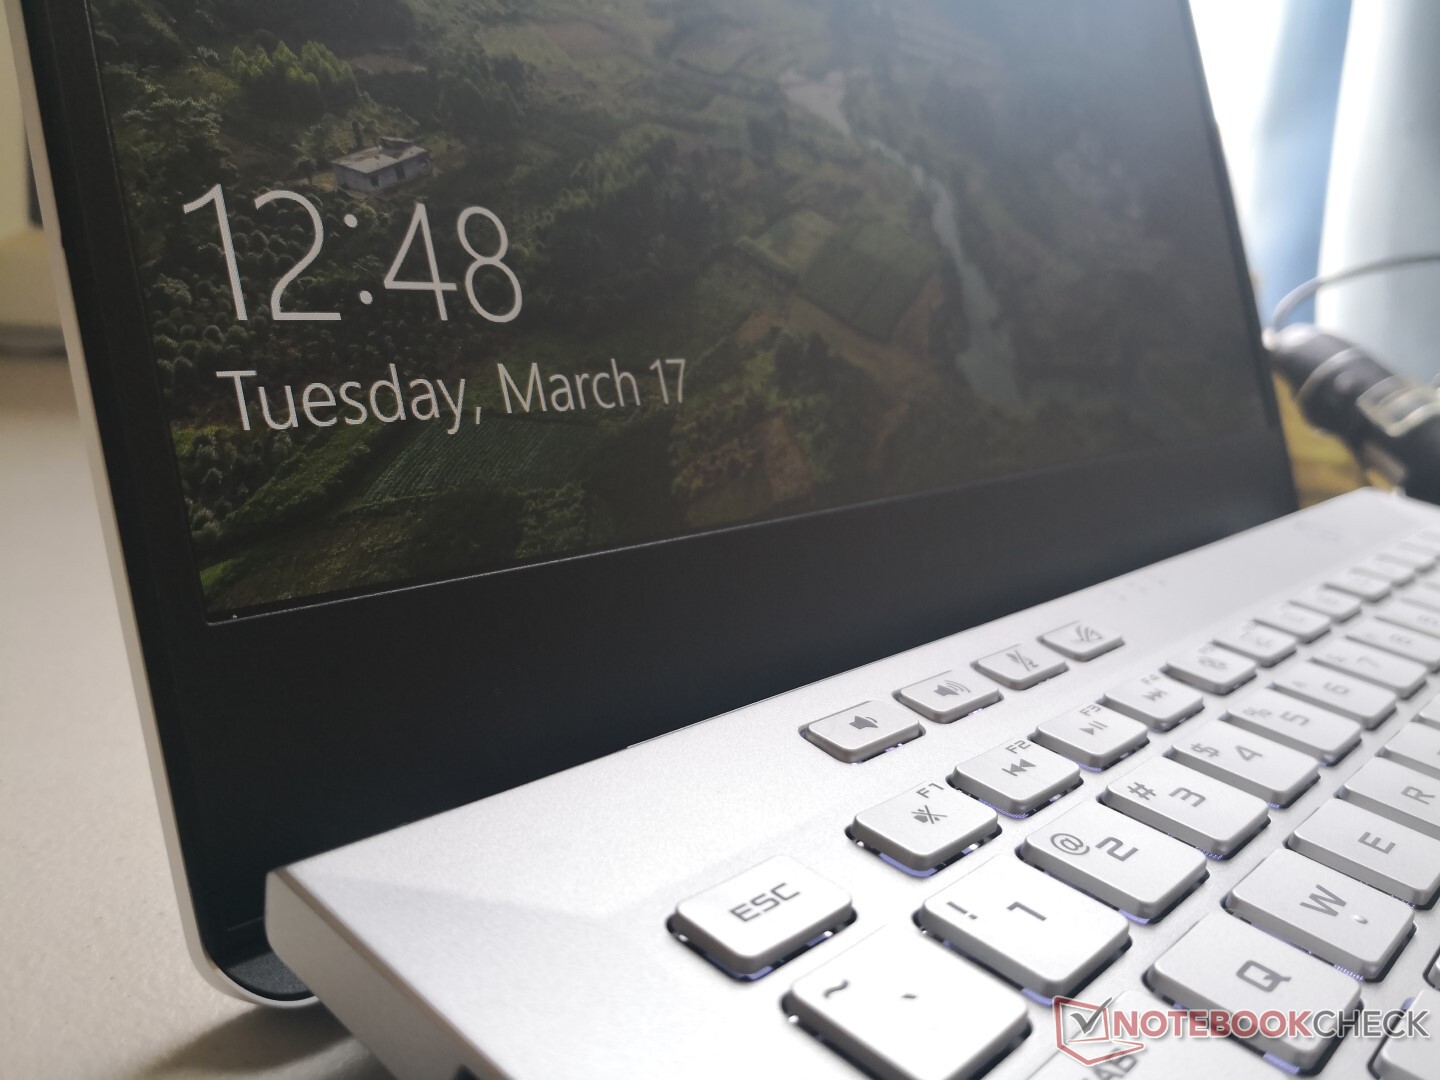
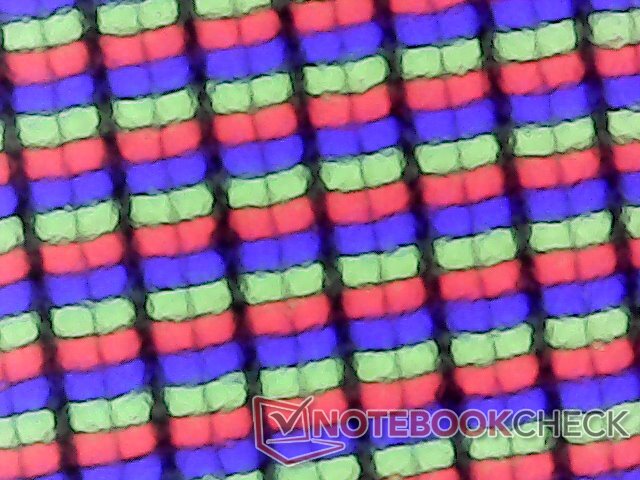
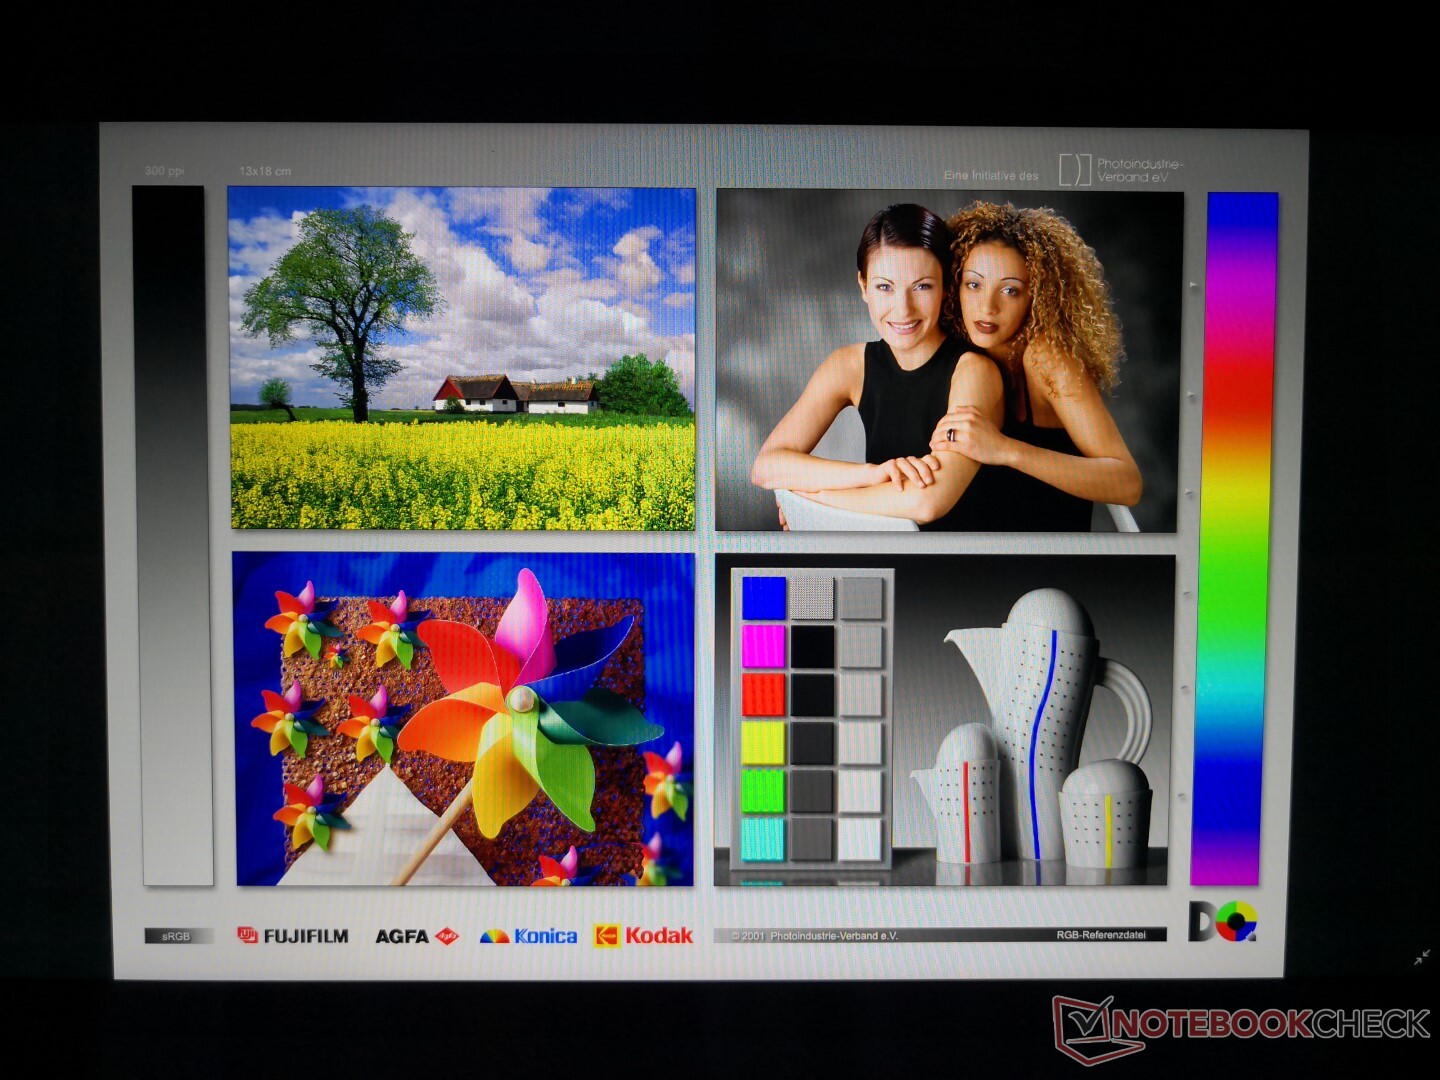
Display: 120 Hz with FreeSync Support
The CEC LM140LF-1F01 IPS panel on the Zephyrus G14 can be found on no other laptop in our database. Nonetheless, Asus uses a very similar CEC LM140LF-3L03 panel for its other 14-inch laptop: the ZenBook 14 UM431. These two panels share similar gamuts and contrast ratios as a result albeit with some important differences. The Zephyrus G14 panel, for example, is brighter with support for both 120 Hz and FreeSync to reduce screen tearing when gaming. Its main drawback is the slower black-white and gray-gray response times which don't come close to the 3 ms or 5 ms panels available on most 15.6-inch gaming laptops like the MSI GS65 or Asus Zephyrus S.
Subjectively, the 1080p display is slightly grainier than a glossy alternative as expected from most matte panels. It's an upper mid-range display that doesn't quite reach the colors or response times you'd get on other flagship ultra-thin gaming laptops.
| |||||||||||||||||||||||||
Brightness Distribution: 87 %
Center on Battery: 192.3 cd/m²
Contrast: 1239:1 (Black: 0.26 cd/m²)
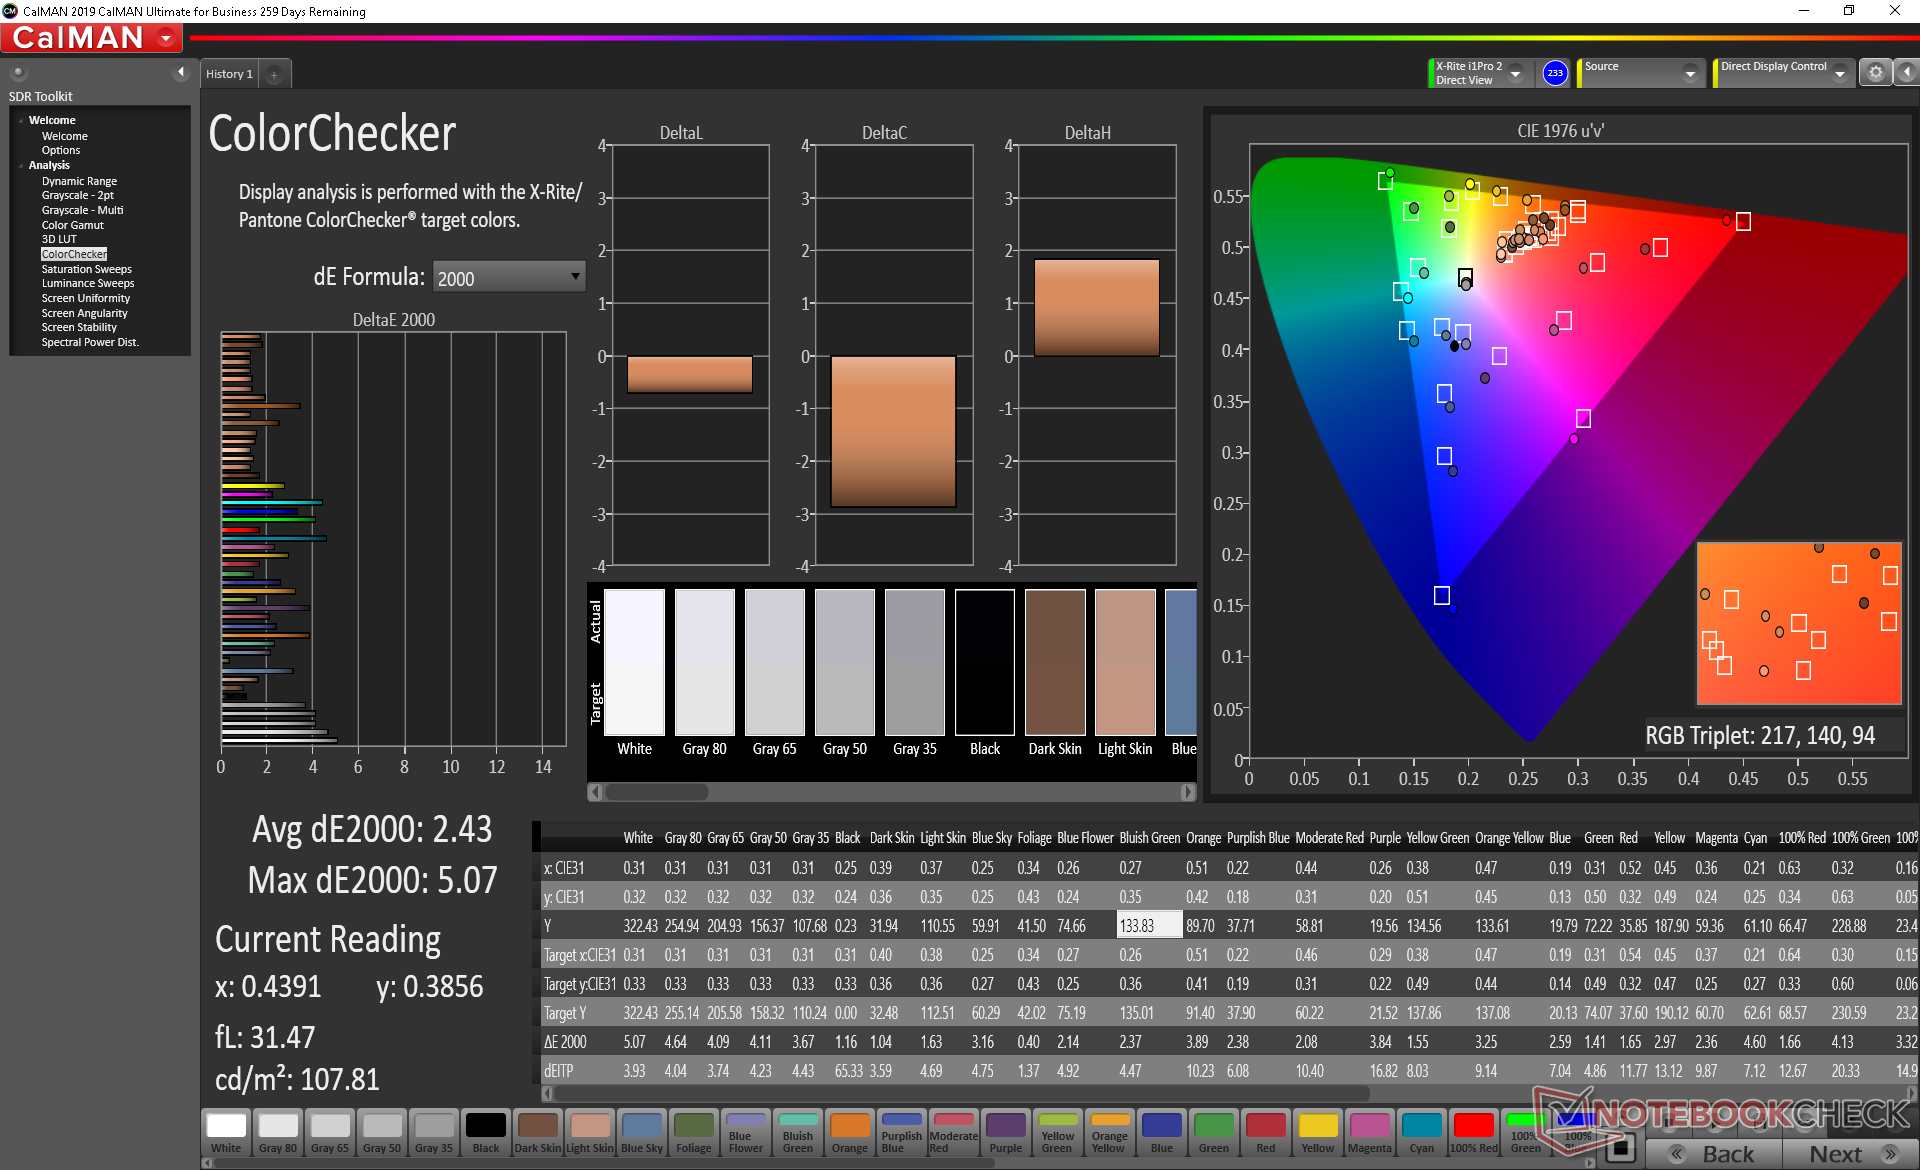
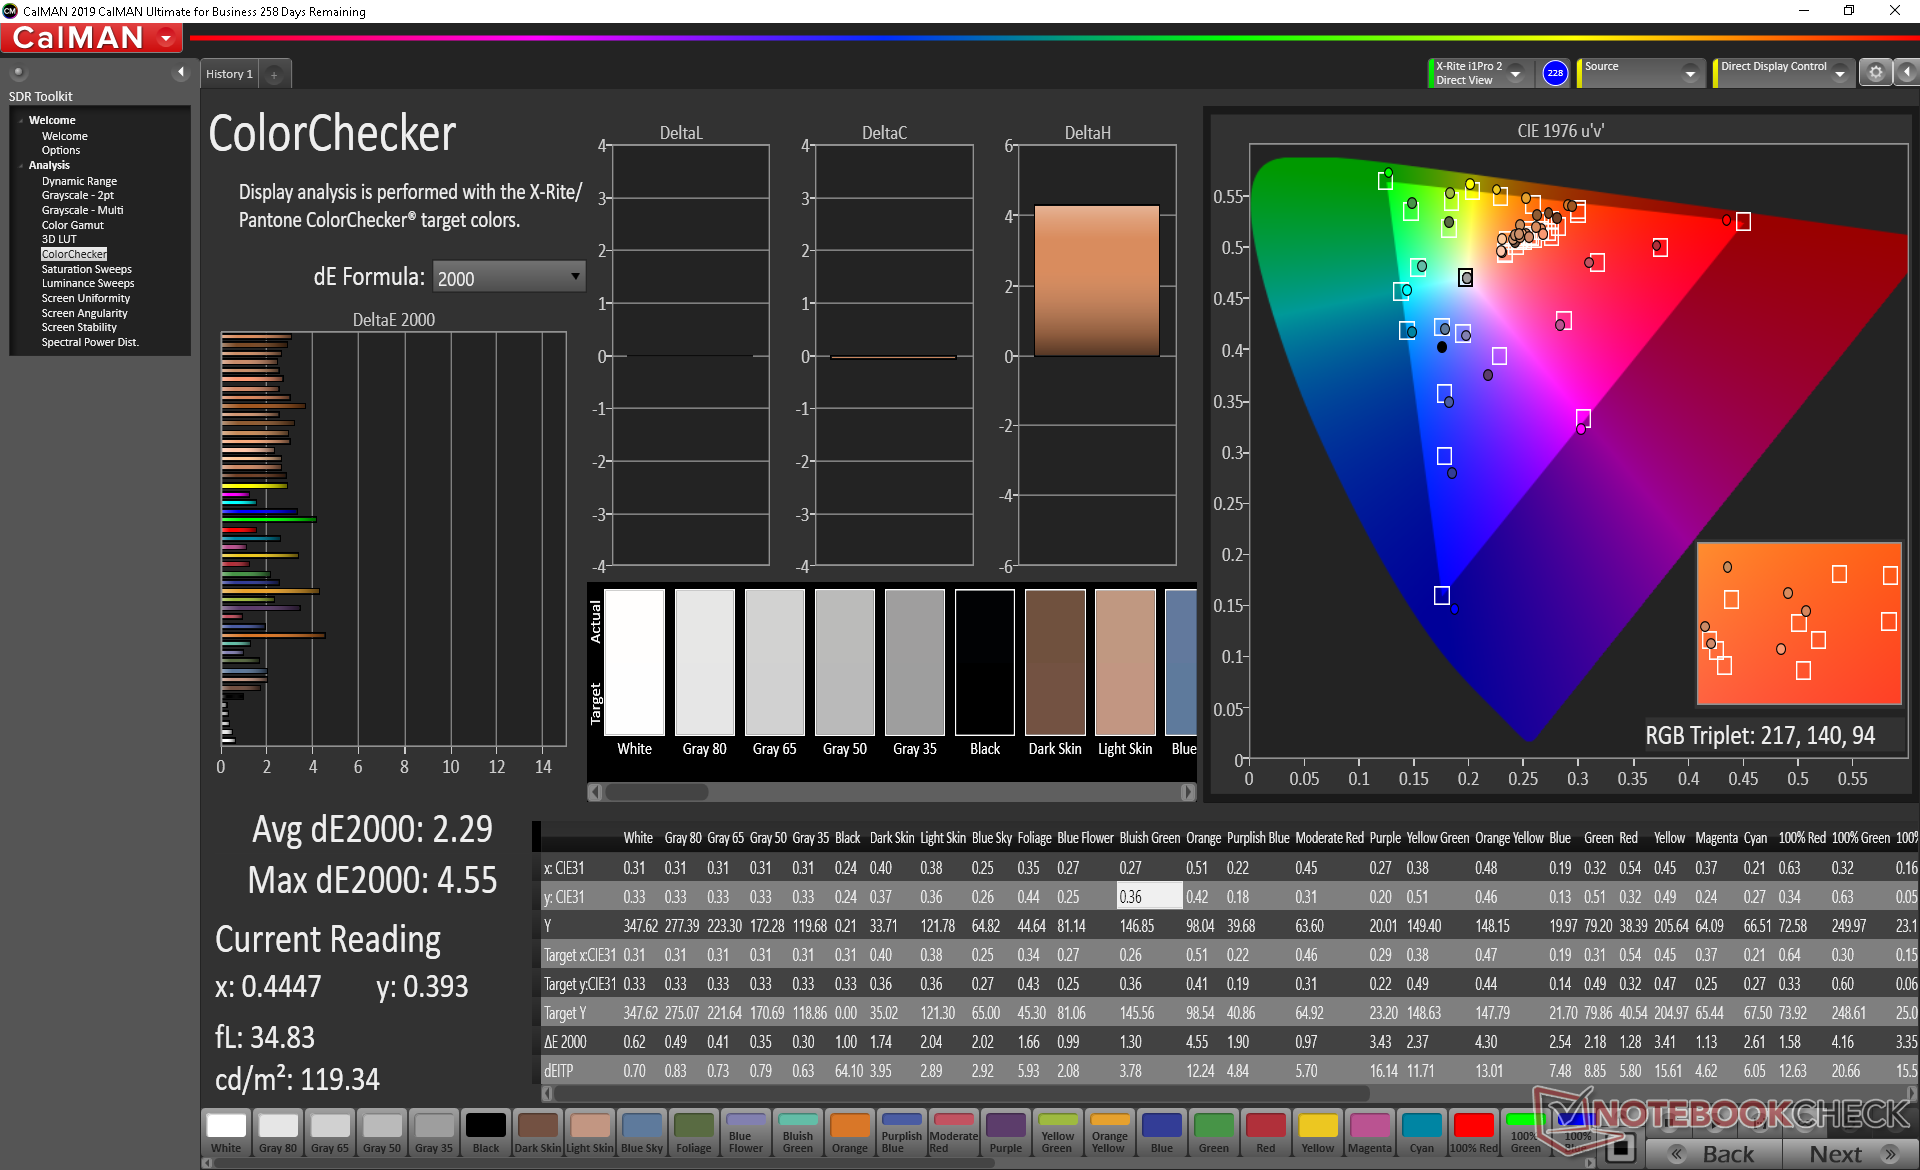
ΔE ColorChecker Calman: 2.43 | ∀{0.5-29.43 Ø4.75}
calibrated: 2.29
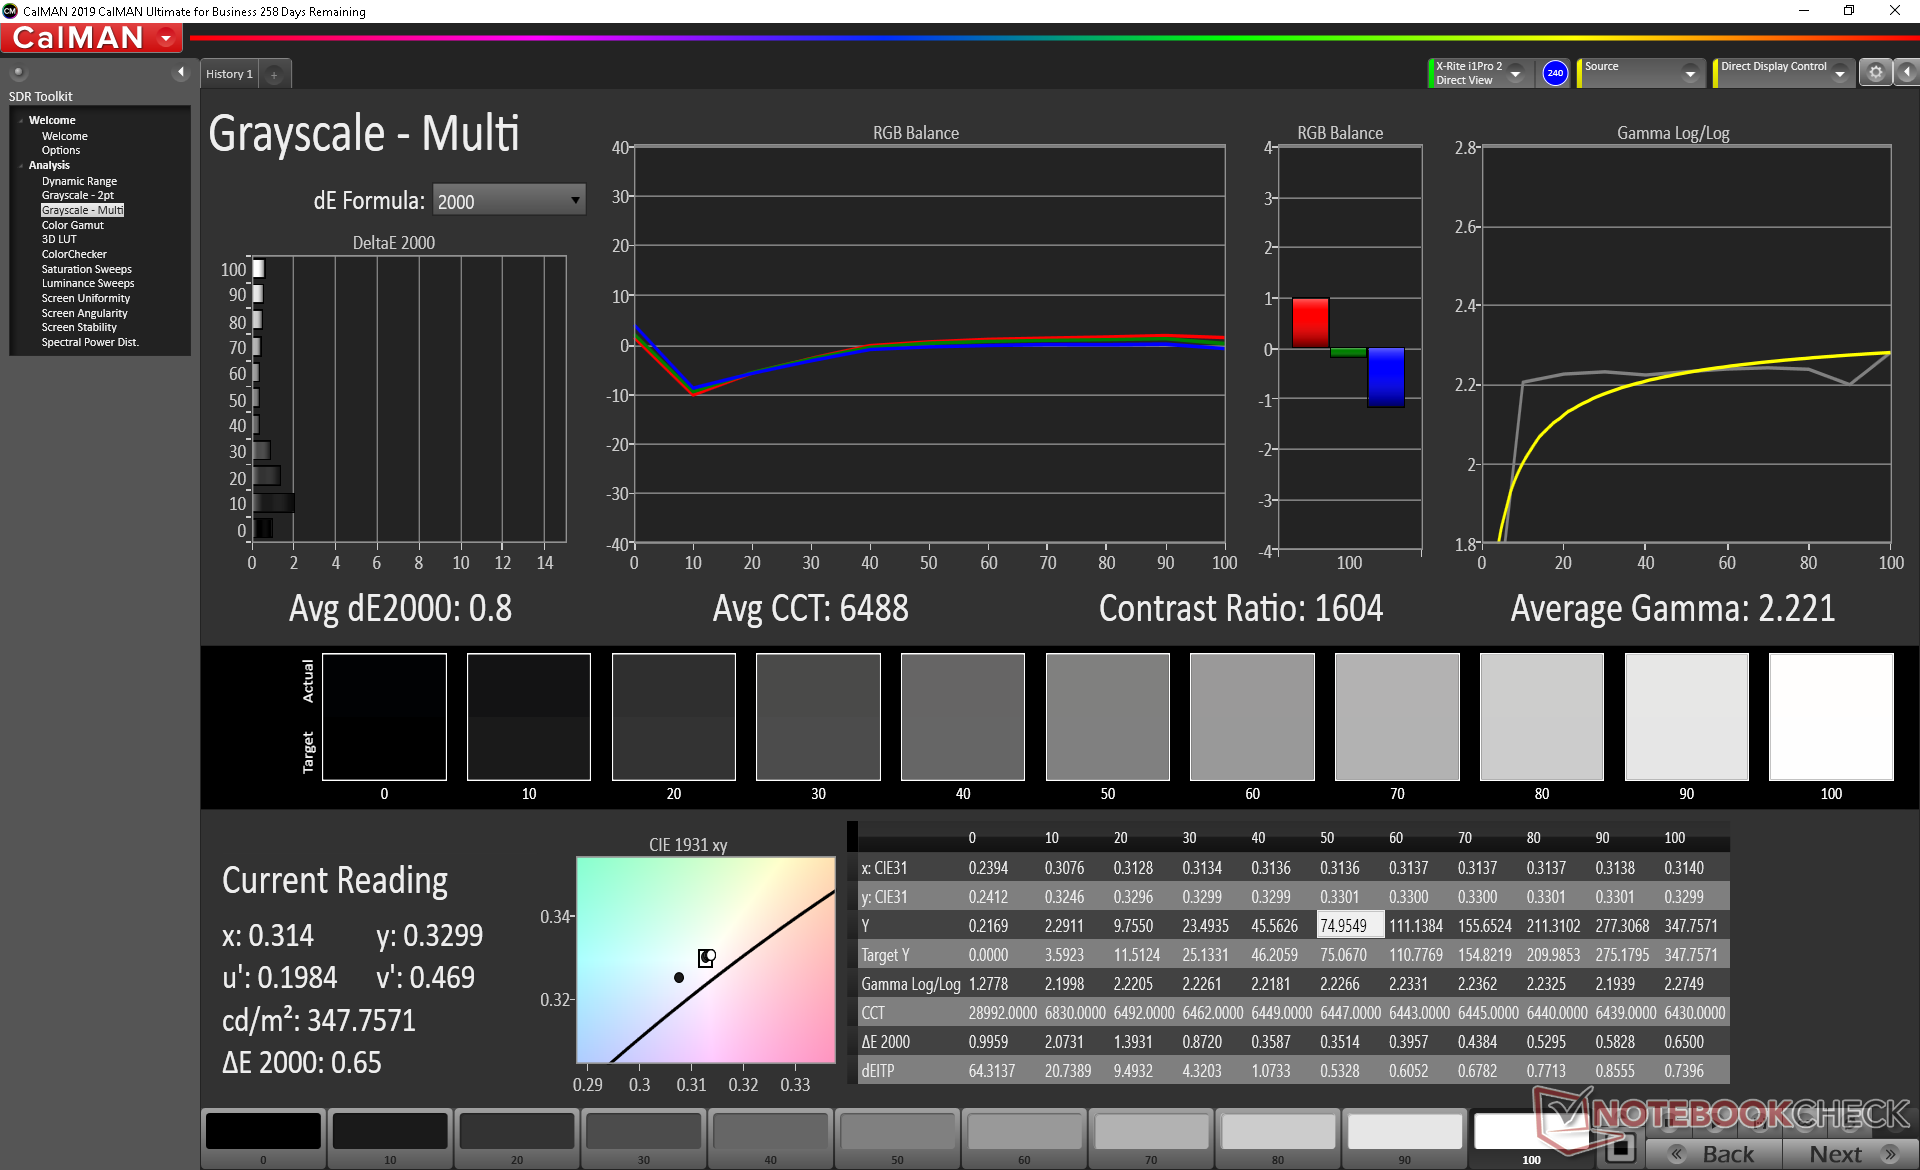
ΔE Greyscale Calman: 3.3 | ∀{0.09-98 Ø5}
91.9% sRGB (Argyll 1.6.3 3D)
60% AdobeRGB 1998 (Argyll 1.6.3 3D)
67.2% AdobeRGB 1998 (Argyll 3D)
92% sRGB (Argyll 3D)
66.5% Display P3 (Argyll 3D)
Gamma: 2.22
CCT: 6902 K
| Asus Zephyrus G14 GA401IV CEC PA LM140LF-1F01, IPS, 14", 1920x1080 | Asus ROG Zephyrus M15 GU502GU-XB74 AU Optronics B156HAN08.2, IPS, 15.6", 1920x1080 | Razer Blade 15 GTX 1660 Ti BOE NV156FHM-N4K, IPS, 15.6", 1920x1080 | MSI GS65 Stealth 9SG Sharp LQ156M1JW03 (SHP14C5), IPS, 15.6", 1920x1080 | Alienware m15 R2 P87F Sharp LQ156M1, IPS, 15.6", 1920x1080 | MSI Prestige 14 A10SC-009 IPS, 14", 3840x2160 | |
|---|---|---|---|---|---|---|
| Display | -1% | -1% | 4% | -0% | ||
| Display P3 Coverage (%) | 66.5 | 66.5 0% | 65.3 -2% | 67.6 2% | 65.3 -2% | |
| sRGB Coverage (%) | 92 | 90.8 -1% | 91.8 0% | 97.5 6% | 95.1 3% | |
| AdobeRGB 1998 Coverage (%) | 67.2 | 66.5 -1% | 66.5 -1% | 68.9 3% | 65.9 -2% | |
| Response Times | 80% | 70% | 68% | 69% | -15% | |
| Response Time Grey 50% / Grey 80% * (ms) | 43.6 ? | 6.4 ? 85% | 13.6 ? 69% | 13.6 ? 69% | 16.4 ? 62% | 55 ? -26% |
| Response Time Black / White * (ms) | 34.8 ? | 8.8 ? 75% | 10 ? 71% | 12 ? 66% | 8.8 ? 75% | 36 ? -3% |
| PWM Frequency (Hz) | 200 ? | 23260 ? | 23810 ? | |||
| Screen | -17% | -17% | 13% | -39% | 24% | |
| Brightness middle (cd/m²) | 322.2 | 297.7 -8% | 312.7 -3% | 282.3 -12% | 324.2 1% | 567 76% |
| Brightness (cd/m²) | 302 | 280 -7% | 305 1% | 269 -11% | 304 1% | 516 71% |
| Brightness Distribution (%) | 87 | 84 -3% | 90 3% | 90 3% | 90 3% | 86 -1% |
| Black Level * (cd/m²) | 0.26 | 0.43 -65% | 0.27 -4% | 0.32 -23% | 0.38 -46% | 0.445 -71% |
| Contrast (:1) | 1239 | 692 -44% | 1158 -7% | 882 -29% | 853 -31% | 1274 3% |
| Colorchecker dE 2000 * | 2.43 | 3.13 -29% | 4.57 -88% | 1.17 52% | 5.01 -106% | 1.55 36% |
| Colorchecker dE 2000 max. * | 5.07 | 7.1 -40% | 6.81 -34% | 3.29 35% | 12.7 -150% | 5.14 -1% |
| Colorchecker dE 2000 calibrated * | 2.29 | 3.06 -34% | 2.91 -27% | 1.06 54% | 1.64 28% | 1.24 46% |
| Greyscale dE 2000 * | 3.3 | 1.9 42% | 4.3 -30% | 1.3 61% | 7.9 -139% | 1.48 55% |
| Gamma | 2.22 99% | 2.23 99% | 2.29 96% | 2.2 100% | 2.35 94% | 2.19 100% |
| CCT | 6902 94% | 6325 103% | 7098 92% | 6643 98% | 8455 77% | 6741 96% |
| Color Space (Percent of AdobeRGB 1998) (%) | 60 | 59.2 -1% | 59.4 -1% | 63.8 6% | 60.8 1% | |
| Color Space (Percent of sRGB) (%) | 91.9 | 90.5 -2% | 91.3 -1% | 97.5 6% | 95.5 4% | |
| Total Average (Program / Settings) | 21% /
-2% | 17% /
-3% | 28% /
18% | 10% /
-19% | 5% /
17% |
* ... smaller is better
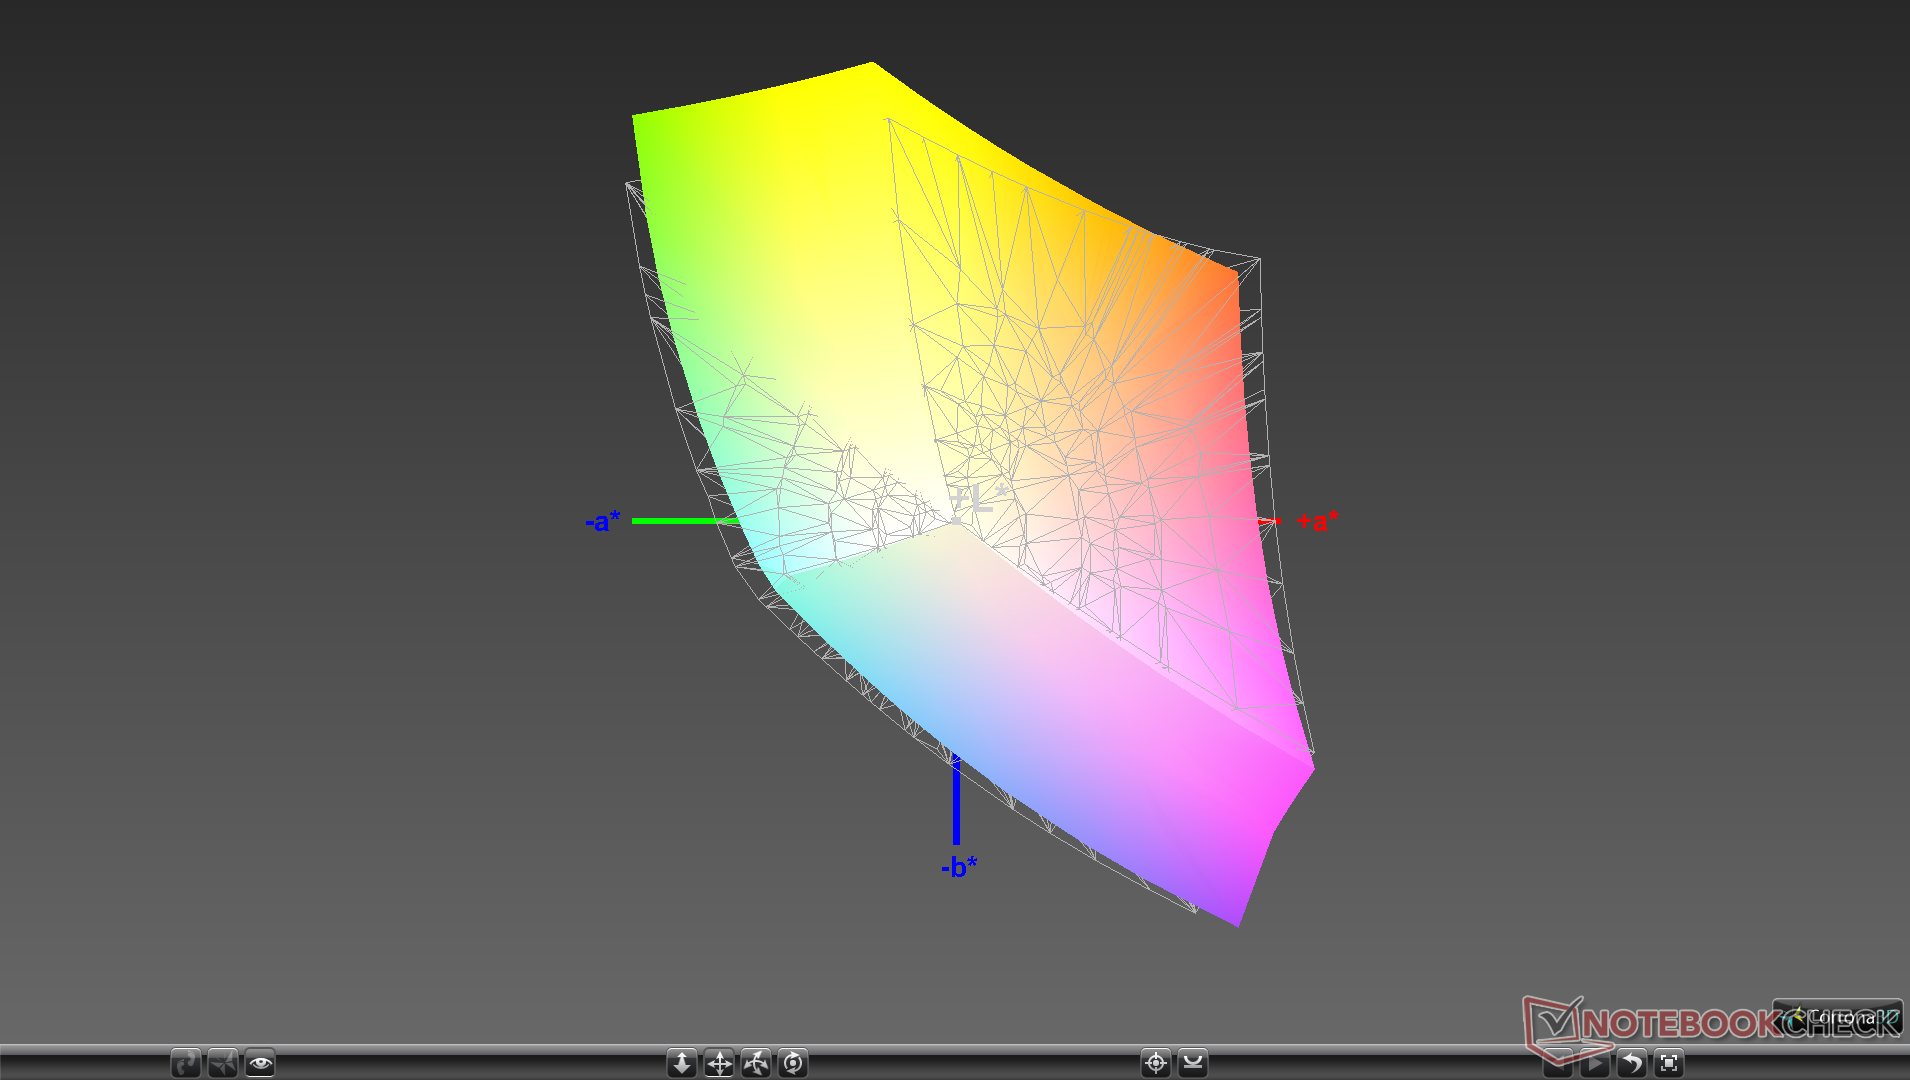
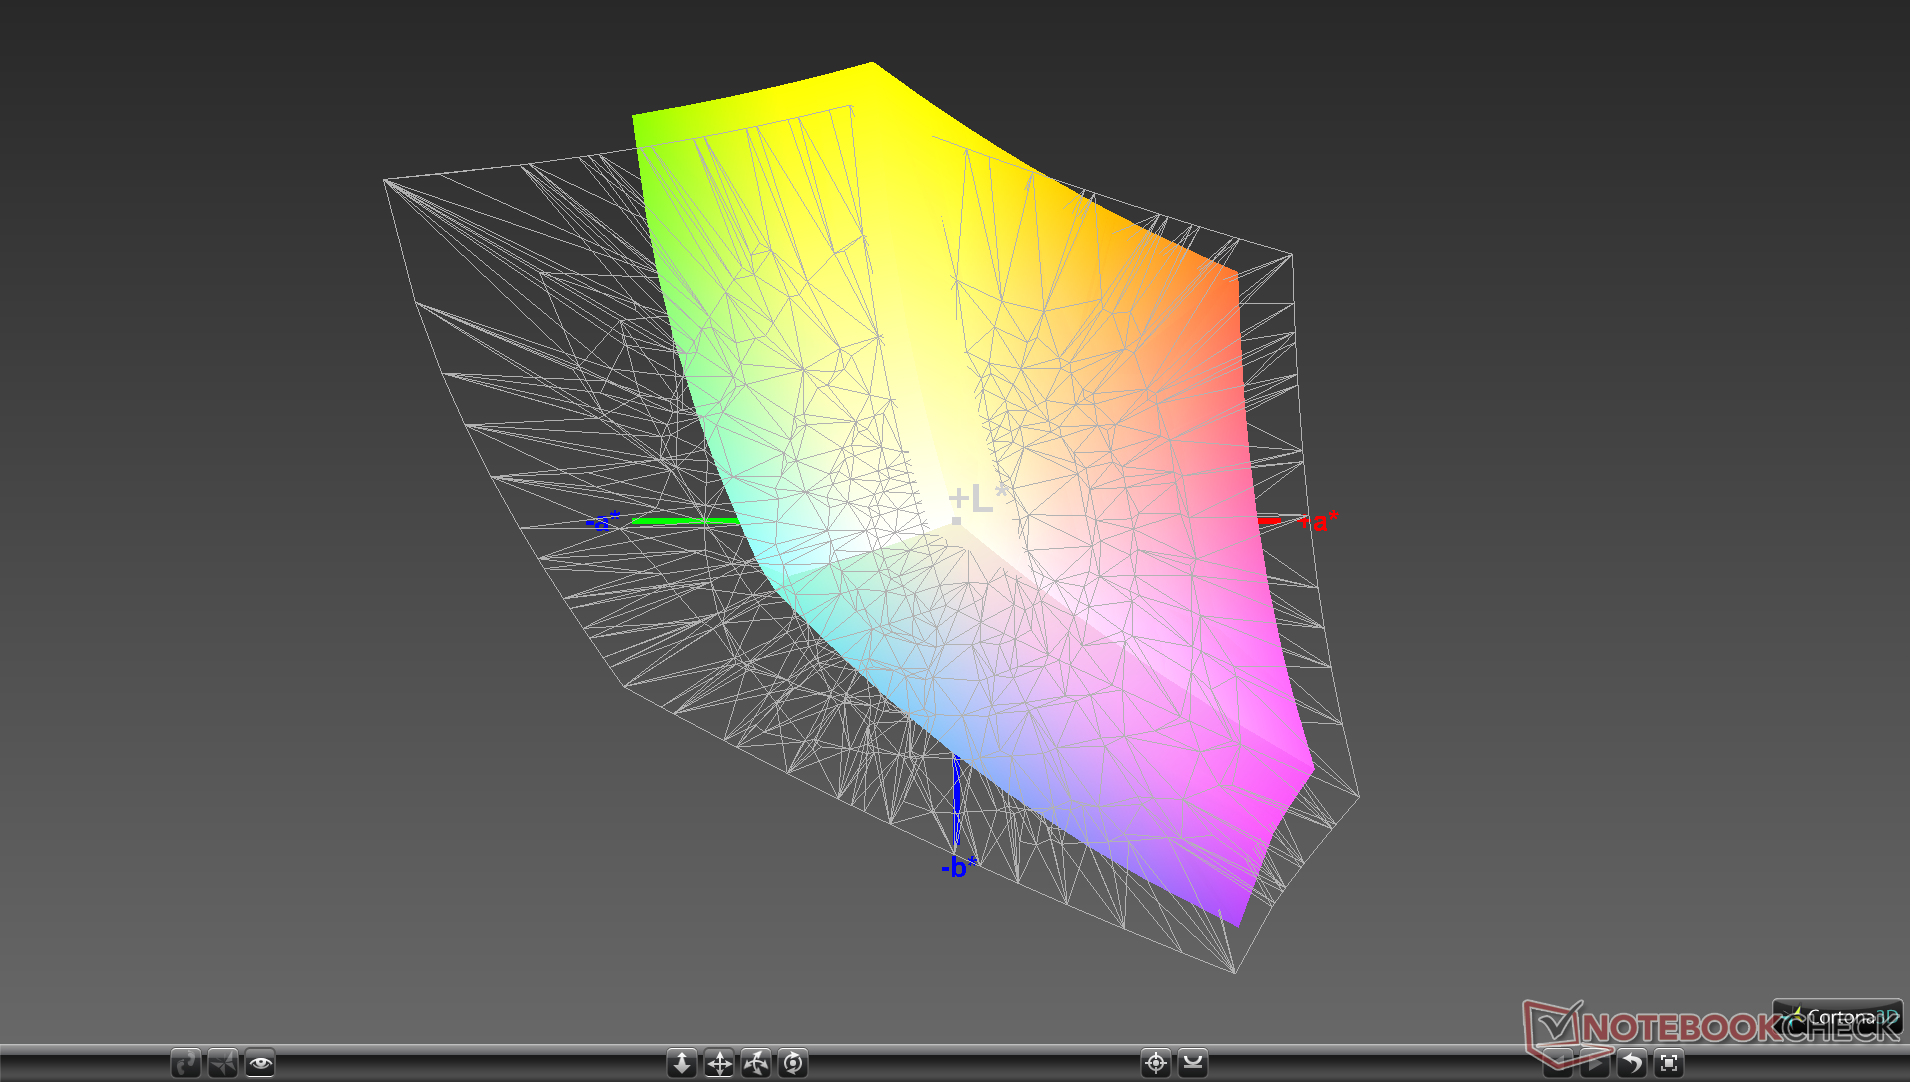
Color space covers approximately 60 percent and 92 percent of AdobeRGB and sRGB, respectively, to be in line with most every Zephyrus laptop currently available. You'll have to look at the Asus ZenBook Pro or ProArt series instead if you want deeper and more accurate colors fit for professional graphics work.
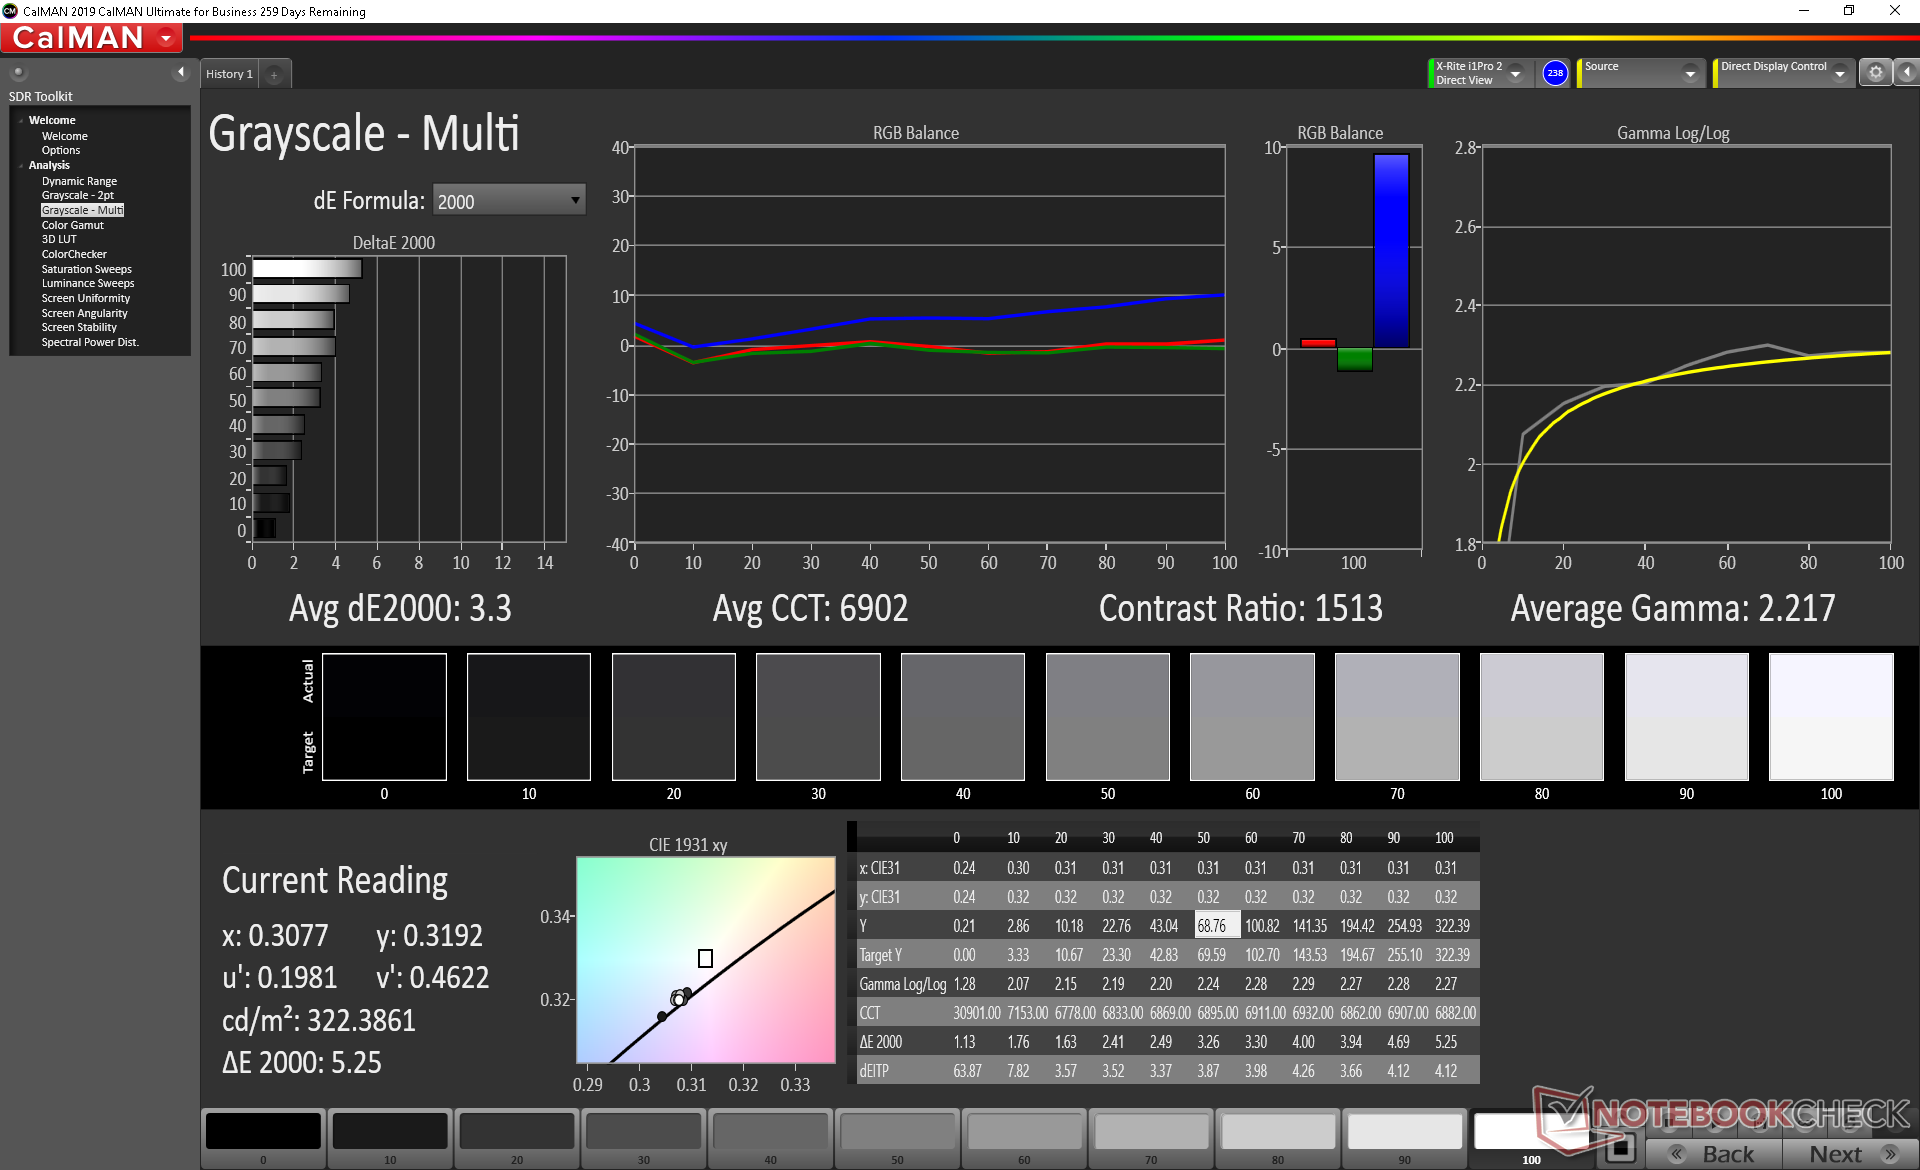
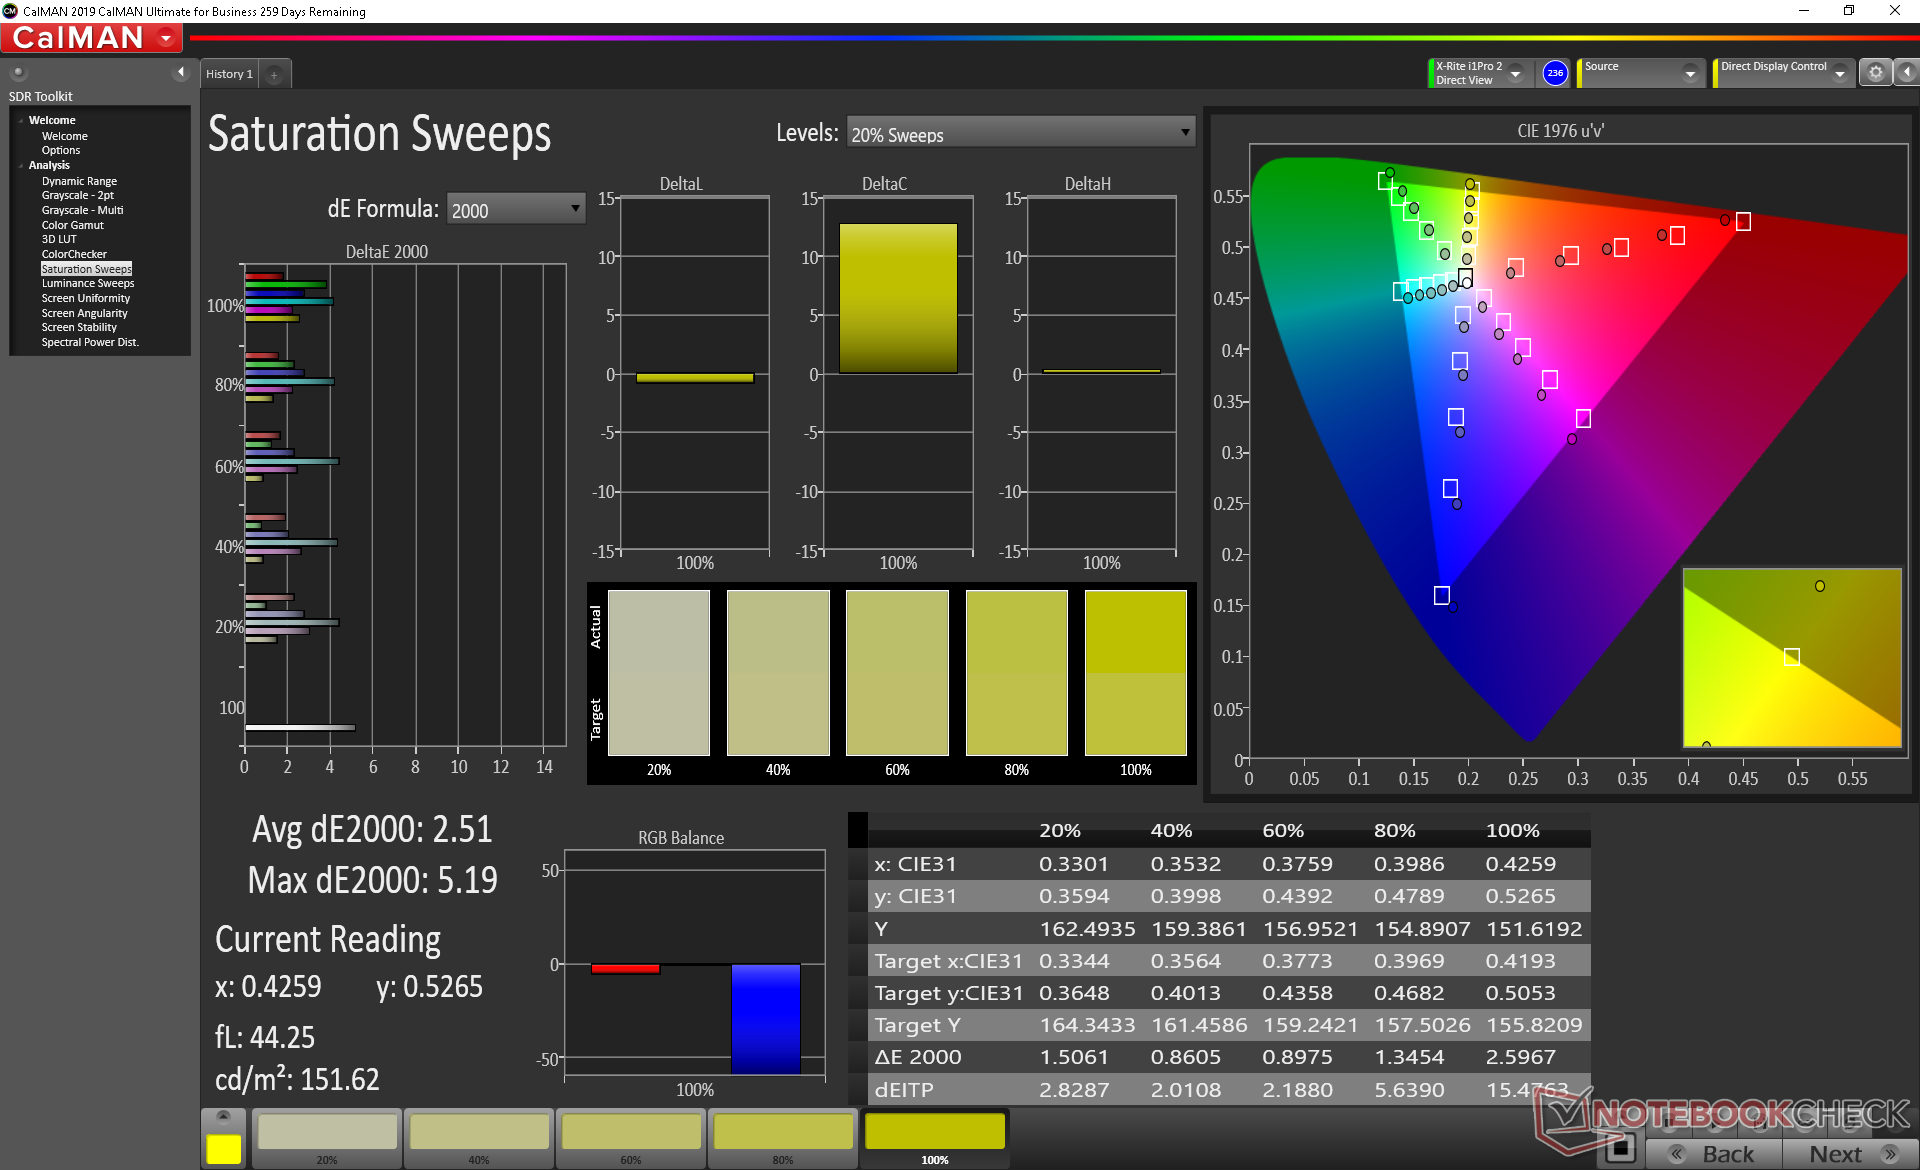
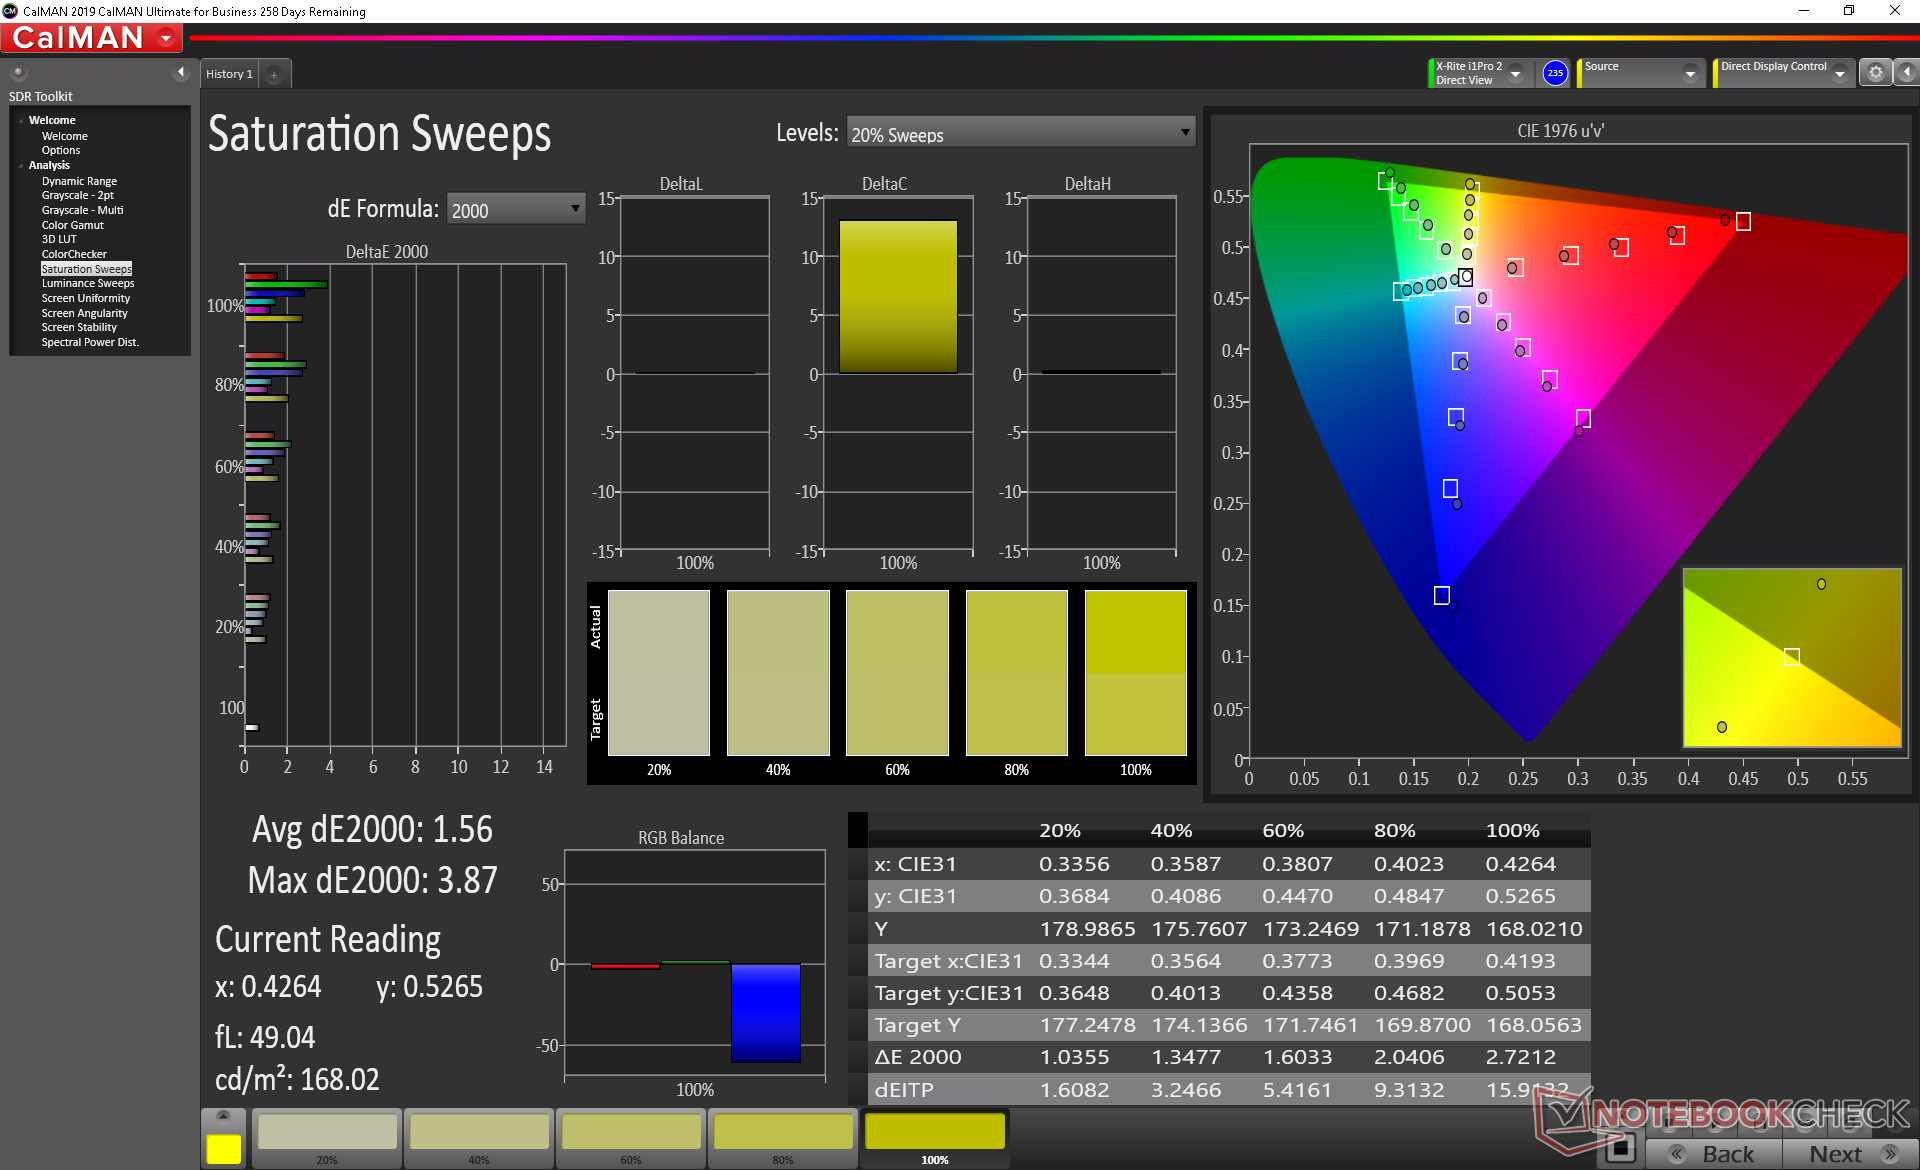
Further measurements with an X-Rite colorimeter reveal a decently calibrated display out of the box. It could be a little better, however, as our own calibration would improve the display even further from an average grayscale DeltaE of 3.3 to 0.8 and an average color DeltaE from 2.51 to 1.56. Colors become slightly more inaccurate the higher the saturation level since sRGB coverage is not perfect.
Display Response Times
| ↔ Response Time Black to White | ||
|---|---|---|
| 34.8 ms ... rise ↗ and fall ↘ combined | ↗ 20.4 ms rise | 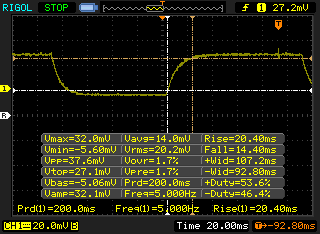 |
| ↘ 14.4 ms fall | ||
| The screen shows slow response rates in our tests and will be unsatisfactory for gamers. In comparison, all tested devices range from 0.1 (minimum) to 240 (maximum) ms. » 92 % of all devices are better. This means that the measured response time is worse than the average of all tested devices (20.1 ms). | ||
| ↔ Response Time 50% Grey to 80% Grey | ||
| 43.6 ms ... rise ↗ and fall ↘ combined | ↗ 21.2 ms rise | 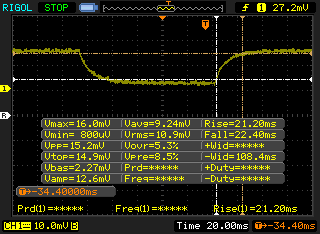 |
| ↘ 22.4 ms fall | ||
| The screen shows slow response rates in our tests and will be unsatisfactory for gamers. In comparison, all tested devices range from 0.165 (minimum) to 636 (maximum) ms. » 72 % of all devices are better. This means that the measured response time is worse than the average of all tested devices (31.4 ms). | ||
Screen Flickering / PWM (Pulse-Width Modulation)
| Screen flickering / PWM not detected | 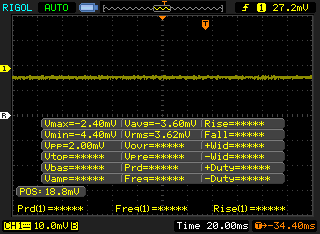 | ||
In comparison: 53 % of all tested devices do not use PWM to dim the display. If PWM was detected, an average of 7996 (minimum: 5 - maximum: 343500) Hz was measured. | |||
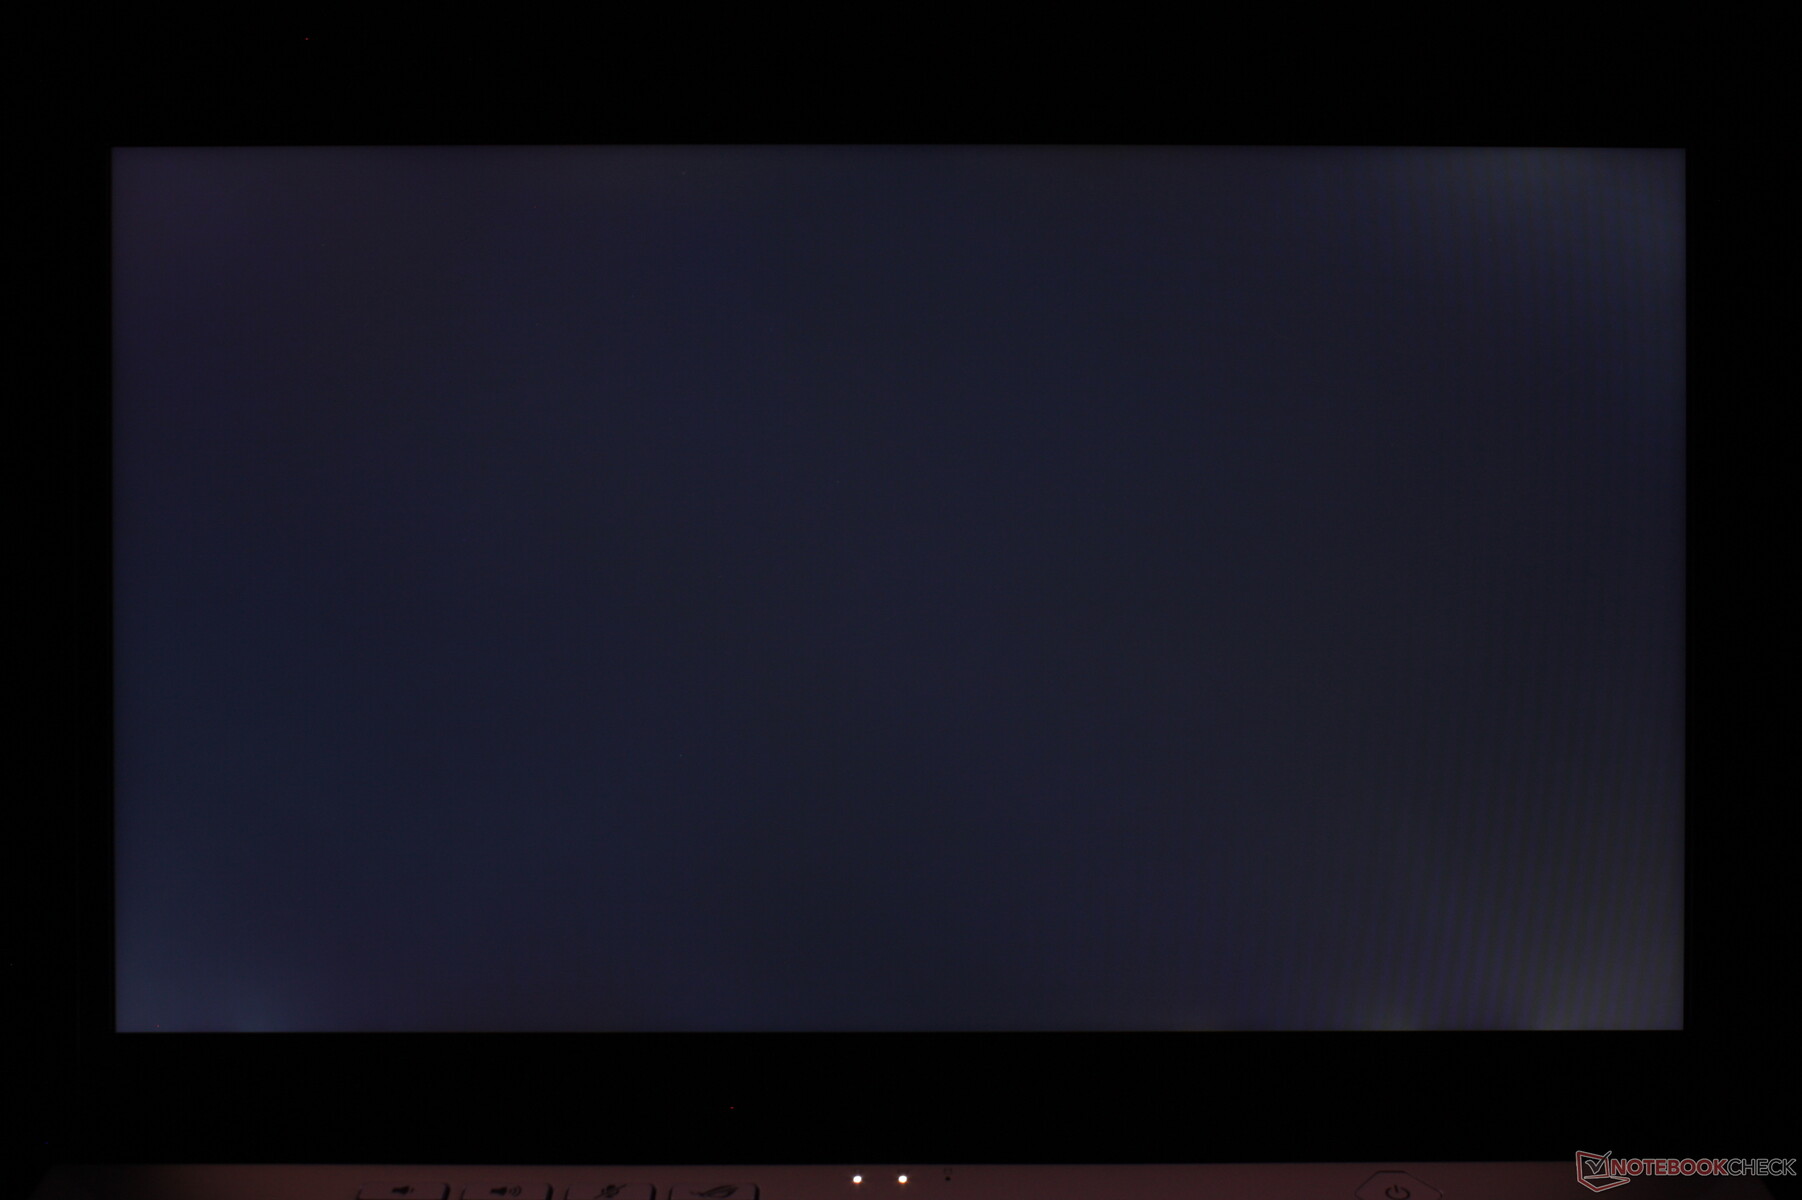
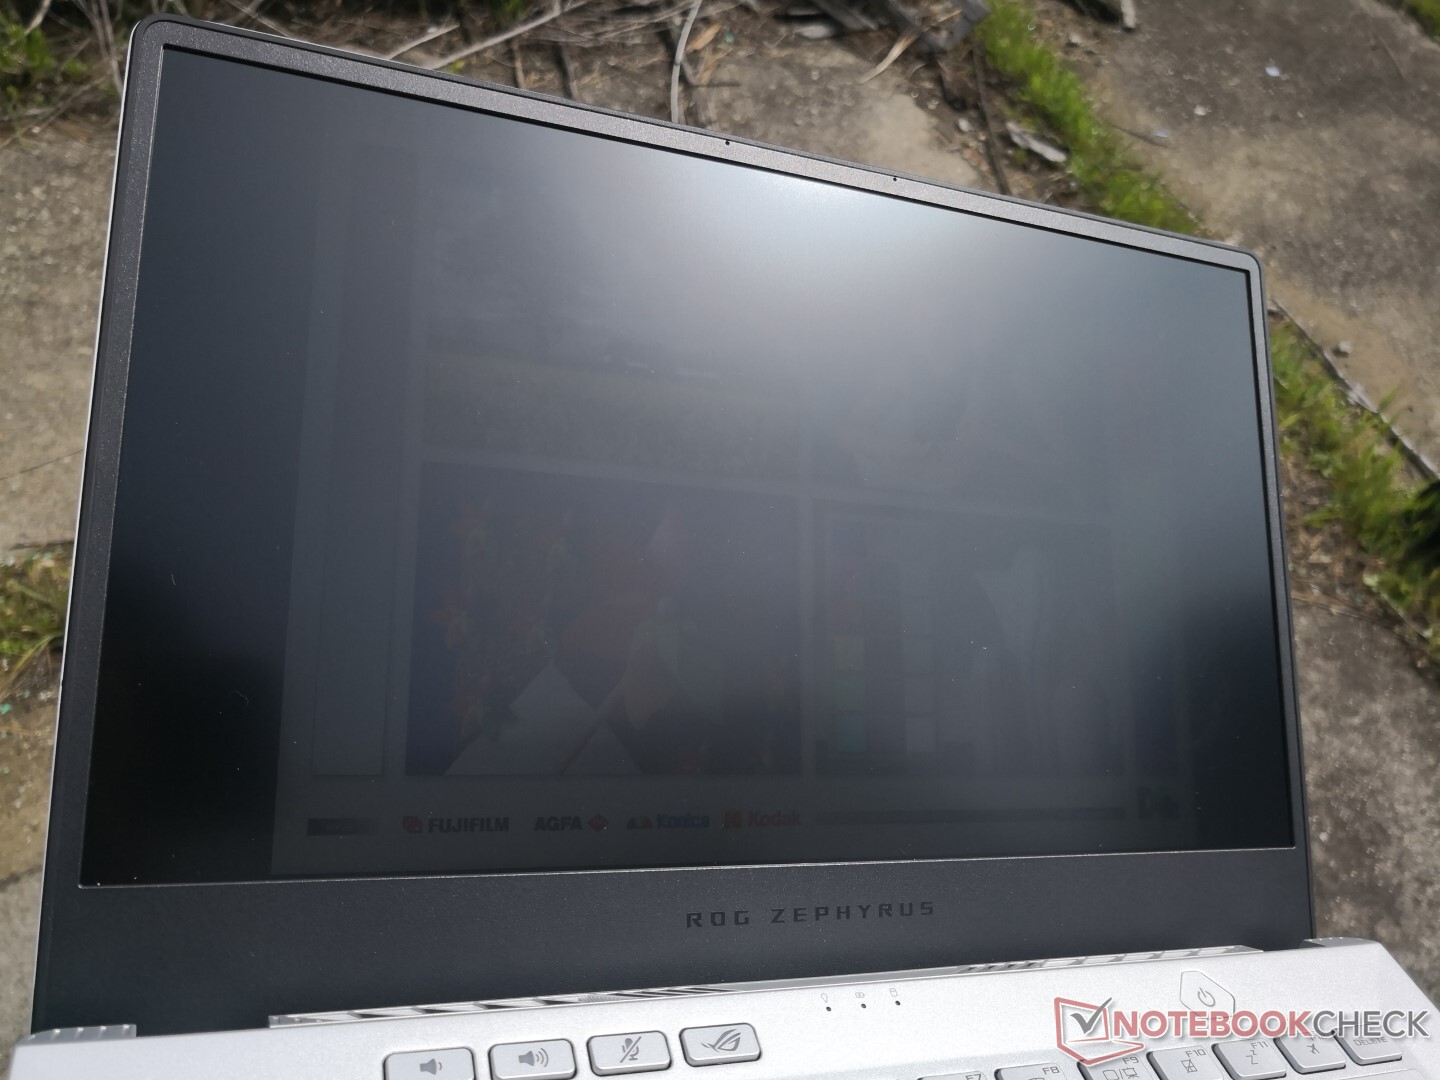
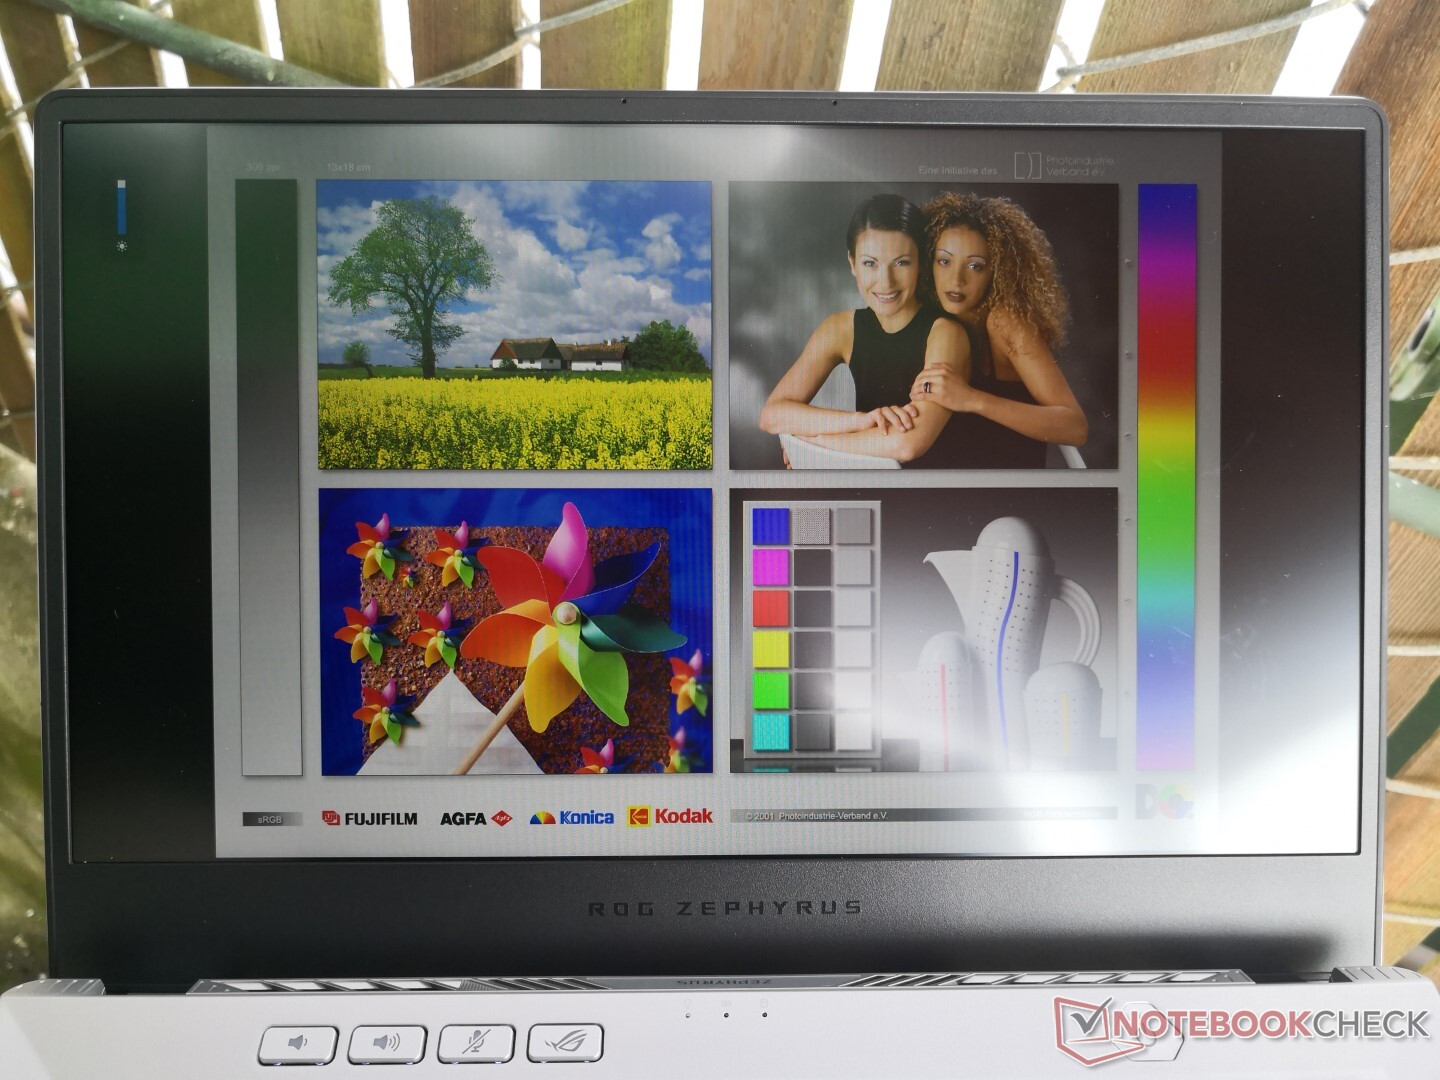
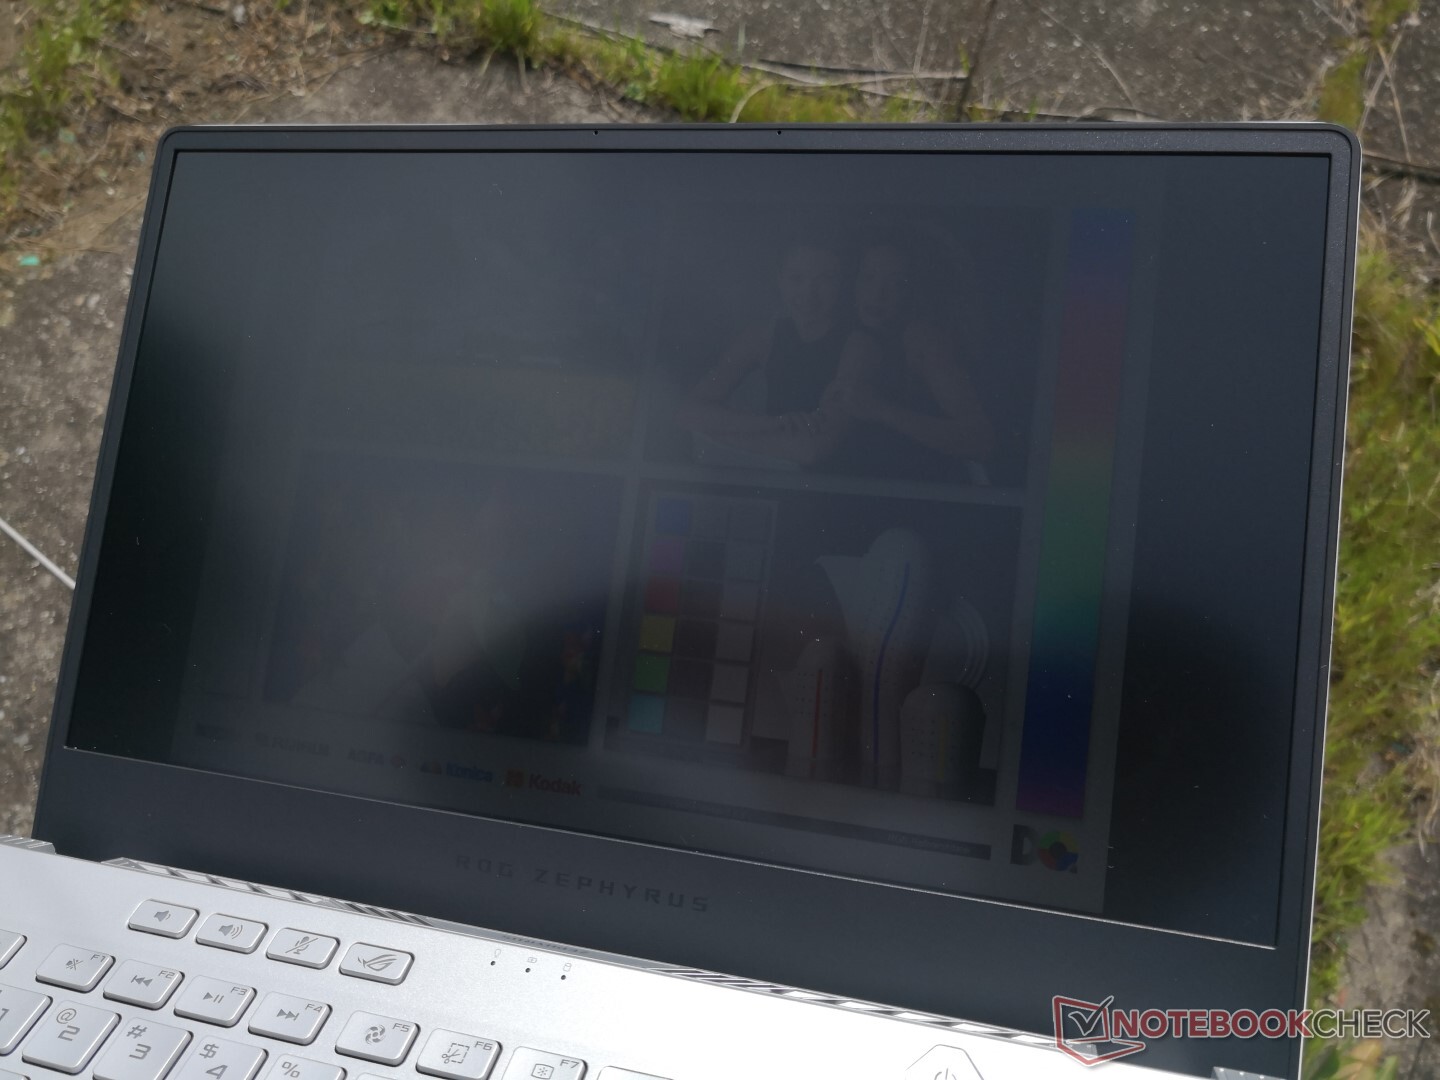
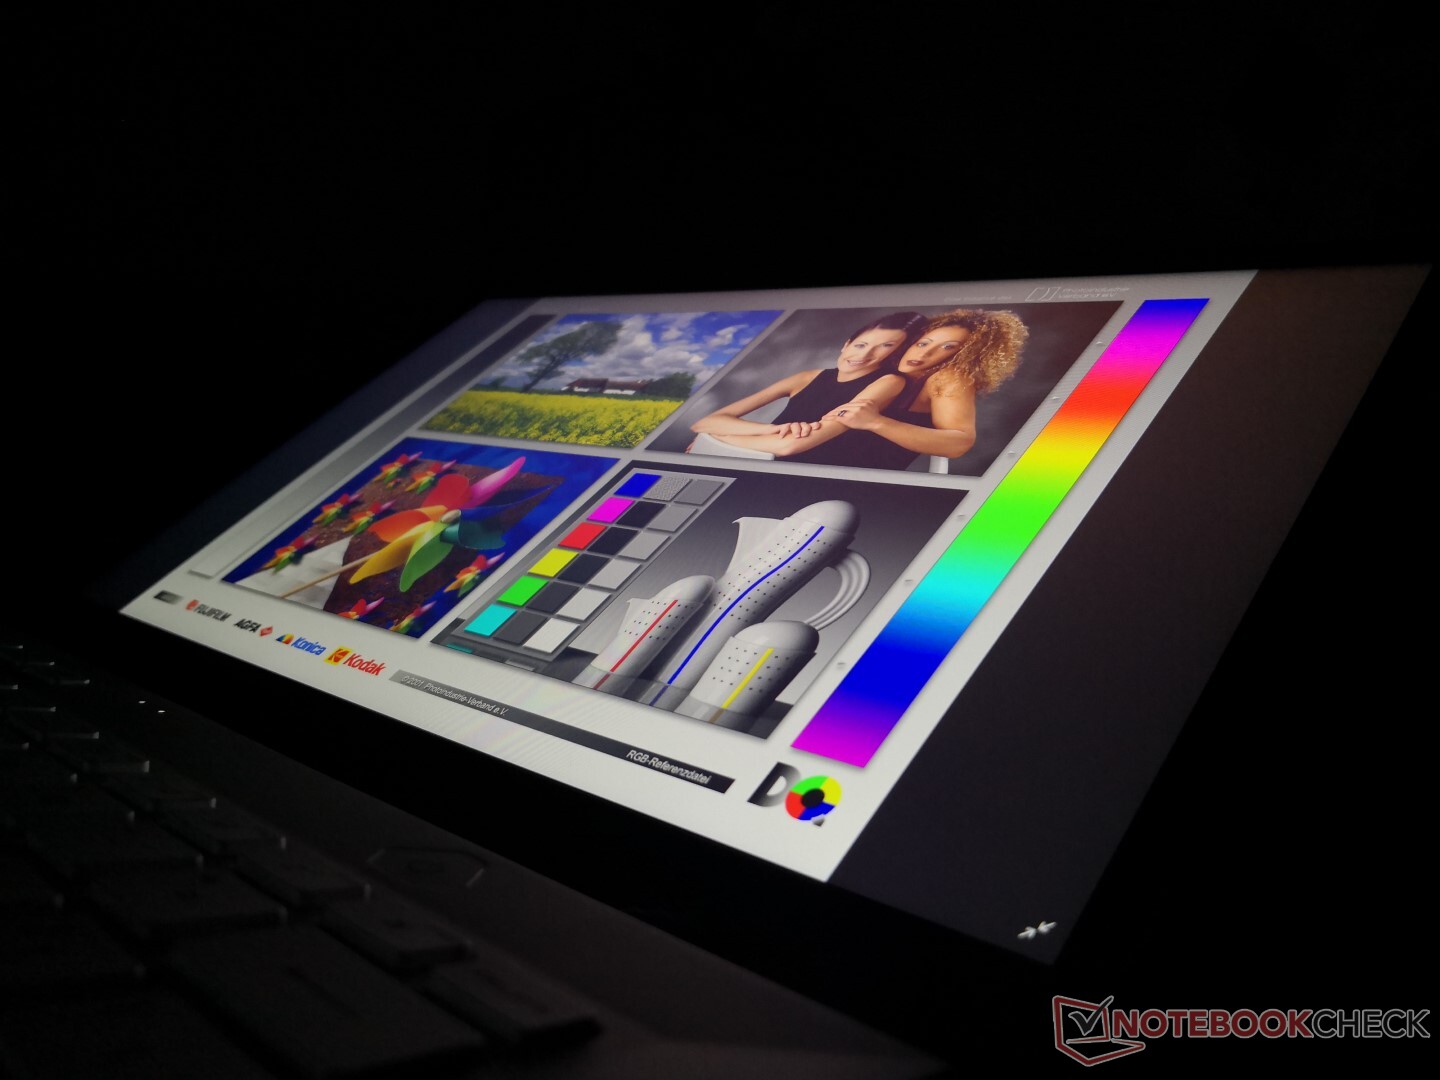
Outdoor visibility is poorer than most high-end Ultrabooks like the XPS 13, MacBook Pro, or Samsung NP900 which all have brighter displays. When compared to other Zephyrus laptops and gaming laptops in general, however, this is about normal. It's important to disable AMD Vari-Bright when using the laptop outdoors or else the maximum brightness will be artificially reduced from 322 nits to just 192 nits.
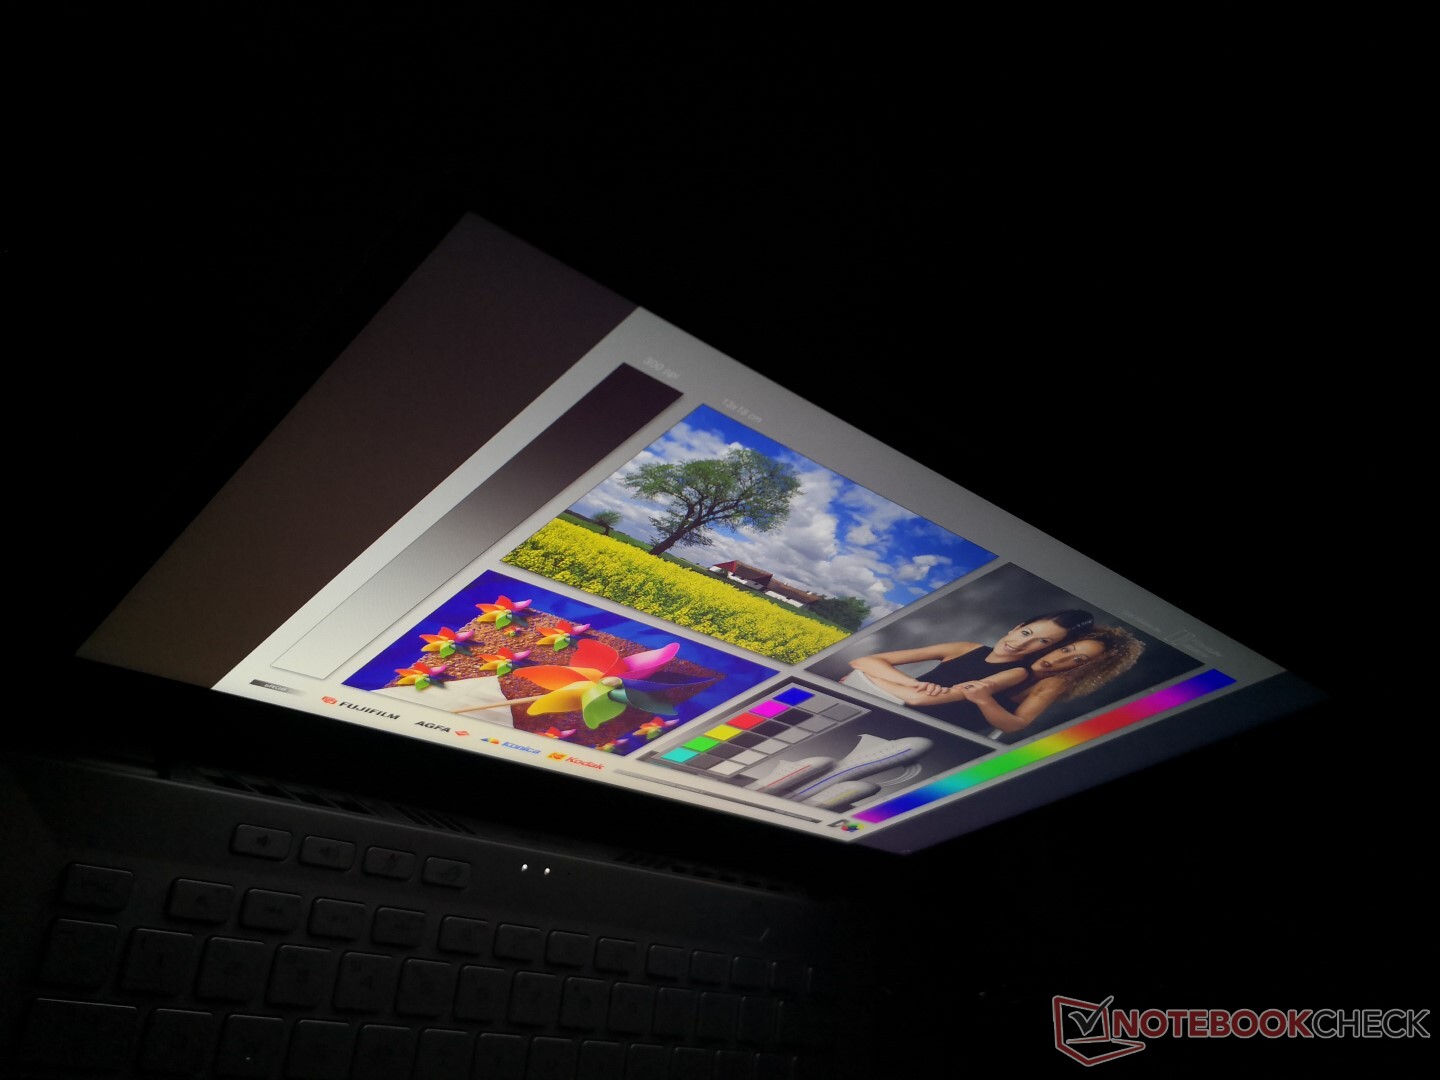
Viewing angles are typical of an IPS panel. Colors and contrast will degrade only if viewing from extreme and unrealistic angles.
Performance: More CPU Power than Most 17.3-inch Gaming Laptops
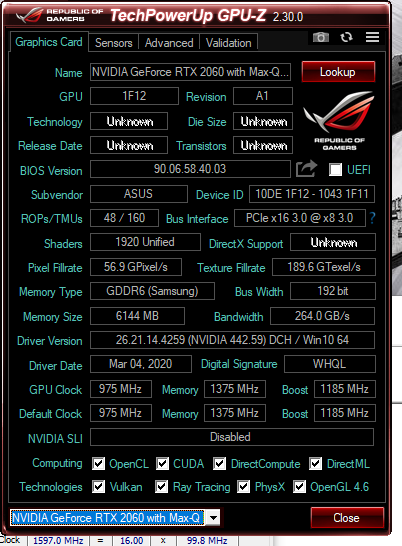
Subnotebooks capable of playing games are not uncommon. Models exist with Intel Core U-series CPUs and either GeForce MX or GeForce GTX Max-Q graphics at best due to the obvious size restrictions. The Zephyrus G14 is special in this regard as it packs an octa-core AMD Ryzen 9 4900HS CPU and a GeForce RTX 2060 Max-Q GPU both in a 14-inch form factor. It's an insane level of performance assuming that the cooling solution will be up to the task.
Users shouldn't confuse the Ryzen 9 4900HS and GeForce RTX 2060 Max-Q with the more demanding Ryzen 9 4900H and GeForce RTX 2060, respectively. It's likely that Asus couldn't use these higher-power versions due to the target small form factor. The Ryzen 9 4800H will probably debut on a 15.6-inch laptop or larger at a future date. Even so, AMD has claimed that the 35 W Ryzen 9 4900HS would only be about 10 percent slower than the full-fledged 45 W Ryzen 9 4900H.
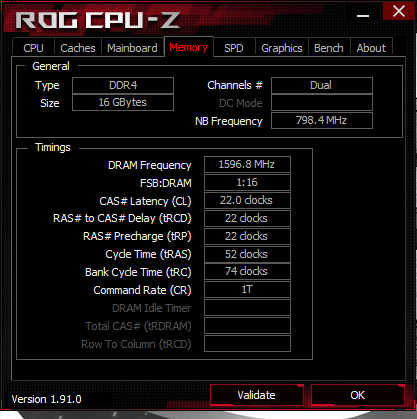
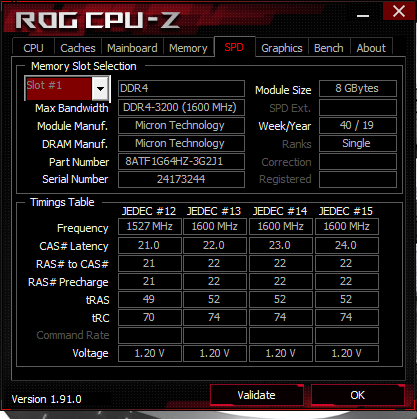
As for RAM, 8 GB comes soldered with one SODIMM slot available for up to 24 GB total. This setup is similar to other Zephyrus laptops including on the Zephyrus M or and Zephyrus G.
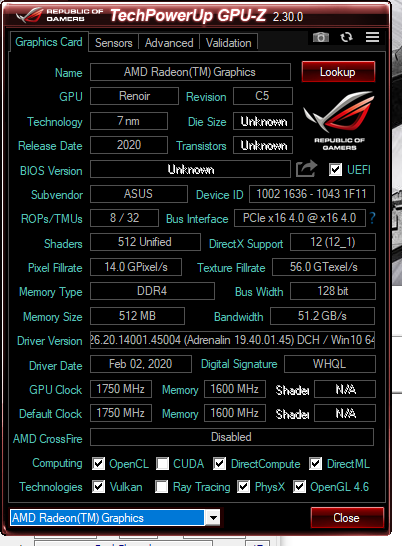
Nvidia Optimus comes standard for switching between the integrated Radeon GPU and the discrete GeForce RTX 2060 Max-Q GPU.
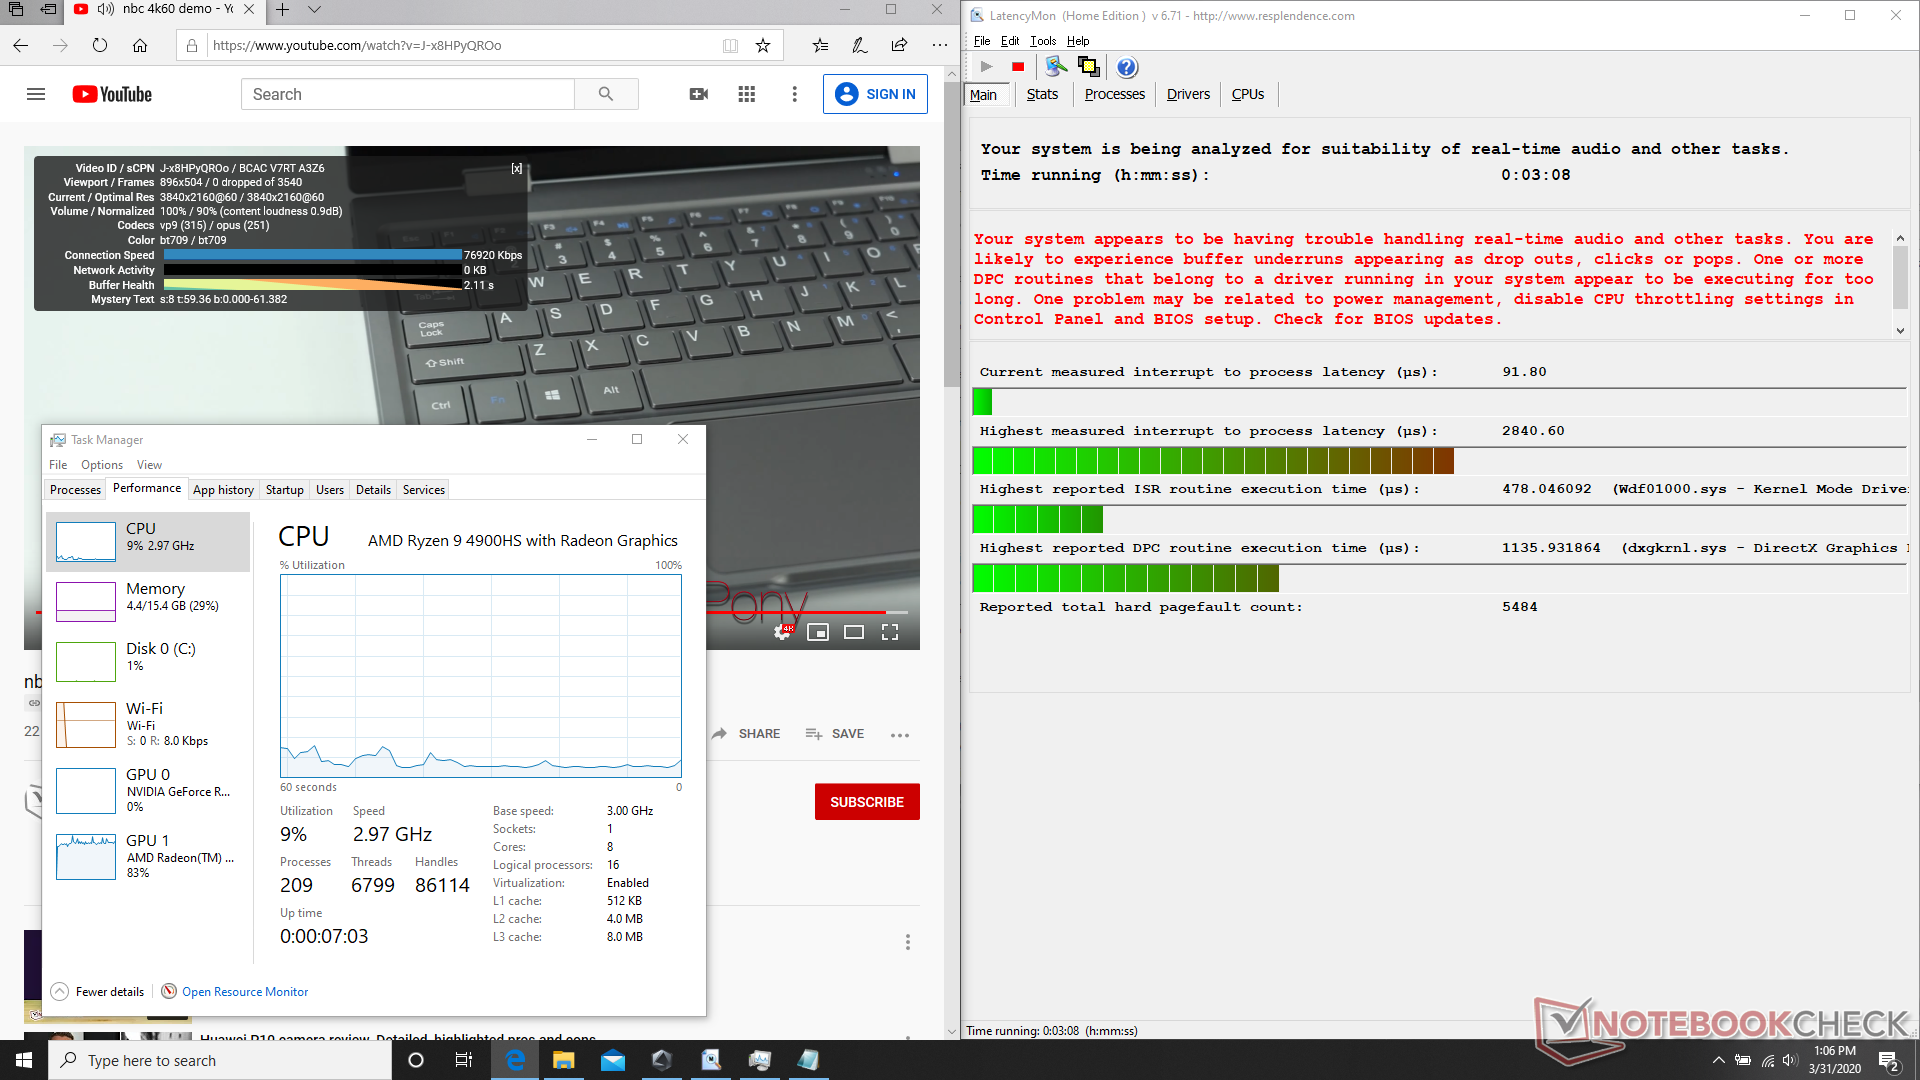
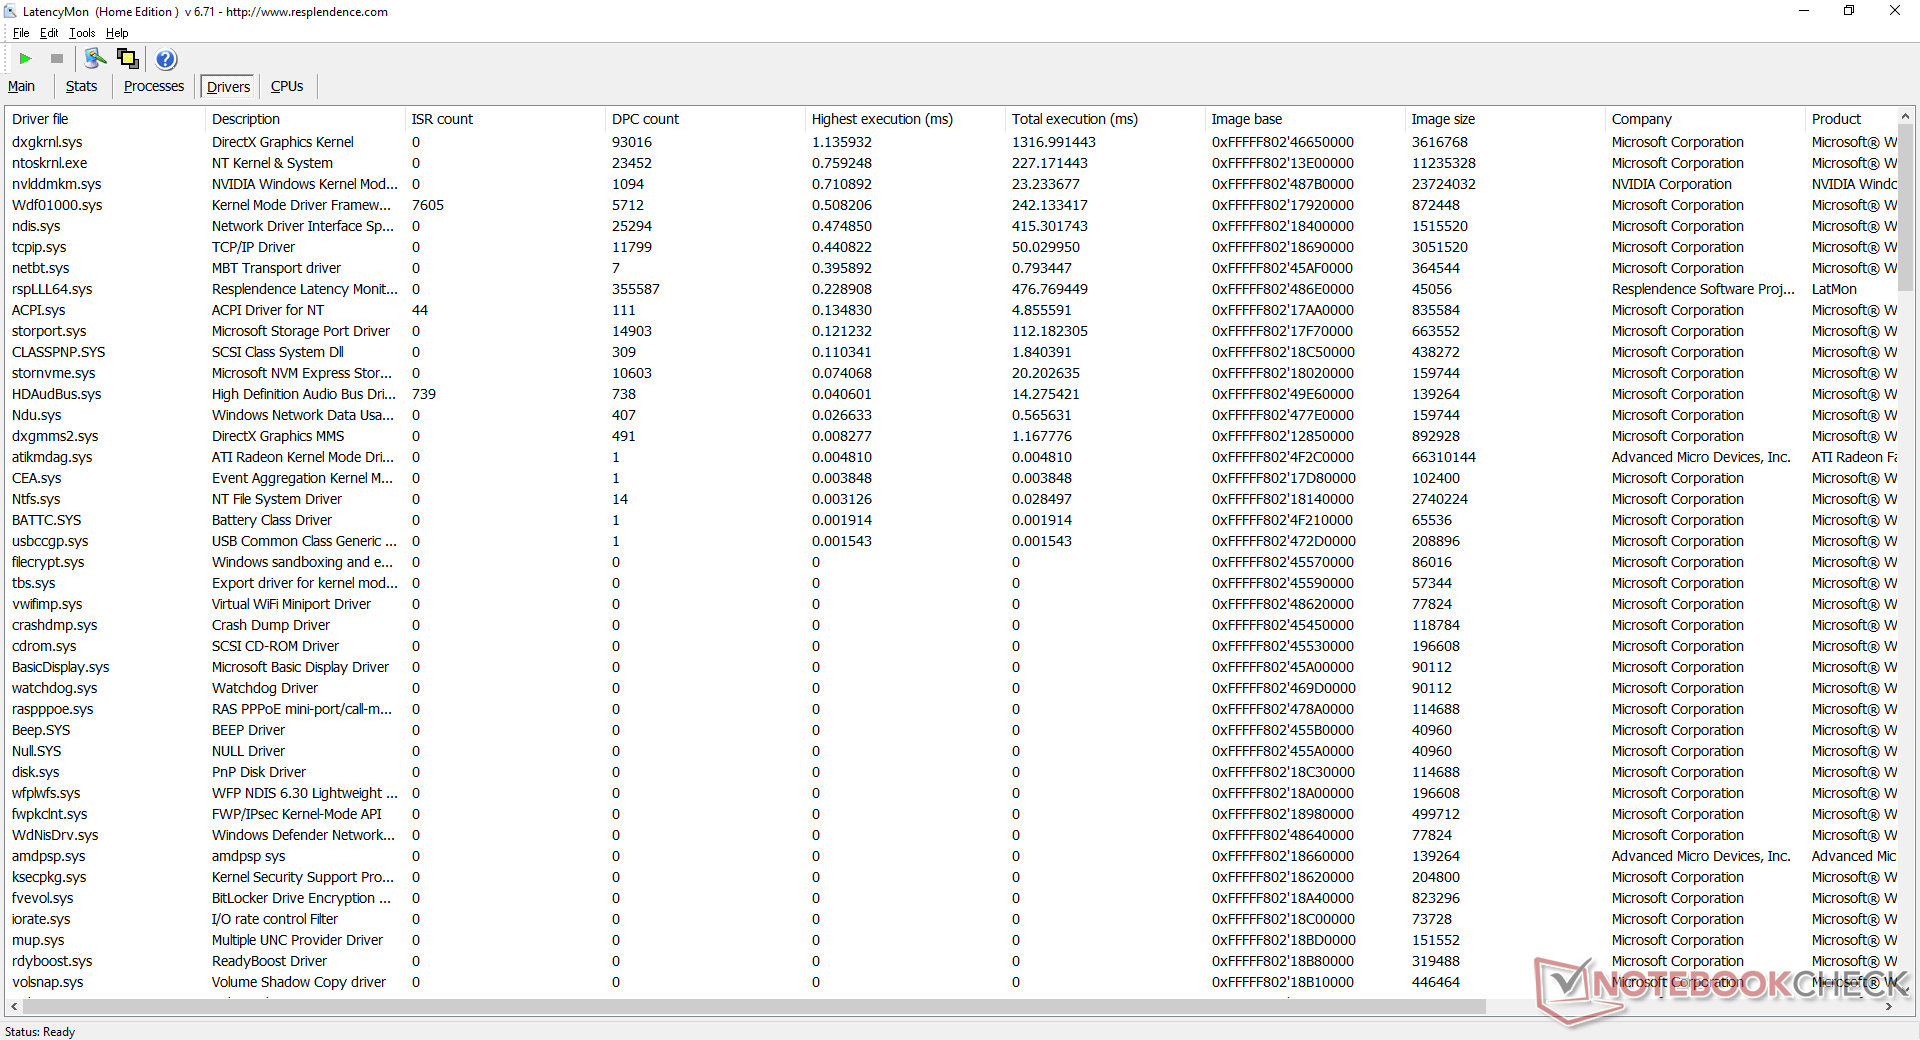
LatencyMon shows DPC latency issues when opening multiple tabs, playing 4K video, and running Prime95 in sequence.
Processor
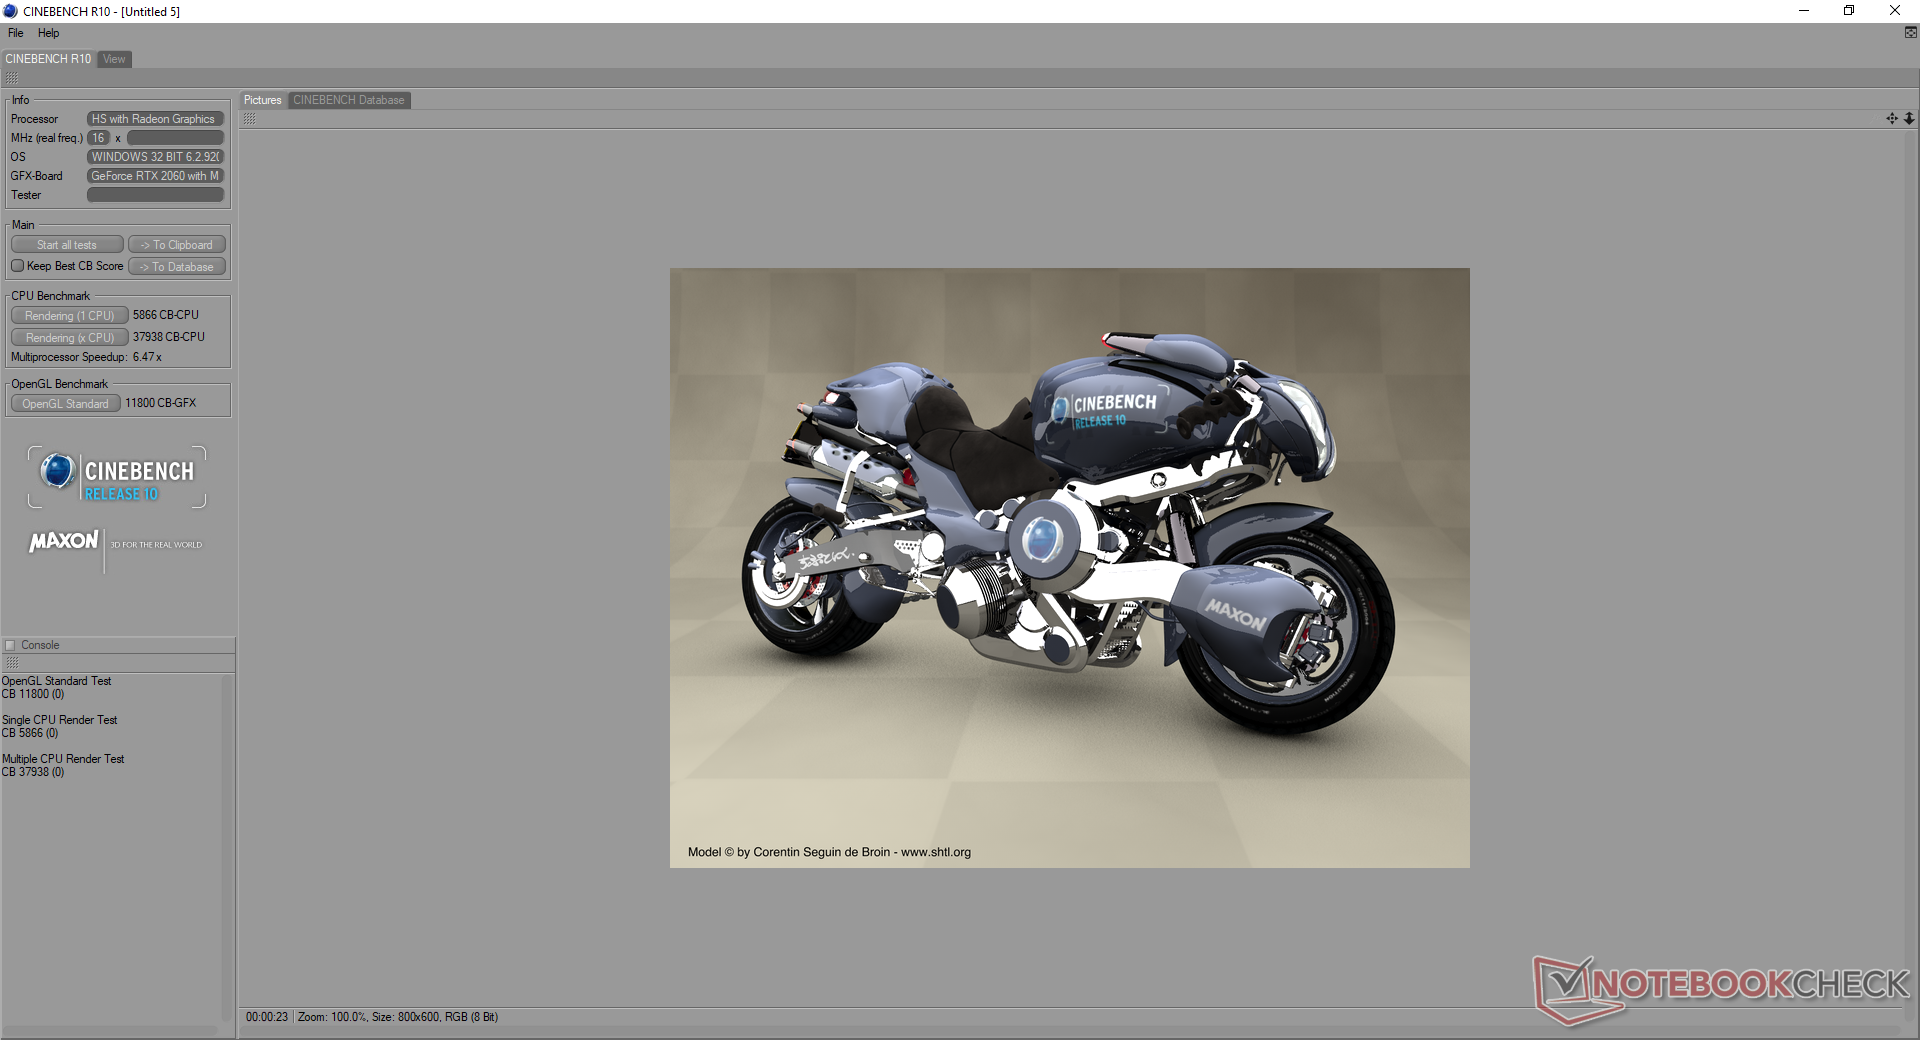
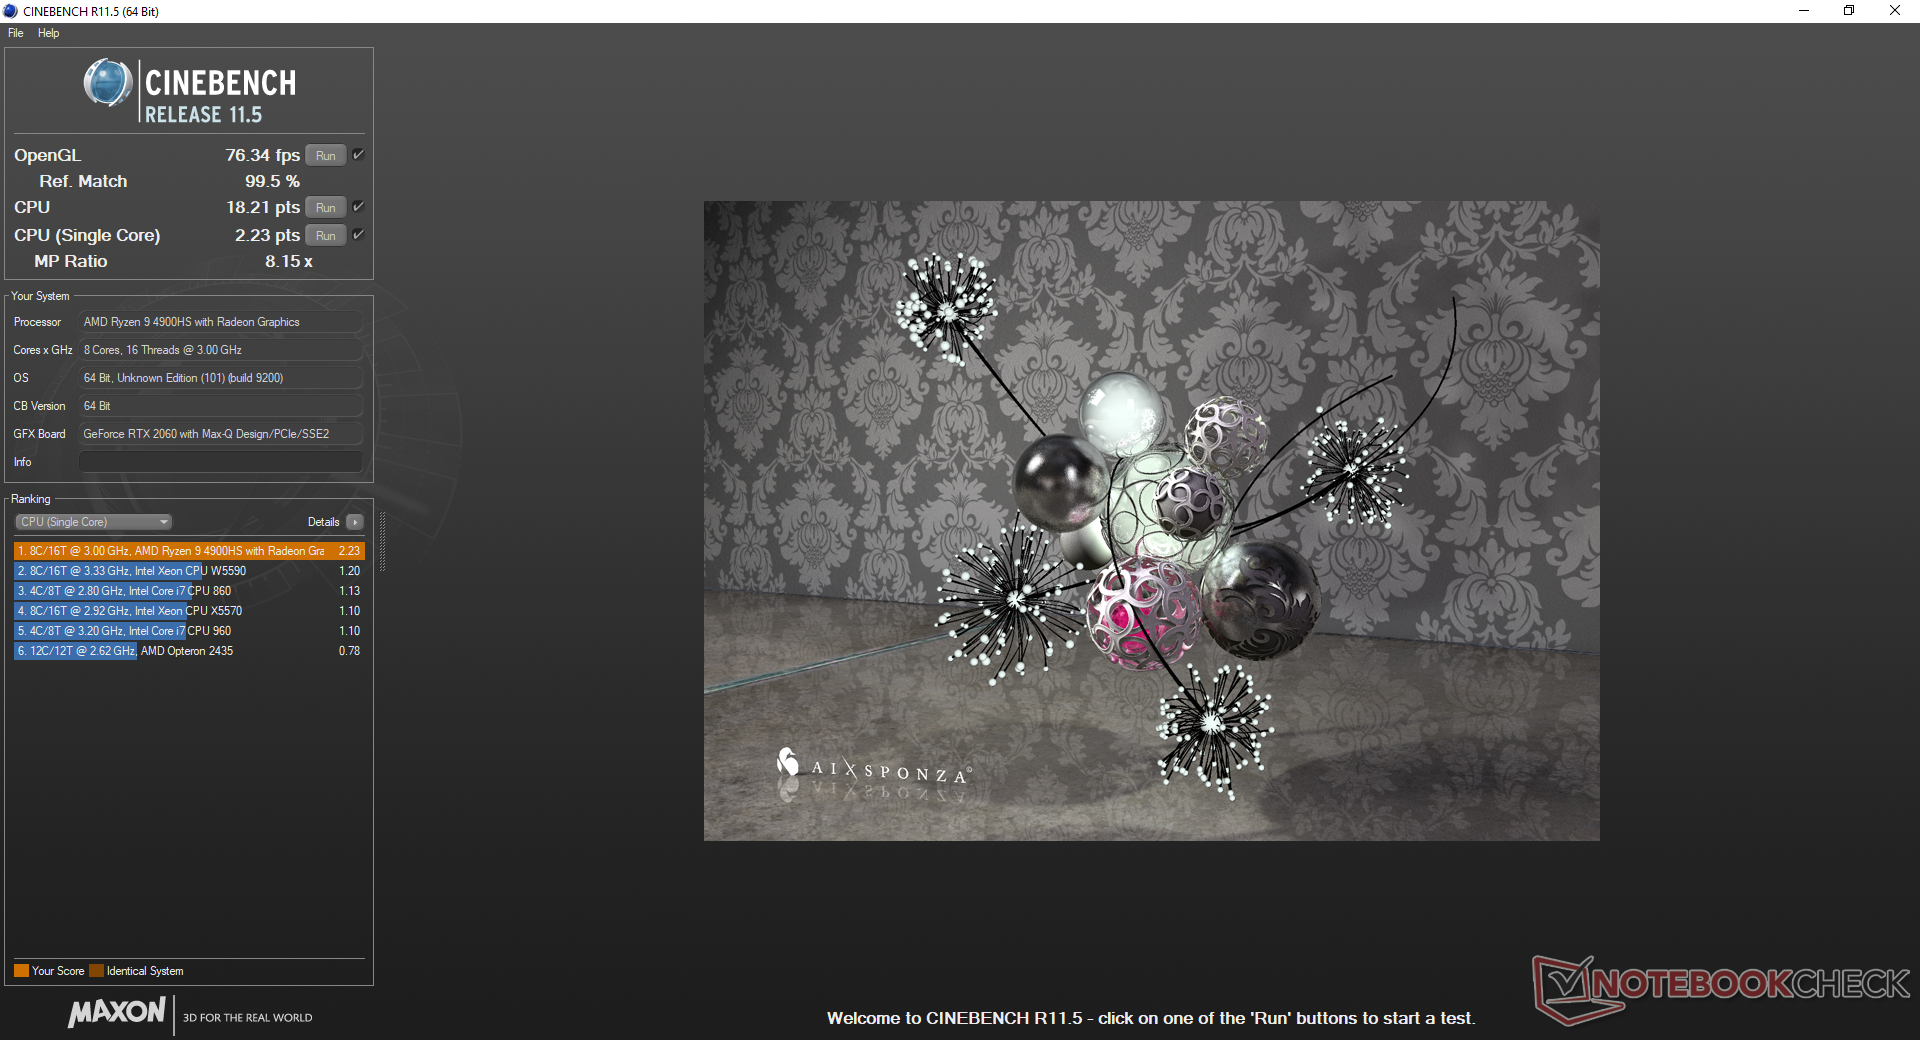
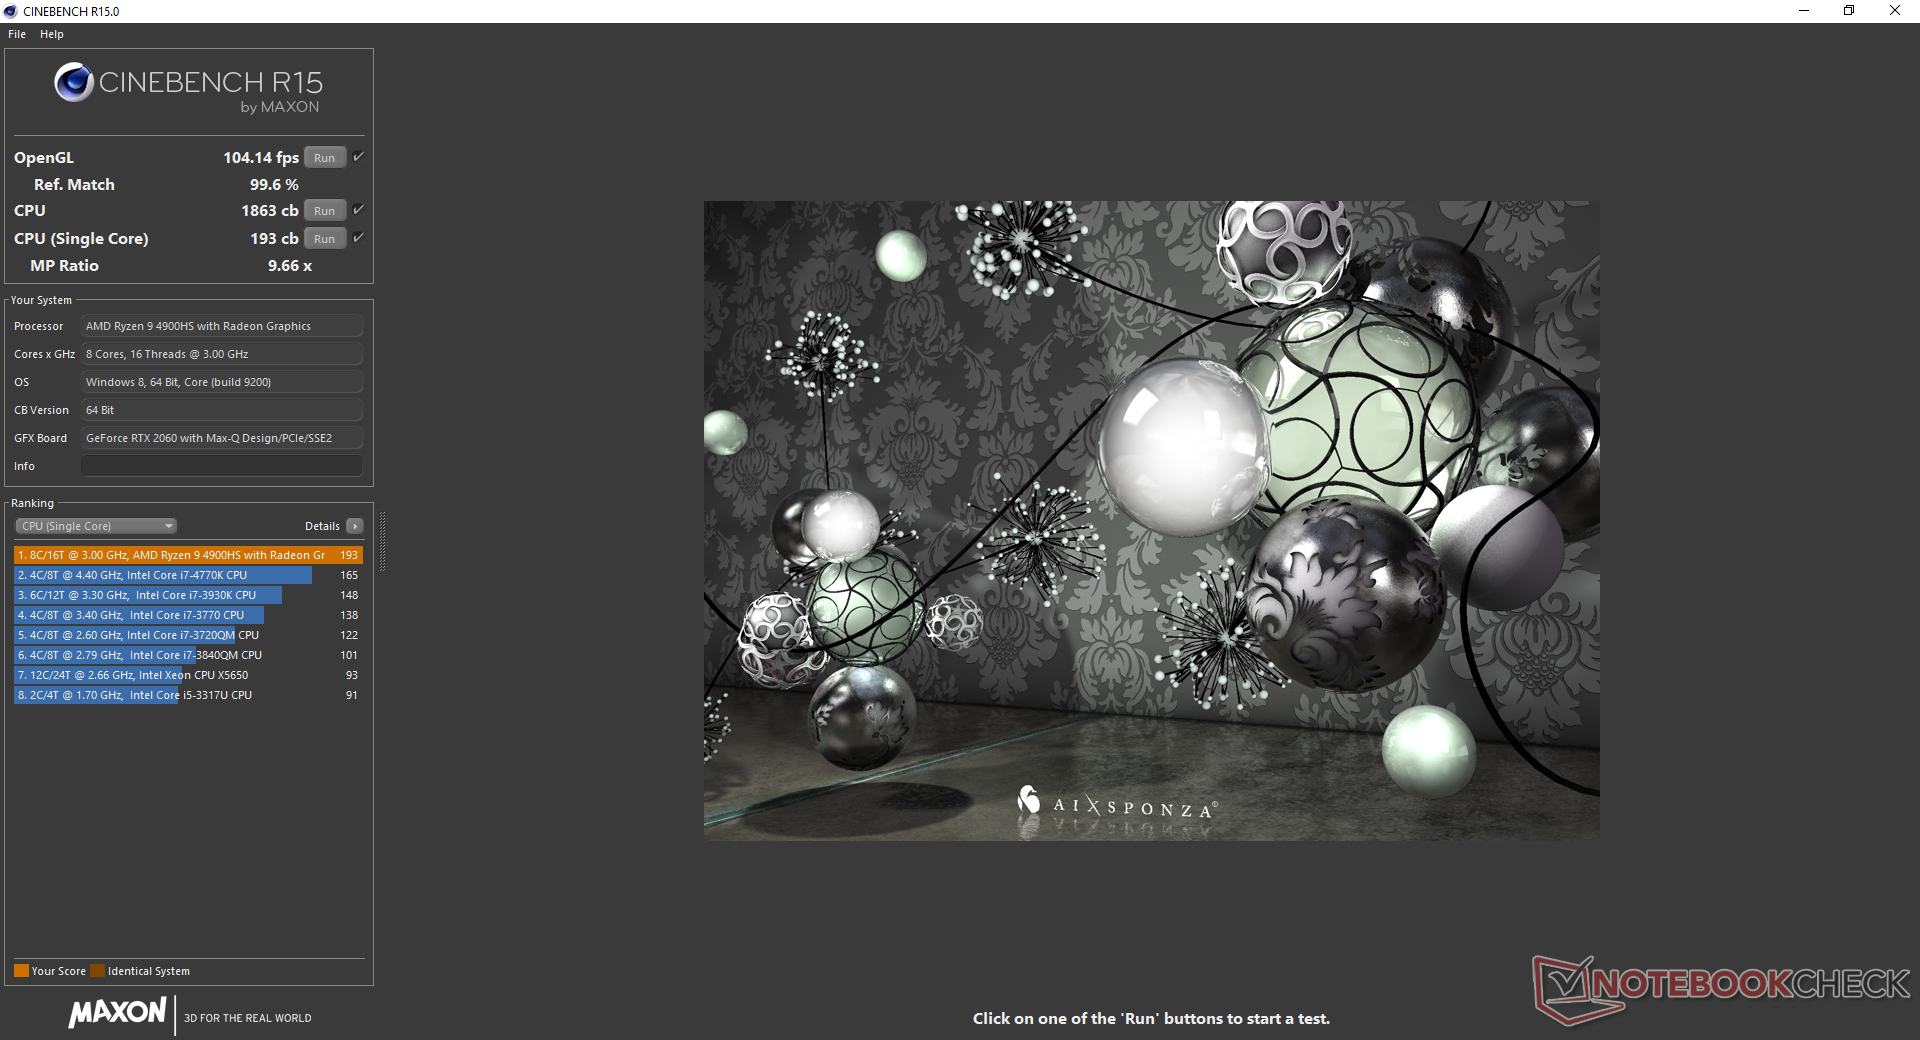
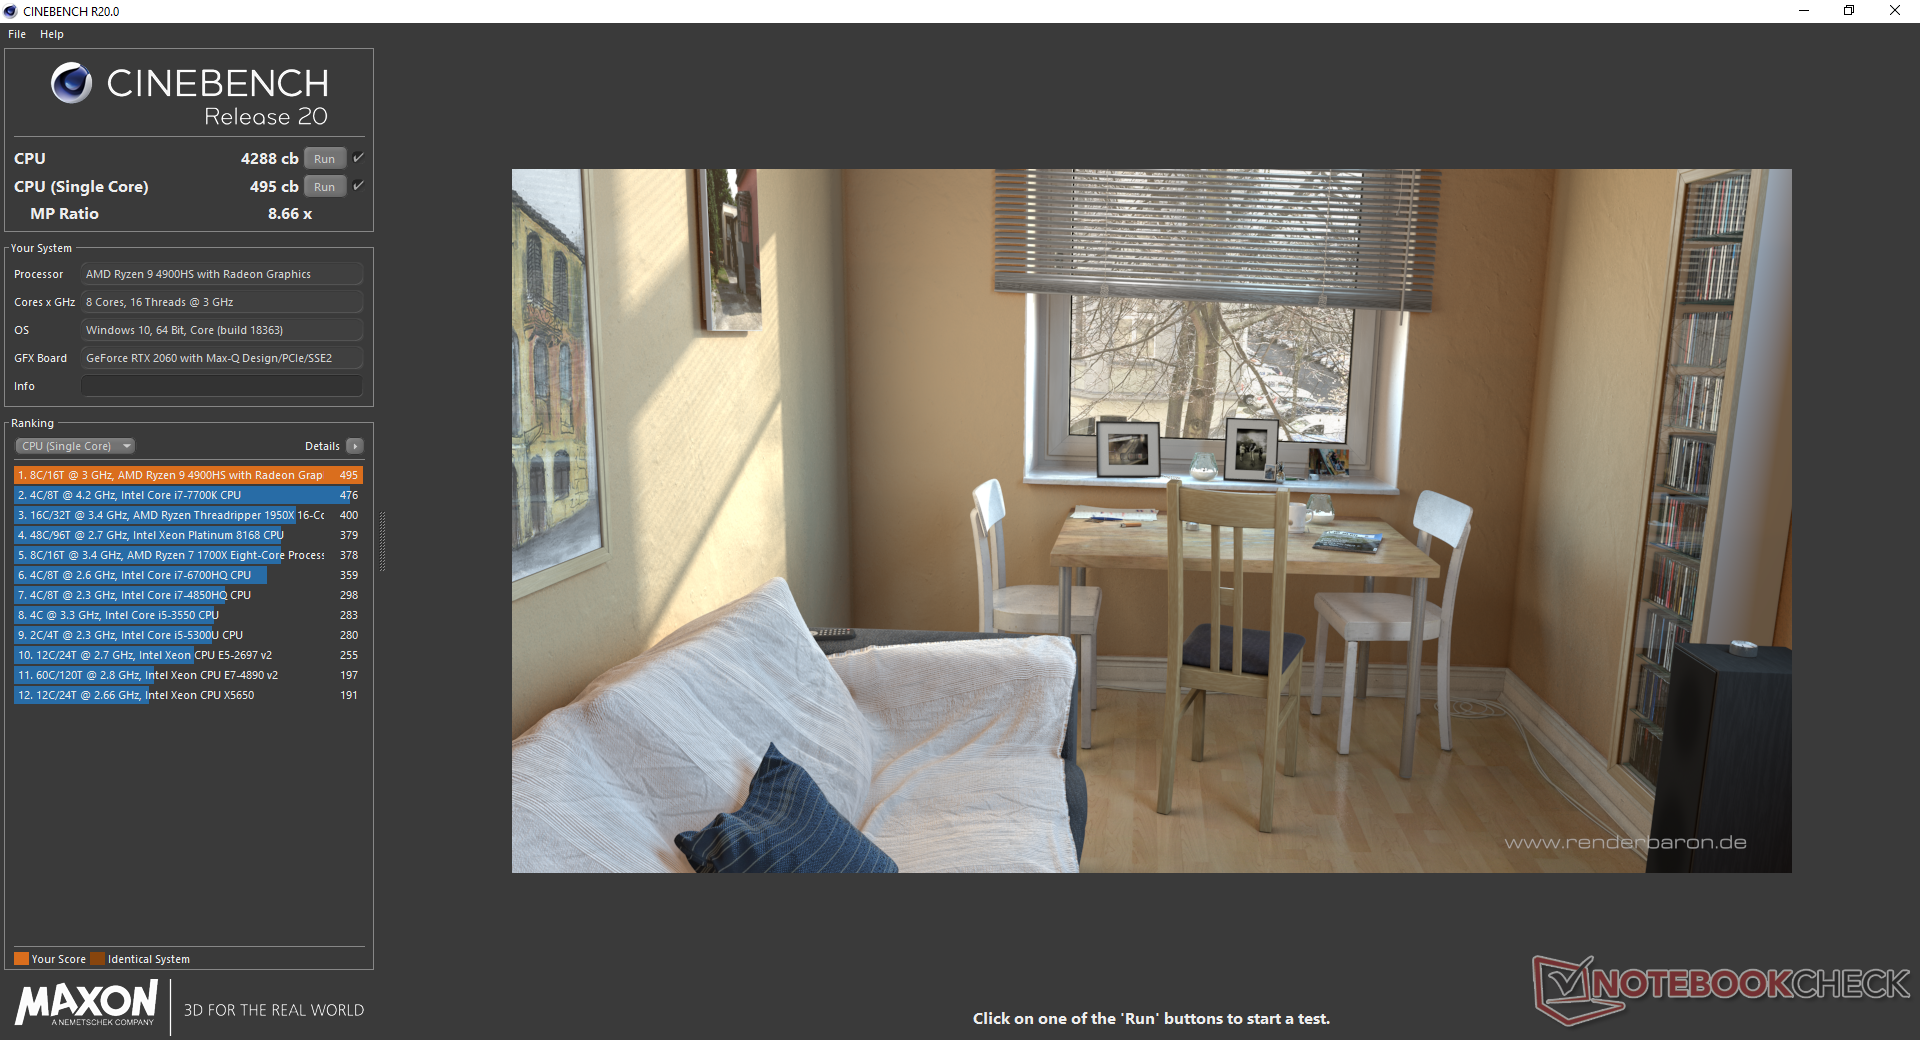
Both the Dell XPS 15 and Apple MacBook Pro 15 have left a sour taste in our mouth when it comes to packing octa-core H-series CPUs in super-thin designs. As such, we were half-expecting throttling issues from the Ryzen 9 4900HS when subjecting the Asus to extreme processing loads. To our surprise, however, the CPU holds up much better than anticipated. When running CineBench R15 Multi-Thread in a loop, the initial score of 1850 points would dip and stabilize to 1630 points for a performance deficit of about 12 percent over time. In comparison, the Core i9 in the XPS 15 and MSI GE75 9SG would drop by about 18 percent and 8 percent, respectively, when subjected to the same loop test.
Average multi-thread performance is also measurably faster on the Ryzen 9 4900HS when compared to the competing Core i9-9880H. CineBench benchmarks rank it 15 to 45 percent faster depending on which Core i9-9880H laptop is in question. Only the Alienware m15 R2 with its unlocked Core i9-9980HK can come close to our Ryzen 9 4900HS, but that particular system must run significantly warmer and louder to do so. Combine this with the decent performance sustainability mentioned above and the efficiency advantages of 7 nm Ryzen become obvious.
Laptops closer in size to the Zephyrus G14 like the Razer Blade 15, MSI GS65, or Prestige 14 tend to come with hexa-core Core i7-9750H or i7-10710U options only. In this scenario, the Asus is clearly a class above in raw multi-thread performance by significant margins as shown by our graphs below. Razer, MSI, and others are set to respond with ultra-thin Comet Lake-H laptops in the coming months.
See our dedicated page on the Ryzen 9 4900HS for more technical information and benchmark comparisons.
| Cinebench R11.5 | |
| CPU Single 64Bit | |
| Corsair One i160 | |
| AMD Radeon RX Vega 64 | |
| Asus Zephyrus G14 GA401IV | |
| MSI GE75 9SG | |
| CPU Multi 64Bit | |
| AMD Radeon RX Vega 64 | |
| Corsair One i160 | |
| MSI GE75 9SG | |
| Asus Zephyrus G14 GA401IV | |
| wPrime 2.10 - 1024m | |
| MSI GE75 9SG | |
| Corsair One i160 | |
| Asus Zephyrus G14 GA401IV | |
| AMD Radeon RX Vega 64 | |
* ... smaller is better
System Performance
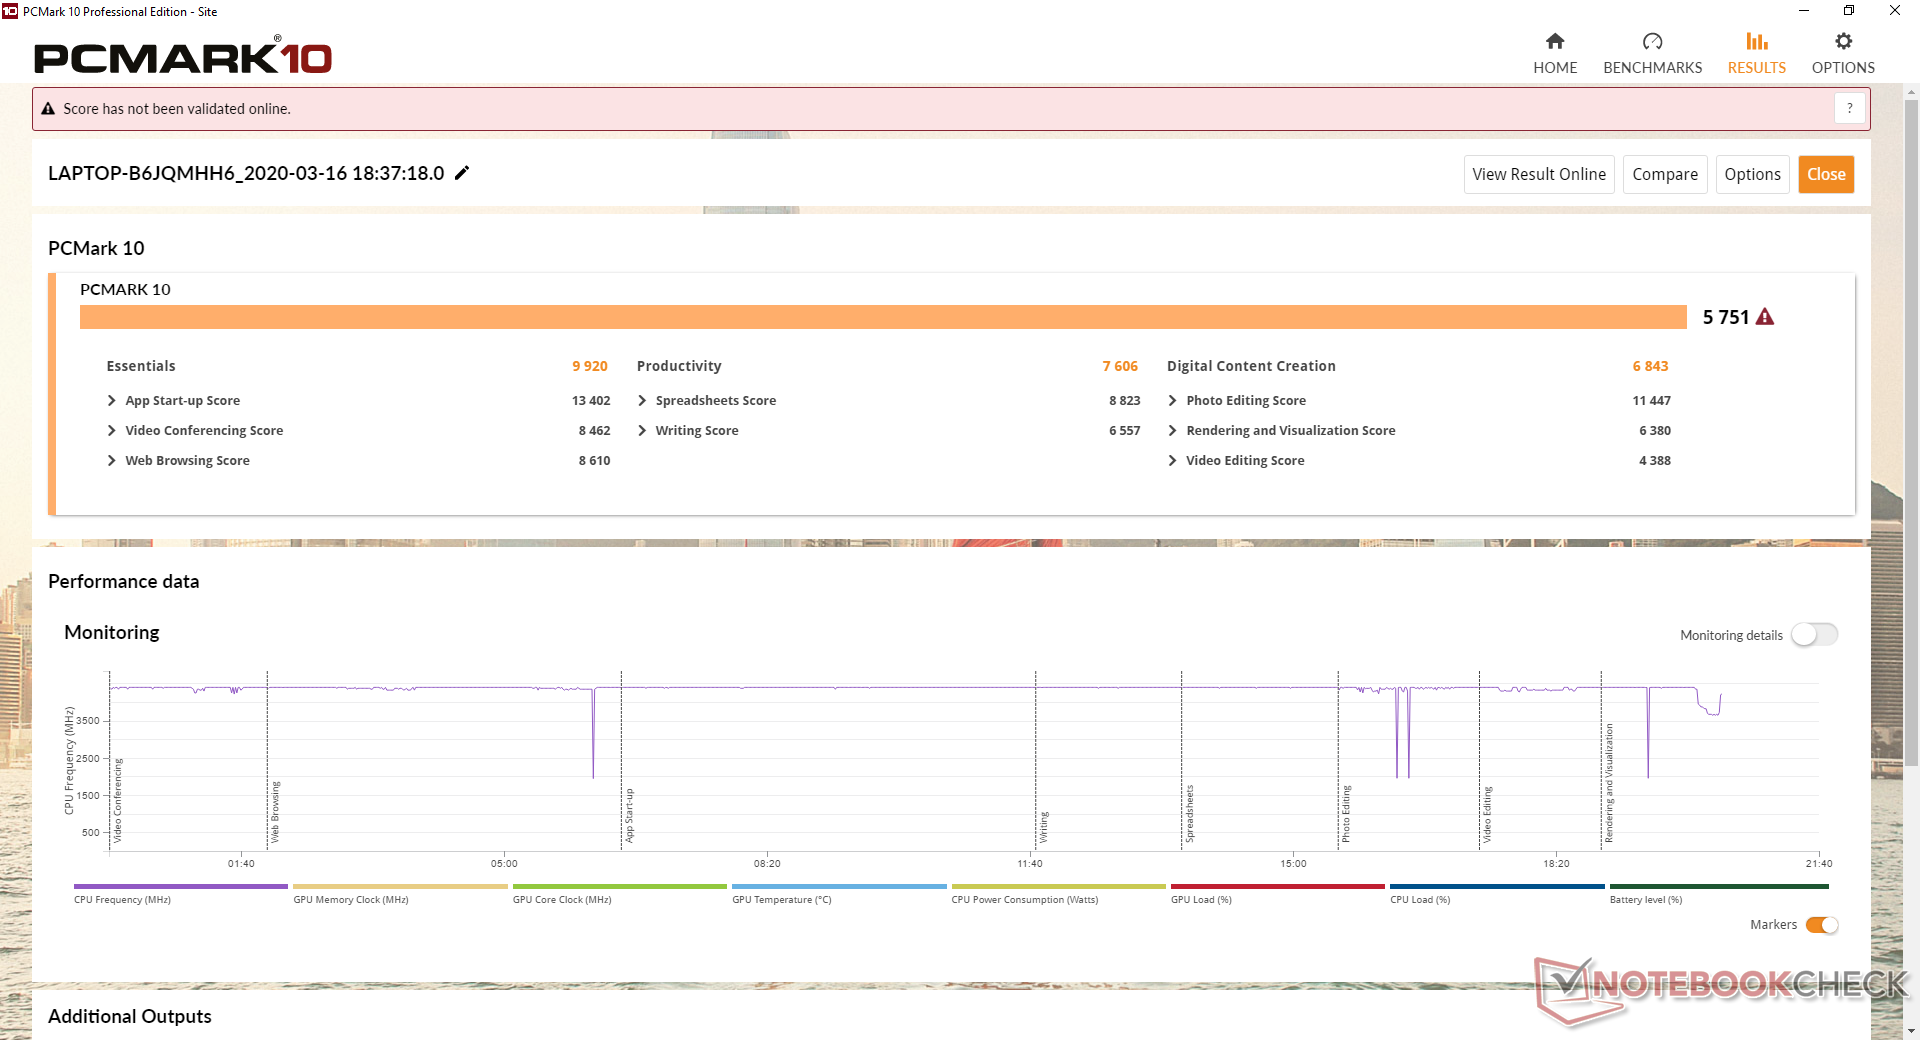
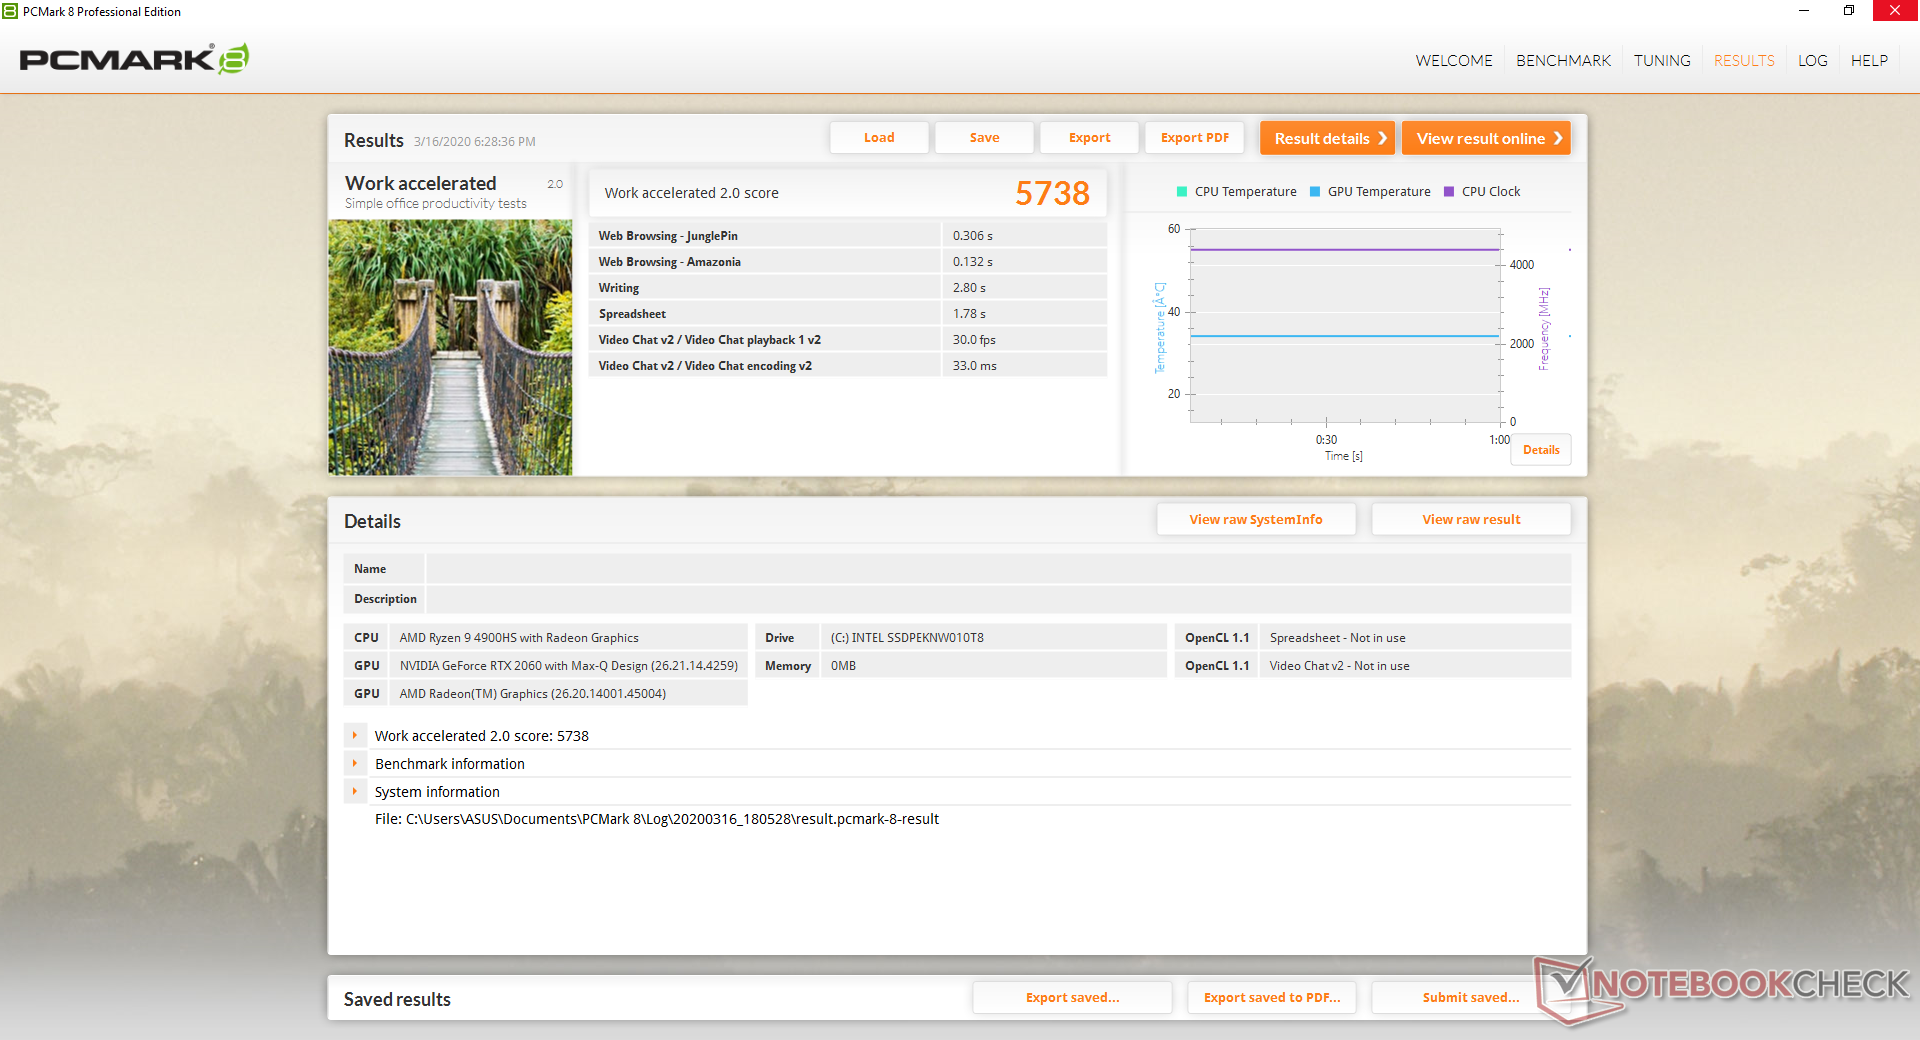
PCMark benchmarks rank our AMD-Nvidia Zephyrus system in line with other Intel-Nvidia powered gaming laptops and well ahead of the all-AMD MSI Alpha 15. The Digital Content Creation scores remain questionable since UL has yet to incorporate discrete GPUs in this particular benchmark.
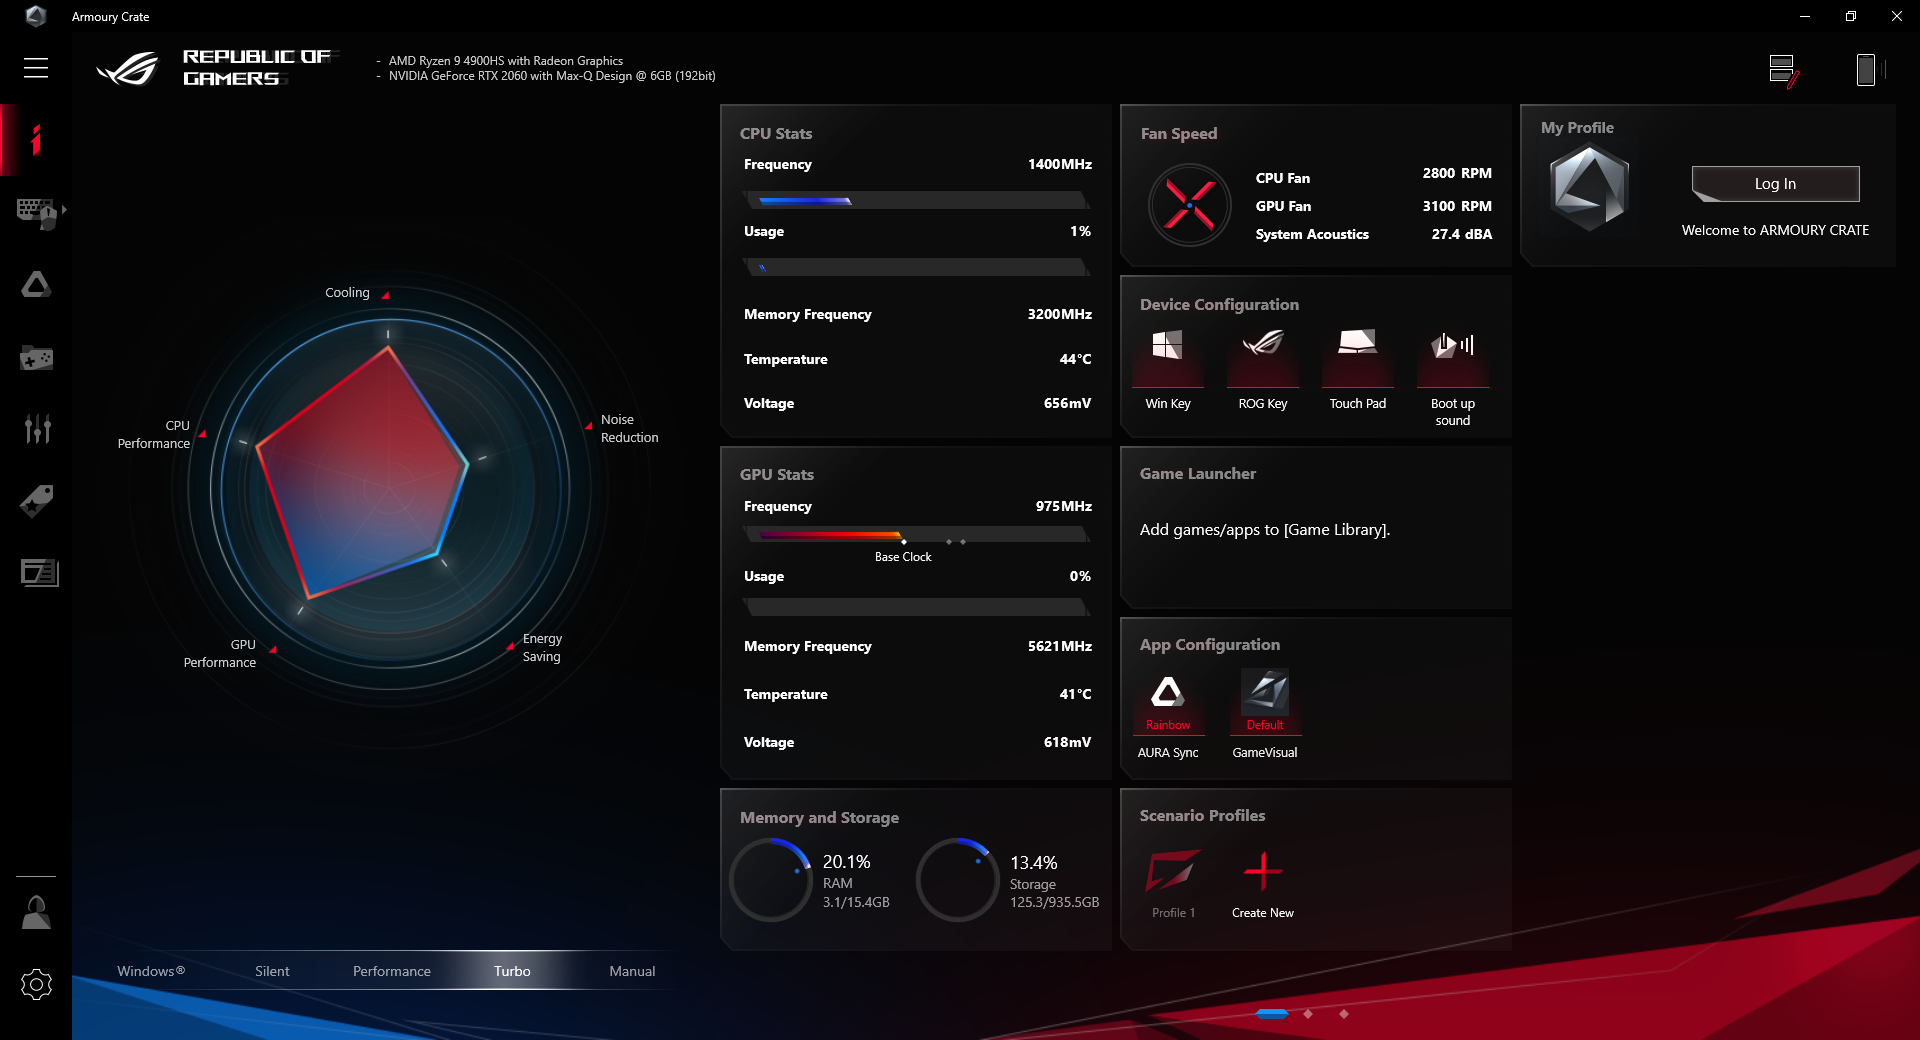
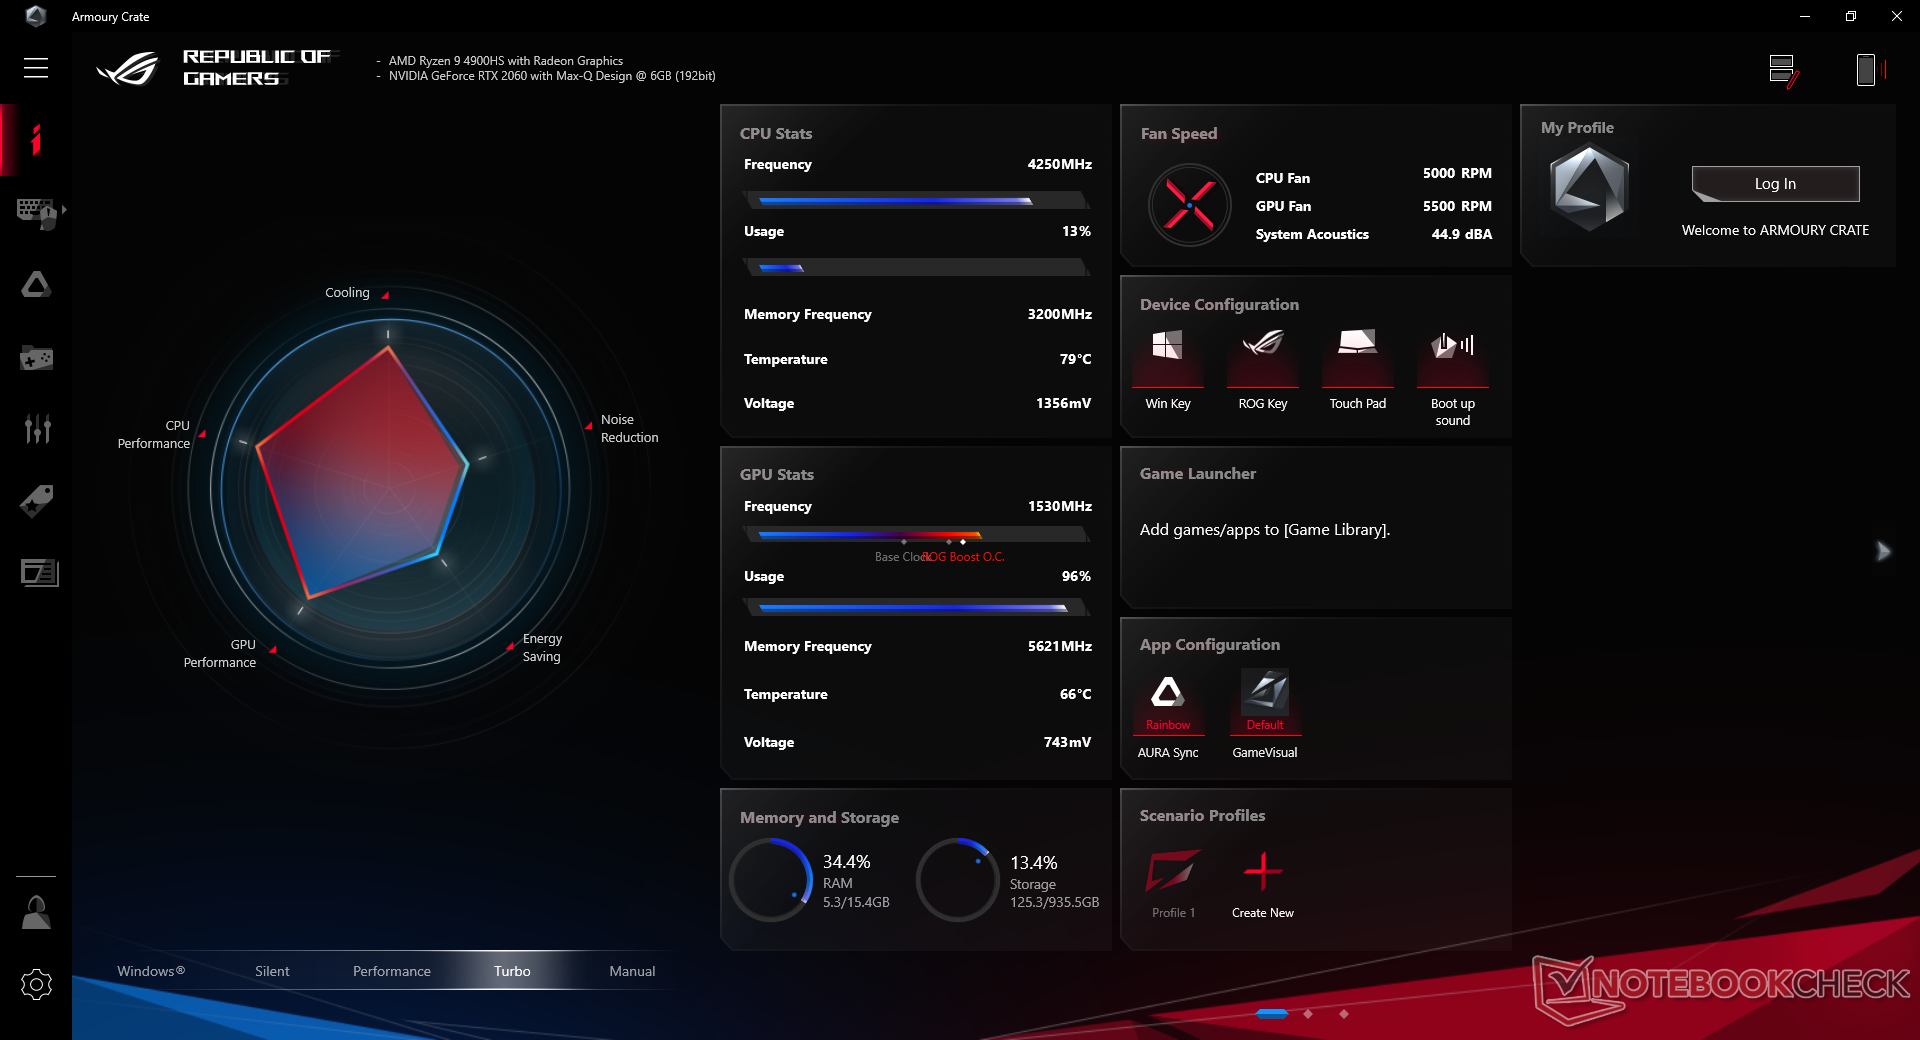
We experienced no software or hardware issues during our time with the test unit. Nonetheless, the constantly shifting power profiles between Windows and Armoury Crate can be annoying to work with as explained here.
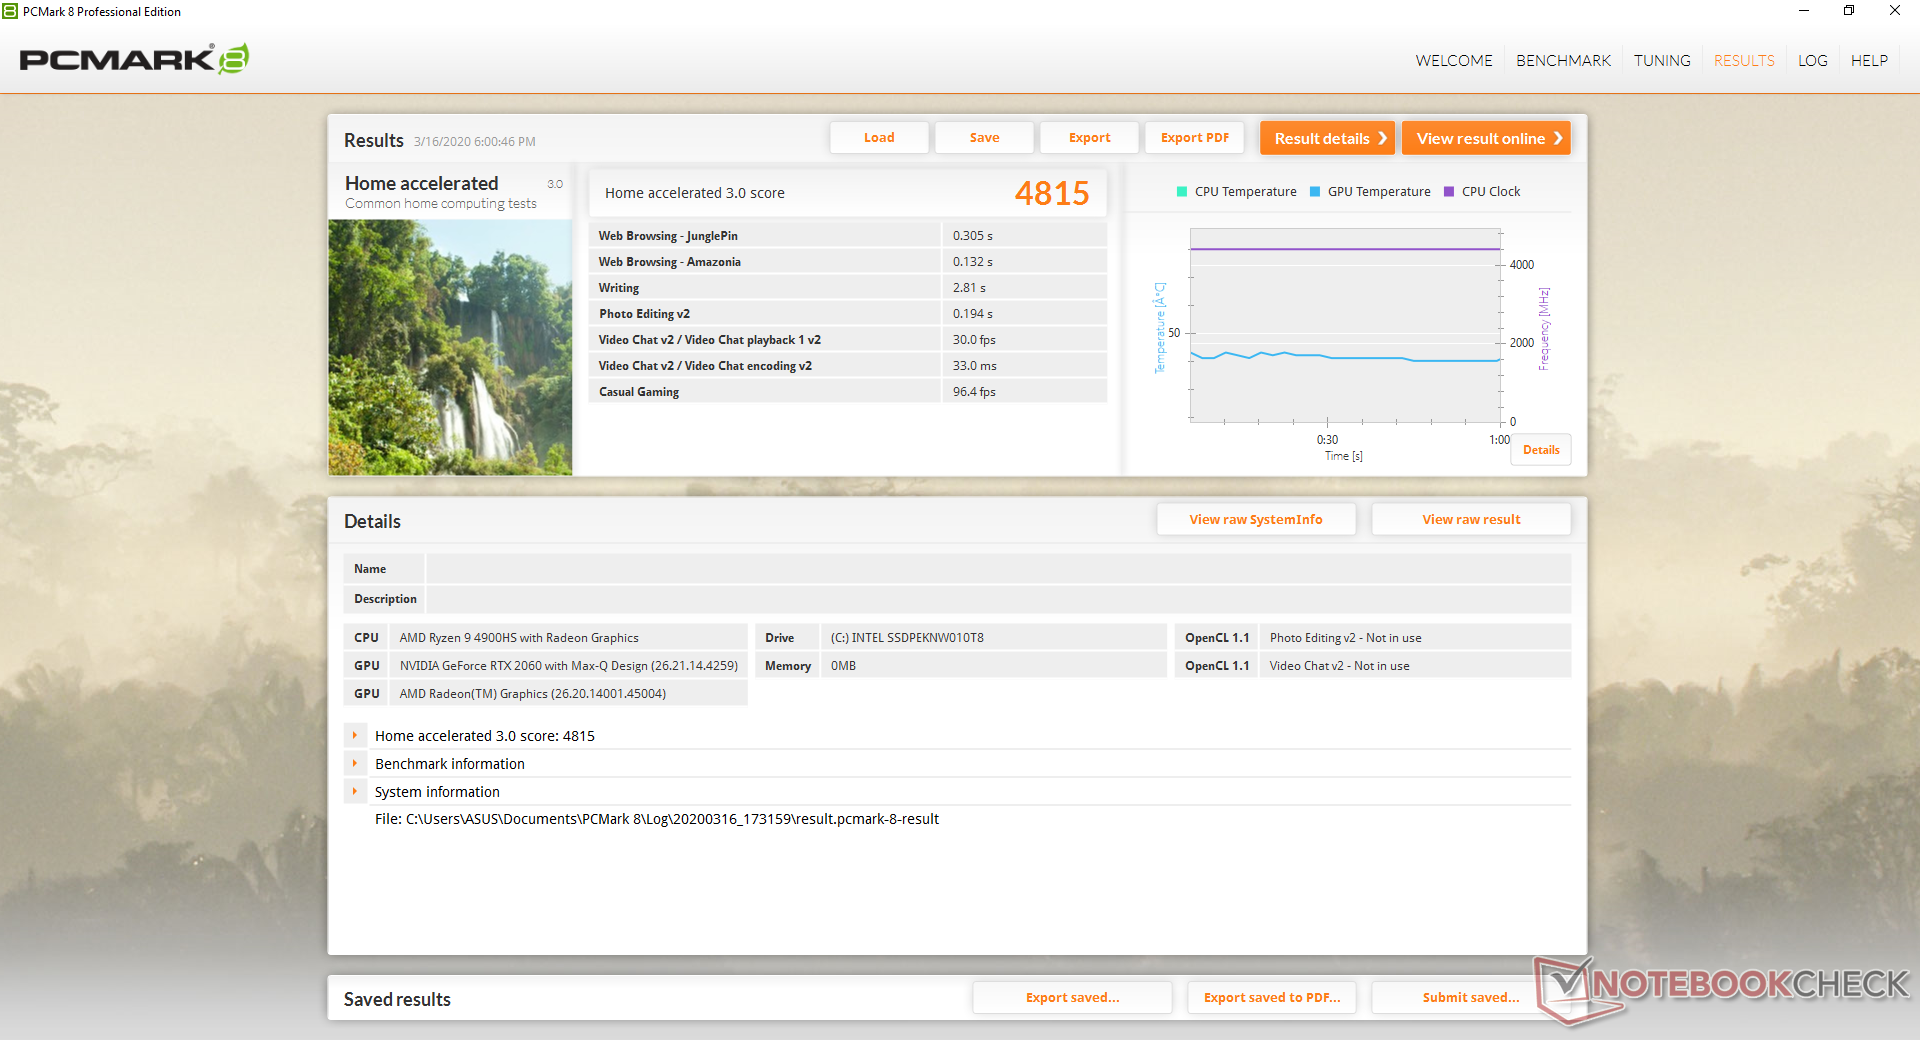
| PCMark 8 Home Score Accelerated v2 | 4815 points | |
| PCMark 8 Work Score Accelerated v2 | 5738 points | |
| PCMark 10 Score | 5751 points | |
Help | ||
Storage Devices: Just One M.2 2280 Slot
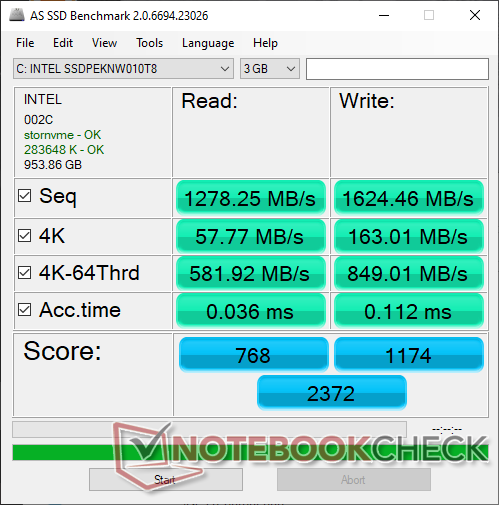
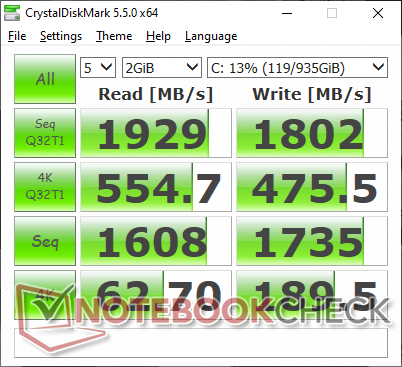
Unsurprisingly, there are no secondary internal options due to size constraints. Our test unit comes with an Intel 660p SSD which Asus also uses for its Zephyrus M. Transfer rates are much faster than the SK Hynix BC501 while being behind the Samsing PM981 as found on almost all Razer Blade systems. The Intel 660p will still be more than sufficient for the target audience. We recommend investing in a higher capacity drive instead of a faster drive if budget is tight.
See our table of SSDs and HDDs for more benchmark comparisons.
| Asus Zephyrus G14 GA401IV Intel SSD 660p 1TB SSDPEKNW010T8 | Asus ROG Zephyrus M15 GU502GU-XB74 Intel SSD 660p SSDPEKNW512G8 | MSI GS65 Stealth 9SG Samsung SSD PM981 MZVLB512HAJQ | Alienware m15 R2 P87F 2x Toshiba XG6 KXG60ZNV512G (RAID 0) | MSI Prestige 14 A10SC-009 Samsung SSD PM981 MZVLB1T0HALR | |
|---|---|---|---|---|---|
| AS SSD | -30% | 47% | 23% | 60% | |
| Seq Read (MB/s) | 1278 | 1221 -4% | 2005 57% | 1925 51% | 2300 80% |
| Seq Write (MB/s) | 1624 | 911 -44% | 1580 -3% | 2371 46% | 2051 26% |
| 4K Read (MB/s) | 57.8 | 48.24 -17% | 49.33 -15% | 37.2 -36% | 46.23 -20% |
| 4K Write (MB/s) | 163 | 99.2 -39% | 103.8 -36% | 108.9 -33% | 84.6 -48% |
| 4K-64 Read (MB/s) | 582 | 321.4 -45% | 1241 113% | 1177 102% | 1552 167% |
| 4K-64 Write (MB/s) | 849 | 744 -12% | 1730 104% | 1135 34% | 1789 111% |
| Access Time Read * (ms) | 0.036 | 0.071 -97% | 0.054 -50% | 0.065 -81% | 0.049 -36% |
| Access Time Write * (ms) | 0.112 | 0.139 -24% | 0.036 68% | 0.108 4% | 0.045 60% |
| Score Read (Points) | 768 | 492 -36% | 1490 94% | 1407 83% | 1828 138% |
| Score Write (Points) | 1174 | 934 -20% | 1991 70% | 1481 26% | 2079 77% |
| Score Total (Points) | 2372 | 1681 -29% | 4230 78% | 3633 53% | 4831 104% |
| Copy ISO MB/s (MB/s) | 1660 | 906 -45% | 3025 82% | 2073 25% | |
| Copy Program MB/s (MB/s) | 443.5 | 486.6 10% | 713 61% | 576 30% | |
| Copy Game MB/s (MB/s) | 1162 | 952 -18% | 1554 34% | 1426 23% | |
| CrystalDiskMark 5.2 / 6 | -19% | -3% | 20% | 7% | |
| Write 4K (MB/s) | 189.5 | 156 -18% | 91.3 -52% | 108.8 -43% | 163.8 -14% |
| Read 4K (MB/s) | 62.7 | 60.7 -3% | 40.73 -35% | 45.41 -28% | 48.6 -22% |
| Write Seq (MB/s) | 1735 | 968 -44% | 1915 10% | 2467 42% | 2269 31% |
| Read Seq (MB/s) | 1608 | 1619 1% | 2051 28% | 2456 53% | 1963 22% |
| Write 4K Q32T1 (MB/s) | 475.5 | 485 2% | 308.3 -35% | 532 12% | 289.8 -39% |
| Read 4K Q32T1 (MB/s) | 555 | 337.3 -39% | 417.4 -25% | 590 6% | 373.6 -33% |
| Write Seq Q32T1 (MB/s) | 1802 | 969 -46% | 1922 7% | 2801 55% | 2395 33% |
| Read Seq Q32T1 (MB/s) | 1929 | 1825 -5% | 3395 76% | 3172 64% | 3479 80% |
| Total Average (Program / Settings) | -25% /
-26% | 22% /
29% | 22% /
22% | 34% /
38% |
* ... smaller is better

GPU Performance: GeForce RTX 2060 Max-Q Debut
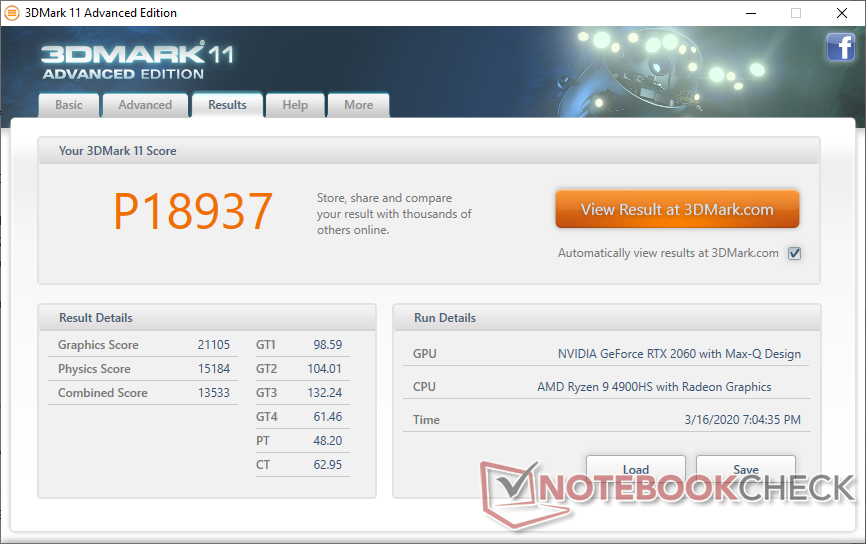
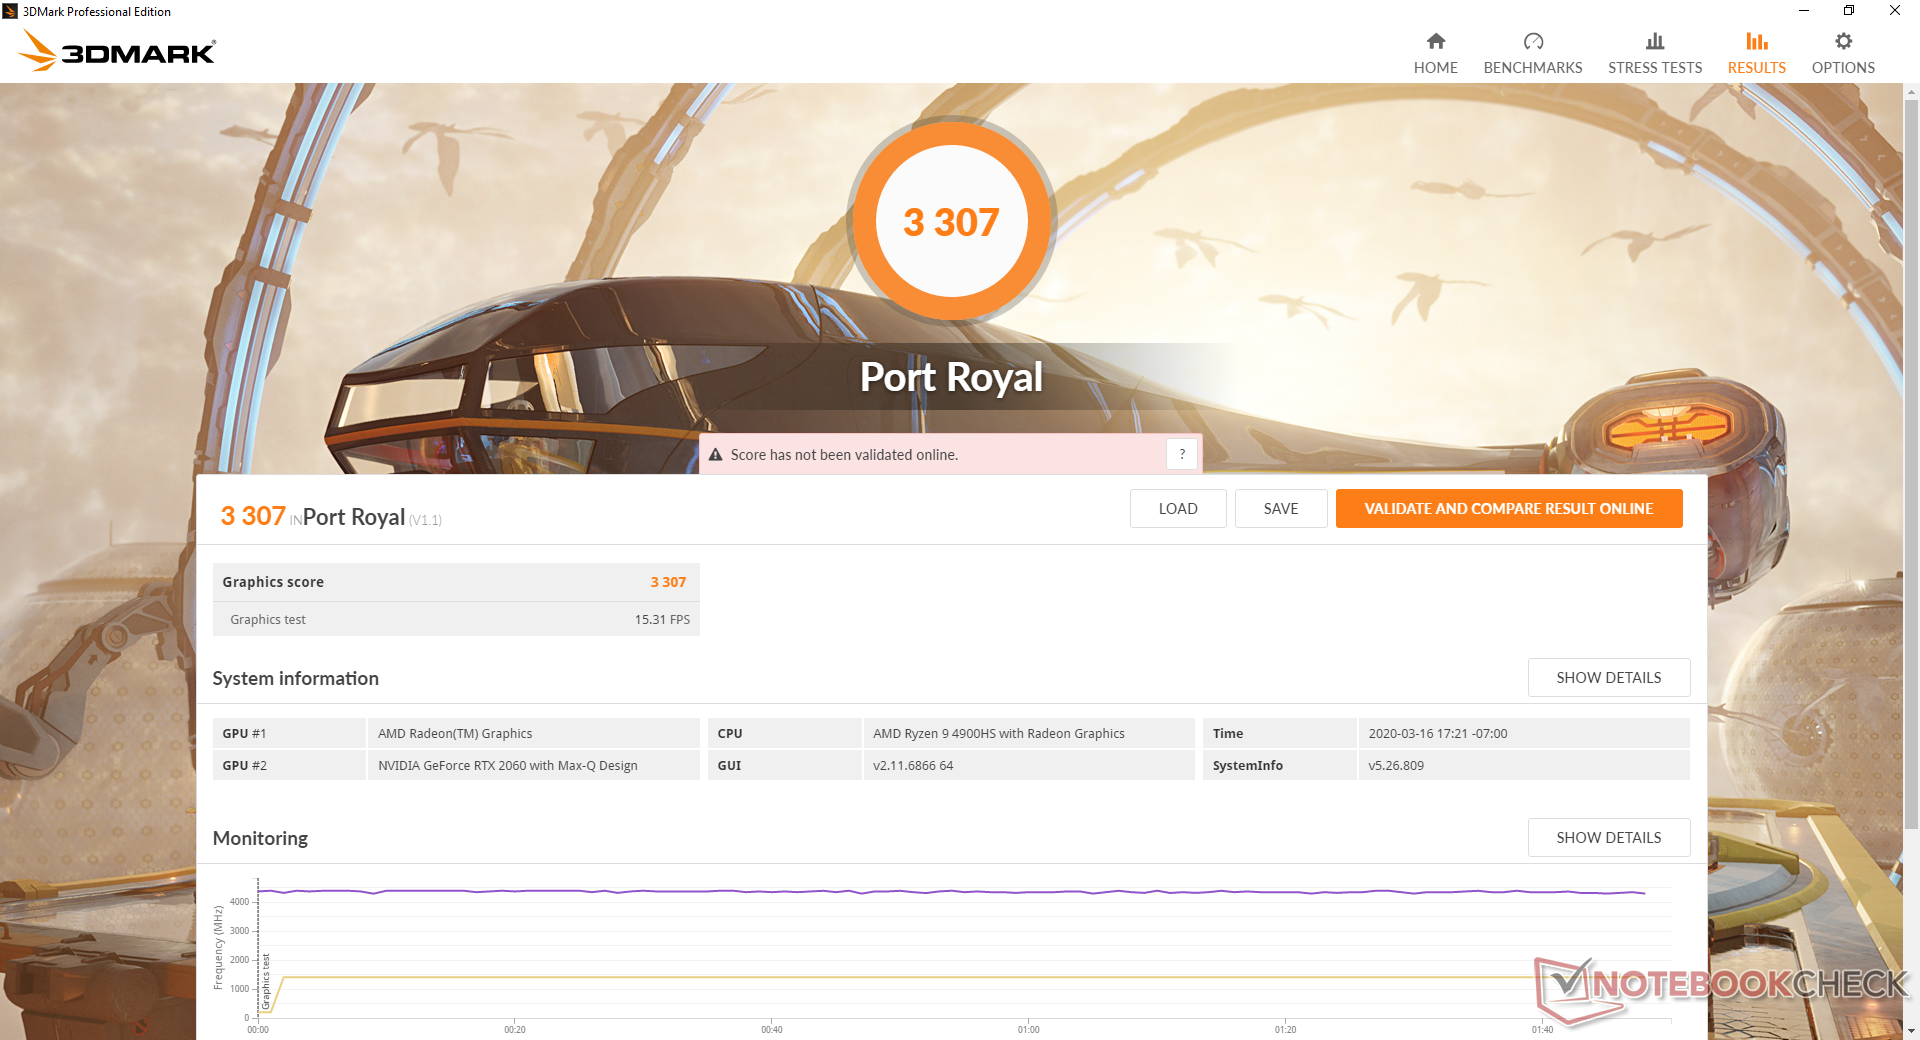
The GeForce RTX 2060 Max-Q is finally a reality after being over a year late to the party. As one would expect from a Max-Q GPU, raw performance is about 10 to 15 percent behind the non-Max-Q counterpart. Performance is only about 5 to 10 percent faster than the mobile GTX 1660 Ti or approximately 20 to 25 percent slower performance than a "proper" desktop RTX 2060.
The biggest reason to own an RTX 2060 Max-Q over the GTX 1660 Ti would be for its hardware-accelerated ray-tracing capabilities or Tensor cores since these two GPUs perform very closely otherwise.
| 3DMark 06 Standard Score | 37332 points | |
| 3DMark Vantage P Result | 50957 points | |
| 3DMark 11 Performance | 18937 points | |
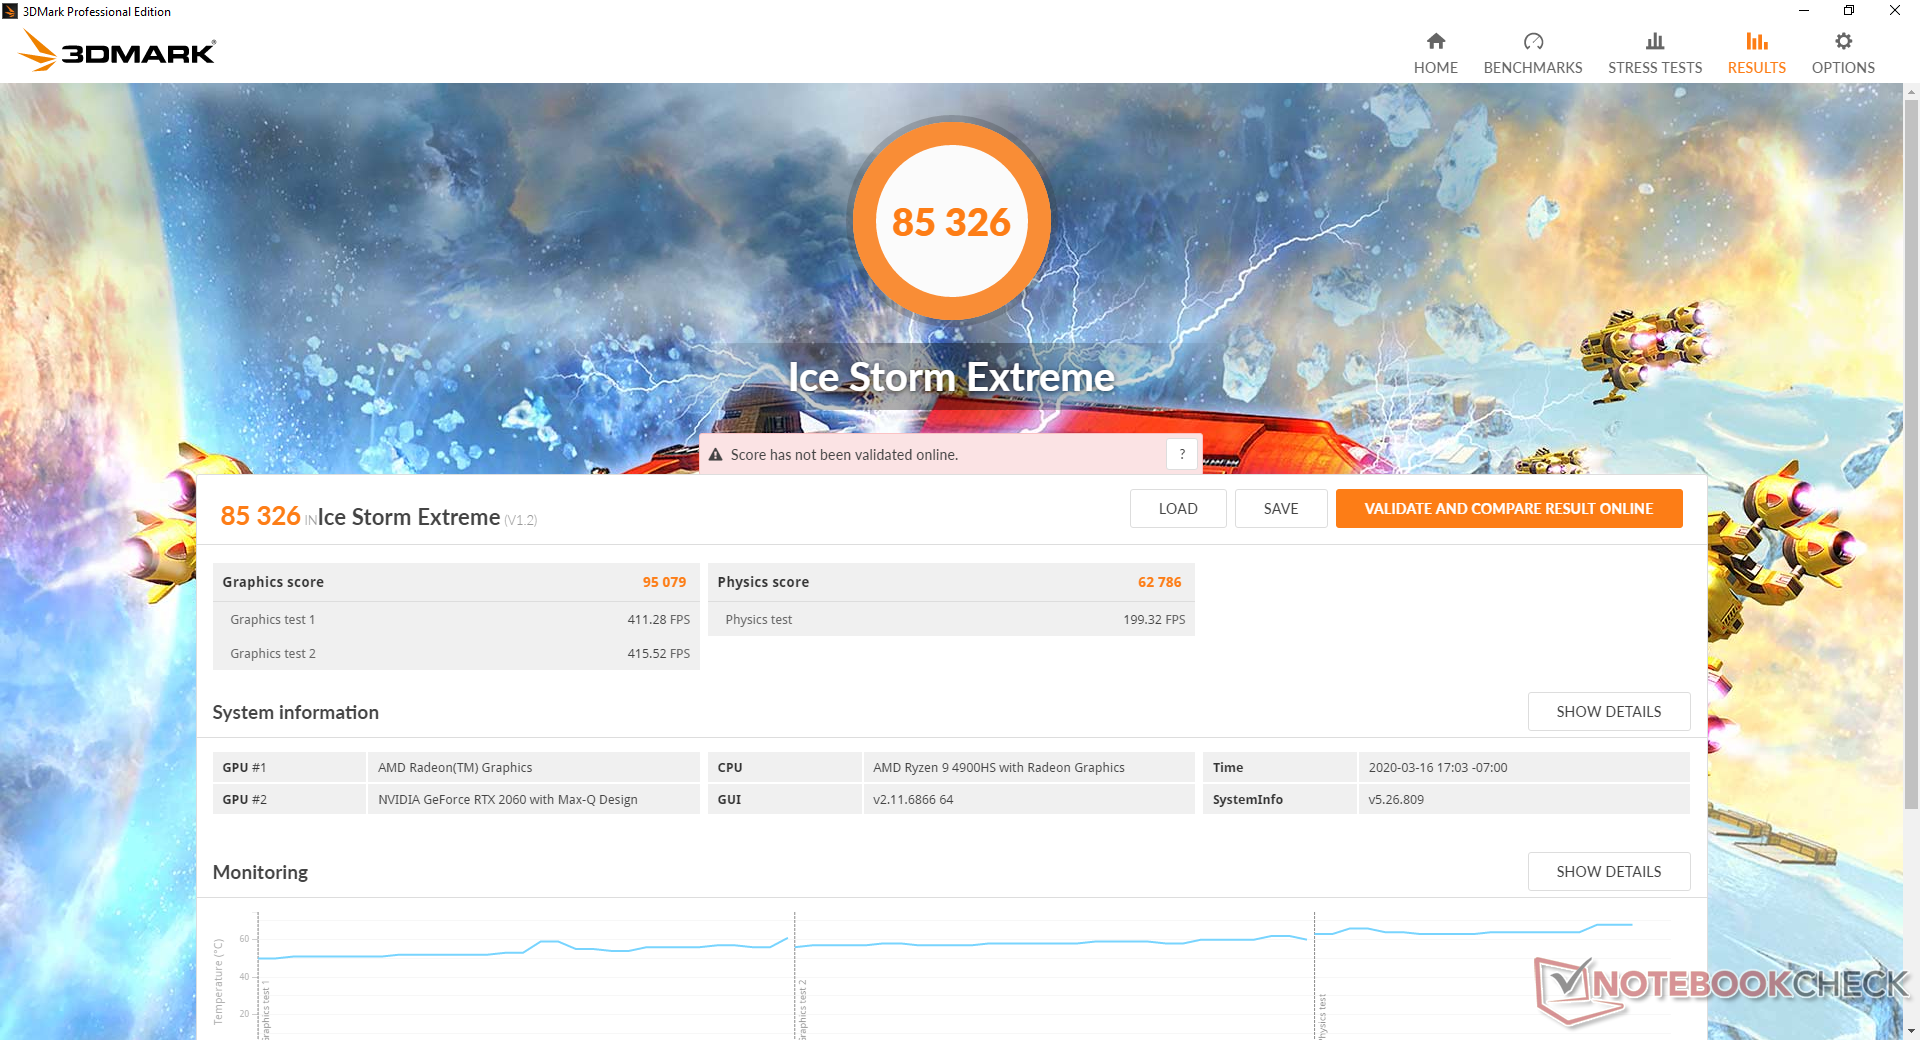
| 3DMark Ice Storm Standard Score | 85539 points | |
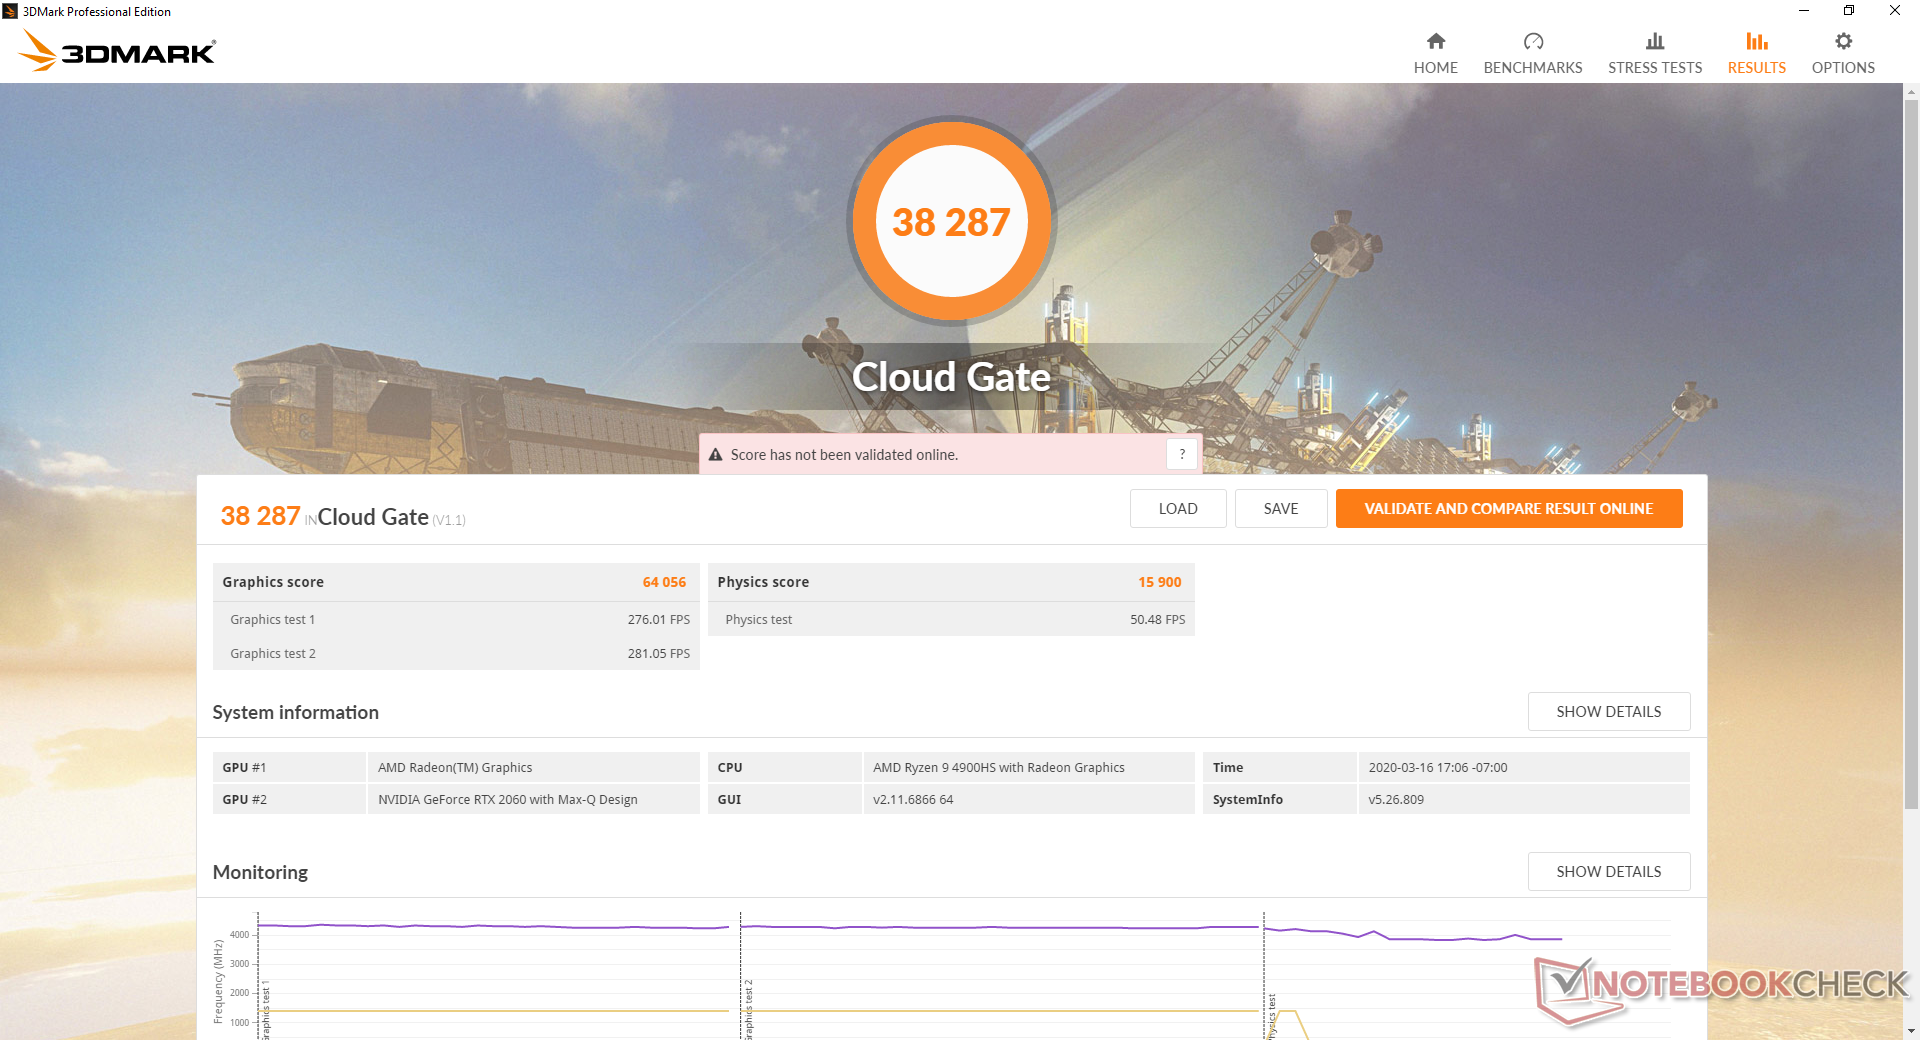
| 3DMark Cloud Gate Standard Score | 38287 points | |
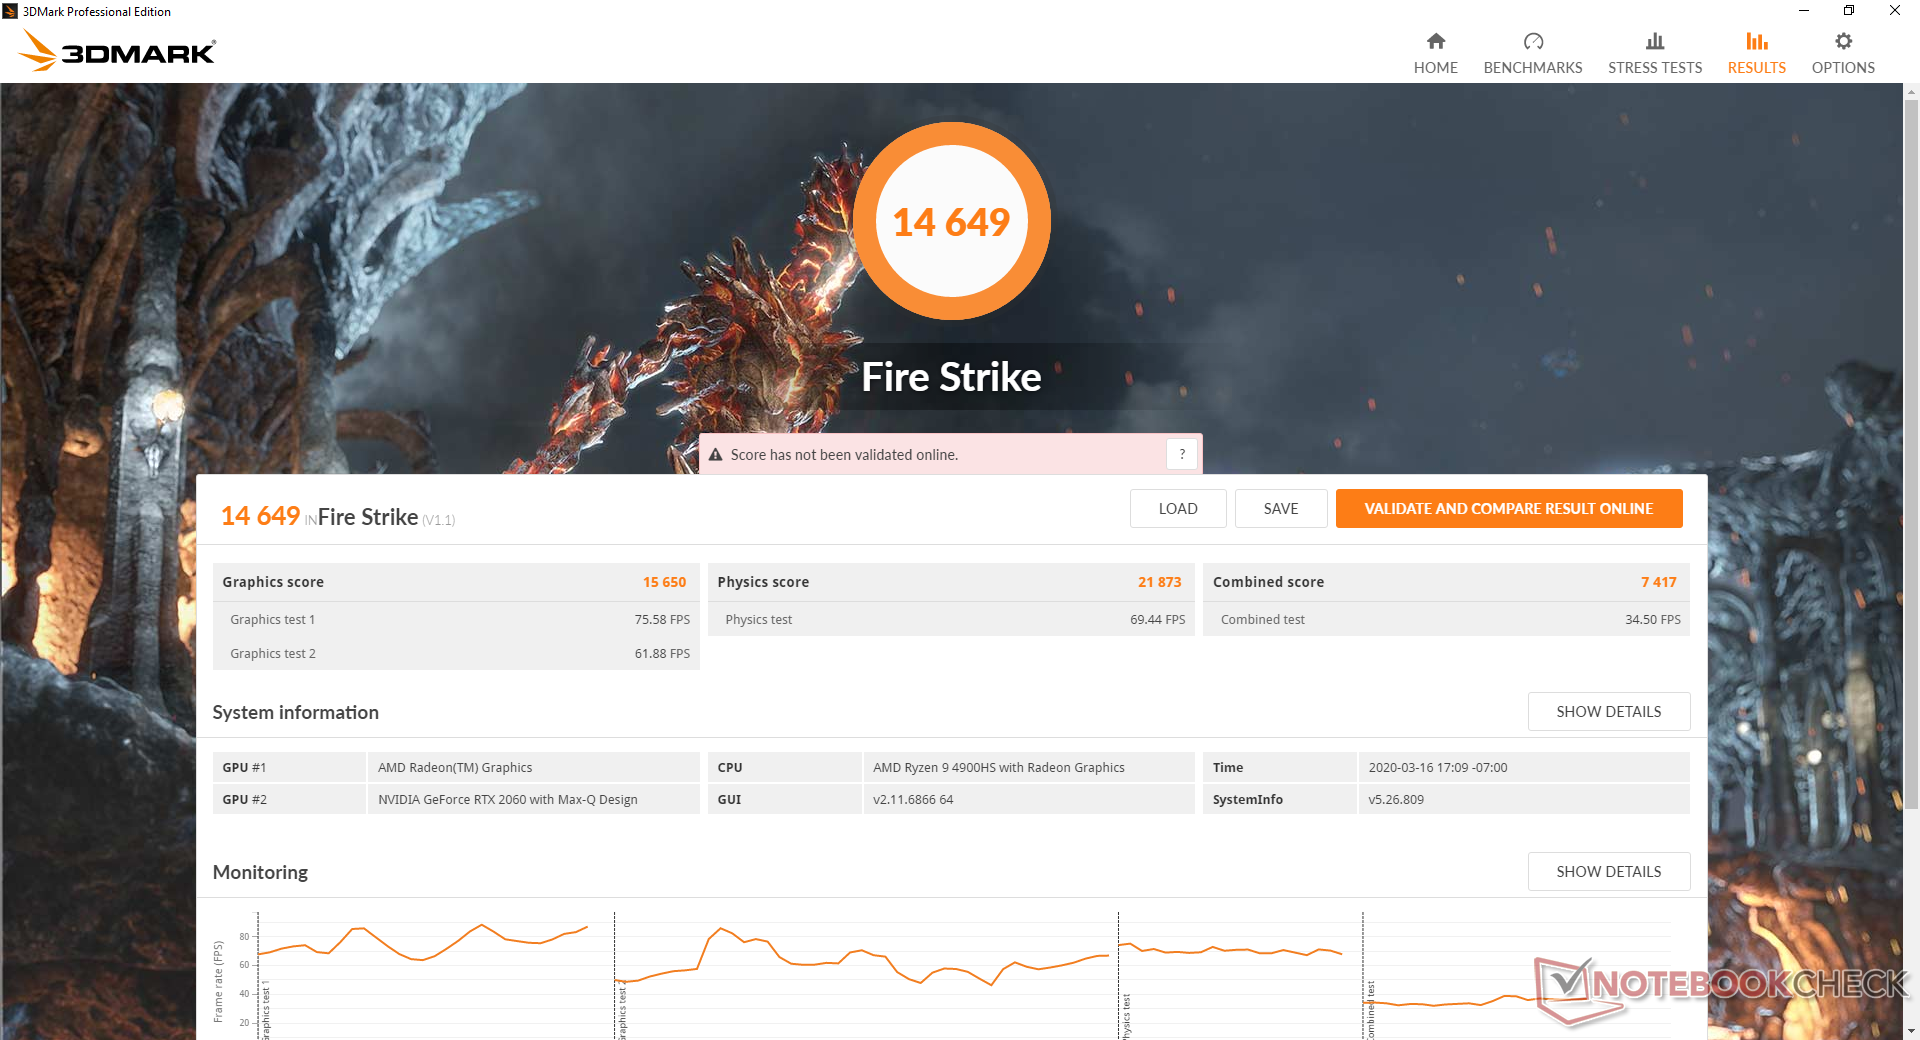
| 3DMark Fire Strike Score | 14649 points | |
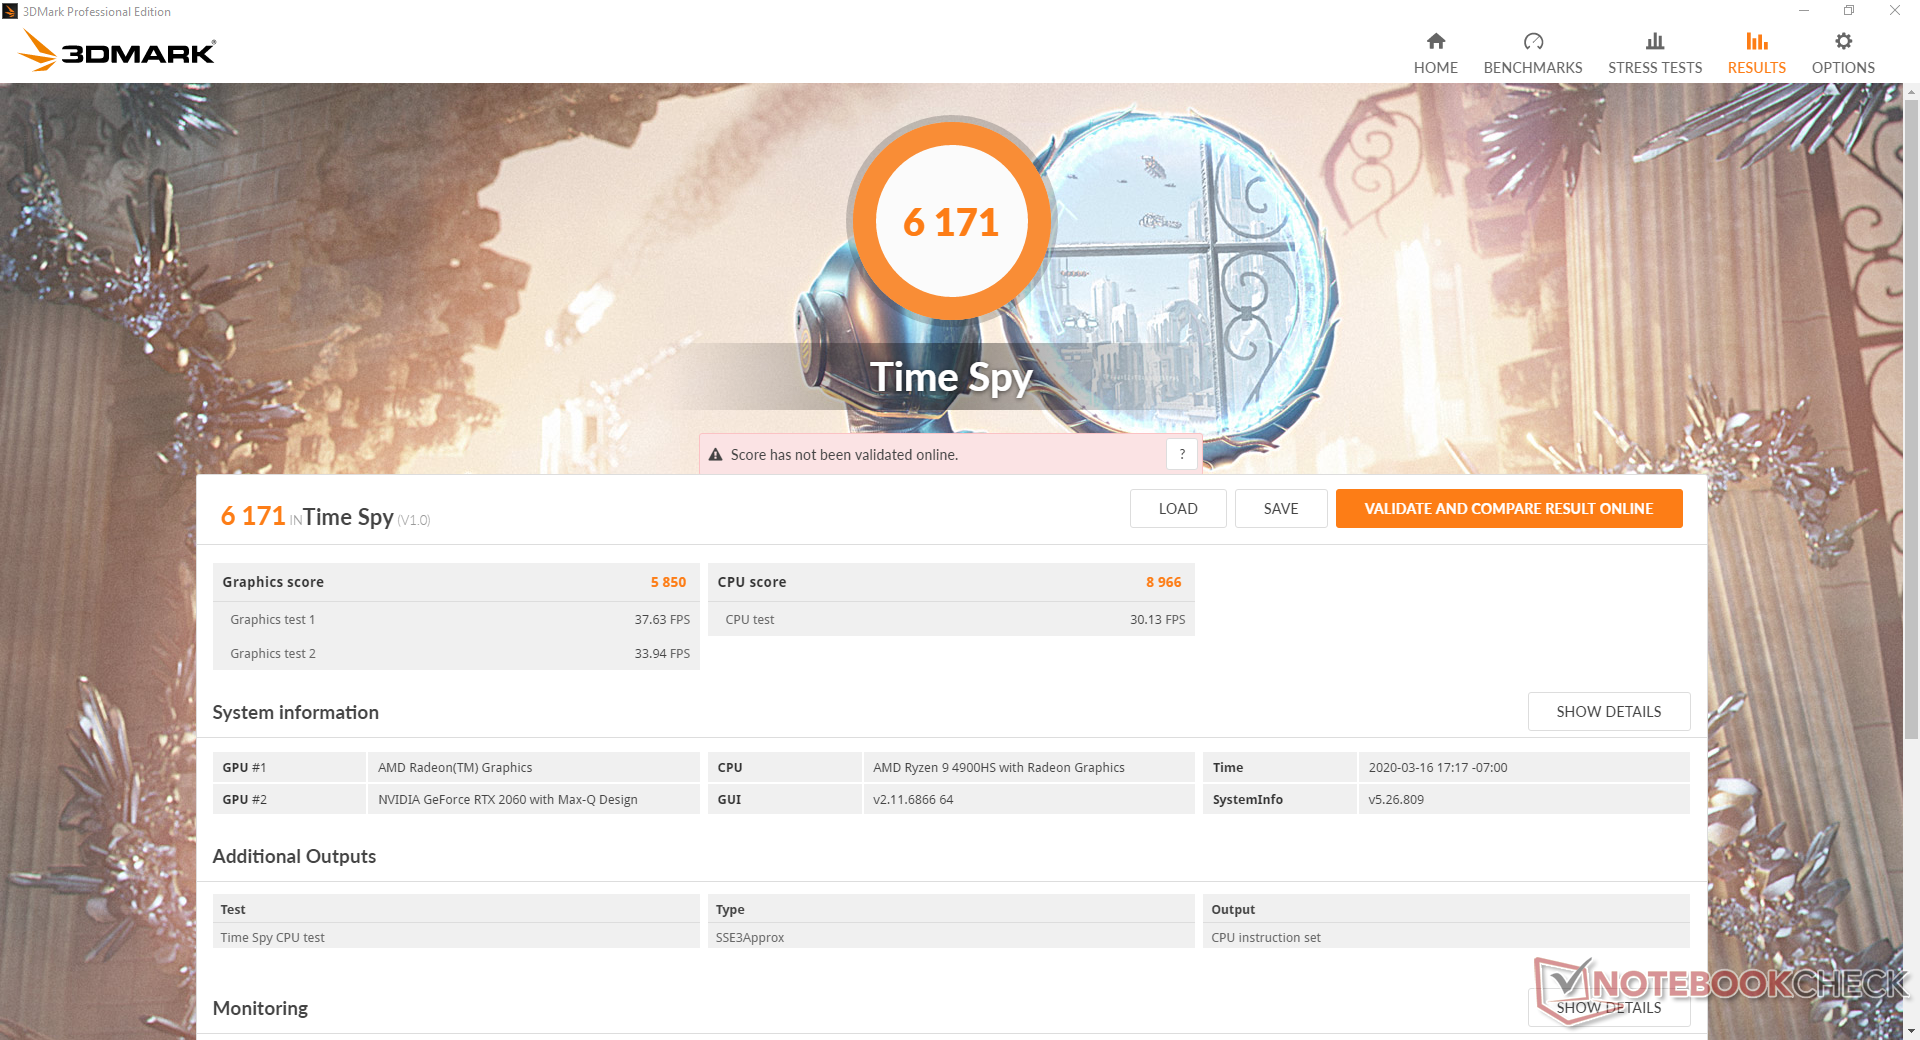
| 3DMark Time Spy Score | 6171 points | |
Help | ||
Gaming Performance
3DMark results translate well to real-world gaming performance as the RTX 2060 Max-Q sits comfortably in between the GTX 1660 Ti and mobile RTX 2060 on High or Ultra settings. On lower settings, however, frame rates are slightly slower than expected although they are nowhere near as bad as on the last generation Zephyrus G GA502 with the Ryzen 7 3750H. Shadow of the Tomb Raider on low settings, for example, runs 90 percent faster than the aforementioned GA502 even though our RTX 2060 Max-Q should only be about 10 to 15 percent faster than the GTX 1660 Ti Max-Q.
FreeSync pairs very well with this particular GPU since the RTX 2060 tends to hover between 40 to 60 FPS at 1080p which is where adaptive refresh rates work best.
Ghosting will be more prevalent and noticeable because of the ~20 ms black-white response time. It's not an issue on most games like LoL or Shadow of the Tomb Raider except for fast-paced ones with lots of quick turning like CS:GO, Rocket League, or Overwatch.
Users shouldn't expect frame rates to outstrip a Core i7-9750H or Core i9-9880H gaming laptop anytime soon despite the obvious multi-thread performance advantages of the Ryzen 9 4900HS since most games are GPU bound.
See our dedicated page on the GeForce RTX 2060 Max-Q for more technical information and benchmark comparisons.
| Rocket League | |
| 1280x720 Performance | |
| Lenovo Yoga C940-15IRH | |
| Asus Zephyrus G14 GA401IV | |
| MSI RTX 2060 Gaming Z 6G | |
| Asus ROG Zephyrus G15 GA502DU | |
| 1920x1080 High Quality AA:High FX | |
| MSI RTX 2060 Gaming Z 6G | |
| Asus Zephyrus G14 GA401IV | |
| Lenovo Yoga C940-15IRH | |
| Asus ROG Zephyrus G15 GA502DU | |
| low | med. | high | ultra | |
|---|---|---|---|---|
| Guild Wars 2 (2012) | 130.3 | 67.3 | 67.4 | |
| BioShock Infinite (2013) | 278.3 | 252.3 | 229.5 | 126.2 |
| The Witcher 3 (2015) | 232.2 | 168.2 | 100.6 | 58.4 |
| Metal Gear Solid V (2015) | 60 | 60 | 60 | 59.2 |
| Dota 2 Reborn (2015) | 120.8 | 115.1 | 107.8 | 103.8 |
| Ashes of the Singularity (2016) | 100.4 | 72.8 | 66.8 | |
| Doom (2016) | 125 | 125 | 118.2 | 111.5 |
| Overwatch (2016) | 299.9 | 299.7 | 229.7 | 146.9 |
| Rocket League (2017) | 246.9 | 249.7 | 219.3 | |
| Middle-earth: Shadow of War (2017) | 155 | 123 | 97 | 76 |
| Fortnite (2018) | 124 | 110.2 | 107.4 | 81.2 |
| Final Fantasy XV Benchmark (2018) | 141 | 82.7 | 62.4 | |
| X-Plane 11.11 (2018) | 94.9 | 81.9 | 69.7 | |
| Monster Hunter World (2018) | 104.5 | 94.2 | 75.6 | 63.6 |
| Shadow of the Tomb Raider (2018) | 118 | 90 | 84 | 74 |
| Assassin´s Creed Odyssey (2018) | 97 | 79 | 65 | 45 |
| Apex Legends (2019) | 143.6 | 142.8 | 126.2 | 116.6 |
| Metro Exodus (2019) | 129.6 | 72.7 | 55.2 | 43.8 |
| The Division 2 (2019) | 154 | 92 | 74 | 56 |
| Anno 1800 (2019) | 81.5 | 81.6 | 61.4 | 36.5 |
| Total War: Three Kingdoms (2019) | 201.1 | 103.3 | 69.2 | 50.7 |
| F1 2019 (2019) | 196 | 137 | 116 | 101 |
| Borderlands 3 (2019) | 117 | 89.5 | 61.9 | 48.3 |
| Ghost Recon Breakpoint (2019) | 123 | 82 | 75 | 55 |
| Need for Speed Heat (2019) | 103.2 | 88.7 | 82.2 | 79 |
| Escape from Tarkov (2020) | 78.5 | 68.5 | 68.2 | 85.3 |
| Hunt Showdown (2020) | 194.2 | 96.3 | 75.7 | |
| Doom Eternal (2020) | 176.1 | 108.7 | 95.7 | 93.3 |
Emissions: Too High-Pitched
System Noise
Fan noise is the Achilles heel of the system. Even when set to Silent mode, the fans will still be active and pulsing at the 30.4 dB(A) to 33.7 dB(A) range. If set to Turbo mode, fan noise can be as loud as 40.4 dB(A) just from doing nothing onscreen. It's too bad that the system is never truly silent even when set to the lowest power profile possible.
When set to Balanced mode, fan noise tops out at 34.3 dB(A) when running the first benchmark scene of 3DMark 06 which only lasts for about 90 seconds. Afterwards, fan noise jumps steadily to almost 50 dB(A).
Running Witcher 3 on Performance mode will induce a steady fan noise of 50.5 dB(A) whereas Turbo mode will induce an even louder steady fan noise of 53.5 dB(A). This is louder than what we recorded on the Blade 15, GS65, and Alienware m15 R2 when under similar conditions while being relatively consistent to other Zephyrus laptops we've already tested like the GU502GU or GA502DU.
Note that GPU clock rate is slightly higher in Turbo mode (~1575 MHz vs. 1485 MHz) meaning that you'll be sacrificing a tiny bit of performance for quieter fan noise if you decide to game on Performance mode.
We can notice no electronic noise or coil whine from our test unit.
| Asus Zephyrus G14 GA401IV GeForce RTX 2060 Max-Q, R9 4900HS, Intel SSD 660p 1TB SSDPEKNW010T8 | Asus ROG Zephyrus M15 GU502GU-XB74 GeForce GTX 1660 Ti Mobile, i7-9750H, Intel SSD 660p SSDPEKNW512G8 | Razer Blade 15 GTX 1660 Ti GeForce GTX 1660 Ti Mobile, i7-9750H, Samsung SSD PM981 MZVLB256HAHQ | MSI GS65 Stealth 9SG GeForce RTX 2080 Max-Q, i7-9750H, Samsung SSD PM981 MZVLB512HAJQ | Alienware m15 R2 P87F GeForce RTX 2080 Max-Q, i7-9750H, 2x Toshiba XG6 KXG60ZNV512G (RAID 0) | MSI Prestige 14 A10SC-009 GeForce GTX 1650 Max-Q, i7-10710U, Samsung SSD PM981 MZVLB1T0HALR | |
|---|---|---|---|---|---|---|
| Noise | -1% | 1% | 2% | -10% | 1% | |
| off / environment * (dB) | 28.1 | 28.2 -0% | 28.5 -1% | 28.3 -1% | 28.3 -1% | 30.3 -8% |
| Idle Minimum * (dB) | 30.4 | 28.7 6% | 30.3 -0% | 30.4 -0% | 28.5 6% | 30.3 -0% |
| Idle Average * (dB) | 31.5 | 30.5 3% | 30.5 3% | 30.5 3% | 28.5 10% | 30.3 4% |
| Idle Maximum * (dB) | 33.7 | 31 8% | 30.5 9% | 30.6 9% | 49 -45% | 30.3 10% |
| Load Average * (dB) | 34.3 | 39 -14% | 41 -20% | 37.6 -10% | 49 -43% | 40.2 -17% |
| Witcher 3 ultra * (dB) | 53.5 | 54.2 -1% | 48 10% | 46 14% | 49 8% | |
| Load Maximum * (dB) | 53.5 | 59.6 -11% | 51.9 3% | 55.1 -3% | 55 -3% | 43.5 19% |
* ... smaller is better
Noise level
| Idle |
| 30.4 / 31.5 / 33.7 dB(A) |
| Load |
| 34.3 / 53.5 dB(A) |
 | ||
30 dB silent 40 dB(A) audible 50 dB(A) loud |
||
min: | ||
Temperature
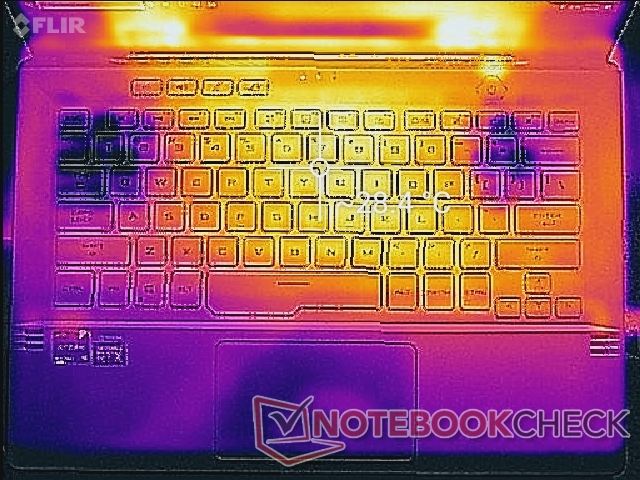
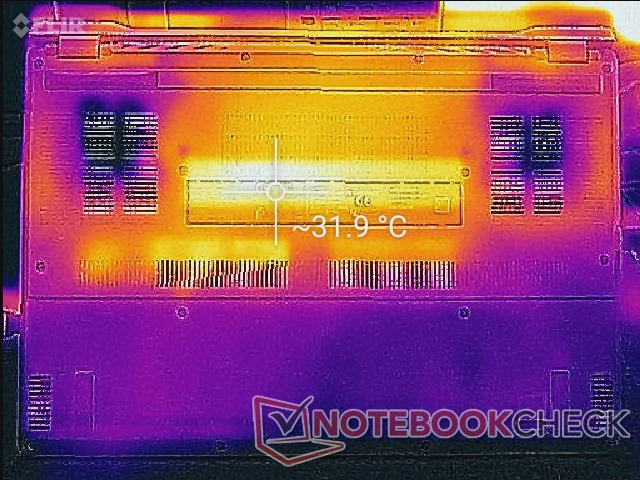
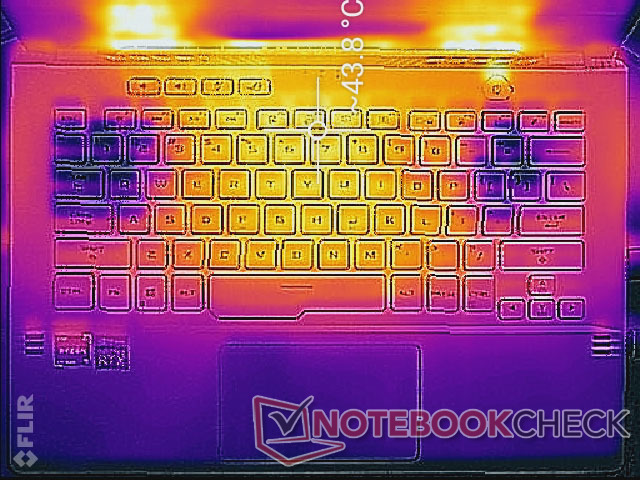
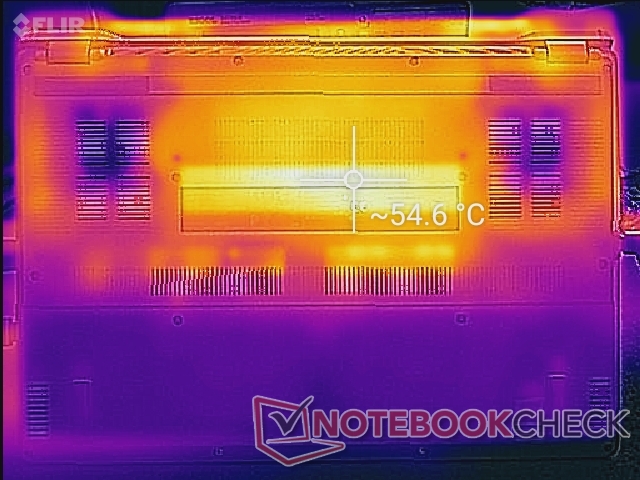
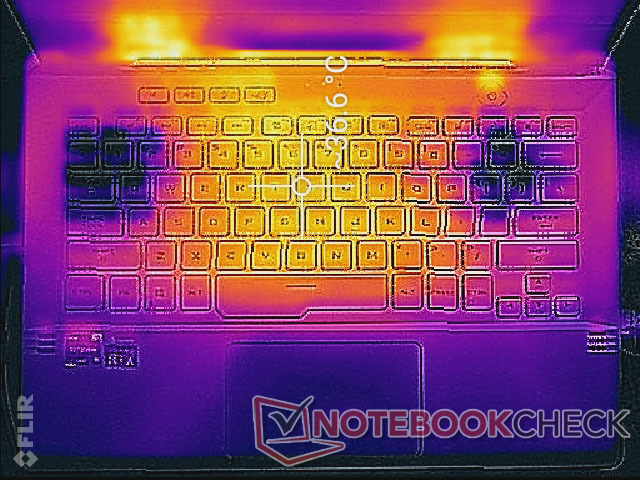
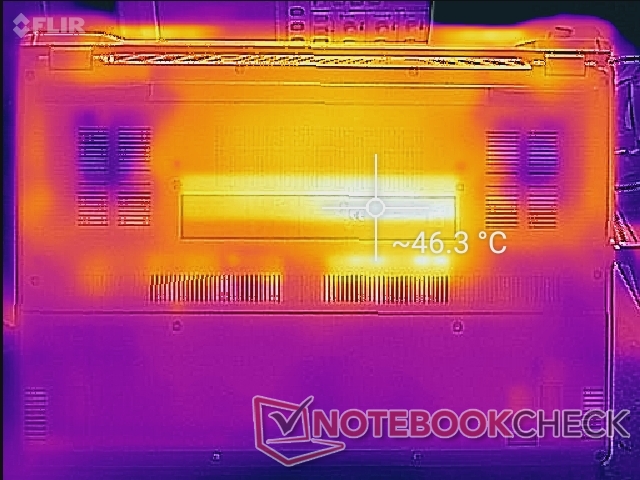
Surface temperatures are relatively warm even when idling with no active applications, but this is normal for a Zephyrus laptop. For example, the center of the keyboard and bottom surface can become as warm as 30 C each while the Asus Zephyrus M GU502GU would be even warmer when under the same conditions. If gaming, expect these hot spots to stabilize at around 40 C to 47 C much like what we recorded on the larger Razer Blade 15. The palm rests will become warmer as well but never to an uncomfortable level when gaming.
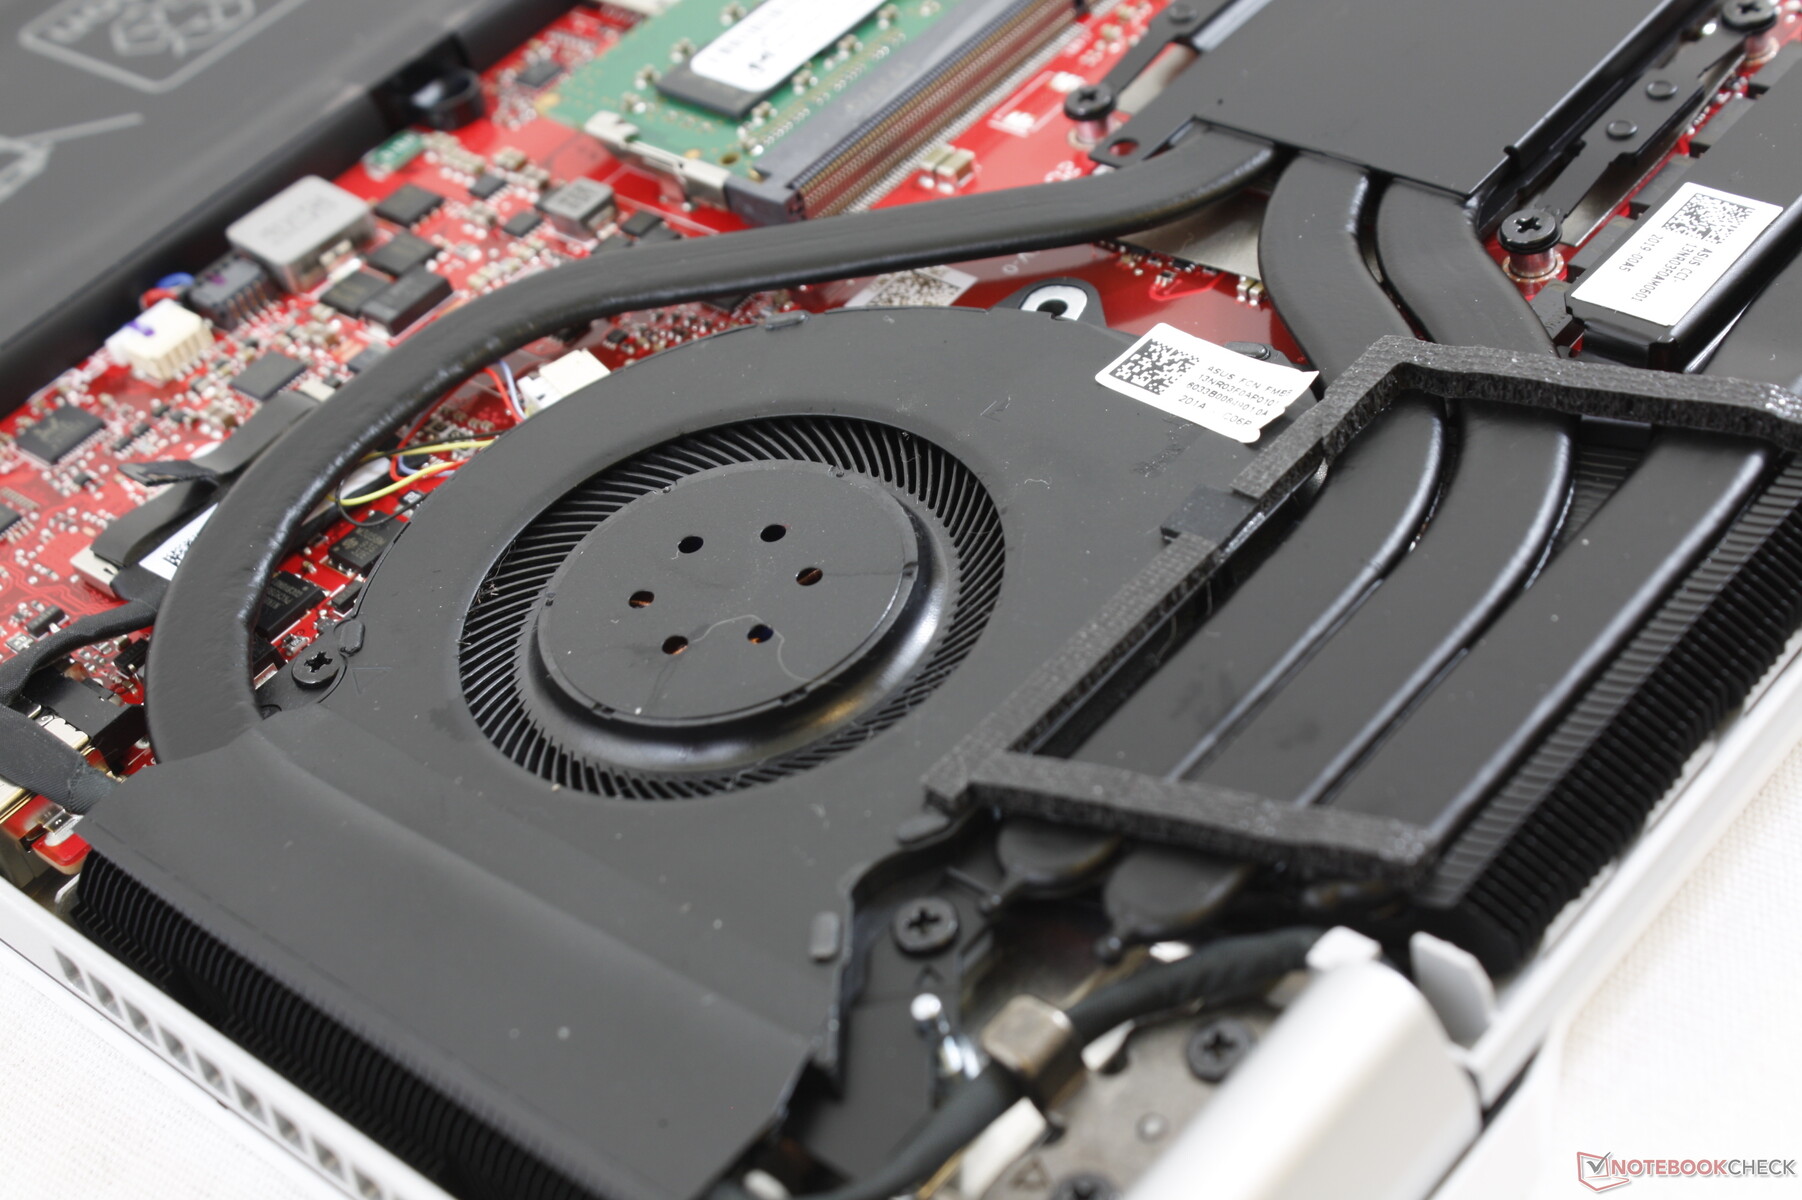
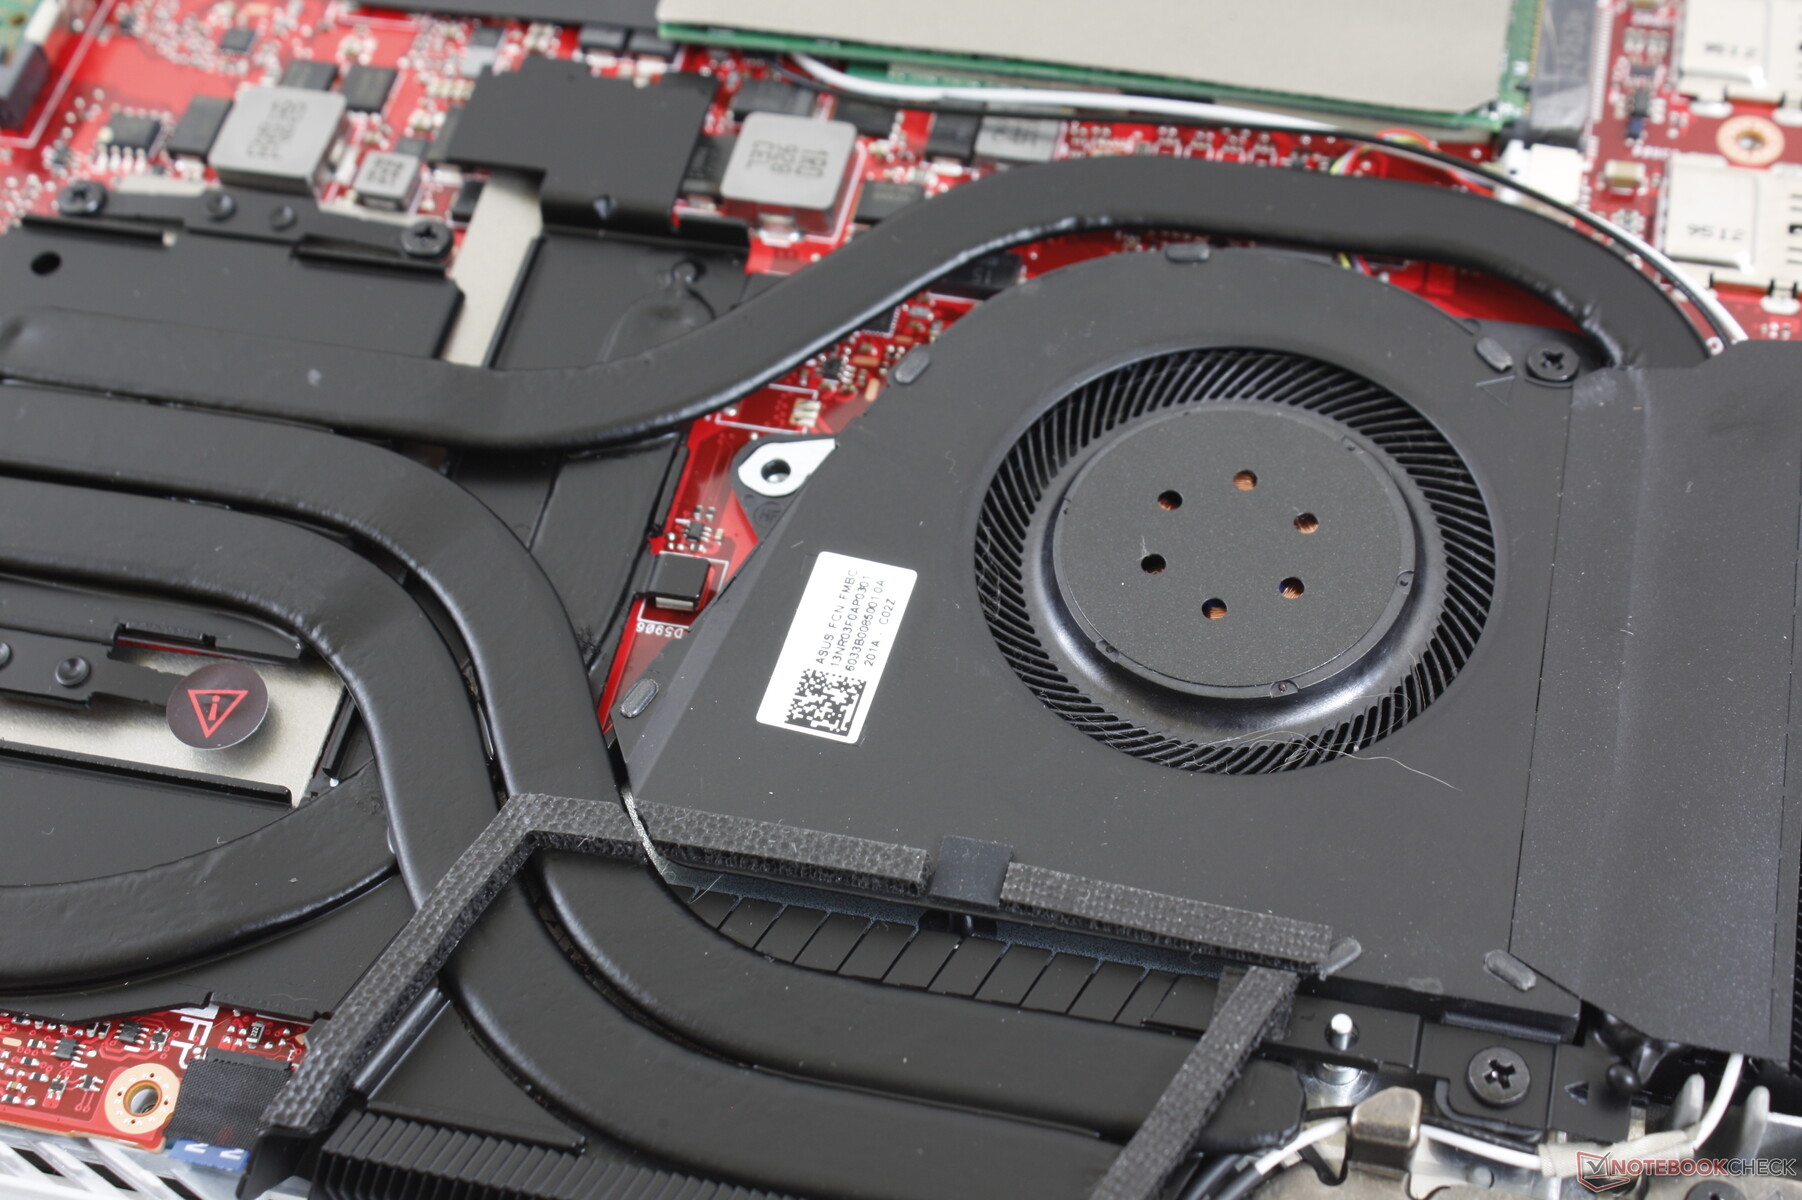
The system maximizes airflow by drawing cool air near the corners of the keyboard with waste heat exiting in four different directions compared to just two or three on larger 15.6-inch laptops. We suspect this was necessary in order to accommodate such high-performance parts in a 14-inch form factor. Be sure to not block any of the large ventilation grilles long the sides or rear.
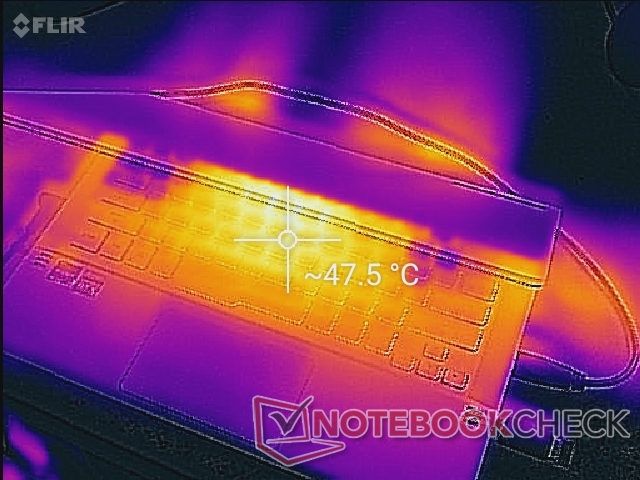
(+) The maximum temperature on the upper side is 36 °C / 97 F, compared to the average of 40.4 °C / 105 F, ranging from 21.2 to 68.8 °C for the class Gaming.
(-) The bottom heats up to a maximum of 46.4 °C / 116 F, compared to the average of 43.3 °C / 110 F
(+) In idle usage, the average temperature for the upper side is 25 °C / 77 F, compared to the device average of 33.9 °C / 93 F.
(±) Playing The Witcher 3, the average temperature for the upper side is 34.5 °C / 94 F, compared to the device average of 33.9 °C / 93 F.
(+) The palmrests and touchpad are cooler than skin temperature with a maximum of 28.2 °C / 82.8 F and are therefore cool to the touch.
(±) The average temperature of the palmrest area of similar devices was 28.8 °C / 83.8 F (+0.6 °C / 1 F).
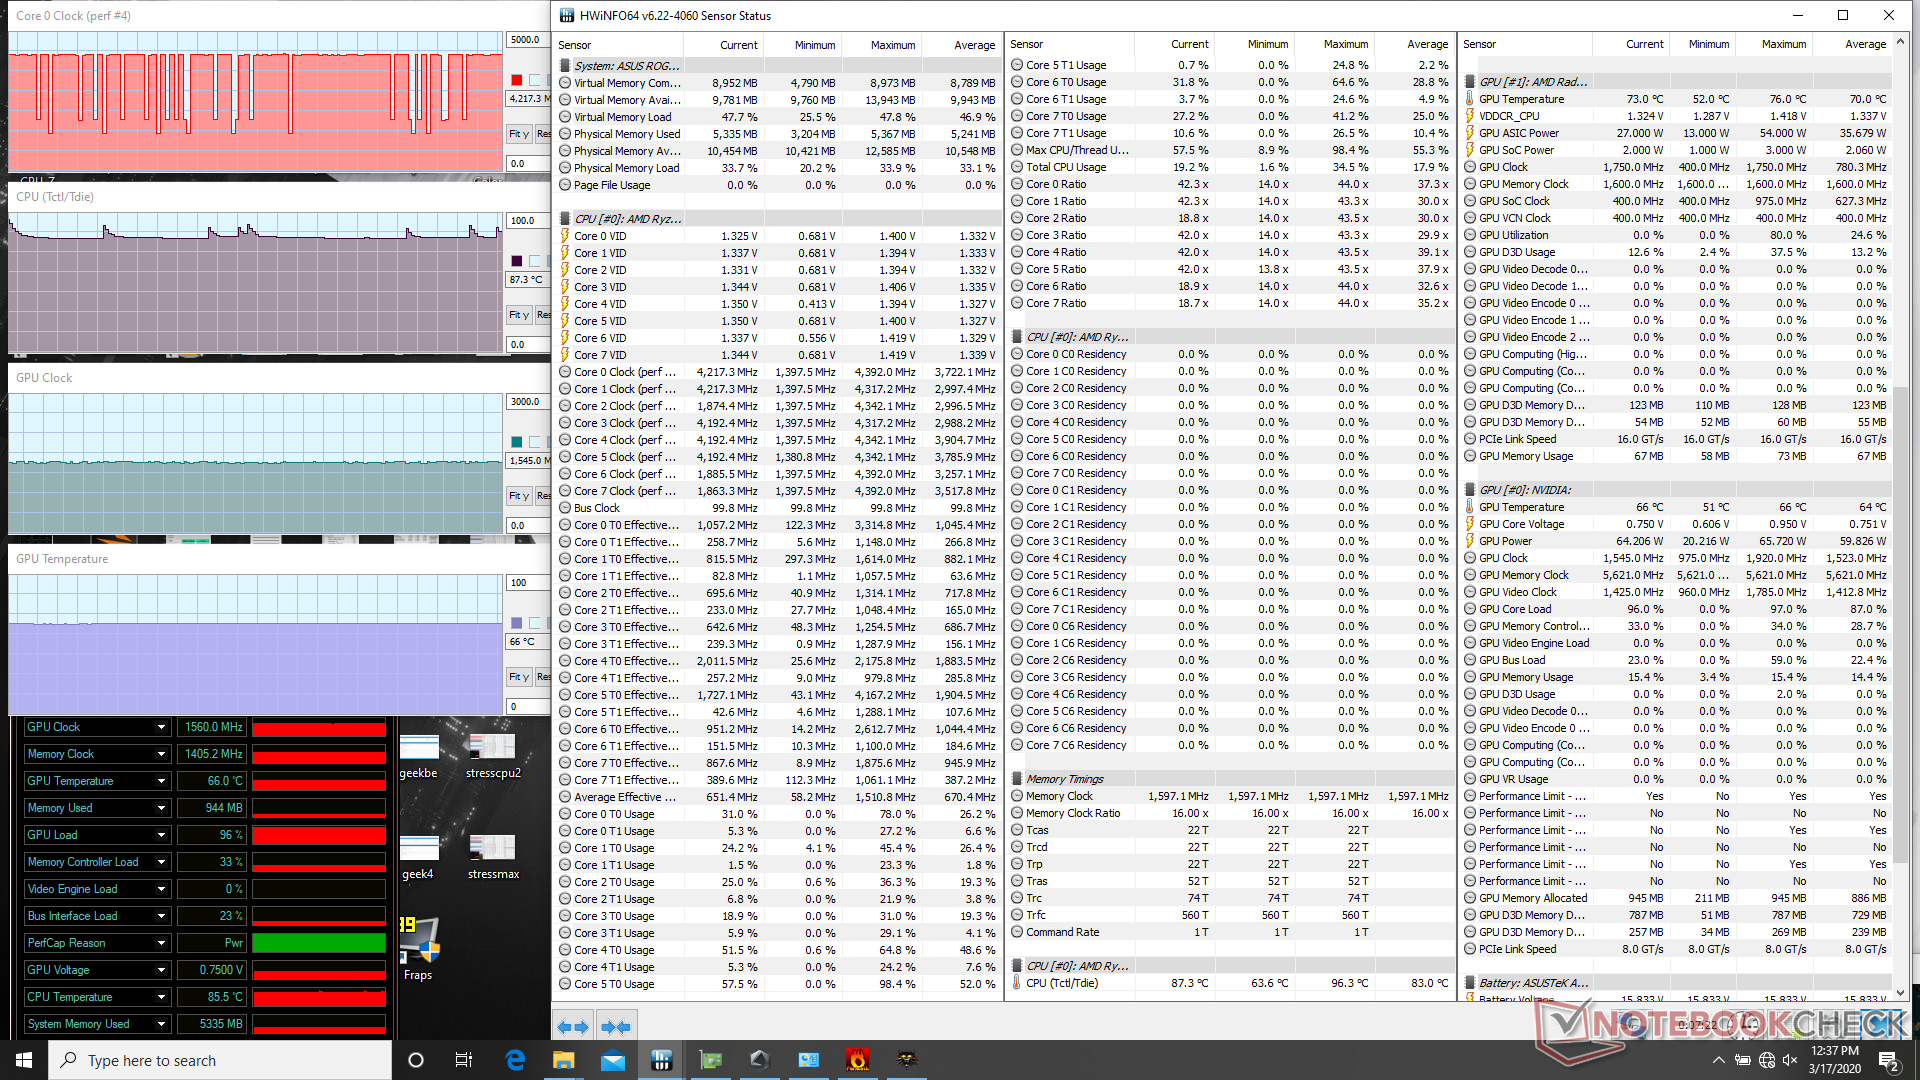
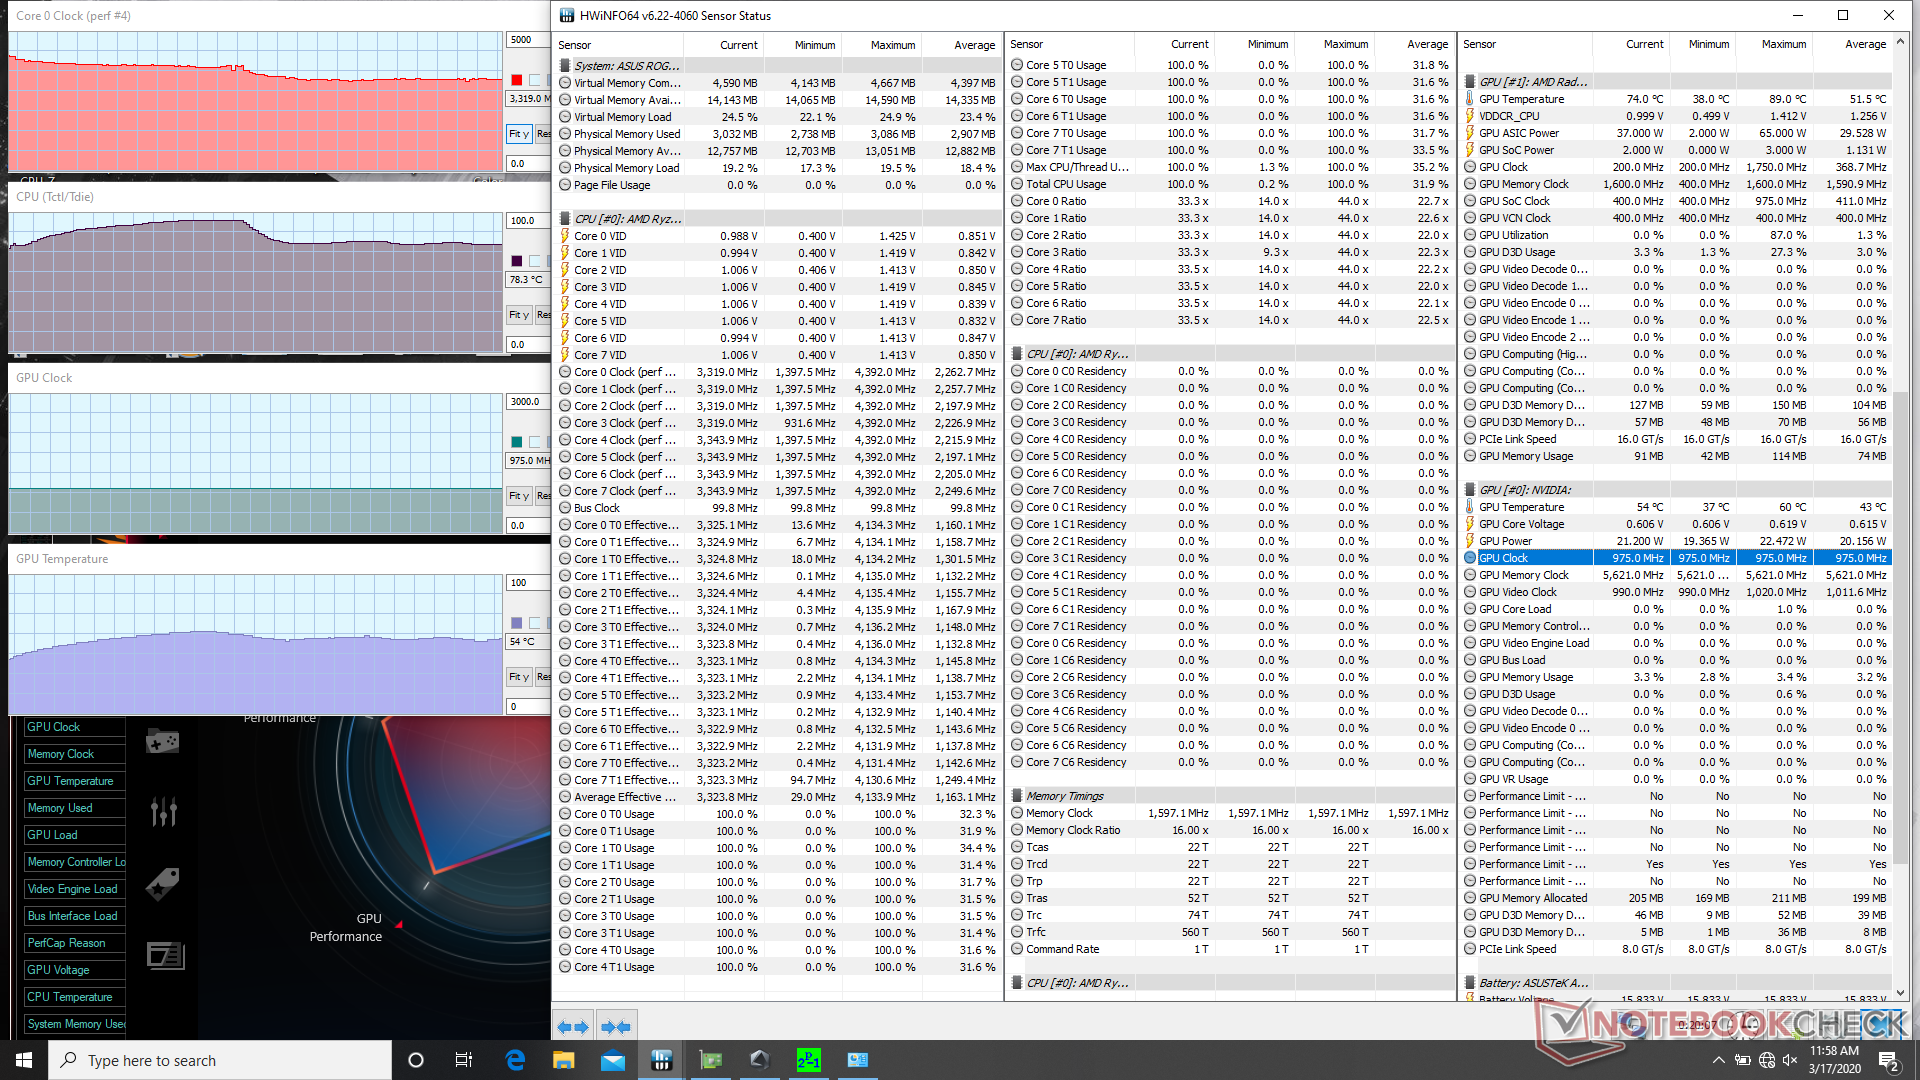
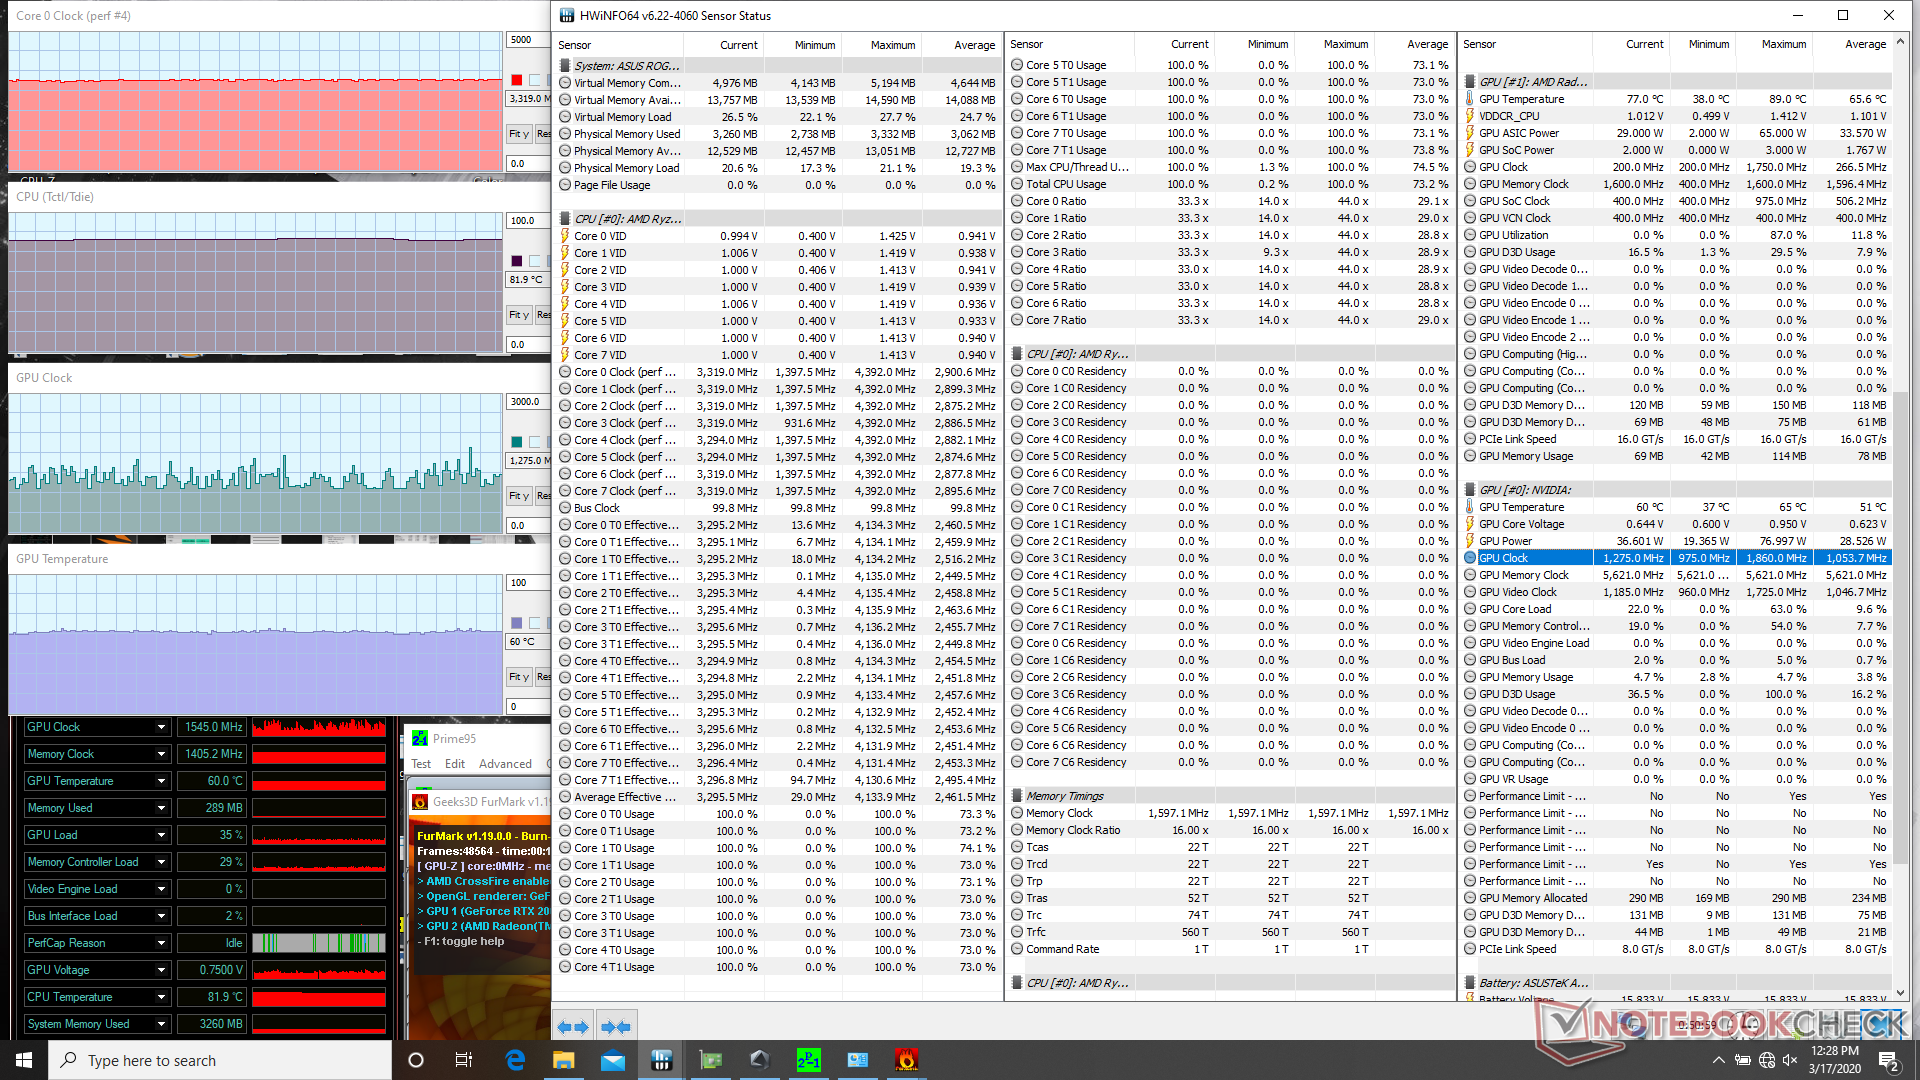
Stress Test: Respectable Turbo Boost Sustainability
We stress the laptop with synthetic loads to identify for any potential throttling or stability issues. When running Prime95, the CPU can be observed boosting up to 4.2 GHz for the first 5 seconds or so before dropping to 3.9 GHz for a few minutes thereafter. When core temperature reaches 95 C, however, clock rates would drop and stabilize at 3.3 GHz for a cooler core temperature of 78 C to 80 C. These stable numbers are impressive considering the form factor and they reflect our CineBench loop test observations above, but the fans will annoyingly pulse every 30 seconds or so even when set to Turbo mode. The Core i7-9750H CPU in the larger Razer Blade 15, for example, would stabilize at 65 C when under similar conditions at a steady fan noise.
Running Witcher 3 is more representative of real-world gaming loads. CPU and GPU temperatures would stabilize at 79 C and 66 C, respectively. compared to 76 C and 79 C on the Razer Blade 15 Base Model.
Running on battery power will limit performance. A Fire Strike test on batteries returns Physics and Graphics scores of 17556 and 4613 points, respectively, compared to 21873 and 15650 points when on mains. Asus' Turbo mode becomes grayed out and automatically disabled when running on batteries.
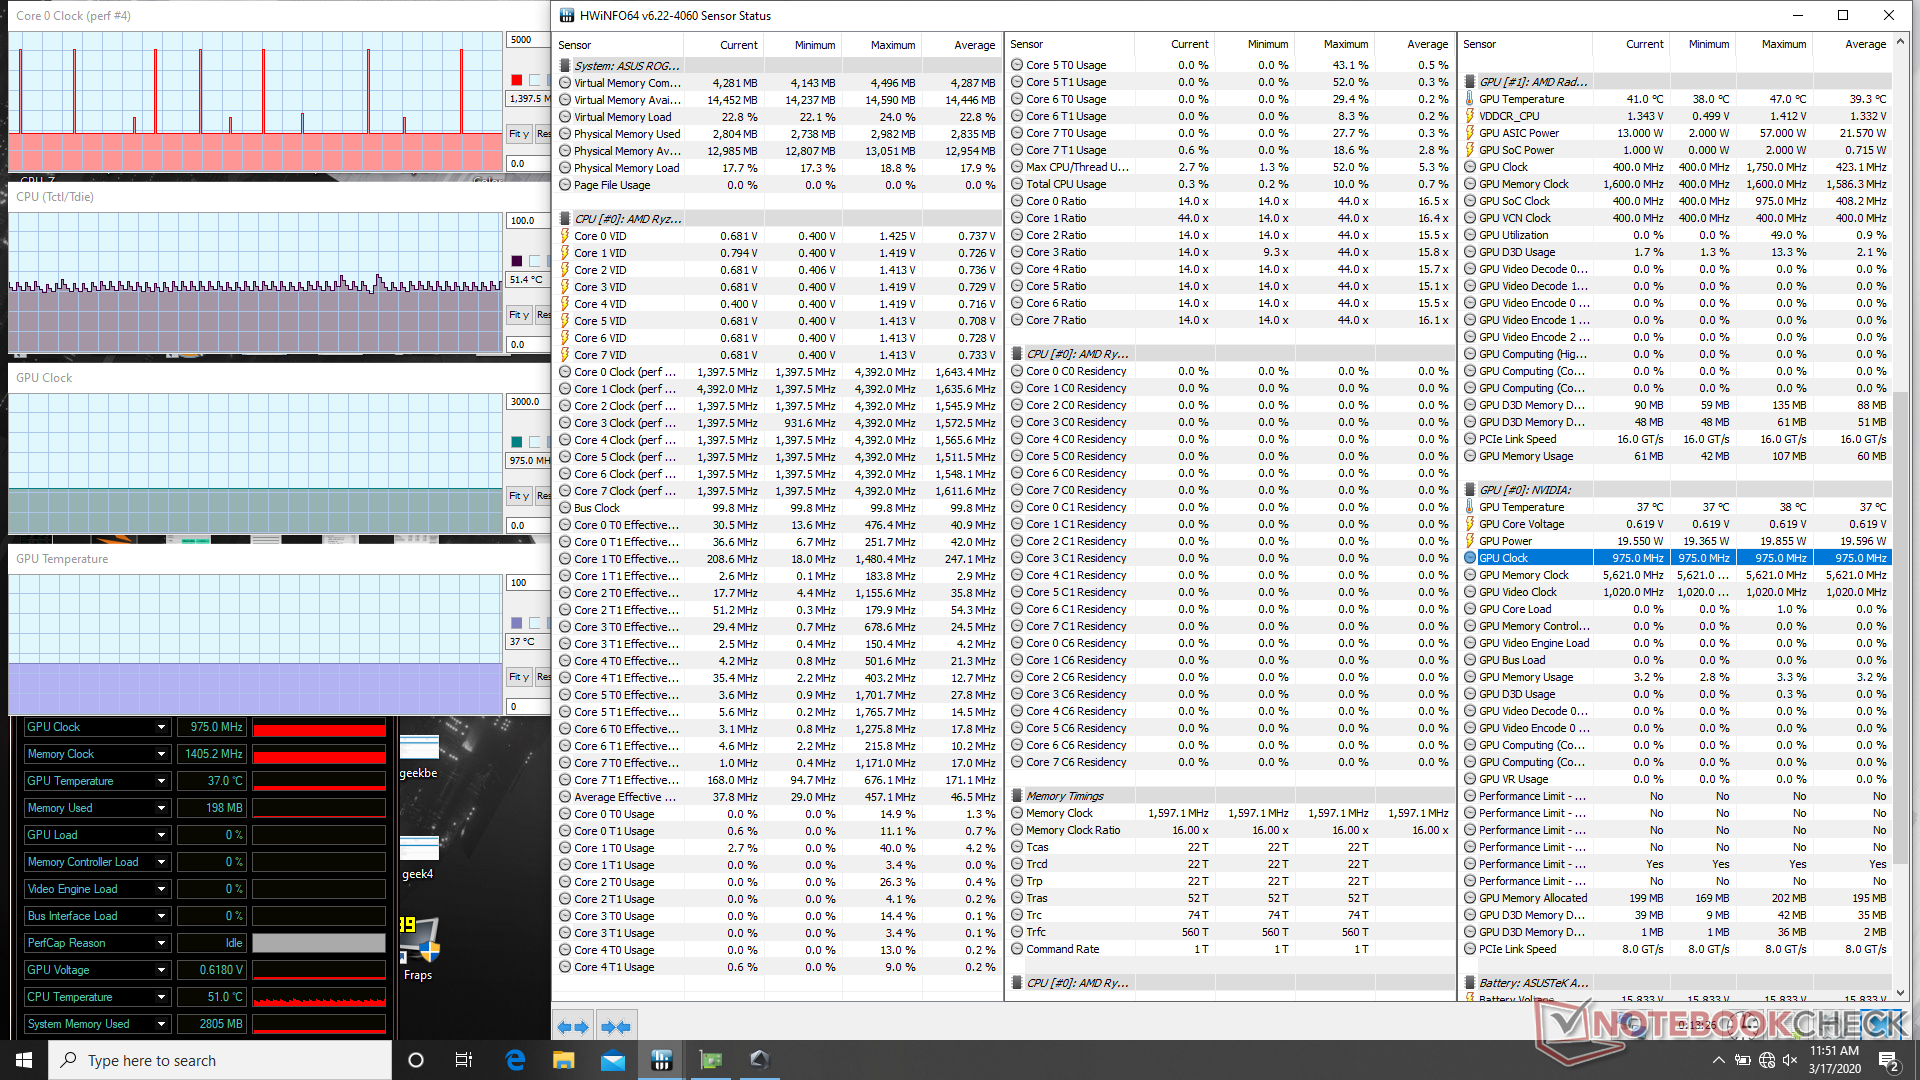
| CPU Clock (GHz) | GPU Clock (MHz) | Average SoC Temperature (°C) | Average GPU Temperature (°C) | |
| System Idle | 1.4 | 975 | 41 | 37 |
| Prime95 Stress | 3.3 | -- | 78 | 54 |
| Prime95 + FurMark Stress | 3.3 | ~1275 | 77 | 60 |
| Witcher 3 Stress | ~4.2 | 1560 | 79 | 66 |
Speakers: Stereo with Tweeters
Asus boasts dual 2.5 W main speakers paired with dual 0.7 W tweeter speakers for improved treble reproduction. In practice, however, maximum volume is still not as loud as what we recorded on the larger Zephyrus M GU502 (85.5 dB vs. 75 dB) and overall audio quality is nothing special. It's still excellent for a 14-inch form factor, but certainly nothing to write home about. Perhaps a dedicated subwoofer instead of tweeters would have made a bigger difference for music and gaming playback.
Maximum volume introduces no static or noticeable vibrations on the palm rests.


Energy Management: High Consumption when Idling
Power Consumption
(June 8, 2020: We have retested power consumption on a second identical unit and results are significantly better this time around. This section has been updated to reflect these revised numbers).
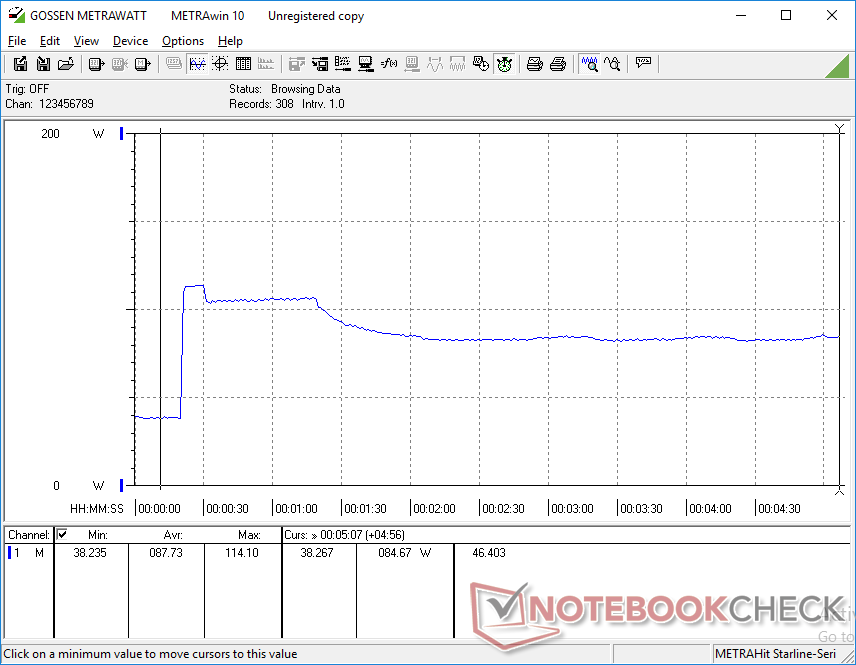
Idling on desktop will consume anywhere between 5 W and 16 W to be in line with the MSI Prestige 14. There may be some consumption spikes when on the High Performance or Turbo power profiles, but these are short-lived.
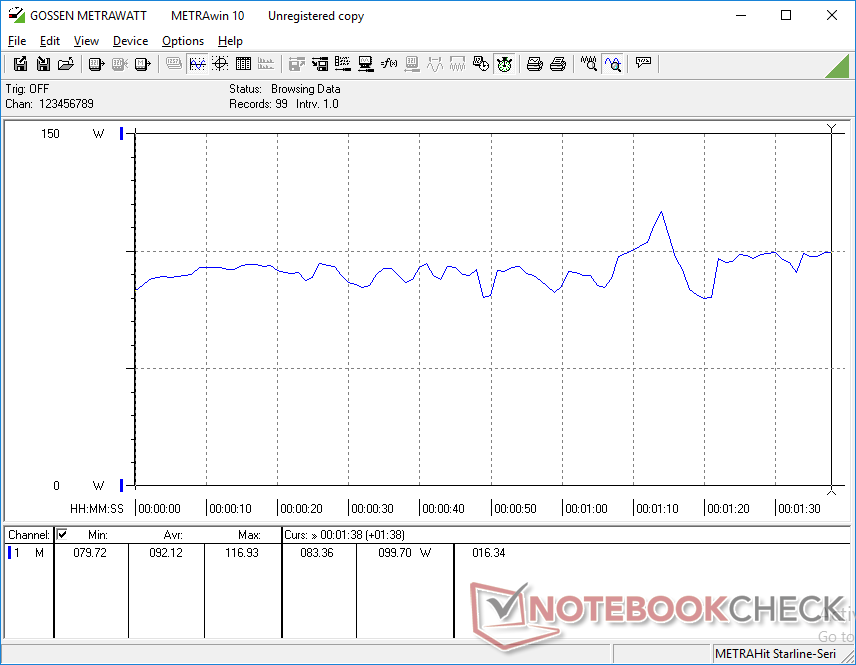
Power consumption becomes more normal when under higher loads. Gaming will demand between 92 W and 113 W compared to 111 W and 149 W on the Zephyrus M with the slower Intel Core i7-9750H CPU and GTX 1660 Ti GPU. It's a 25 percent power savings for 5 to 10 percent faster graphics performance and 80 percent faster multi-thread CPU performance. The average performance-per-Watt advantages of the Zephyrus G14 are a huge leap in this regard.
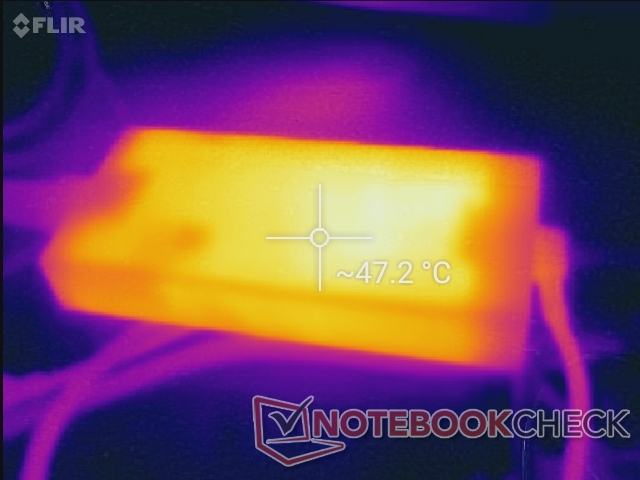
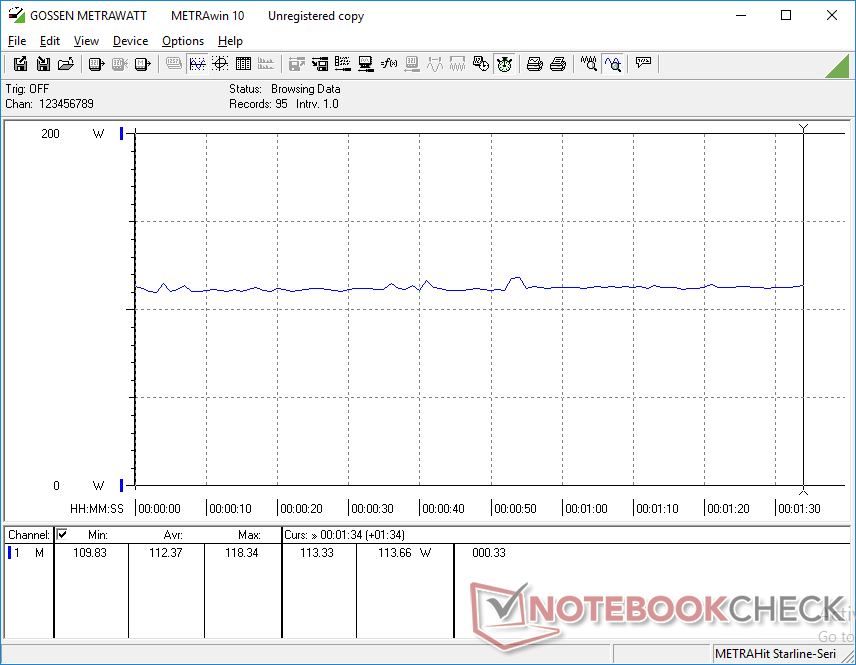
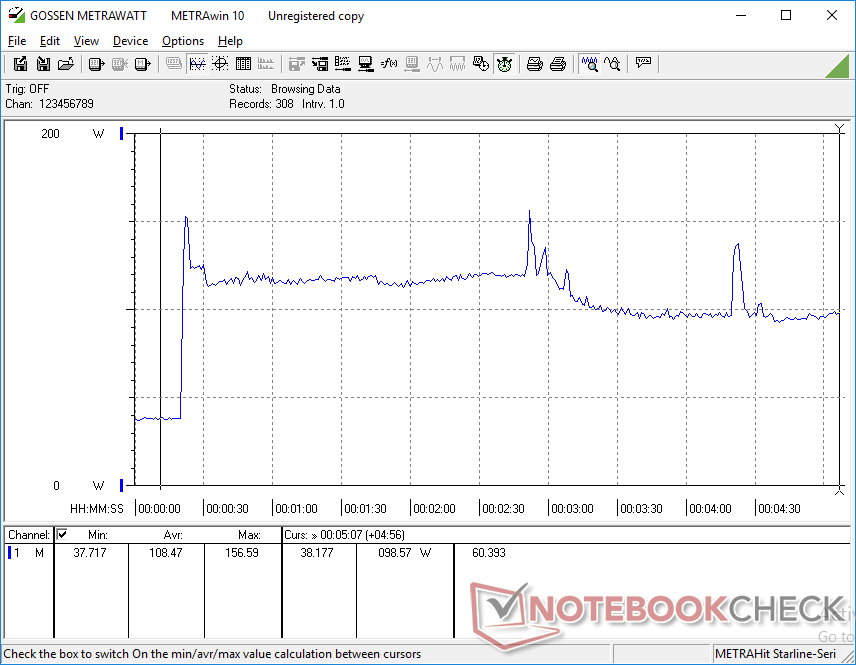
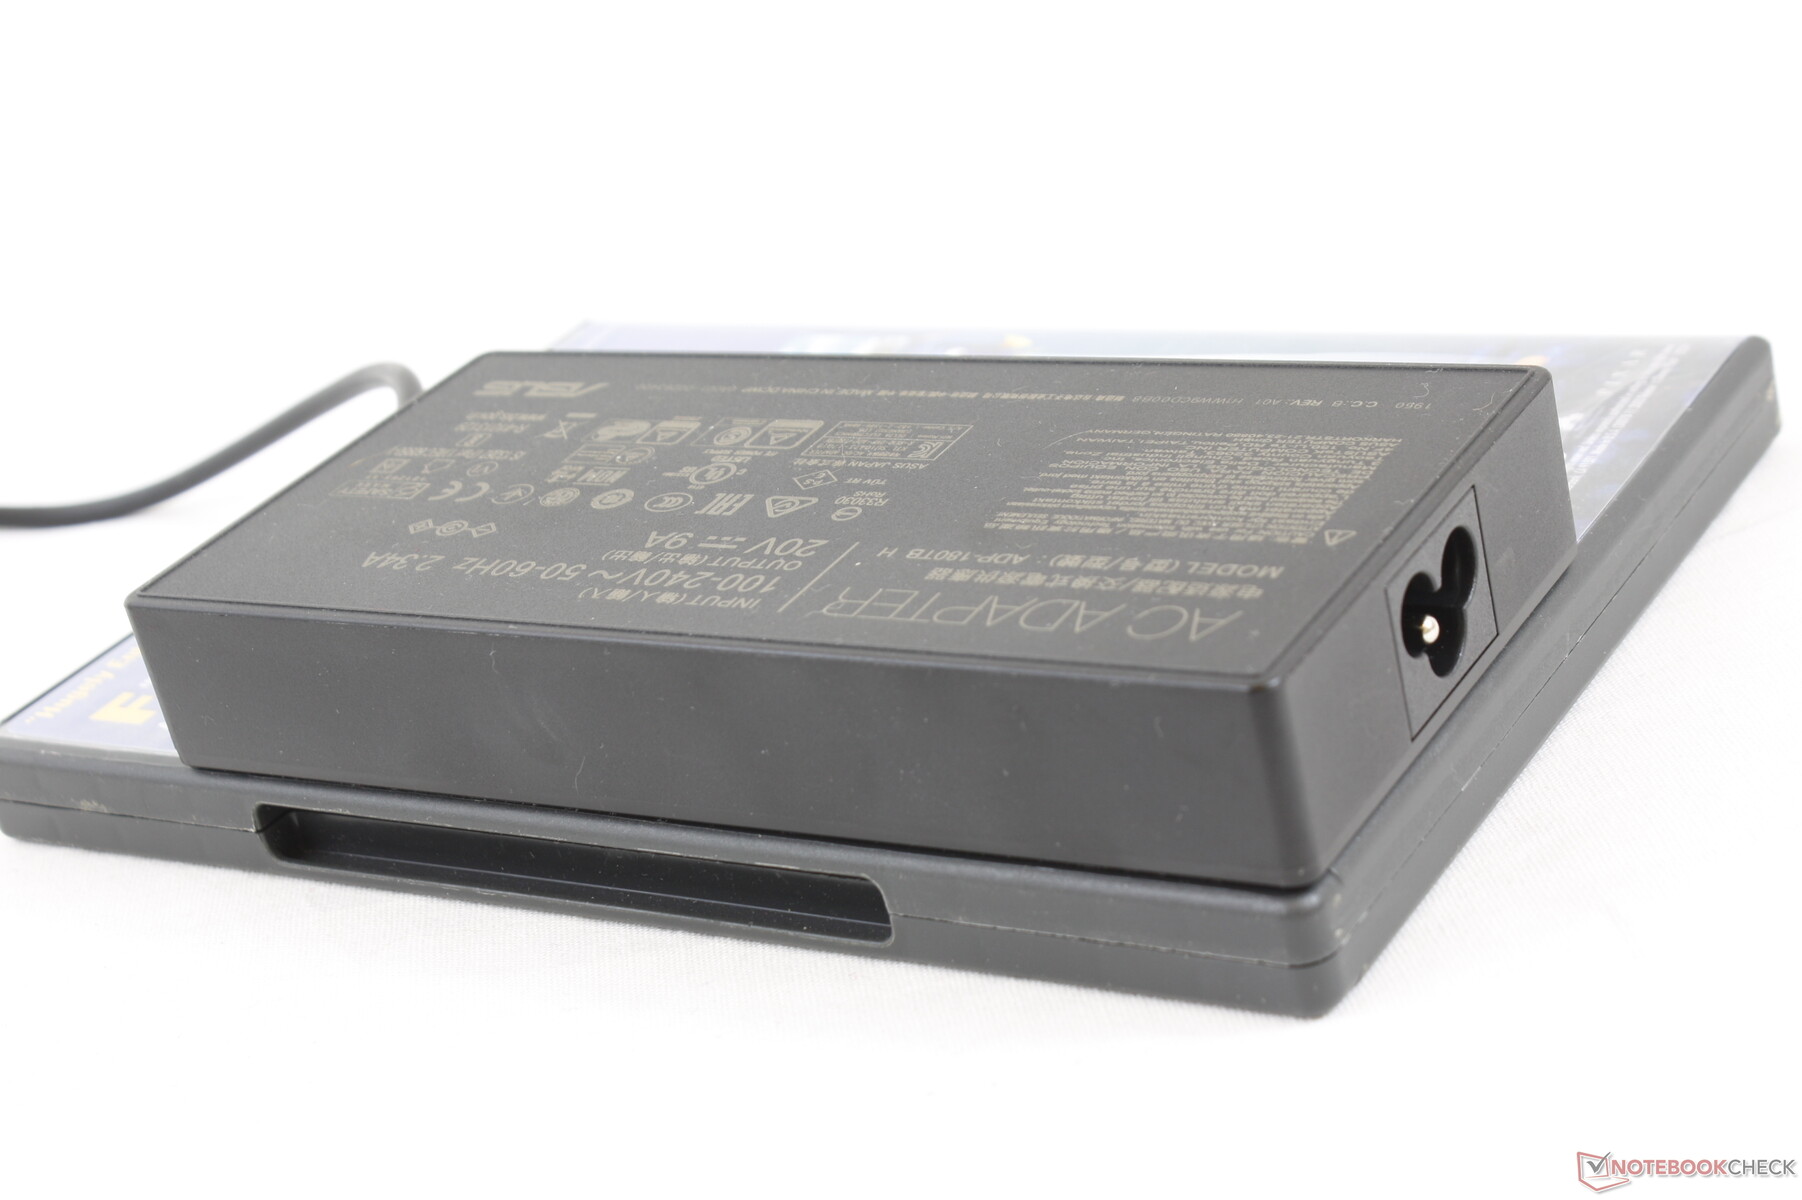
We're able to record a maximum consumption of 156.6 W from the medium-sized (~15 x 7.2 x 2.3 cm) 180 W AC adapter when running both Prime95 and FurMark simultaneously. However, this high of a consumption is only temporary as shown by our graphs below. Power consumption when running only Prime95 is not constant either which corroborates with our CineBench loop test results and variable clock rates mentioned above.
Users will still be able to recharge the system at a decent rate when gaming or running extreme loads.
| Off / Standby | |
| Idle | |
| Load |
|
Key:
min: | |
| Asus Zephyrus G14 GA401IV R9 4900HS, GeForce RTX 2060 Max-Q, Intel SSD 660p 1TB SSDPEKNW010T8, IPS, 1920x1080, 14" | Asus ROG Zephyrus M15 GU502GU-XB74 i7-9750H, GeForce GTX 1660 Ti Mobile, Intel SSD 660p SSDPEKNW512G8, IPS, 1920x1080, 15.6" | MSI GS65 Stealth 9SG i7-9750H, GeForce RTX 2080 Max-Q, Samsung SSD PM981 MZVLB512HAJQ, IPS, 1920x1080, 15.6" | MSI Prestige 14 A10SC-009 i7-10710U, GeForce GTX 1650 Max-Q, Samsung SSD PM981 MZVLB1T0HALR, IPS, 3840x2160, 14" | Razer Blade Stealth i7-1065G7 Iris Plus i7-1065G7, Iris Plus Graphics G7 (Ice Lake 64 EU), Samsung SSD PM981 MZVLB256HAHQ, IPS, 1920x1080, 13.3" | Dell G7 7590 i7-9750H, GeForce RTX 2060 Mobile, Toshiba BG3 KBG30ZMS256G, IPS, 1920x1080, 15.6" | |
|---|---|---|---|---|---|---|
| Power Consumption | -117% | -86% | 13% | 36% | -74% | |
| Idle Minimum * (Watt) | 5.5 | 17.6 -220% | 18.3 -233% | 5.2 5% | 5.9 -7% | 11.2 -104% |
| Idle Average * (Watt) | 9.3 | 24.7 -166% | 22 -137% | 12.2 -31% | 8.1 13% | 16.3 -75% |
| Idle Maximum * (Watt) | 15.8 | 56.3 -256% | 28.8 -82% | 14.3 9% | 11.2 29% | 46.2 -192% |
| Load Average * (Watt) | 92.2 | 111.1 -20% | 93 -1% | 67 27% | 44.3 52% | 123.3 -34% |
| Witcher 3 ultra * (Watt) | 112.4 | 149 -33% | 142.6 -27% | 41.9 63% | 135.6 -21% | |
| Load Maximum * (Watt) | 156.6 | 170 -9% | 215.9 -38% | 67 57% | 50.2 68% | 181.5 -16% |
* ... smaller is better
Battery Life
(June 8, 2020: We have retested battery life on a second identical unit and results are significantly better this time around. This section has been updated to reflect these revised numbers).
Asus has managed to fit the same size battery capacity inside both of the 14-inch Zephyrus G14 and larger 15.6-inch Zephyrus M GU502GU. Runtimes are very long at 9.5 hours of real-world WLAN use to be longer than the larger competing Razer Blade 15 or Alienware m15. Just be sure to set the system to Silent mode or Power Saver mode to keep power consumption to a minimum.
Charging from empty to full capacity is slow at about 2.5 hours compared to 1.5 to 2 hours on most other gaming laptops. On the flip side, charging with third-party USB Type-C 65 W adapters is possible unlike on most other gaming laptops. Although the battery will still drain when gaming and the recharge rate will not be as fast as the dedicated AC adapter, the option is definitely appreciated especially when traveling.
| Asus Zephyrus G14 GA401IV R9 4900HS, GeForce RTX 2060 Max-Q, 76 Wh | Asus ROG Zephyrus M15 GU502GU-XB74 i7-9750H, GeForce GTX 1660 Ti Mobile, 76 Wh | Razer Blade 15 GTX 1660 Ti i7-9750H, GeForce GTX 1660 Ti Mobile, 65 Wh | MSI GS65 Stealth 9SG i7-9750H, GeForce RTX 2080 Max-Q, 82 Wh | Alienware m15 R2 P87F i7-9750H, GeForce RTX 2080 Max-Q, 76 Wh | MSI Prestige 14 A10SC-009 i7-10710U, GeForce GTX 1650 Max-Q, 52 Wh | |
|---|---|---|---|---|---|---|
| Battery runtime | -41% | -43% | -37% | -52% | -23% | |
| Reader / Idle (h) | 19 | 7.1 -63% | 9.2 -52% | 9.9 -48% | ||
| WiFi v1.3 (h) | 9.6 | 4.5 -53% | 5.5 -43% | 6 -37% | 5.5 -43% | 5.9 -39% |
| Load (h) | 1.8 | 1.7 -6% | 0.7 -61% | 2.1 17% |
Pros
Cons
Verdict: Performance at all Cost
All those AMD slides and benchmark leaks comparing the Ryzen 9 to the Core i9 have turned out to be true; the 7 nm Ryzen 9 4900HS will outperform the 14 nm Core i9-9880H in multi-threaded workloads by relatively wide margins while being on par with the best that the Core i9-9980HK has to offer. When considering that the fastest mobile AMD CPU just this last year was the Ryzen 7 3750H, the new Ryzen 9 4900HS represents a significant leap in both performance and performance-per-Watt. Intel will have a lot of catching up to do when they launch their competing 10th gen Comet Lake-H series in the coming months.
Other than the new AMD processor, we're astounded by the fact that Asus was able to fit so much computing power in a narrow-bezel 14-inch chassis without resorting to heavy throttling. We're talking faster-than-Core i9 performance in what is essentially a subnotebook. The easy serviceability, upgradeable RAM and SSD, 120 Hz FreeSync display, unique Micro-LED outer lid lighting and USB Type-C charging are all icing on the cake to make the Zephyrus G14 even more unique than it already is.
There are a small number of important drawbacks. Firstly, fan noise is loud and it pulses more than we would like which will be distracting if gaming without a pair of headphones. Secondly, the lid could be stiffer as it flexes more even when compared to Asus' own ZenBook laptops. And lastly, the 20 ms black-white display response time is slower than on most 15.6-inch gaming laptops where 3 ms and 5 ms panels have become commonplace. It feels amazing to be able to play games on such a small and powerful system, but the moderate ghosting and noticeable fan noise will quickly remind you of the current limitations.
If you travel a lot and can exploit the ludicrous speed within, then the performance of the Zephyrus G14 won't disappoint. The next closest alternatives would be the 13.3-inch Razer Blade Stealth or 14-inch MSI Prestige 14, but these systems come "only" with slower Core U CPUs and the GTX 1650 Max-Q GPU.
The Zephyrus G14 packs an incredible amount of power never before seen in this form factor. You'll slowly notice the drawbacks over time, but you might be willing to look past them when considering how much performance you're getting.
Asus Zephyrus G14 GA401IV
- 06/09/2020 v7 (old)
Allen Ngo
Price comparison
