 Deutsch
 English
 Español
 Français
 Italiano
 Nederlands
 Polski
 Português
 Русский
 Türkçe
 Svenska
 Chinese
 Magyar
Lenovo Legion Y740-15ICH (i7-8750H, RTX 2070 Max-Q) Laptop Review
While last year’s Legion Y530 was a reasonably-priced (if not uninspiringly-styled) plastic alternative to the market’s more expensive leaders, the Y730 was a more disappointing newcomer. Although it upgraded the case to aluminum and added spiffy lighting effects, it lacked in some of the more critical areas for serious competition. Most notably, we regretted the underwhelming display with slow response times and no option for 120/144 Hz refresh rates, and we criticized the fact that the GTX 1050 Ti was the only GPU offered—while even the Y530 included an optional GTX 1070. Apart from some other quibbles, we were otherwise relatively happy with the general package, lauding good thermal management, narrow screen bezels, strong sustained CPU performance, and low noise levels.
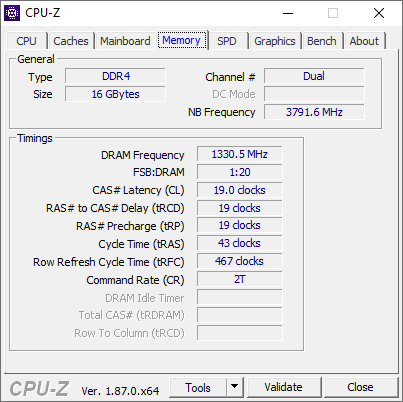
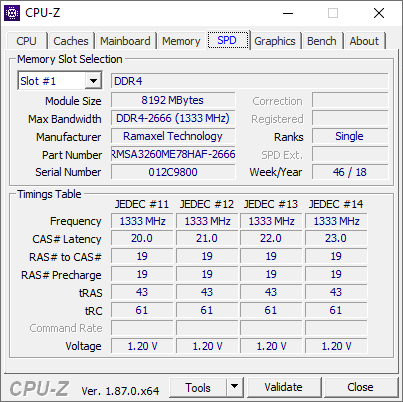
Lenovo has heard our complaints apparently, as with the inception of the Y740-15ICHg we find not only a significantly more powerful RTX 2070 Max-Q GPU, but also an NVIDIA G-Sync Dolby Vision 144 Hz display, enhanced “Lenovo Legion Coldfront” cooling system, and improved Dolby Atmos speaker system. All of this is accompanied by an Intel Core i7-8750H hexacore CPU, 16 GB dual-channel DDR4 RAM, and a dual-storage 256 GB NVMe + 1 TB HDD configuration. The price tag: around $1,990 MSRP, or roughly $1,752 today after all available discounts straight from Lenovo.
Now, it’s time to see how it handles our unprecedented array of tests. Buckle up!
Case
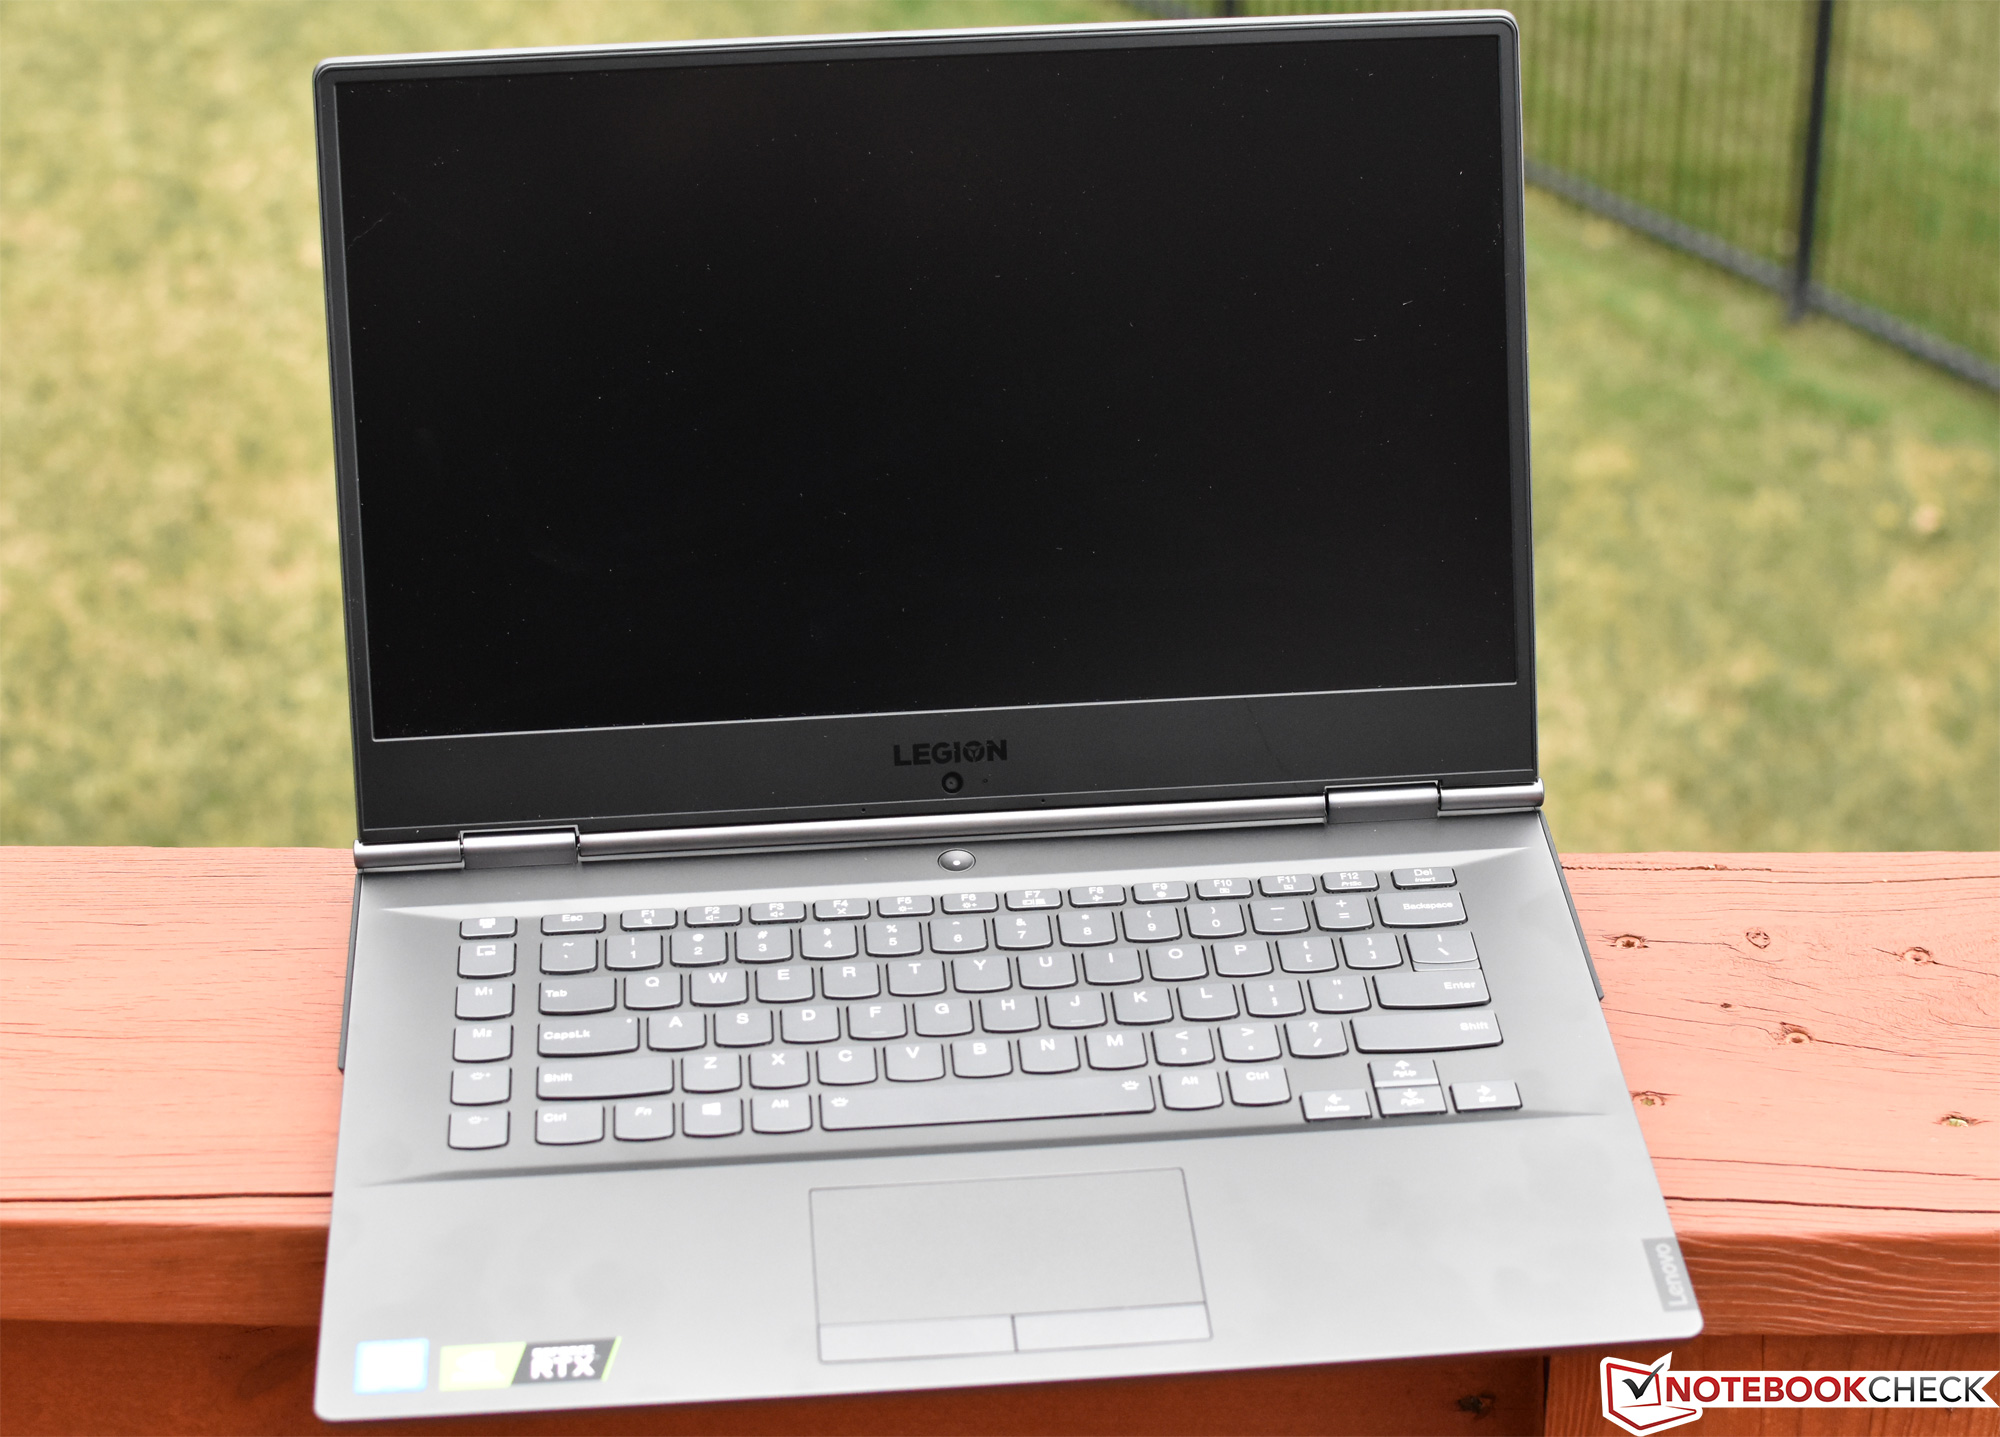
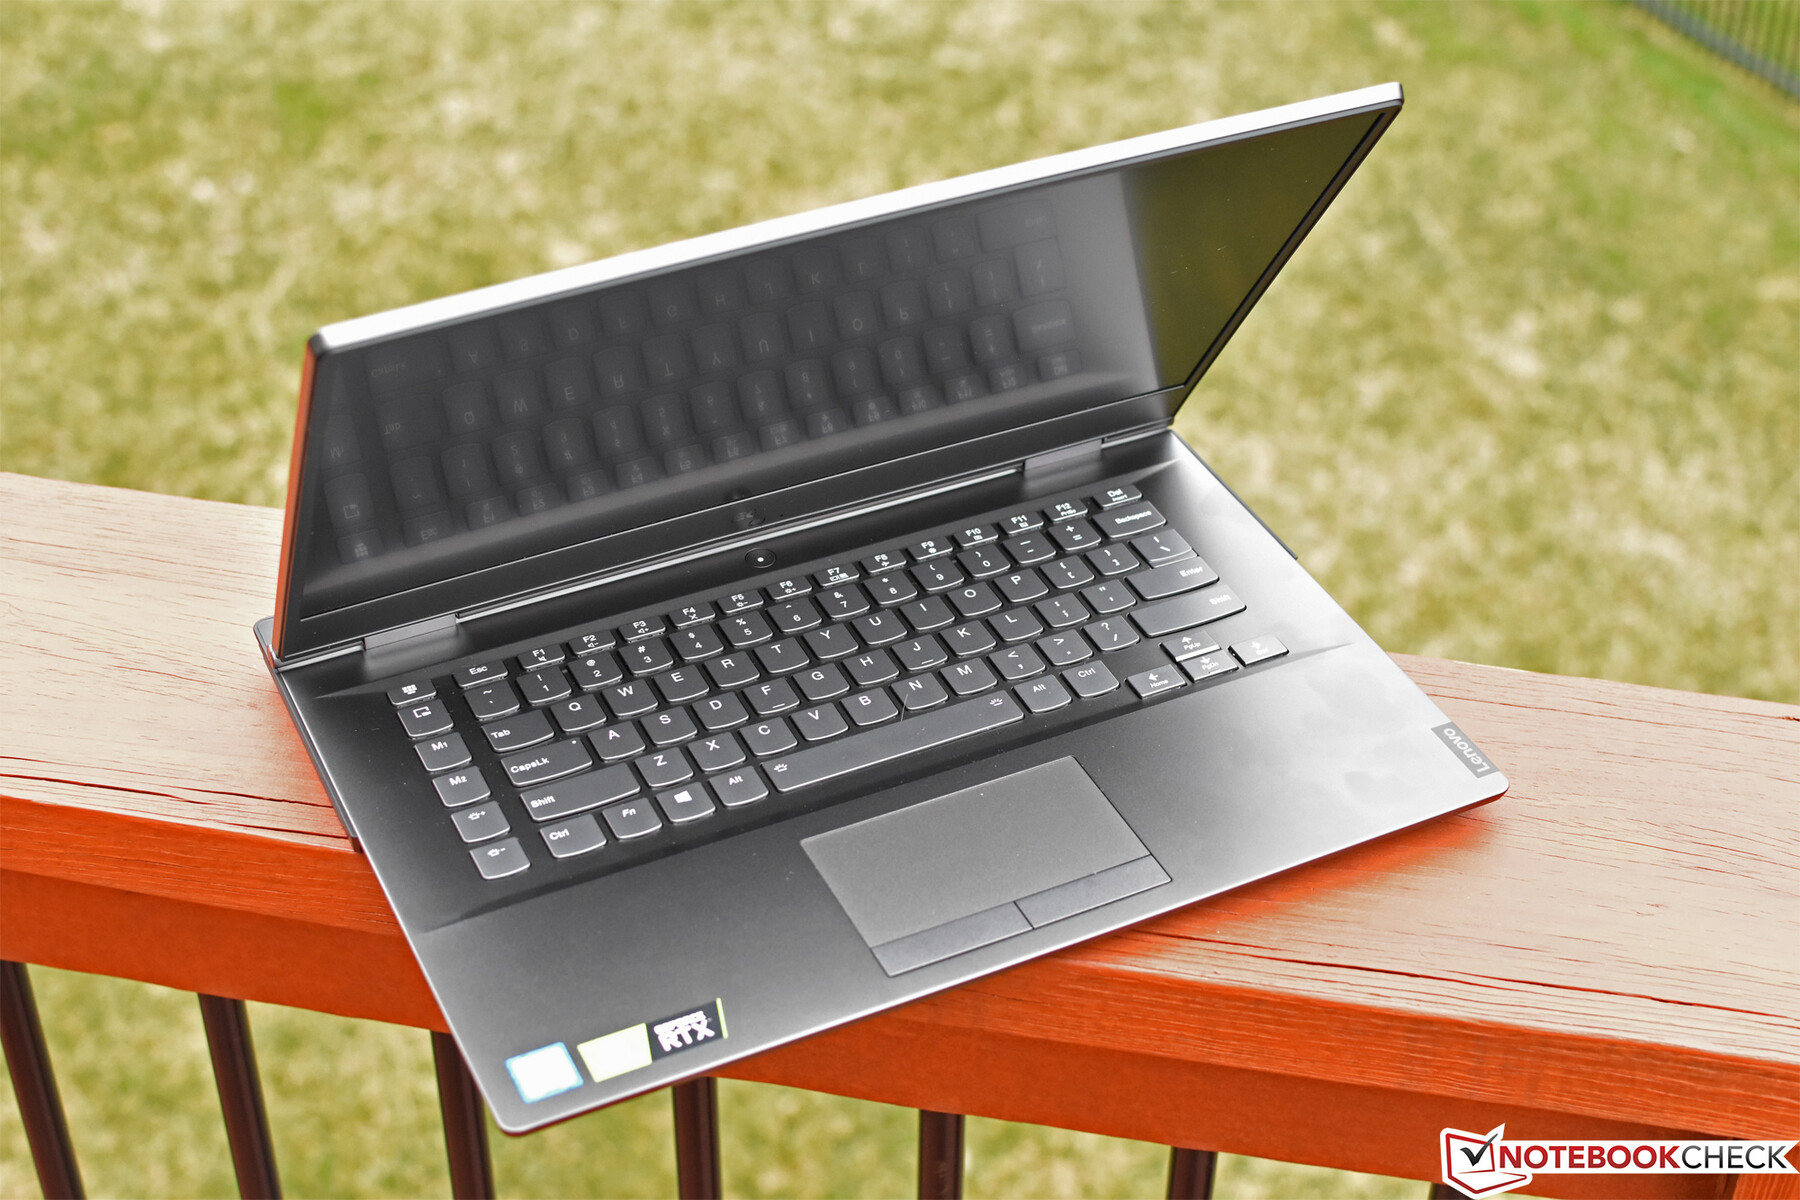
The case remains identical to that of the Legion Y730-15ICH, and as such, all of the same pros and cons still apply. Styling is saturated by a uniform design language and clean matte aluminum surfaces, which grants the Y740 a more mature aesthetic than many of its gaming-oriented peers. The narrow 8 mm bezels evoke a decidedly high-end XPS 15 vibe. Perhaps slightly gaudier is the return of the customizable Corsair iCUE lighting system, which provides per-key RGB lighting and extends to the side and rear cooling vents. Of course, this system can be entirely disabled or set to a professional-looking monochrome profile with the touch of a button.
As before, case stability isn’t the laptop’s strong suit. Although the base unit is stable on a surface and does a good job resisting twisting, it’s susceptible to moderate pressure applied near the center of the unit, and the materials overall seem quite a bit thinner and less robust than that of the competition (XPS 15, Razer Blade 15, et al). The lid, meanwhile, could almost be described as flimsy; it’s far more flexible than what we’d consider ideal, and the hinges—while somewhat tight—exhibit a bit of bounce when the laptop is in motion. The opening angle is good however, at over 180 degrees.
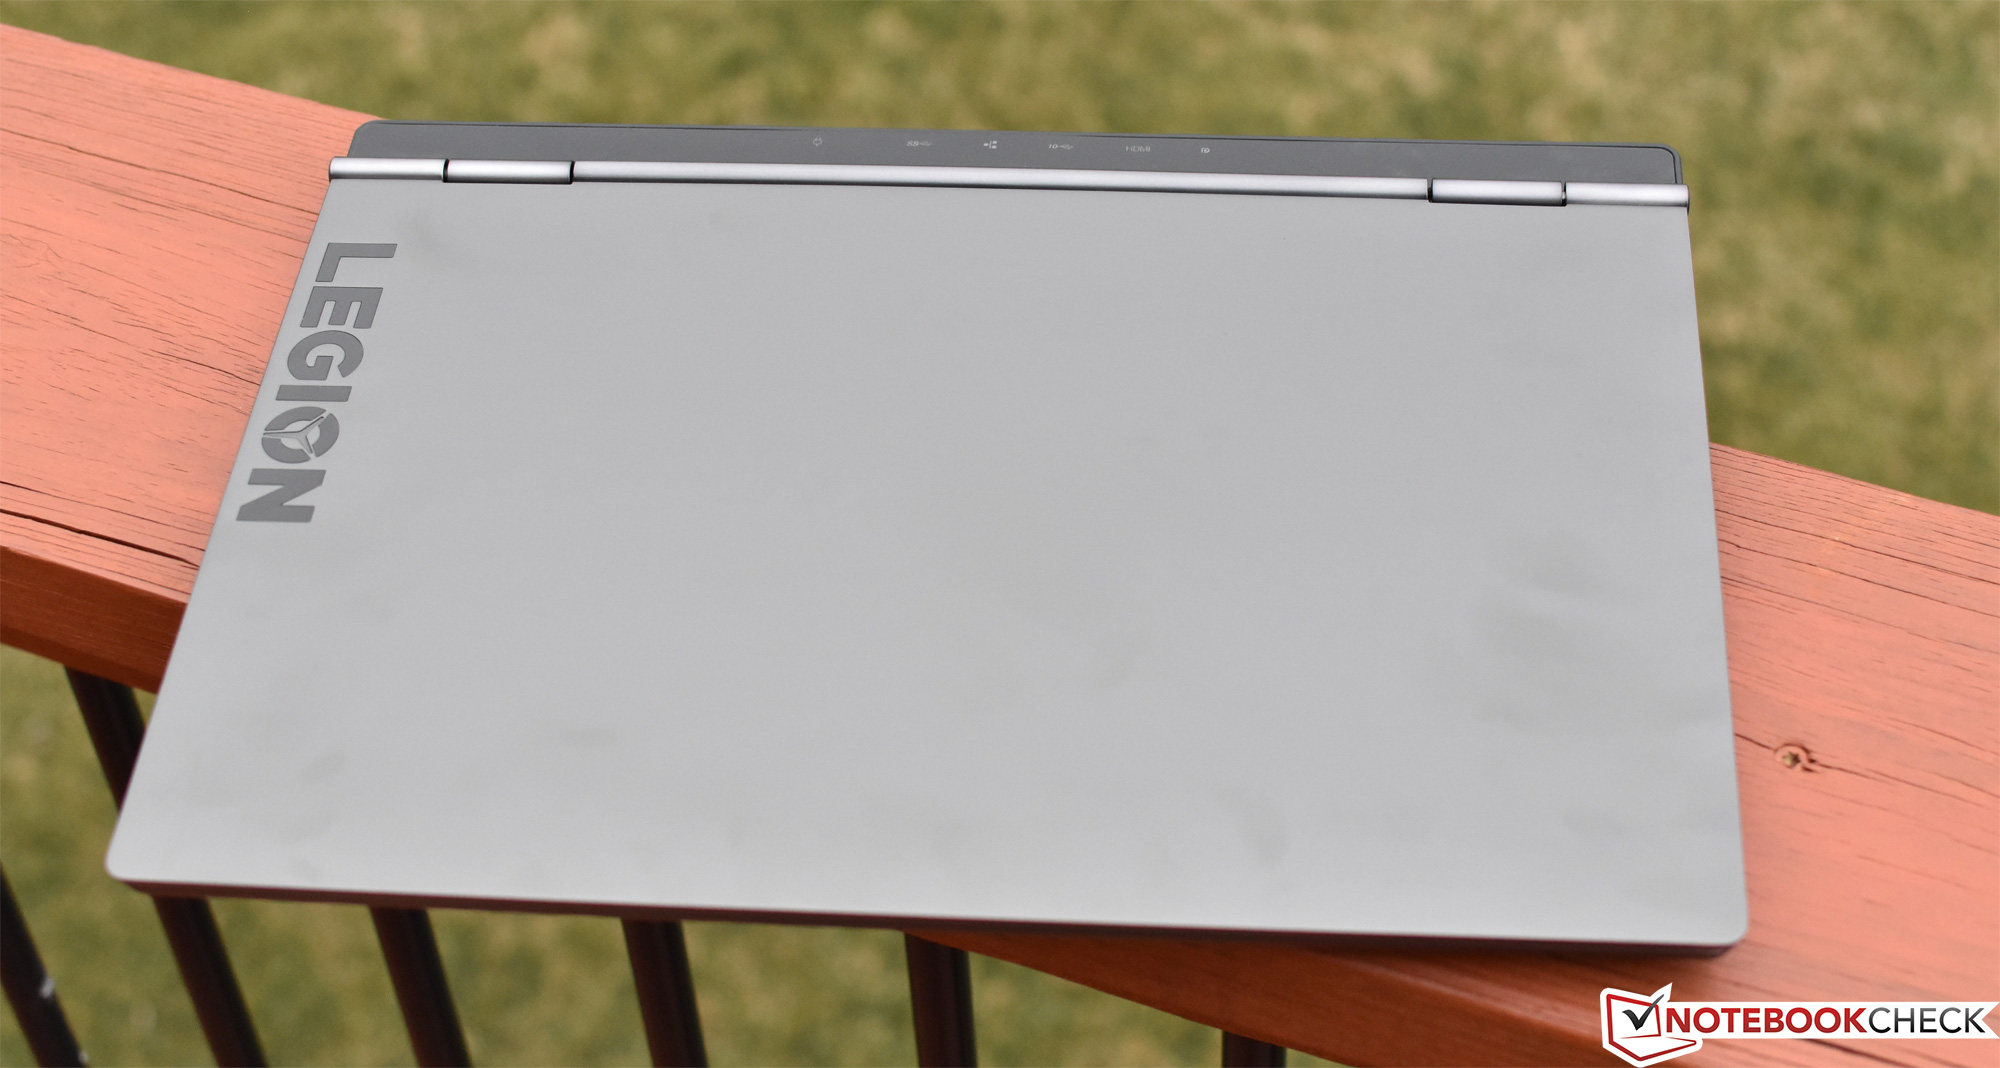

Our unit weighs in at 2.256 kg, which is right in the middle of the field of competitors, most of which are a bit lighter at around 2.1 – 2.2 kg. Although it doesn’t look all that large, the sizable “caboose” of the Legion Y740—located behind the display and hinge assembly—also makes for one of the larger footprints in today’s comparison field.
Connectivity
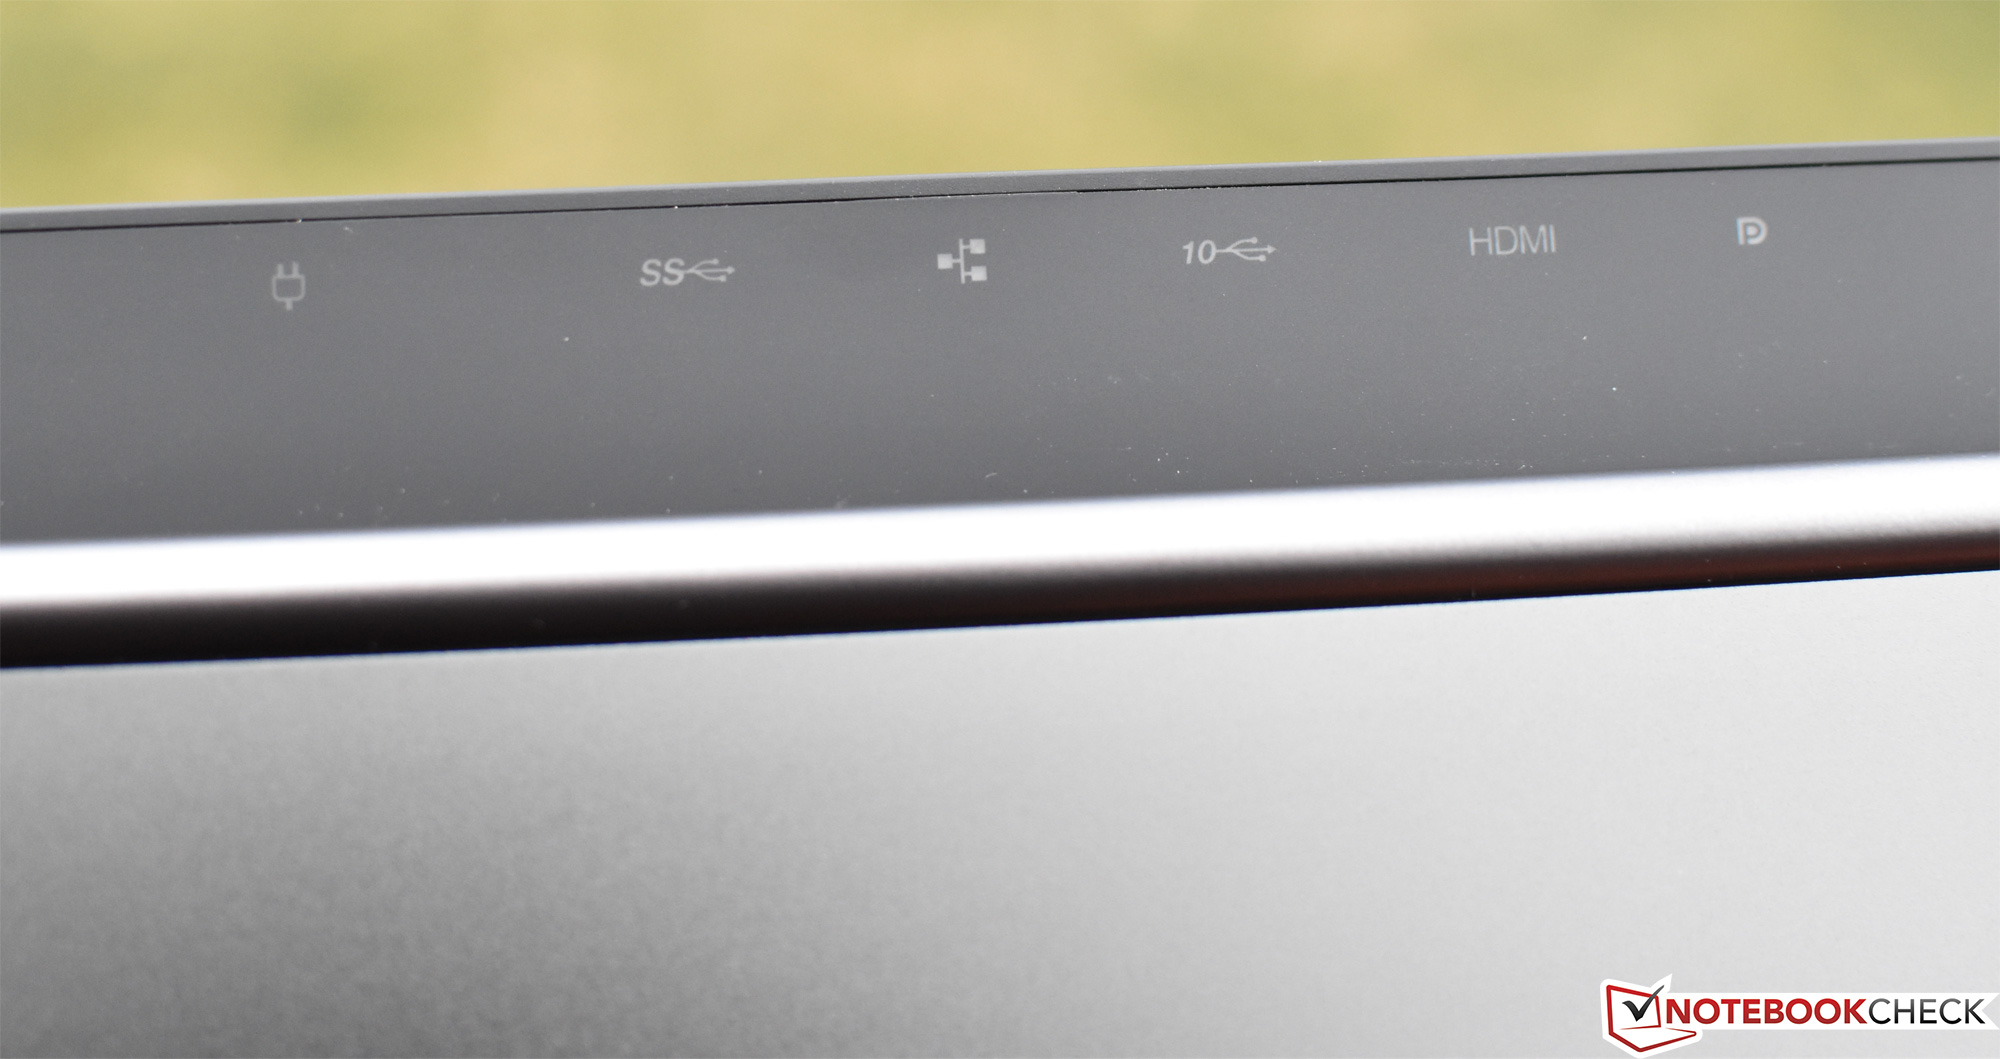
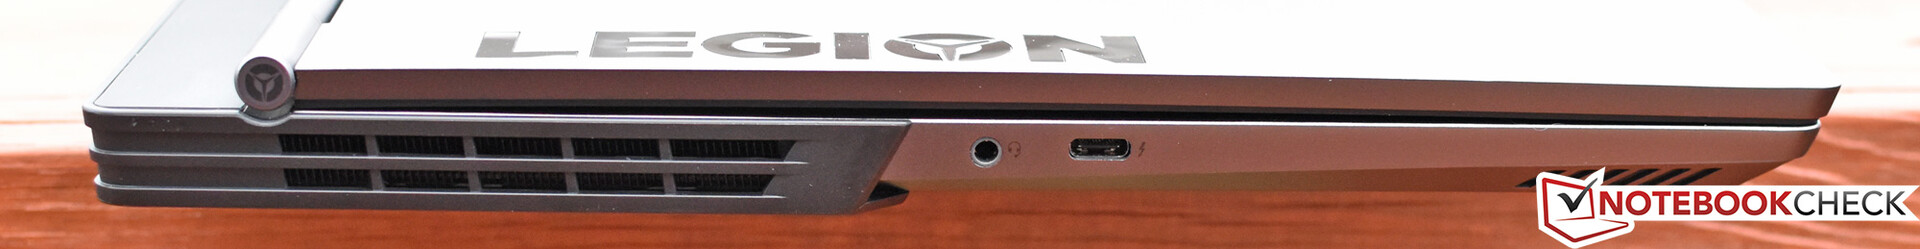
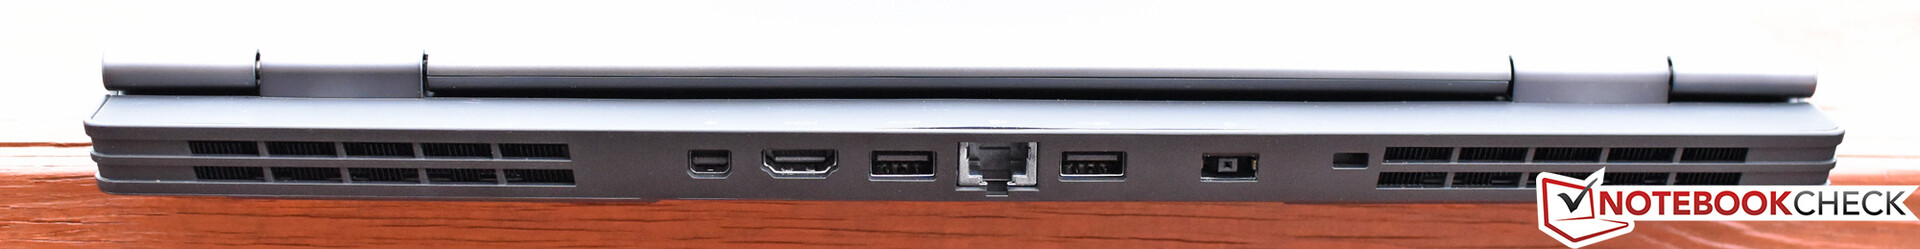
Once again, connectivity has not changed since the previous Y730-15ICH, which—apart from the lack of a card reader—leaves us satisfied. You get four total USB ports (including the USB Type-C Thunderbolt 3 port), plus HDMI and mini-DisplayPort for video output—along with, again, Thunderbolt 3 as a third option. A few ports populate the sides of the machine, but the vast majority are confined to the rear. However, they’re conveniently and clearly marked with LED labels on the aforementioned shelf that resides behind the display, which makes connecting cables easier than usual.

Communication
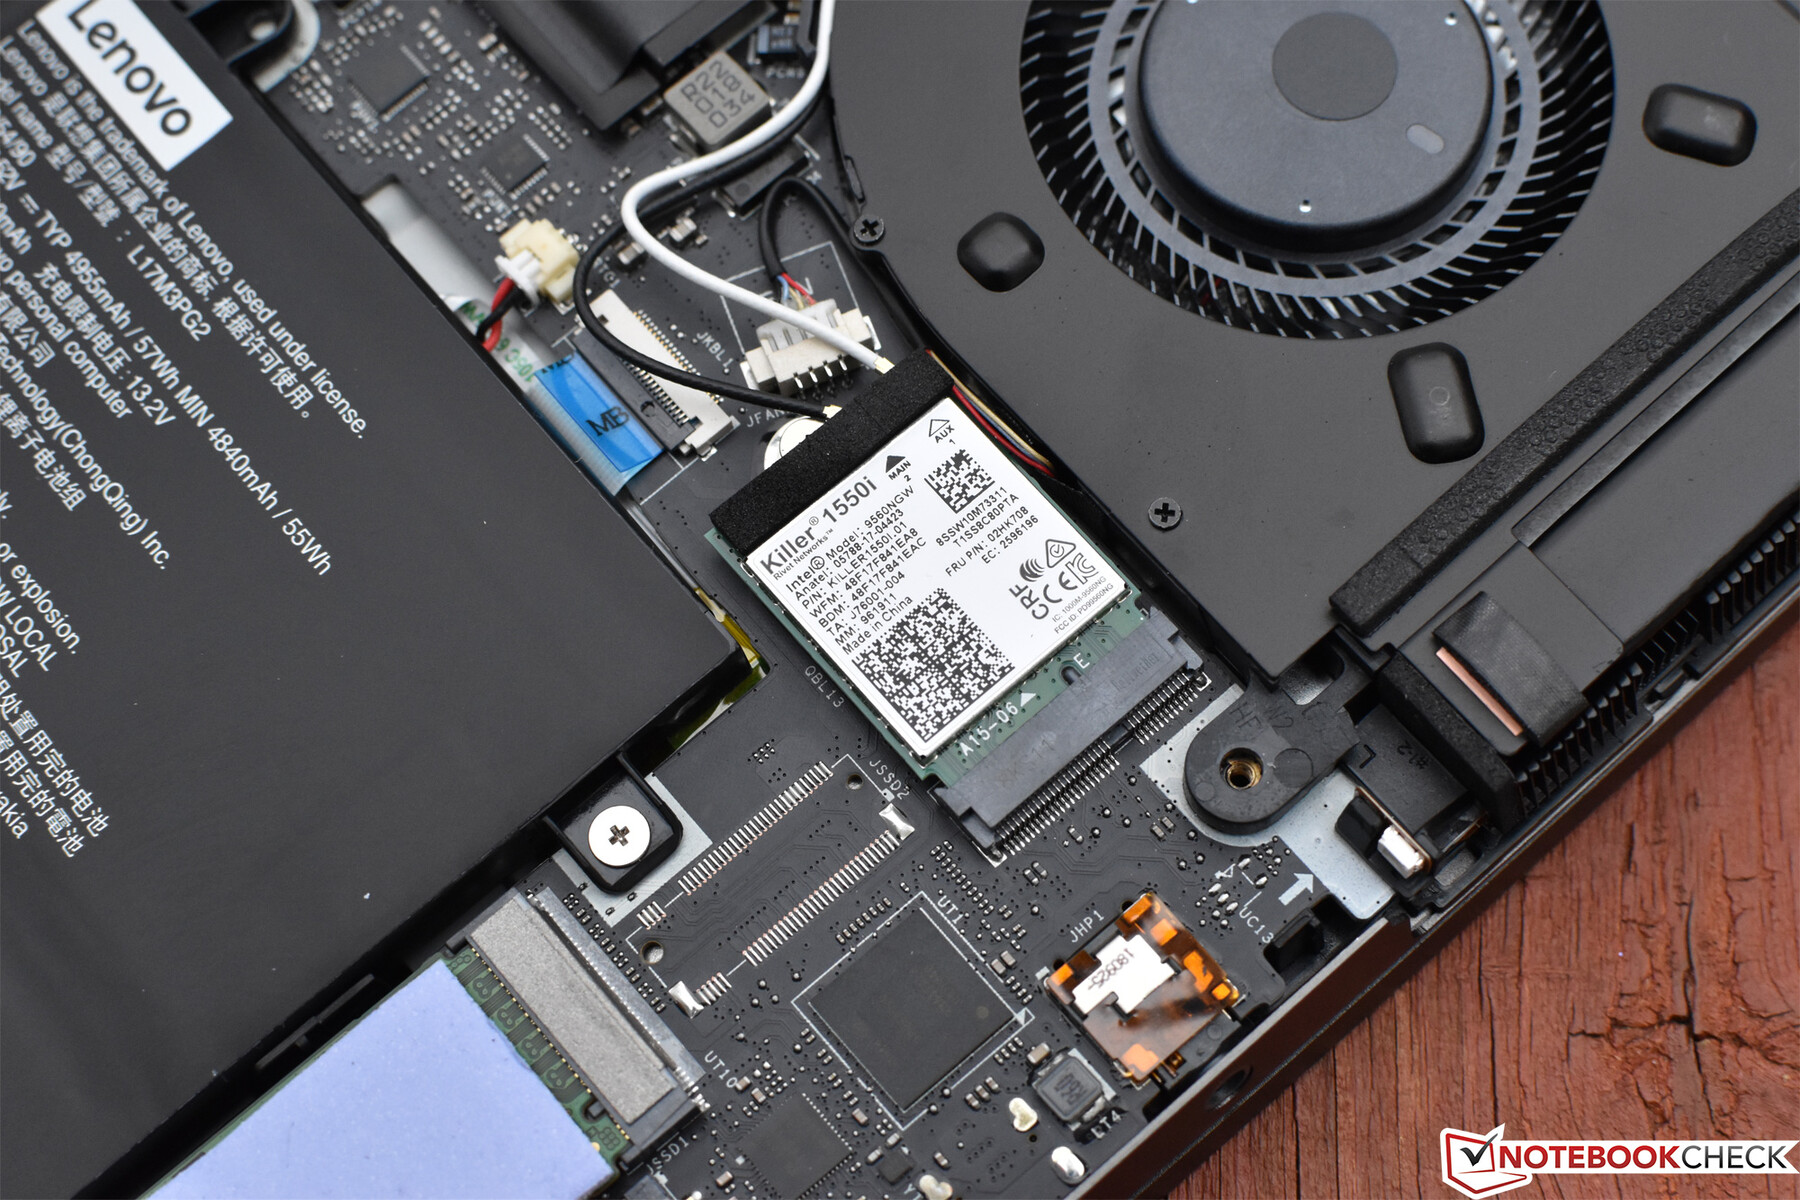
While the Legion Y730 was equipped with an Intel Wireless-AC 9560 adapter, the Y740 swaps this out for a Qualcomm Killer Wireless-AC 1550i. Both cards are similarly capable, generally posting performance values in line with each other. Today’s Y740, however, falls a little bit short of the competition, with 596 Mb/s and 588 Mb/s in our receive/transmit tests, respectively.
Accessories
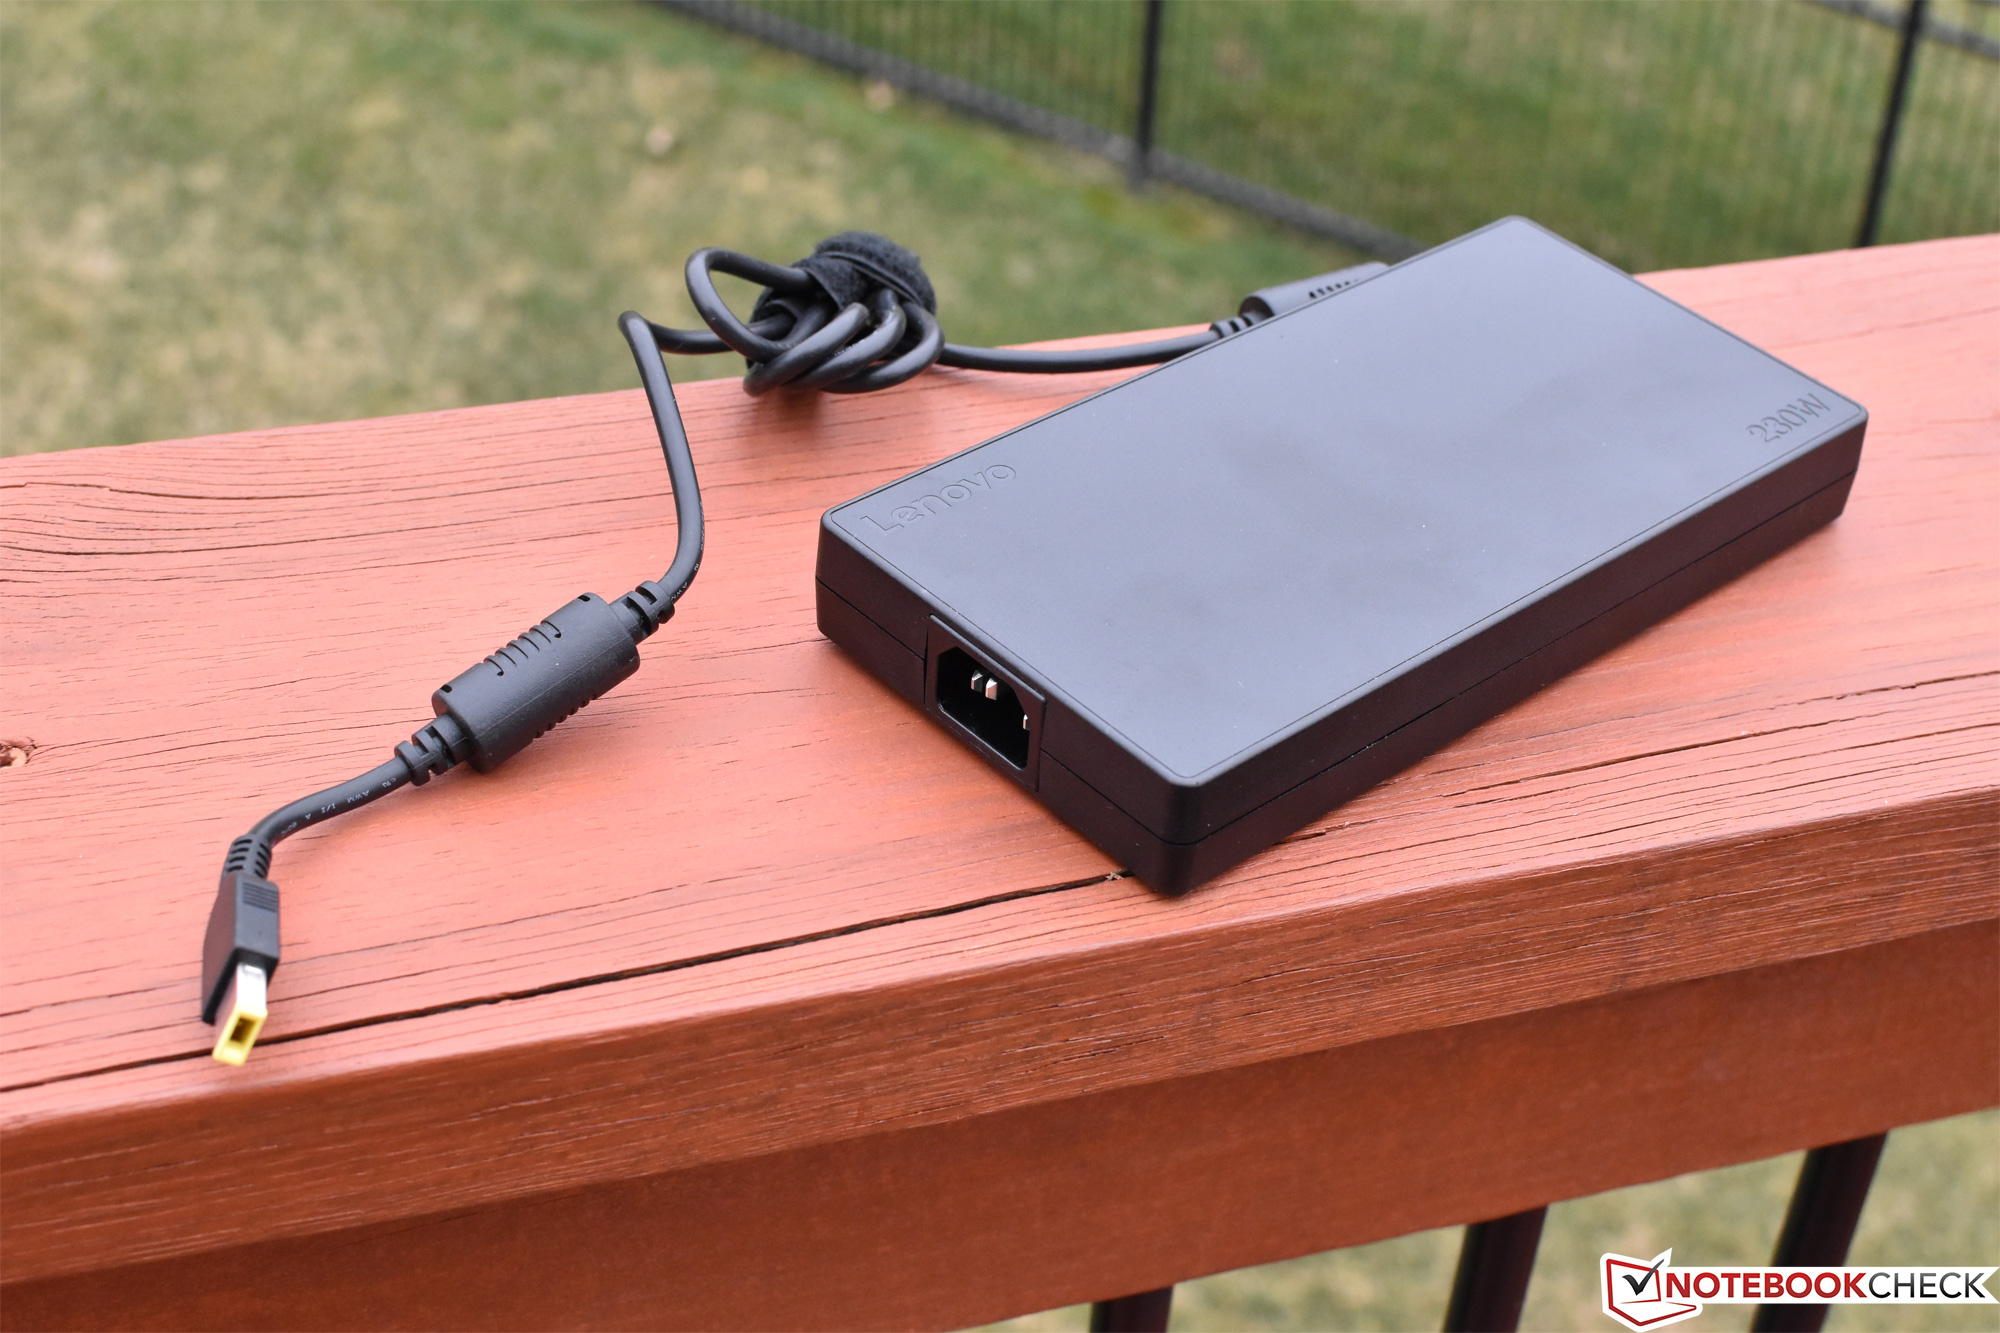
No accessories are included apart from the large 986 g 230 W AC adapter. A one-year depot warranty is included standard, though warranty upgrades are available directly from Lenovo at an added cost.
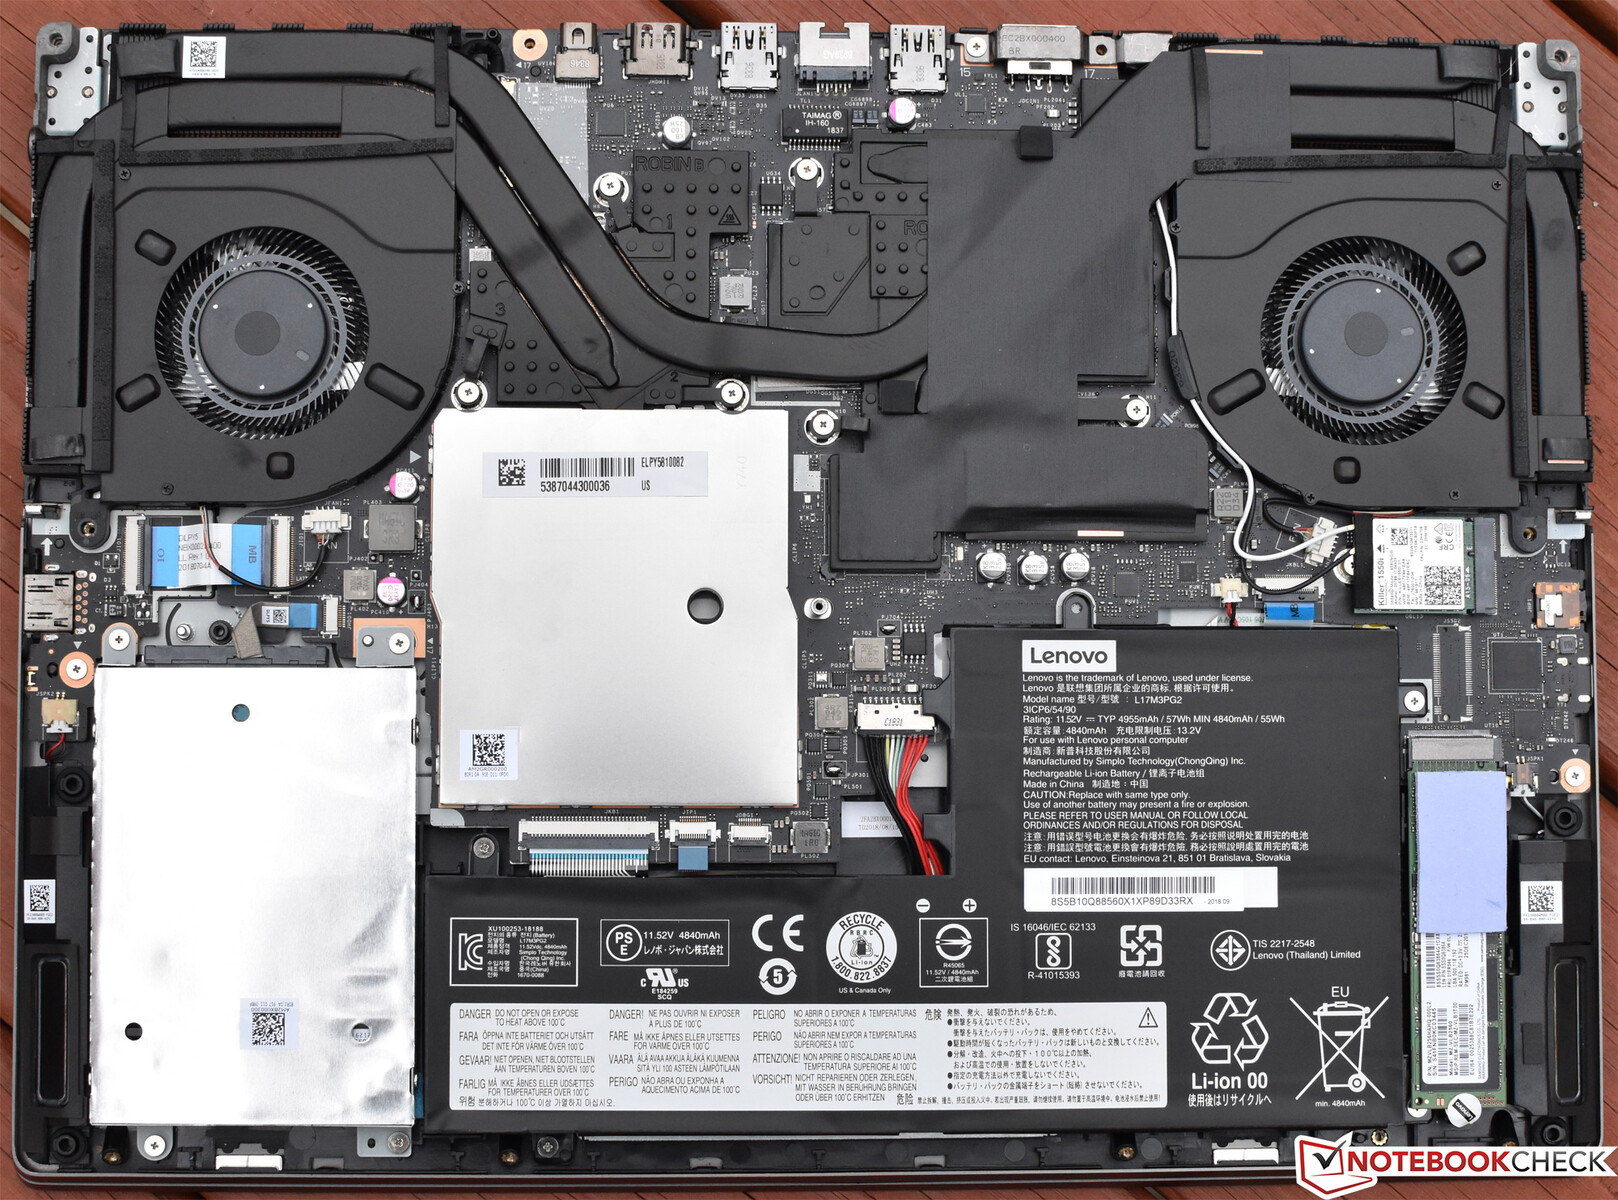
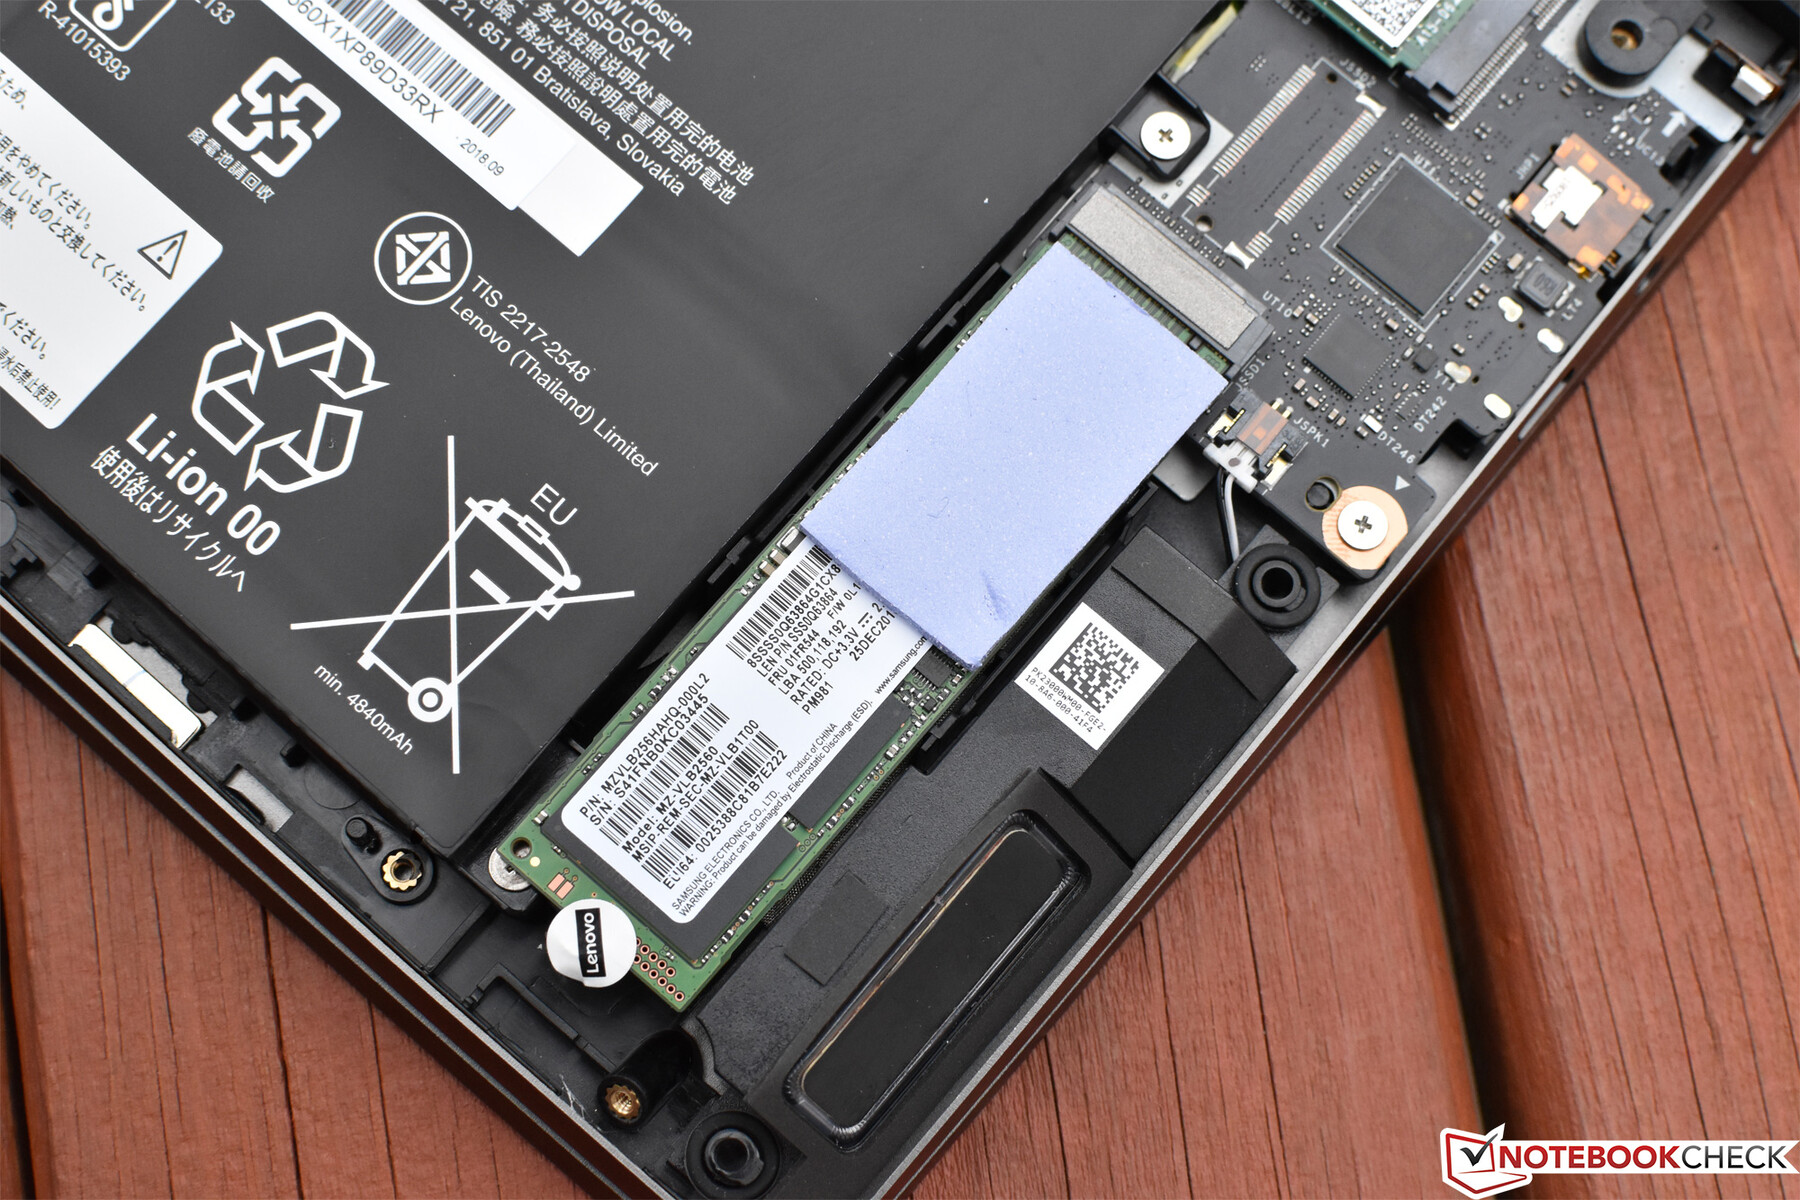
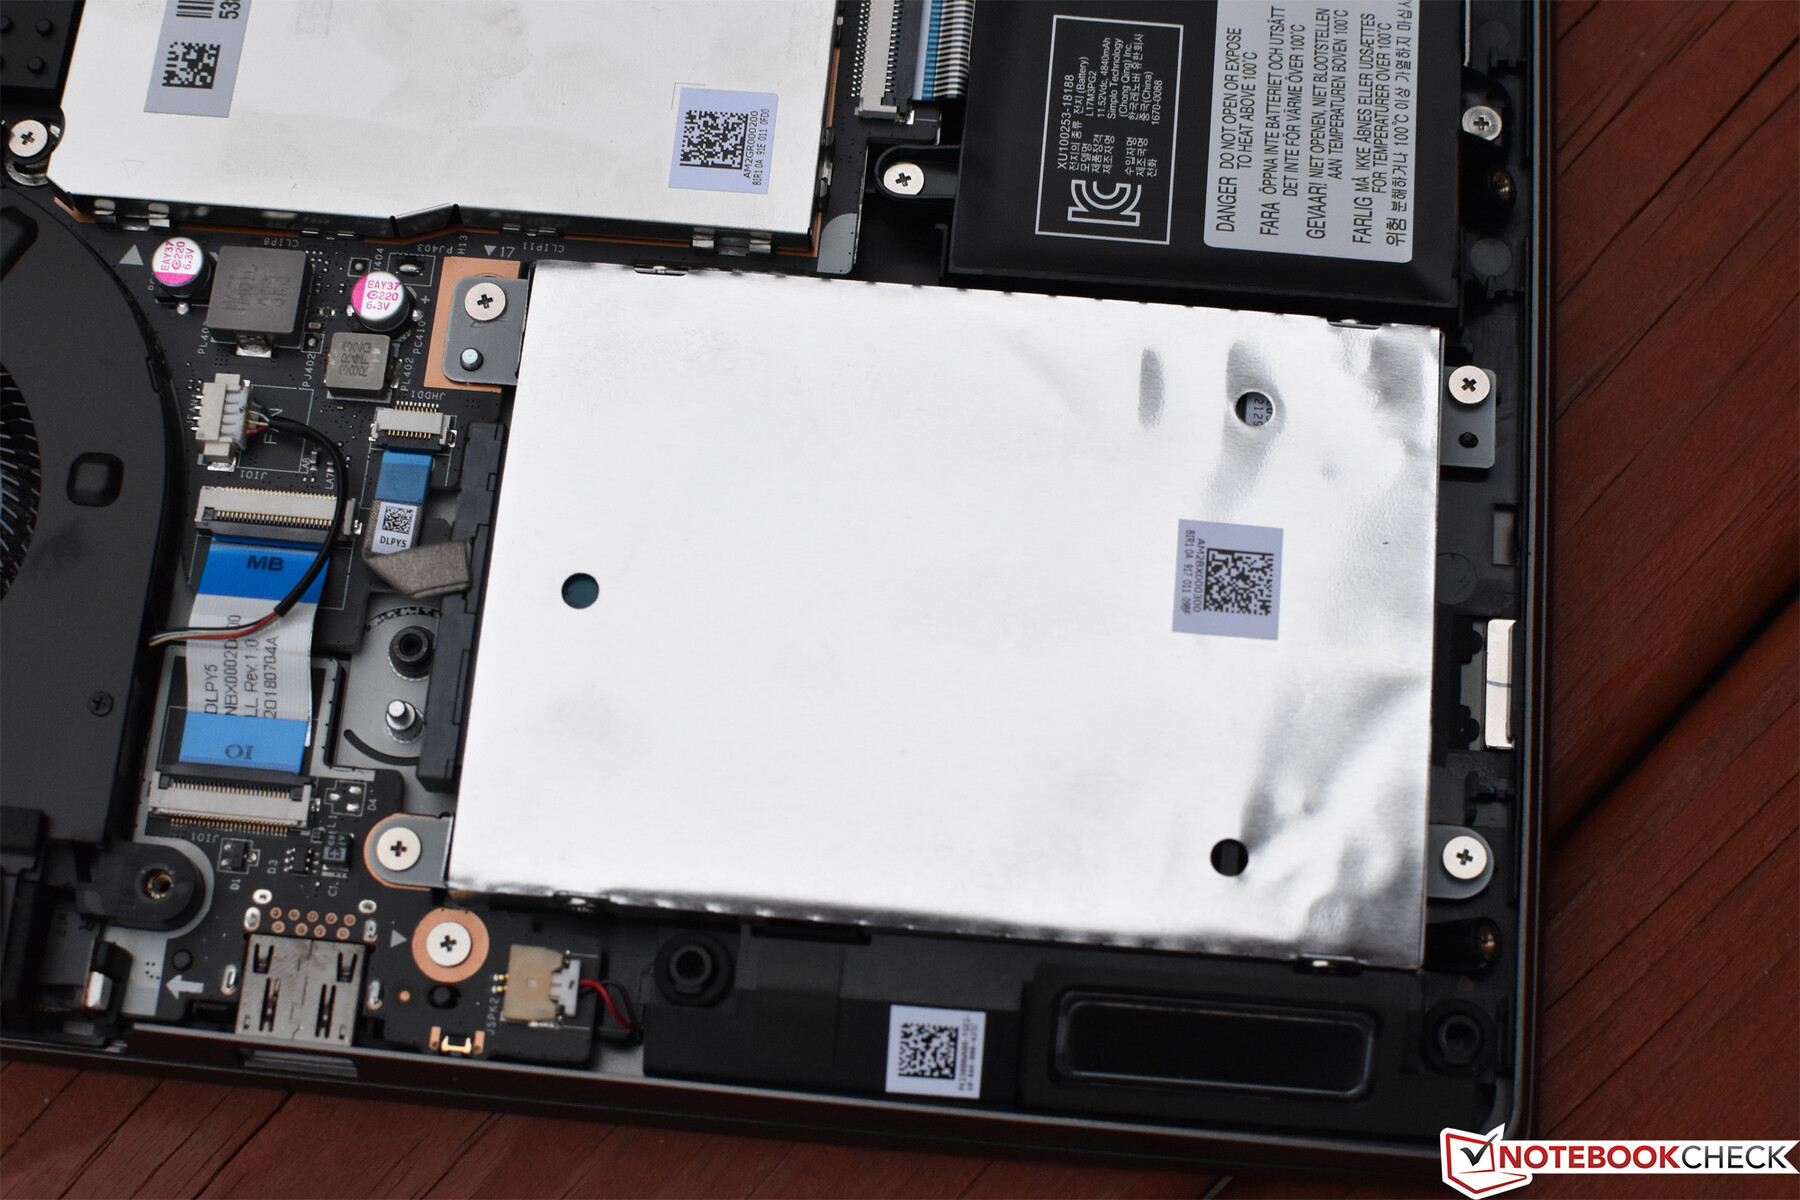
Maintenance
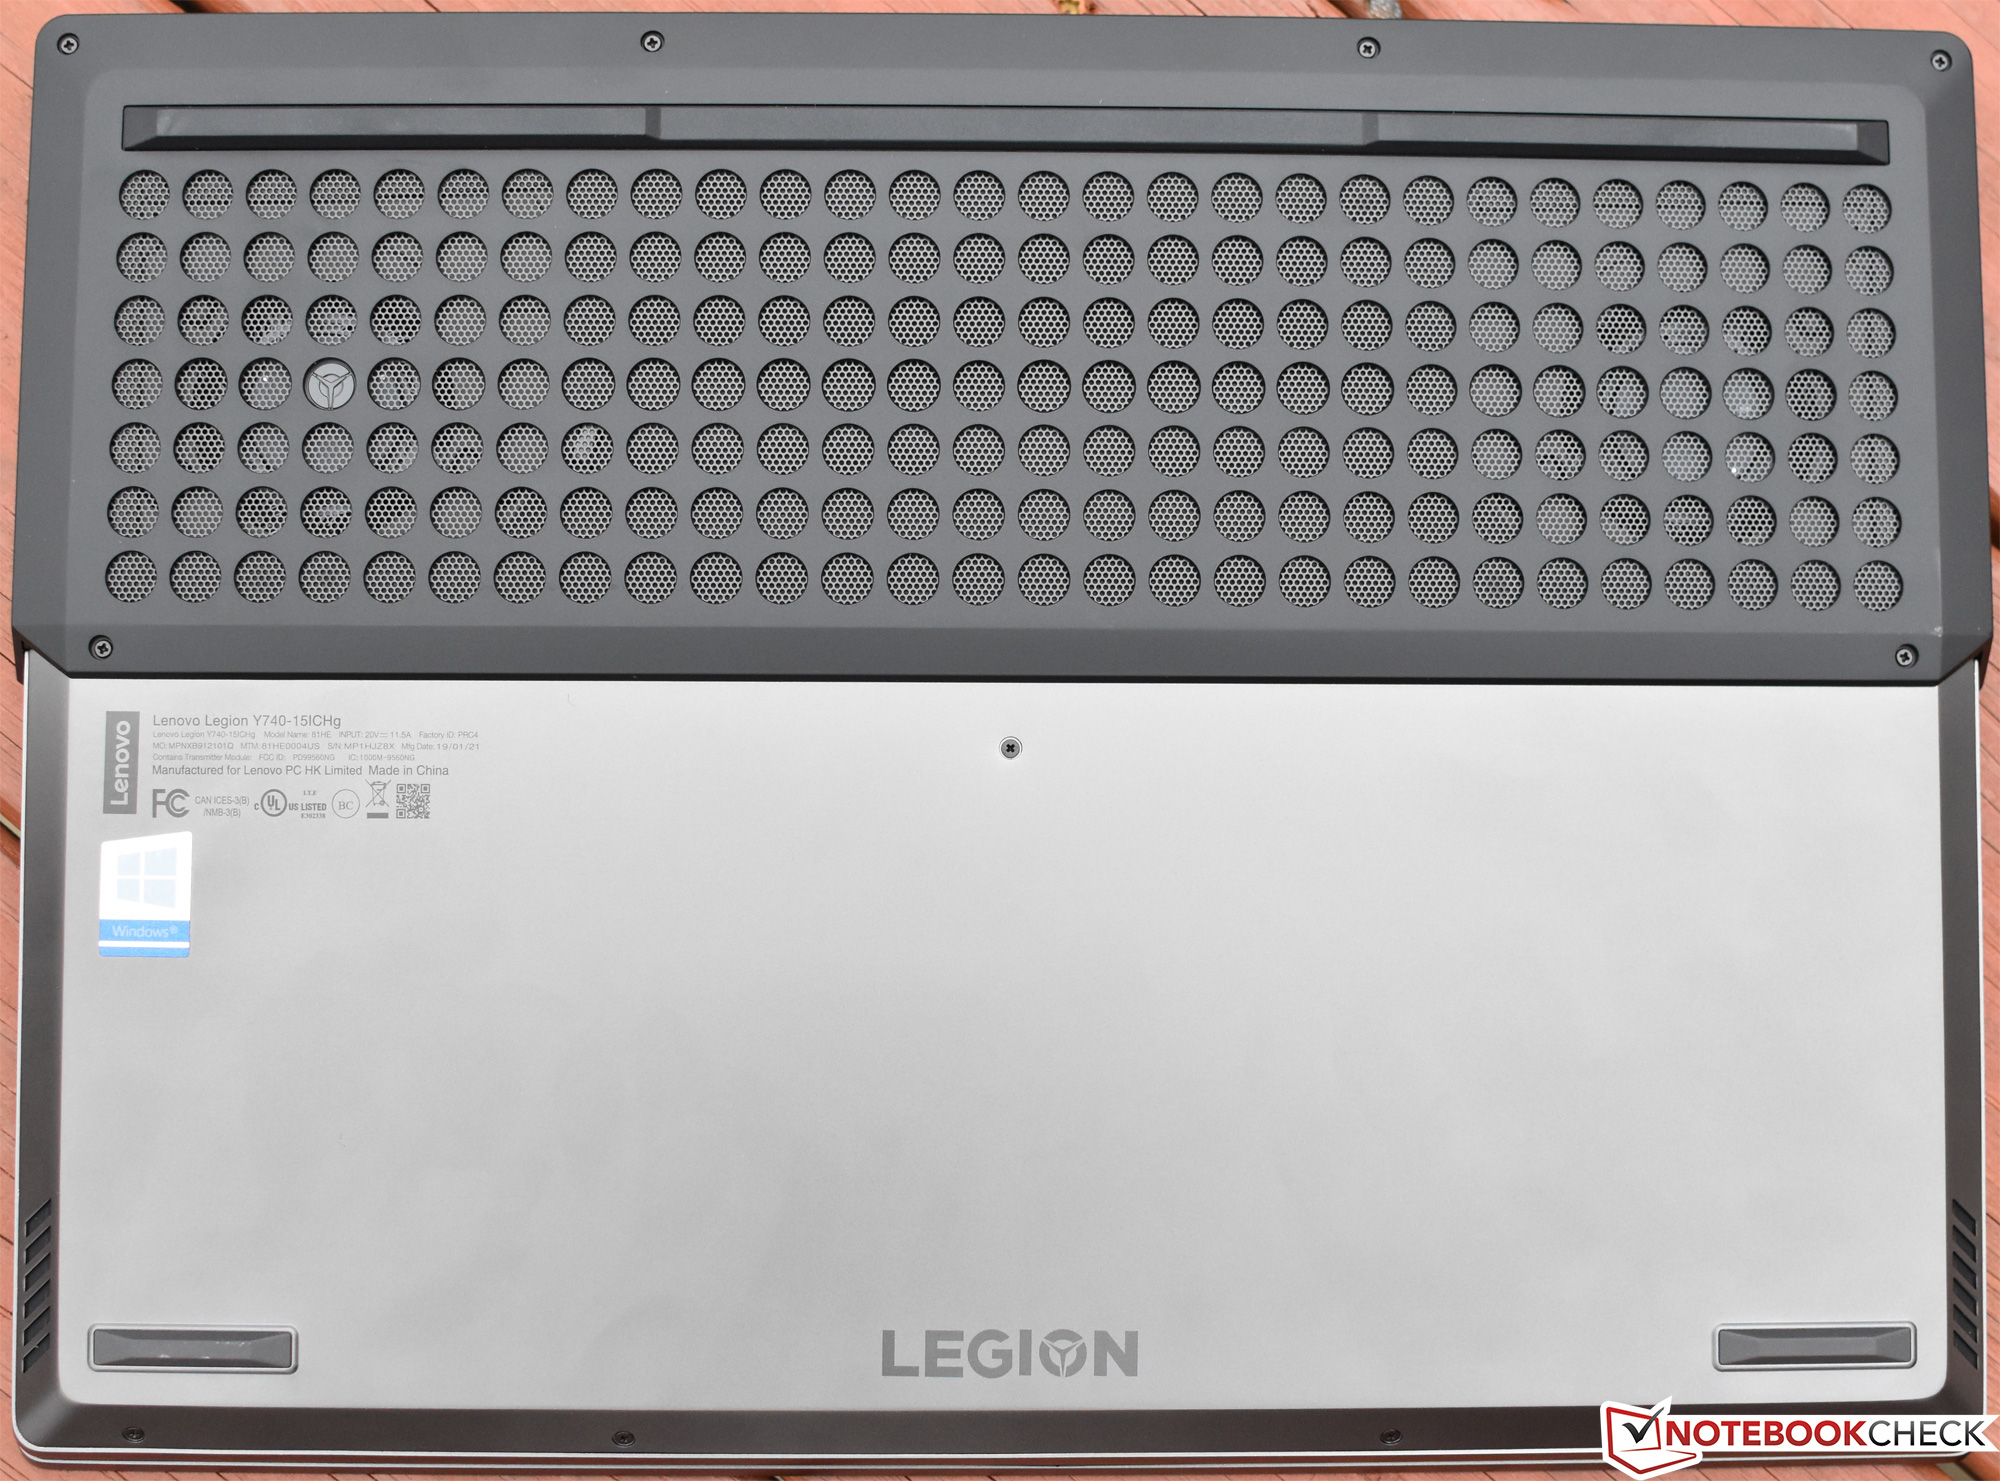
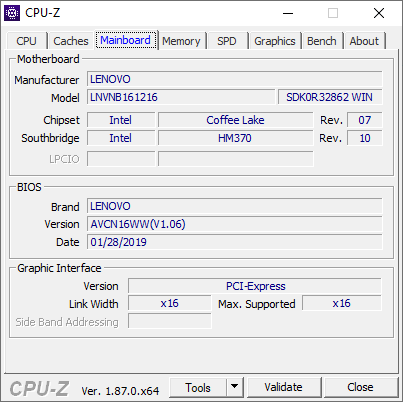
After 11 Phillips-head screws are removed from the underside, the bottom panel snaps off from around the perimeter of the shelf behind the display and exposes every replaceable component. You’ll notice that the internals are essentially identical to that of the Y730, right down to the supposedly improved cooling system. The RAM is still obscured by a metal shield, creating an extra step during upgrades (careful with it while removing it).
Input Devices
Keyboard
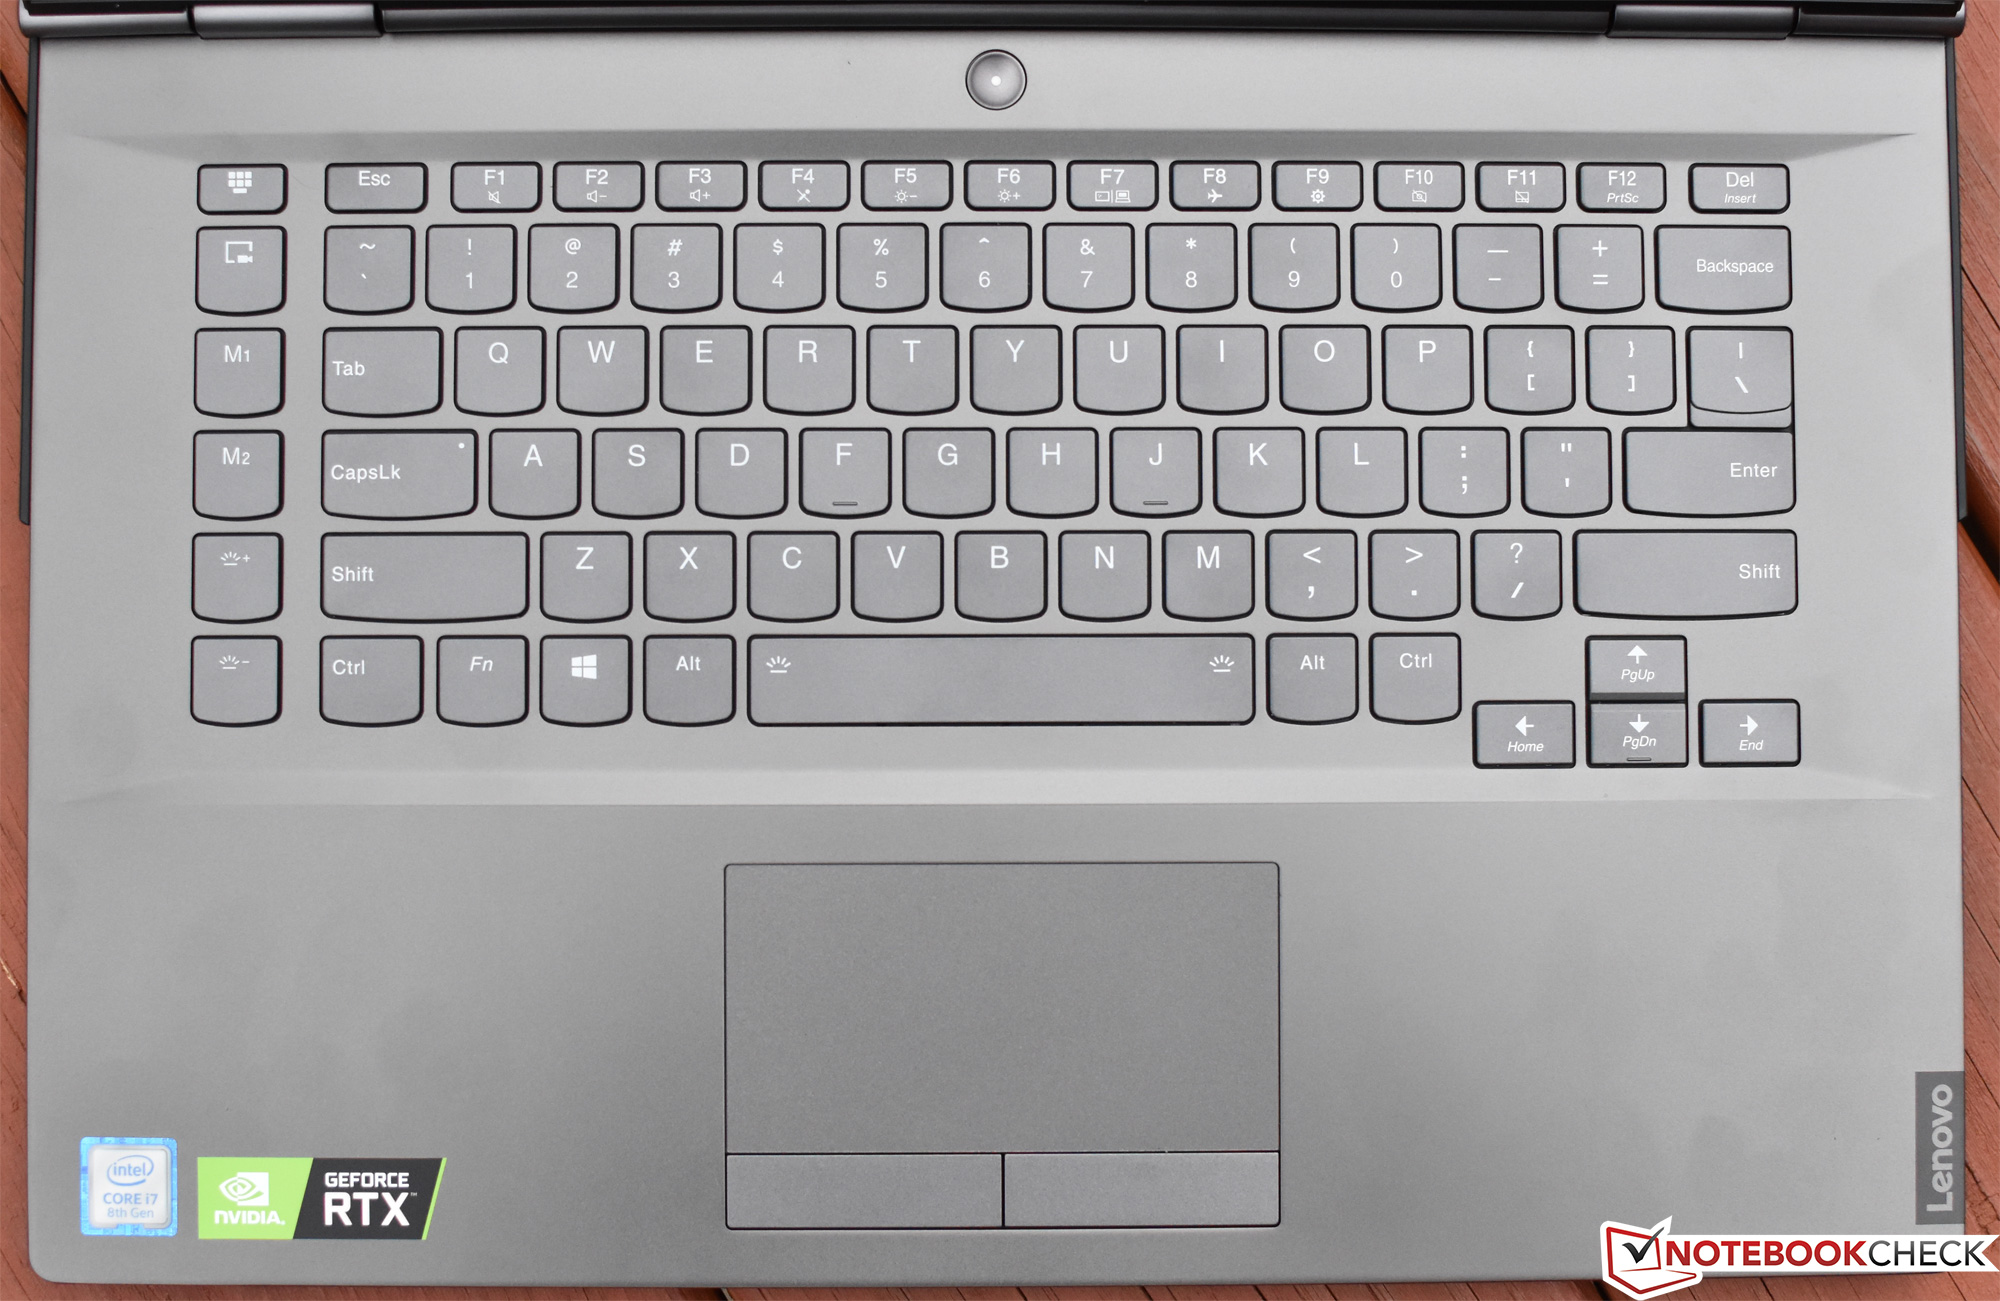
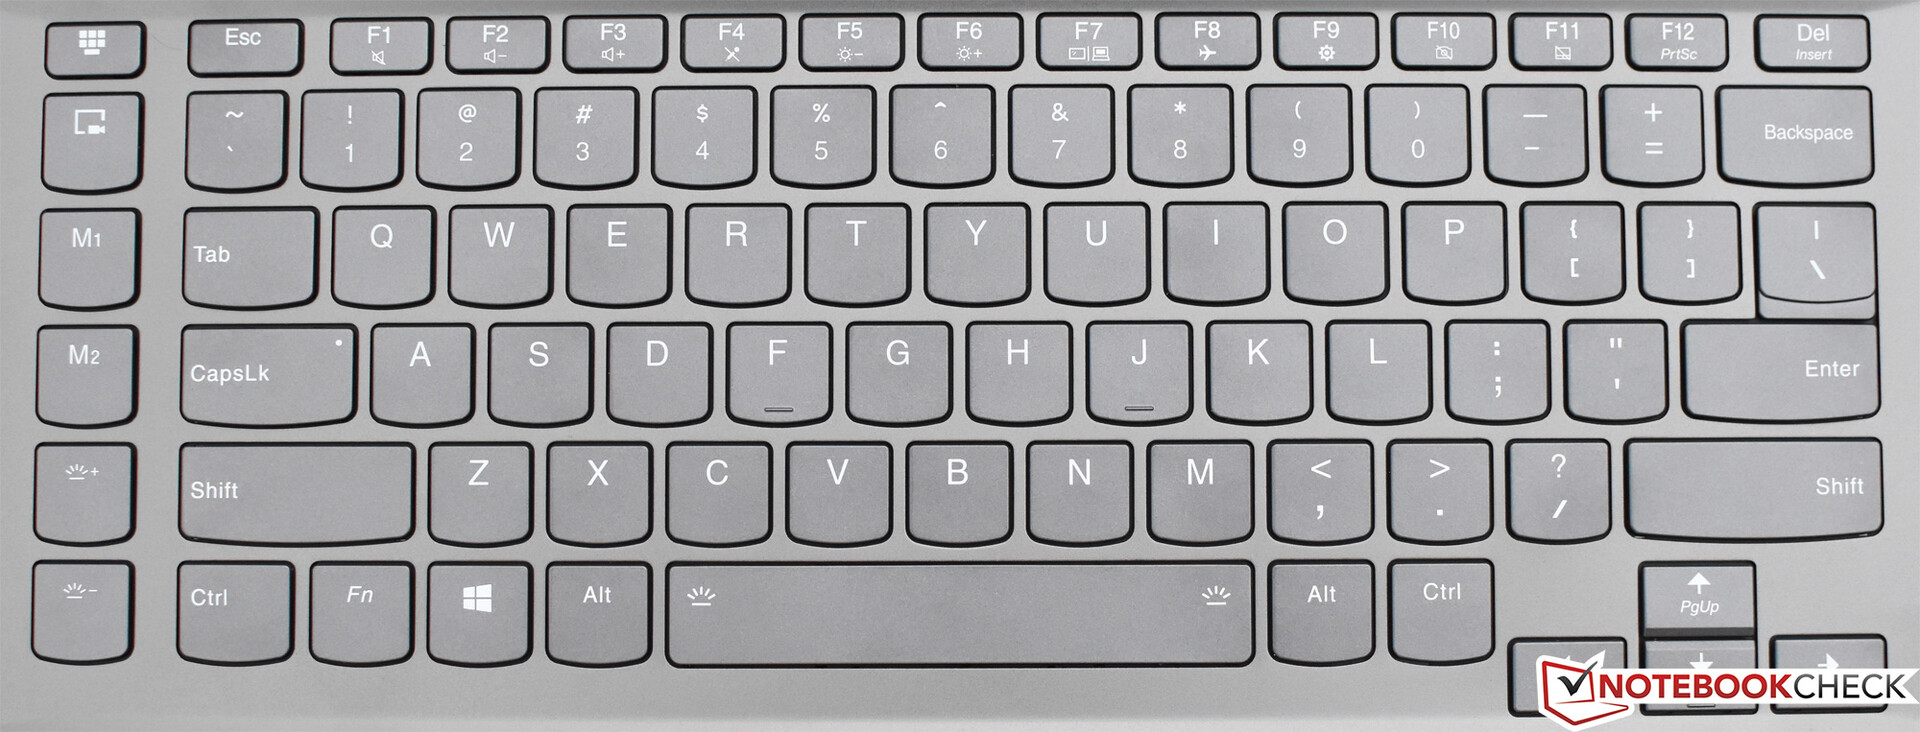
The Y740’s keys feature short travel and a soft, spongy sense of feedback when depressed. Actuation force is also relatively light, which leads to a lack of confidence that a keypress has actually taken place when typing at higher speeds. While quiet, it’s a far cry from the best keyboards on notebooks of this size and even thinner.
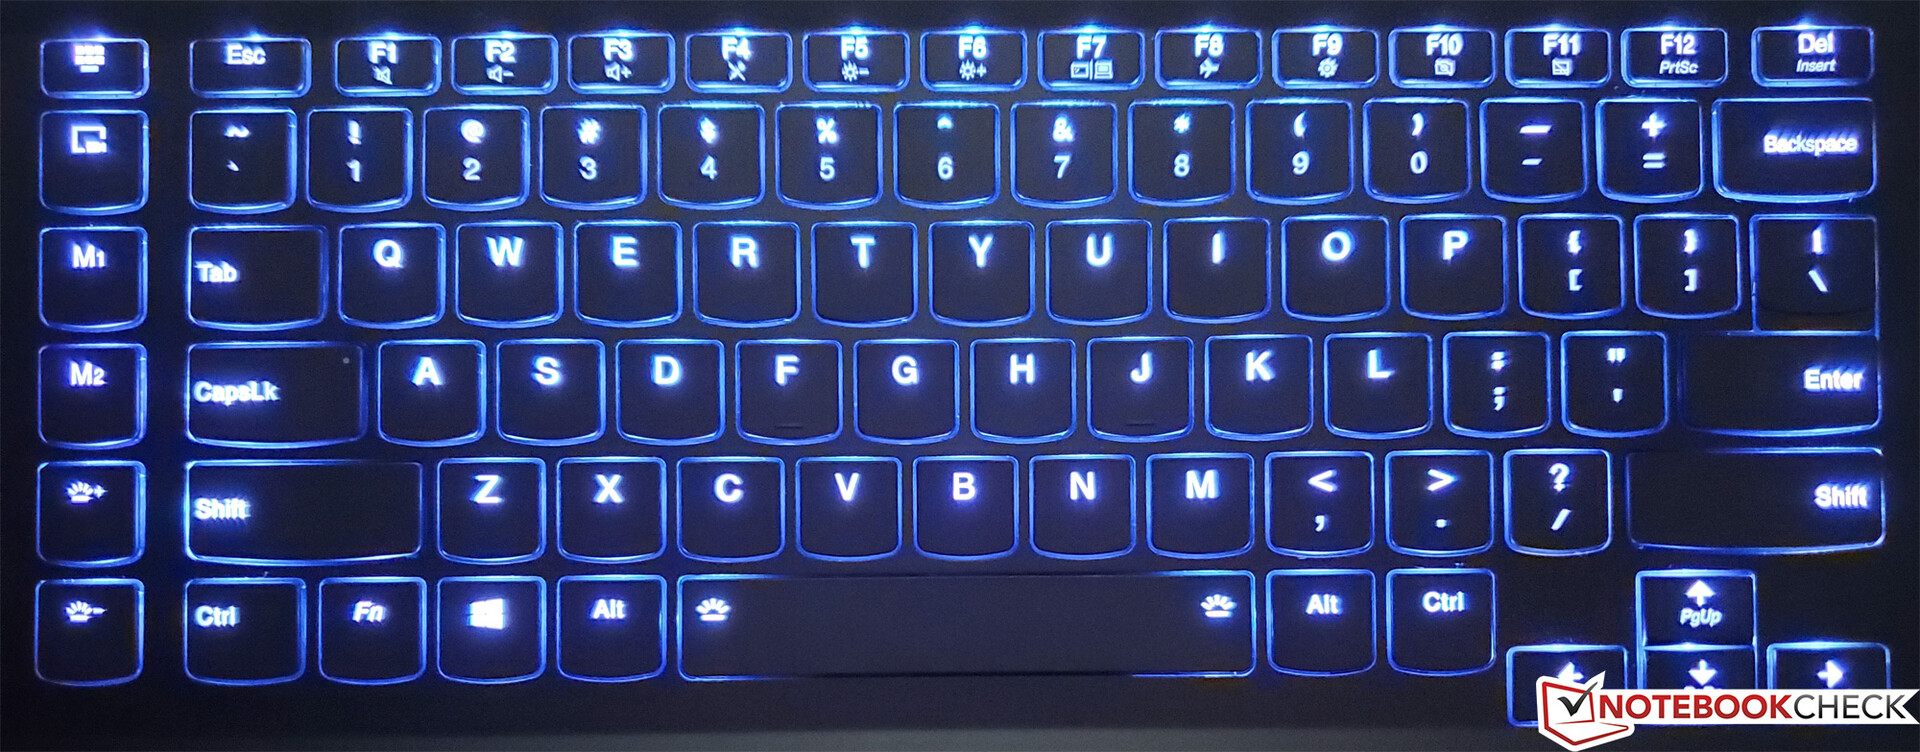
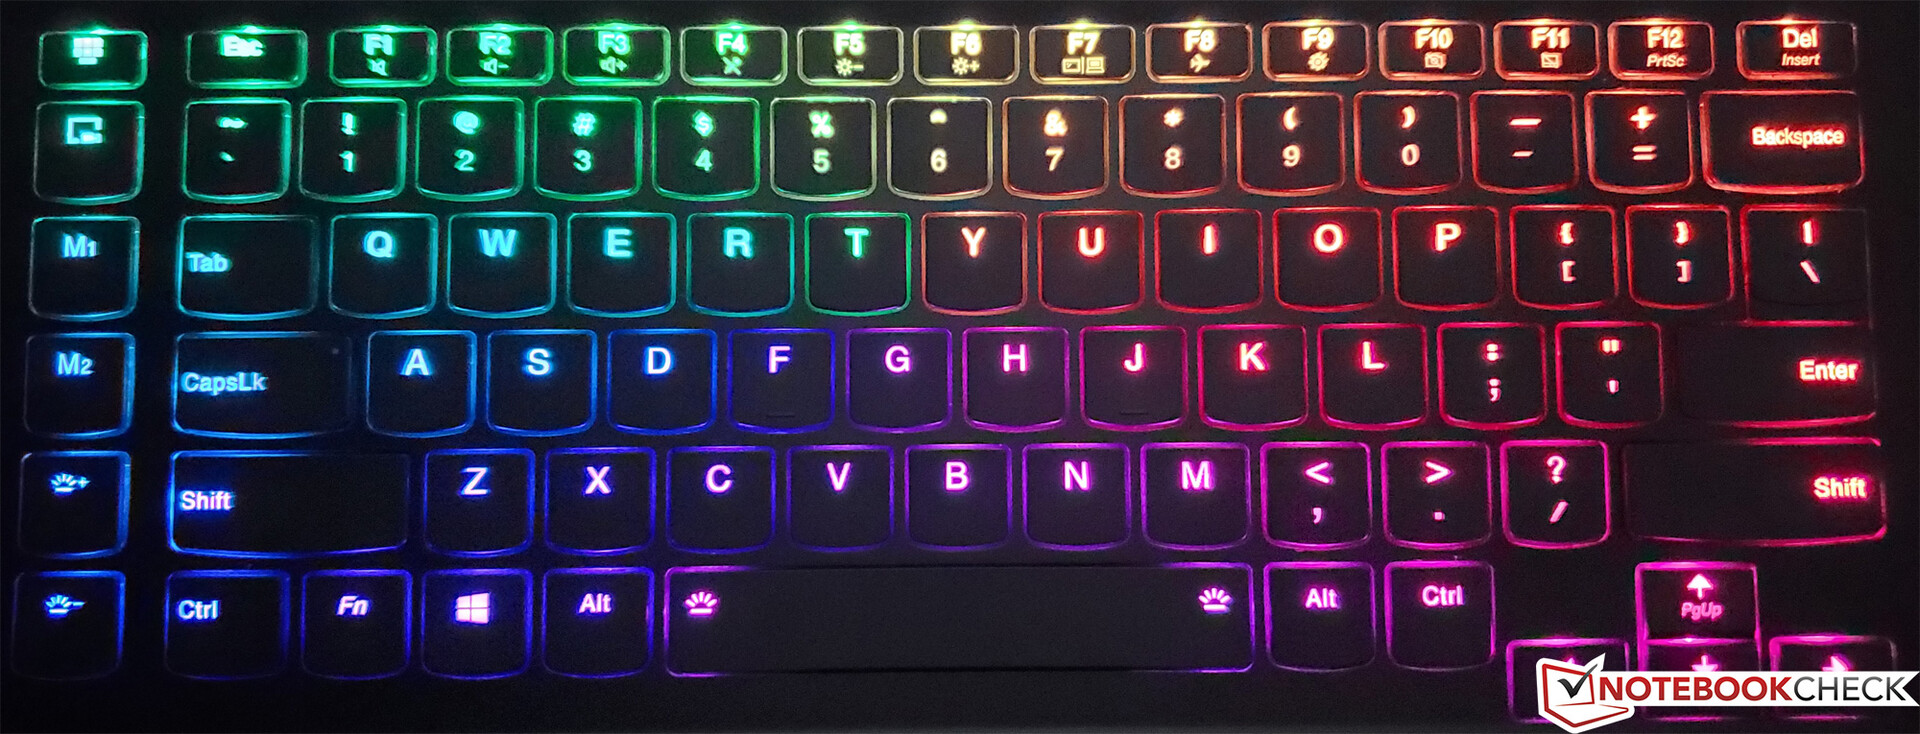
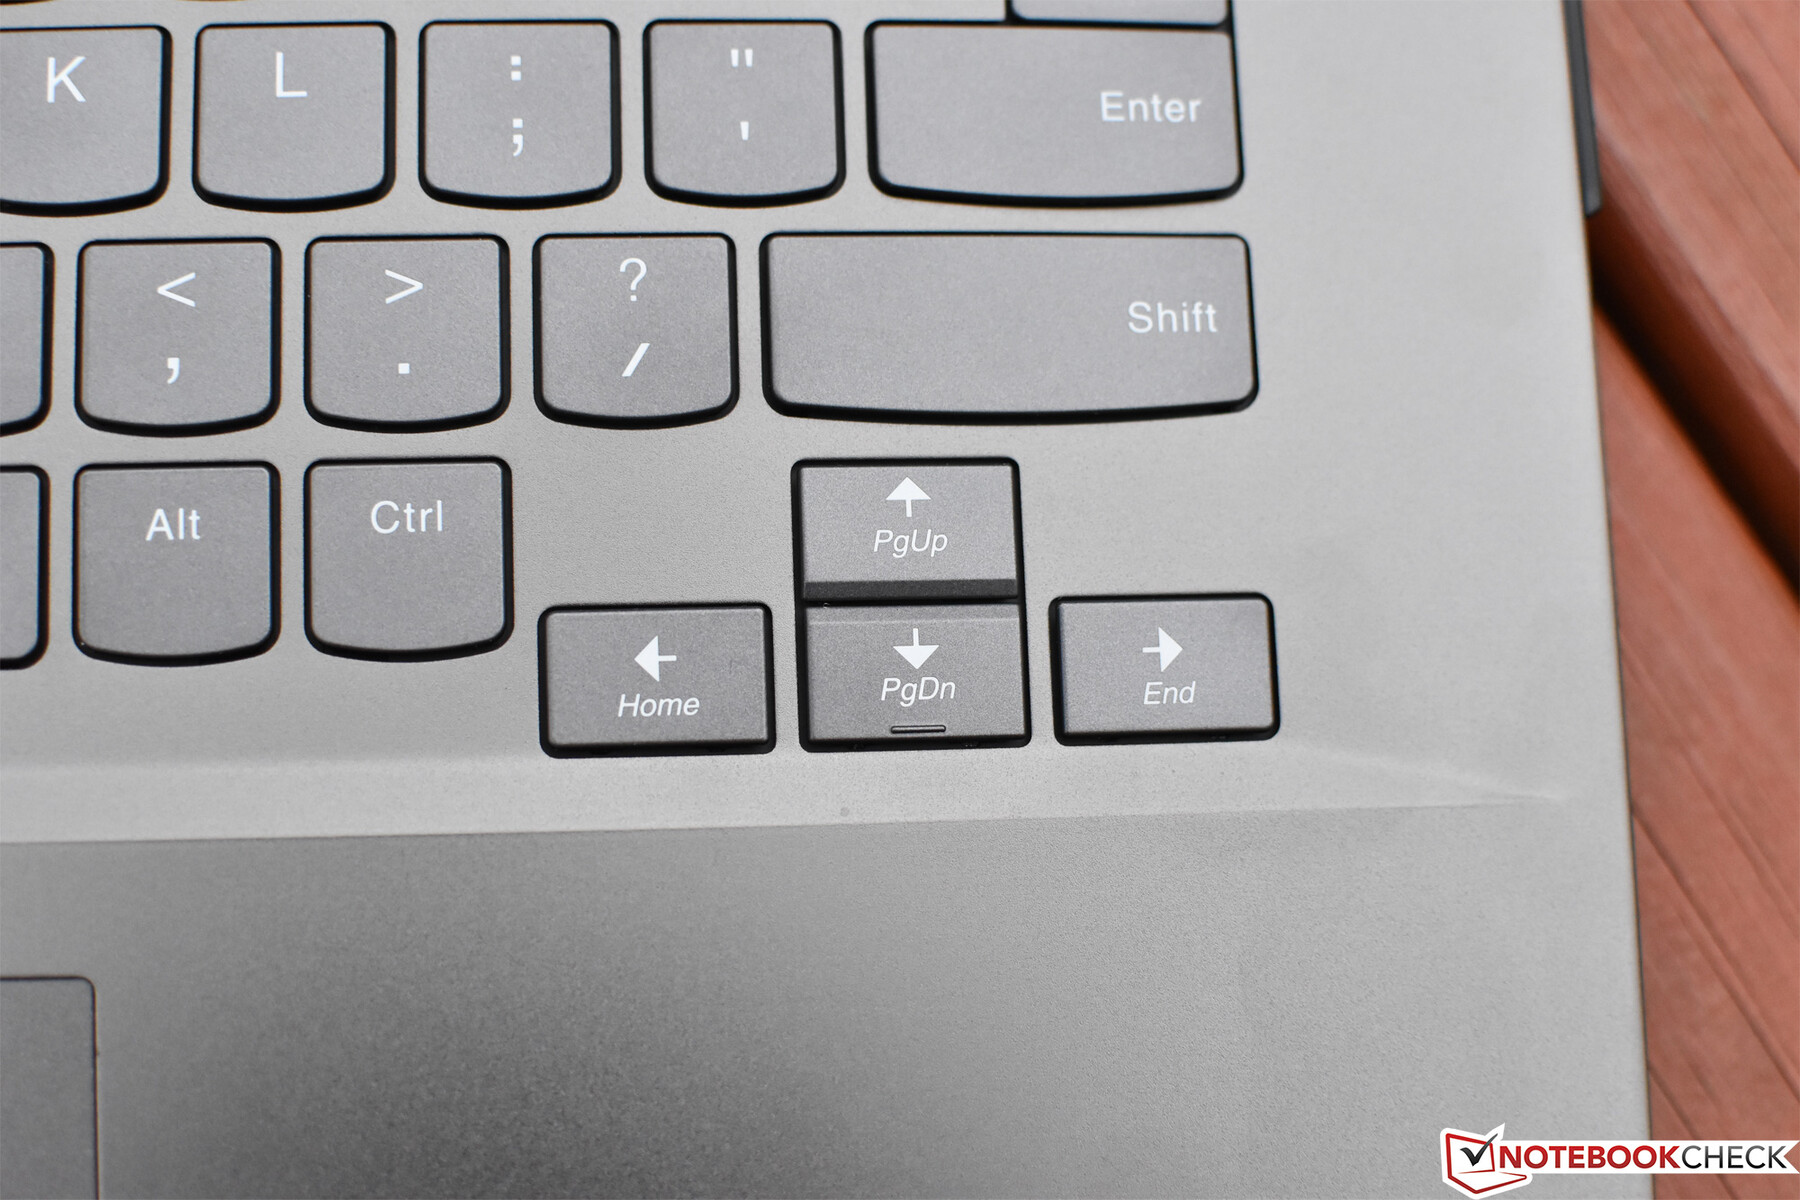
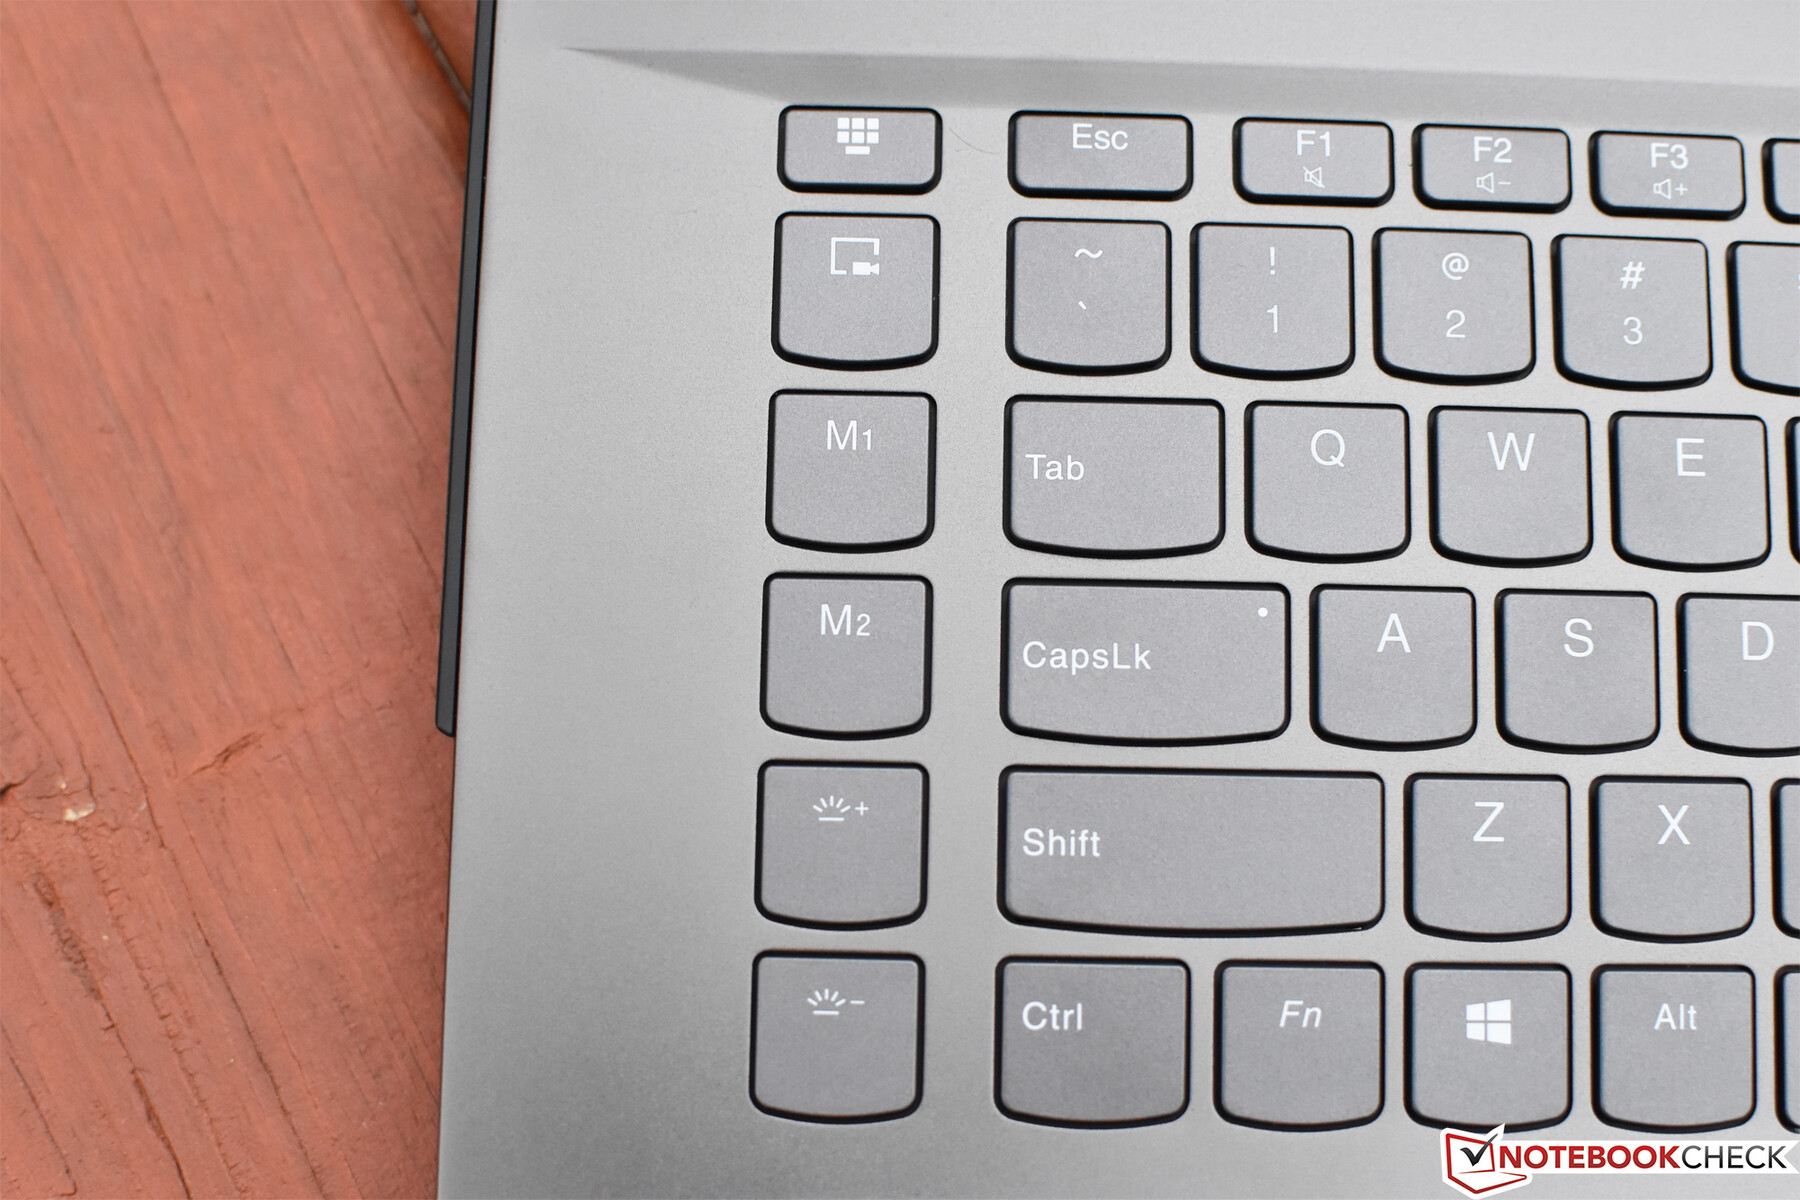
Per-key RGB backlighting is once again provided by Corsair iCUE, which supports up to 16 million colors. Some users will resent the removal of the numpad in exchange for the vertical strip of multifunction keys on the left side, but this is a gaming laptop, after all.

Touchpad
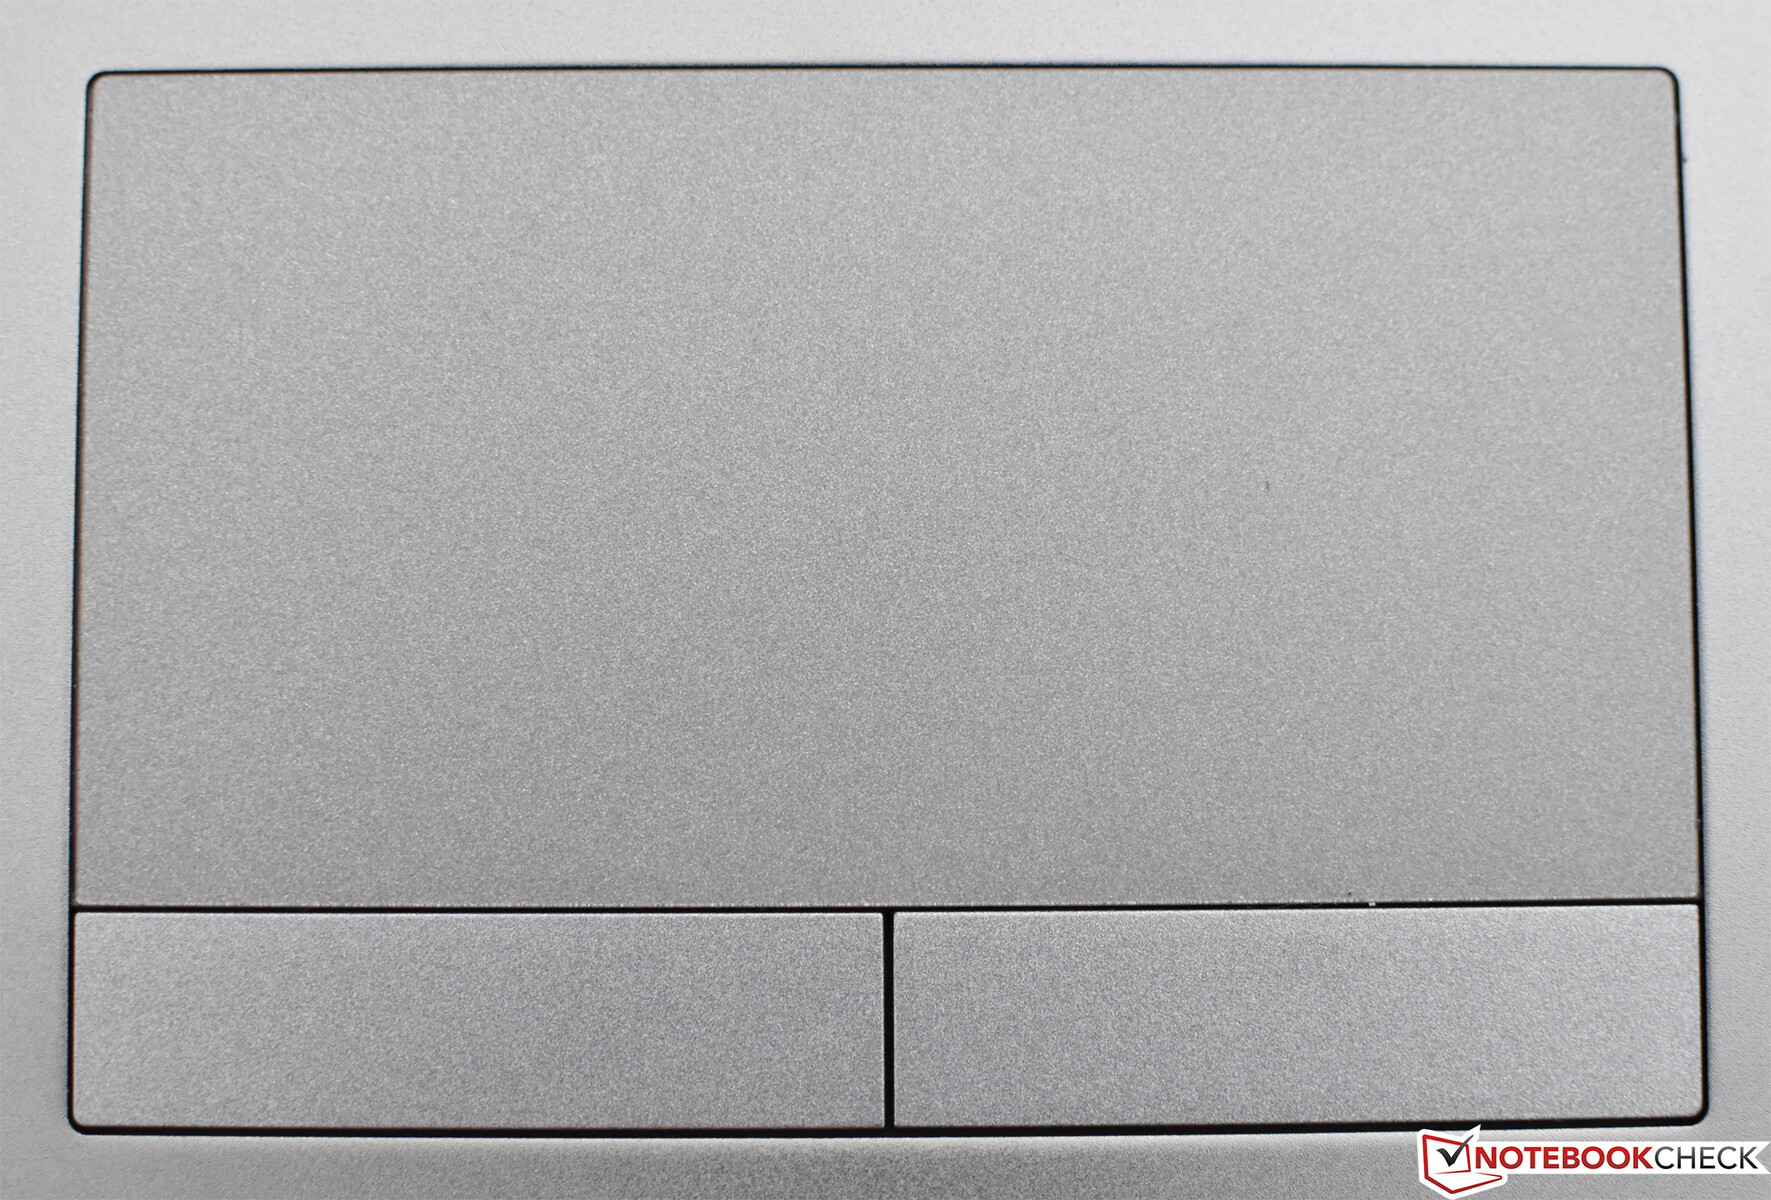
The somewhat small touchpad measures 100 x 52 mm and features a Mylar surface. It uses Precision drivers, so pointer movement and gesture interpretations are flawless. The buttons are actually quite good and don’t feel as soft as those on the Y740-17ICH, but actuation force/travel distance is arguably a bit on the high side, so extended use could result in fatigue.
Display
Now we come to the first significant improvement over the previous Y700 series machines: the display. We previously complained about the lack of a 120 / 144 Hz display option for the Y730, something which most competitors have. We also criticized the extremely slow panel response times, hardly conducive to an optimal gaming experience. We’re happy to report that with the Y740, both of these issues have been alleviated.
Now, two separate display options exist, both of them featuring FHD resolution (1920x1080) and 144 Hz refresh rates for NVIDIA G-Sync. The only difference between the two panels (according to Lenovo specifications) is that one of them is brighter than the other (500 nits vs. 300 nits). The brighter panel is also correspondingly listed as an HDR display.
Our review unit includes the dimmer/less expensive option, which looks pretty good in its own right. It’s a 15.6-inch anti-glare IPS display with what appears to be acceptable color and reasonable brightness and contrast. Our review panel exhibits no notable graininess and is clear and sharp. However, in dark scenes, backlight bleed is conspicuous along the bottom edge of the screen.


| |||||||||||||||||||||||||
Brightness Distribution: 85 %
Center on Battery: 320.4 cd/m²
Contrast: 763:1 (Black: 0.42 cd/m²)
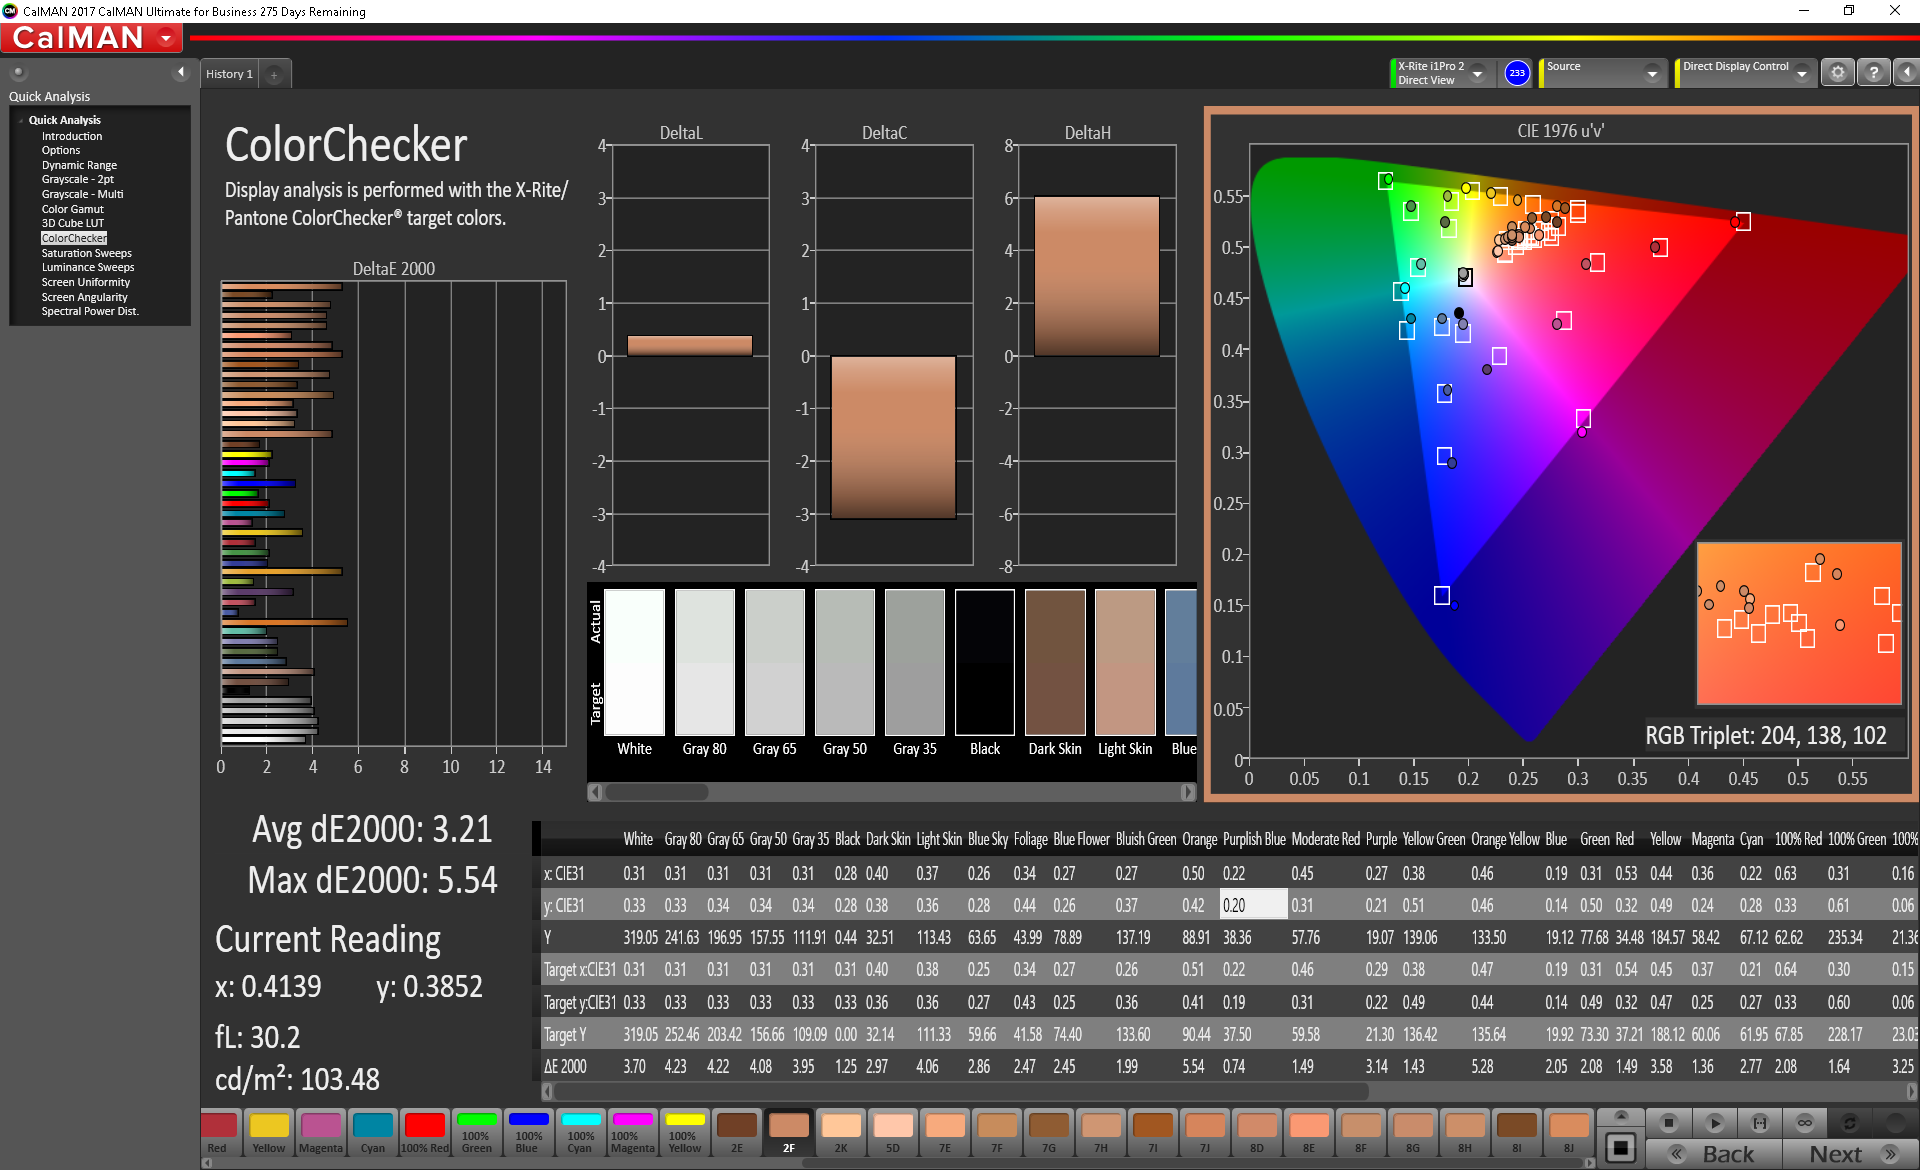
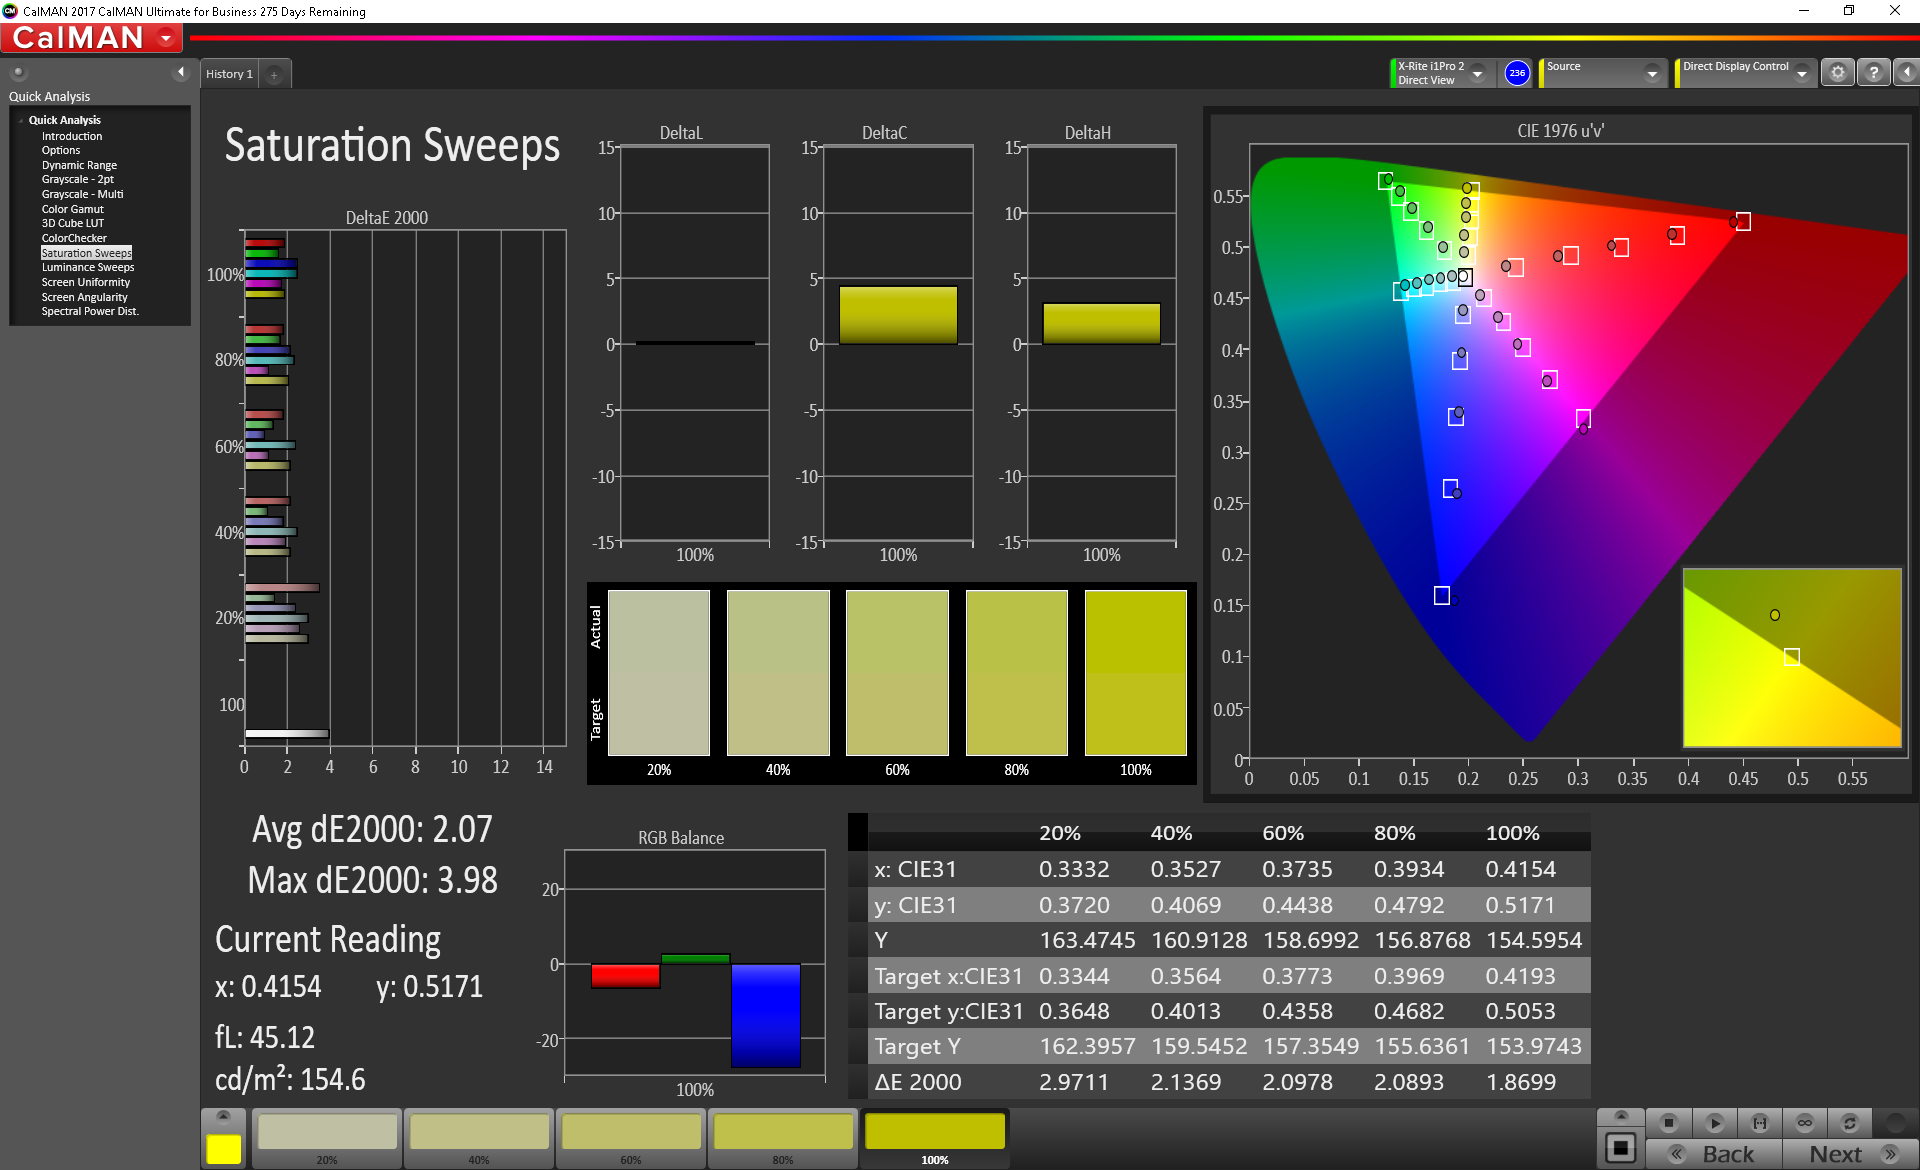
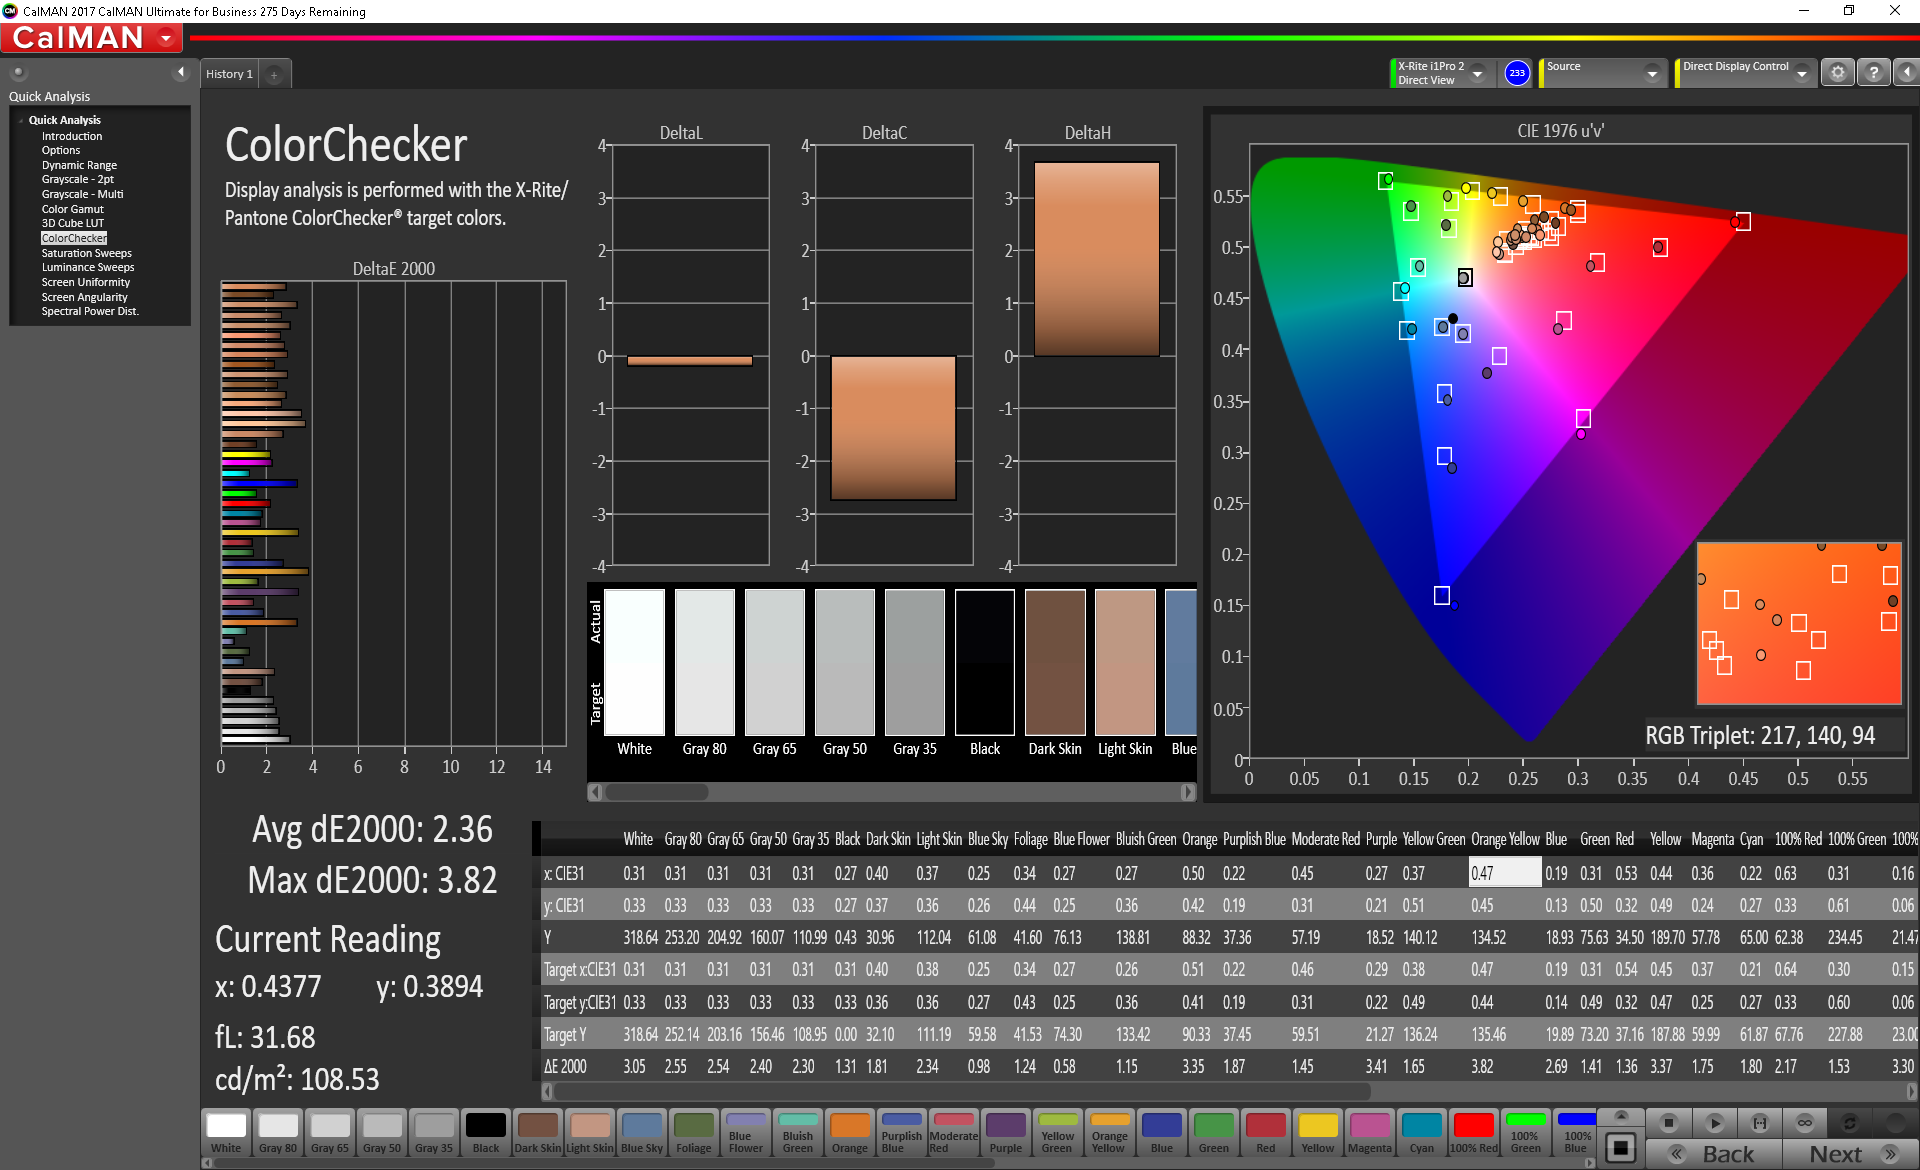
ΔE Color 3.21 | 0.5-29.43 Ø5, calibrated: 2.36
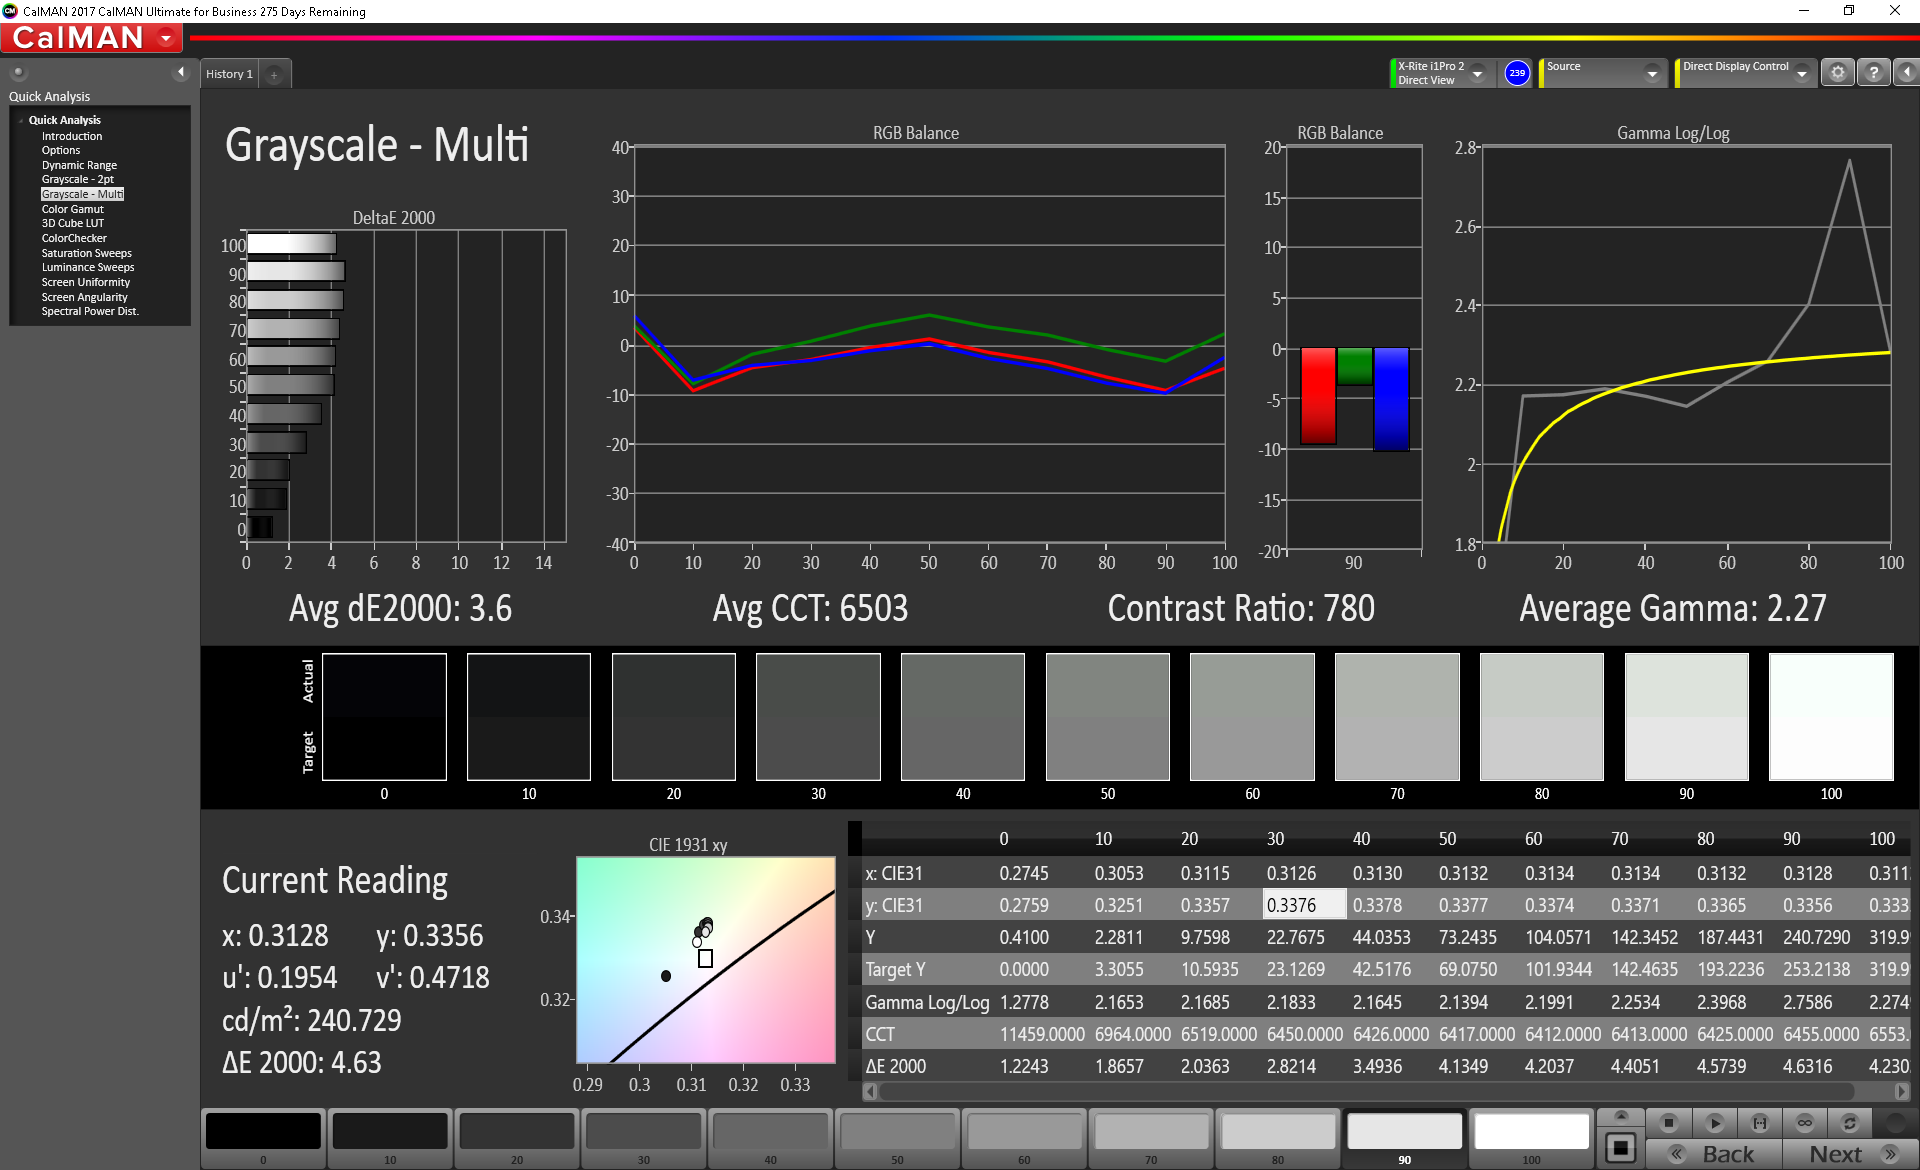
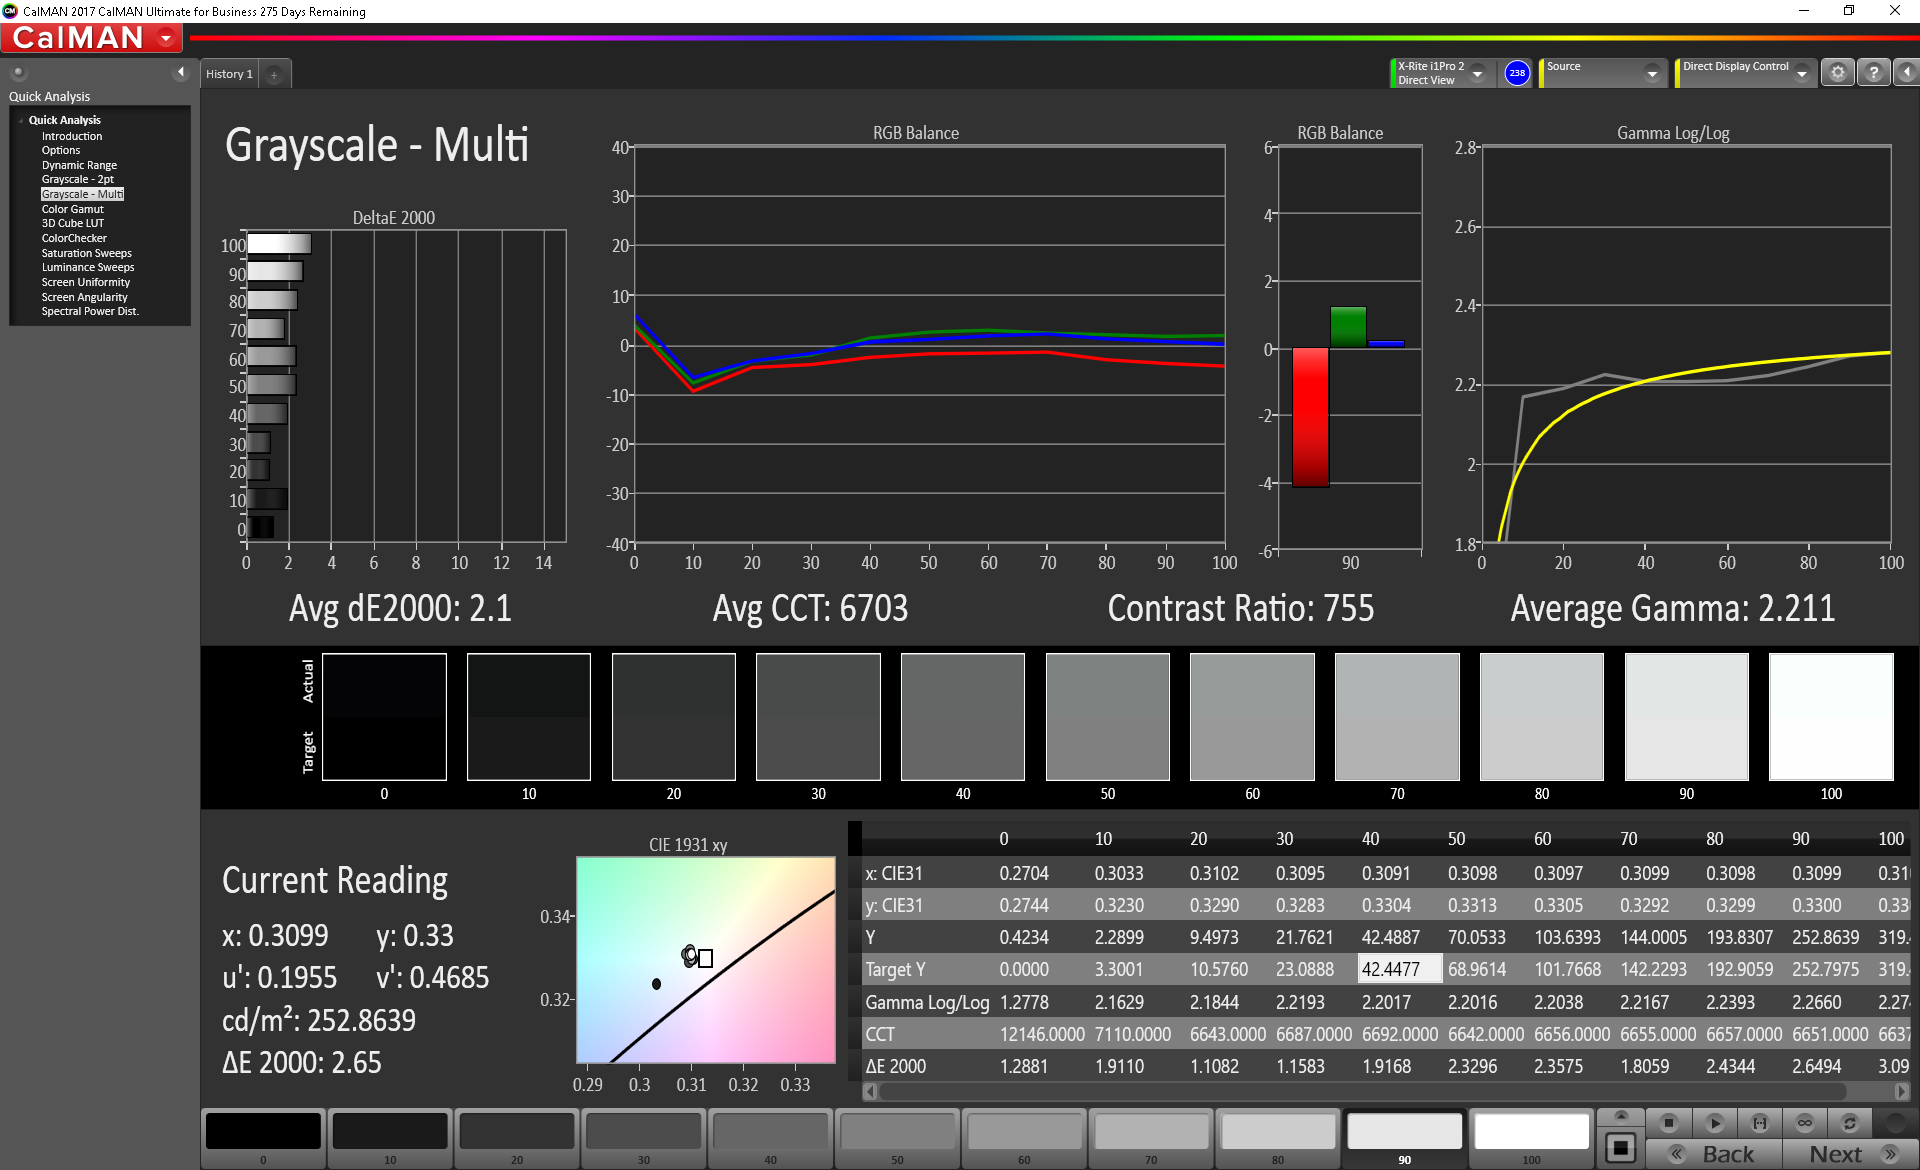
ΔE Greyscale 3.6 | 0.57-98 Ø5.3
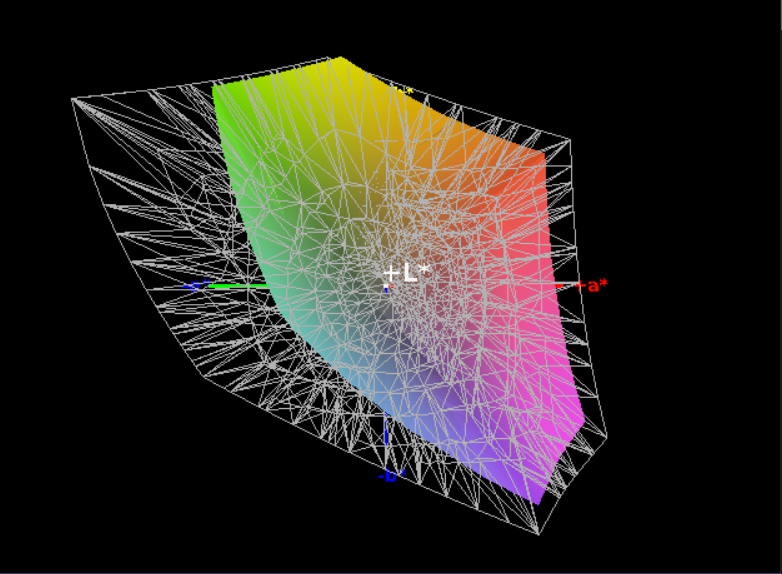
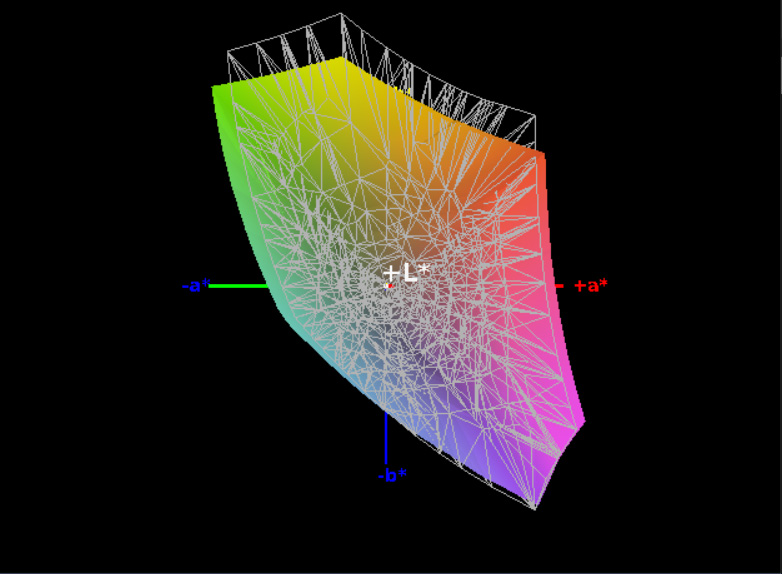
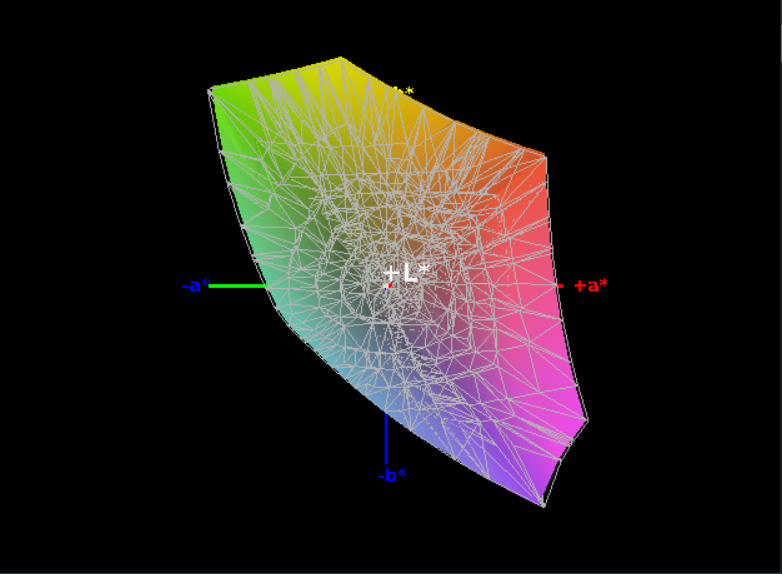
92% sRGB (Argyll 1.6.3 3D)
59% AdobeRGB 1998 (Argyll 1.6.3 3D)
64.7% AdobeRGB 1998 (Argyll 2.2.0 3D)
92.4% sRGB (Argyll 2.2.0 3D)
63.5% Display P3 (Argyll 2.2.0 3D)
Gamma: 2.27
| Lenovo Legion Y740-15ICHg LP156WFG-SPB2, IPS, 15.60, 1920x1080 | Gigabyte Aero 15-X9 LGD05C0, IPS, 15.60, 1920x1080 | Acer Predator Triton 500 AU Optronics B156HAN08.2 (AUO82ED), IPS, 15.60, 1920x1080 | Razer Blade 15 RTX 2070 Max-Q LG Philips LGD05C0, IPS, 15.60, 1920x1080 | Alienware m15 GTX 1070 Max-Q AU Optronics B156HAN, IPS, 15.60, 1920x1080 | |
|---|---|---|---|---|---|
| Display | 0% | 1% | 3% | -1% | |
| Display P3 Coverage | 63.5 | 63.5 0% | 64.2 1% | 65.3 3% | 63.5 0% |
| sRGB Coverage | 92.4 | 93.1 1% | 92.6 0% | 94.9 3% | 89.4 -3% |
| AdobeRGB 1998 Coverage | 64.7 | 64.5 0% | 65.7 2% | 66.3 2% | 64.5 0% |
| Response Times | 5% | 36% | 12% | 7% | |
| Response Time Grey 50% / Grey 80% * | 18.8 ? | 16.4 ? 13% | 8 ? 57% | 16.8 ? 11% | 18 ? 4% |
| Response Time Black / White * | 13.2 ? | 13.6 ? -3% | 11.2 ? 15% | 11.6 ? 12% | 12 ? 9% |
| PWM Frequency | |||||
| Screen | 18% | -5% | 9% | -3% | |
| Brightness middle | 320.4 | 250 -22% | 304 -5% | 314.7 -2% | 353.6 10% |
| Brightness | 298 | 235 -21% | 299 0% | 312 5% | 346 16% |
| Brightness Distribution | 85 | 85 0% | 89 5% | 90 6% | 86 1% |
| Black Level * | 0.42 | 0.29 31% | 0.27 36% | 0.38 10% | 0.3 29% |
| Contrast | 763 | 862 13% | 1126 48% | 828 9% | 1179 55% |
| Colorchecker dE 2000 * | 3.21 | 1.46 55% | 4.66 -45% | 2.56 20% | 4.55 -42% |
| Colorchecker dE 2000 max. * | 5.54 | 2.47 55% | 9.65 -74% | 4.89 12% | 7.91 -43% |
| Colorchecker dE 2000 calibrated * | 2.36 | 1.72 27% | 1.71 28% | 3.37 -43% | |
| Greyscale dE 2000 * | 3.6 | 1.27 65% | 5.53 -54% | 3.4 6% | 4.1 -14% |
| Gamma | 2.27 97% | 2.4 92% | 2.5 88% | 2.3 96% | 2.27 97% |
| CCT | 6503 100% | 6749 96% | 8028 81% | 6435 101% | 7434 87% |
| Color Space (Percent of AdobeRGB 1998) | 59 | 60 2% | 60 2% | 60.7 3% | 57.9 -2% |
| Color Space (Percent of sRGB) | 92 | 93 1% | 93 1% | 94.6 3% | 88.9 -3% |
| Total Average (Program / Settings) | 8% /
13% | 11% /
1% | 8% /
8% | 1% /
-2% |
* ... smaller is better
We measured an average brightness of 298 cd/m² from our unit’s display, only slightly brighter than that of the Y730 and more or less in line with that of the competition. The contrast ratio of 763:1 is a bit on the low side (thanks to a black value of 0.42 cd/m²), but it’s fine. Brightness distribution was measured at 85%, with a peak brightness of 320.4 cd/m² right in the center of the display.
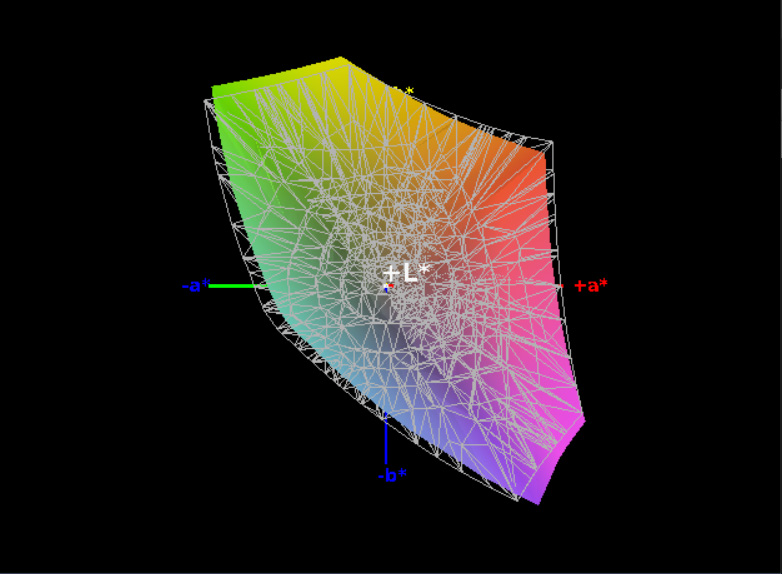
The Y740 also does a decent job at color rendering. We measured sRGB coverage of 92% of the spectrum alongside 59% of AdobeRGB. Neither of these numbers will make a photographer jump for joy, but it’s fine for gaming and it’s practically identical to that of its peers.


The panel is also fairly well-calibrated out of the box. All DeltaE averages were below 4, with a Colorchecker average of 3.21 (max: 5.54, Orange) and a Greyscale average of 3.6. Total Gamma was measured at a near-perfect 2.27 and the CCT average was right on target at 6503. Impressive!

Display Response Times
| ↔ Response Time Black to White | ||
|---|---|---|
| 13.2 ms ... rise ↗ and fall ↘ combined | ↗ 8 ms rise | 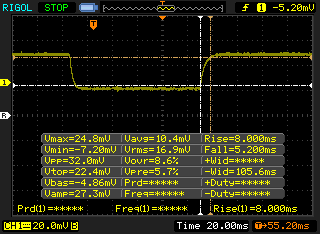 |
| ↘ 5.2 ms fall | ||
| The screen shows good response rates in our tests, but may be too slow for competitive gamers. In comparison, all tested devices range from 0.1 (minimum) to 240 (maximum) ms. » 29 % of all devices are better. This means that the measured response time is better than the average of all tested devices (21.5 ms). | ||
| ↔ Response Time 50% Grey to 80% Grey | ||
| 18.8 ms ... rise ↗ and fall ↘ combined | ↗ 11.6 ms rise | 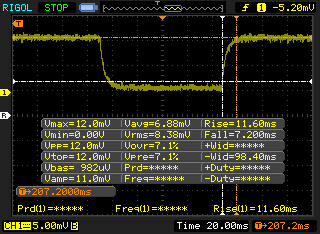 |
| ↘ 7.2 ms fall | ||
| The screen shows good response rates in our tests, but may be too slow for competitive gamers. In comparison, all tested devices range from 0.2 (minimum) to 636 (maximum) ms. » 27 % of all devices are better. This means that the measured response time is better than the average of all tested devices (33.8 ms). | ||
Screen Flickering / PWM (Pulse-Width Modulation)
| Screen flickering / PWM not detected | 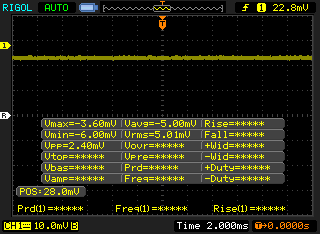 | ||
In comparison: 53 % of all tested devices do not use PWM to dim the display. If PWM was detected, an average of 17942 (minimum: 5 - maximum: 3846000) Hz was measured. | |||
As previously mentioned, response times are also no longer a problem for all but the most competitive of gamers. We did not detect PWM from the panel at any brightness setting.
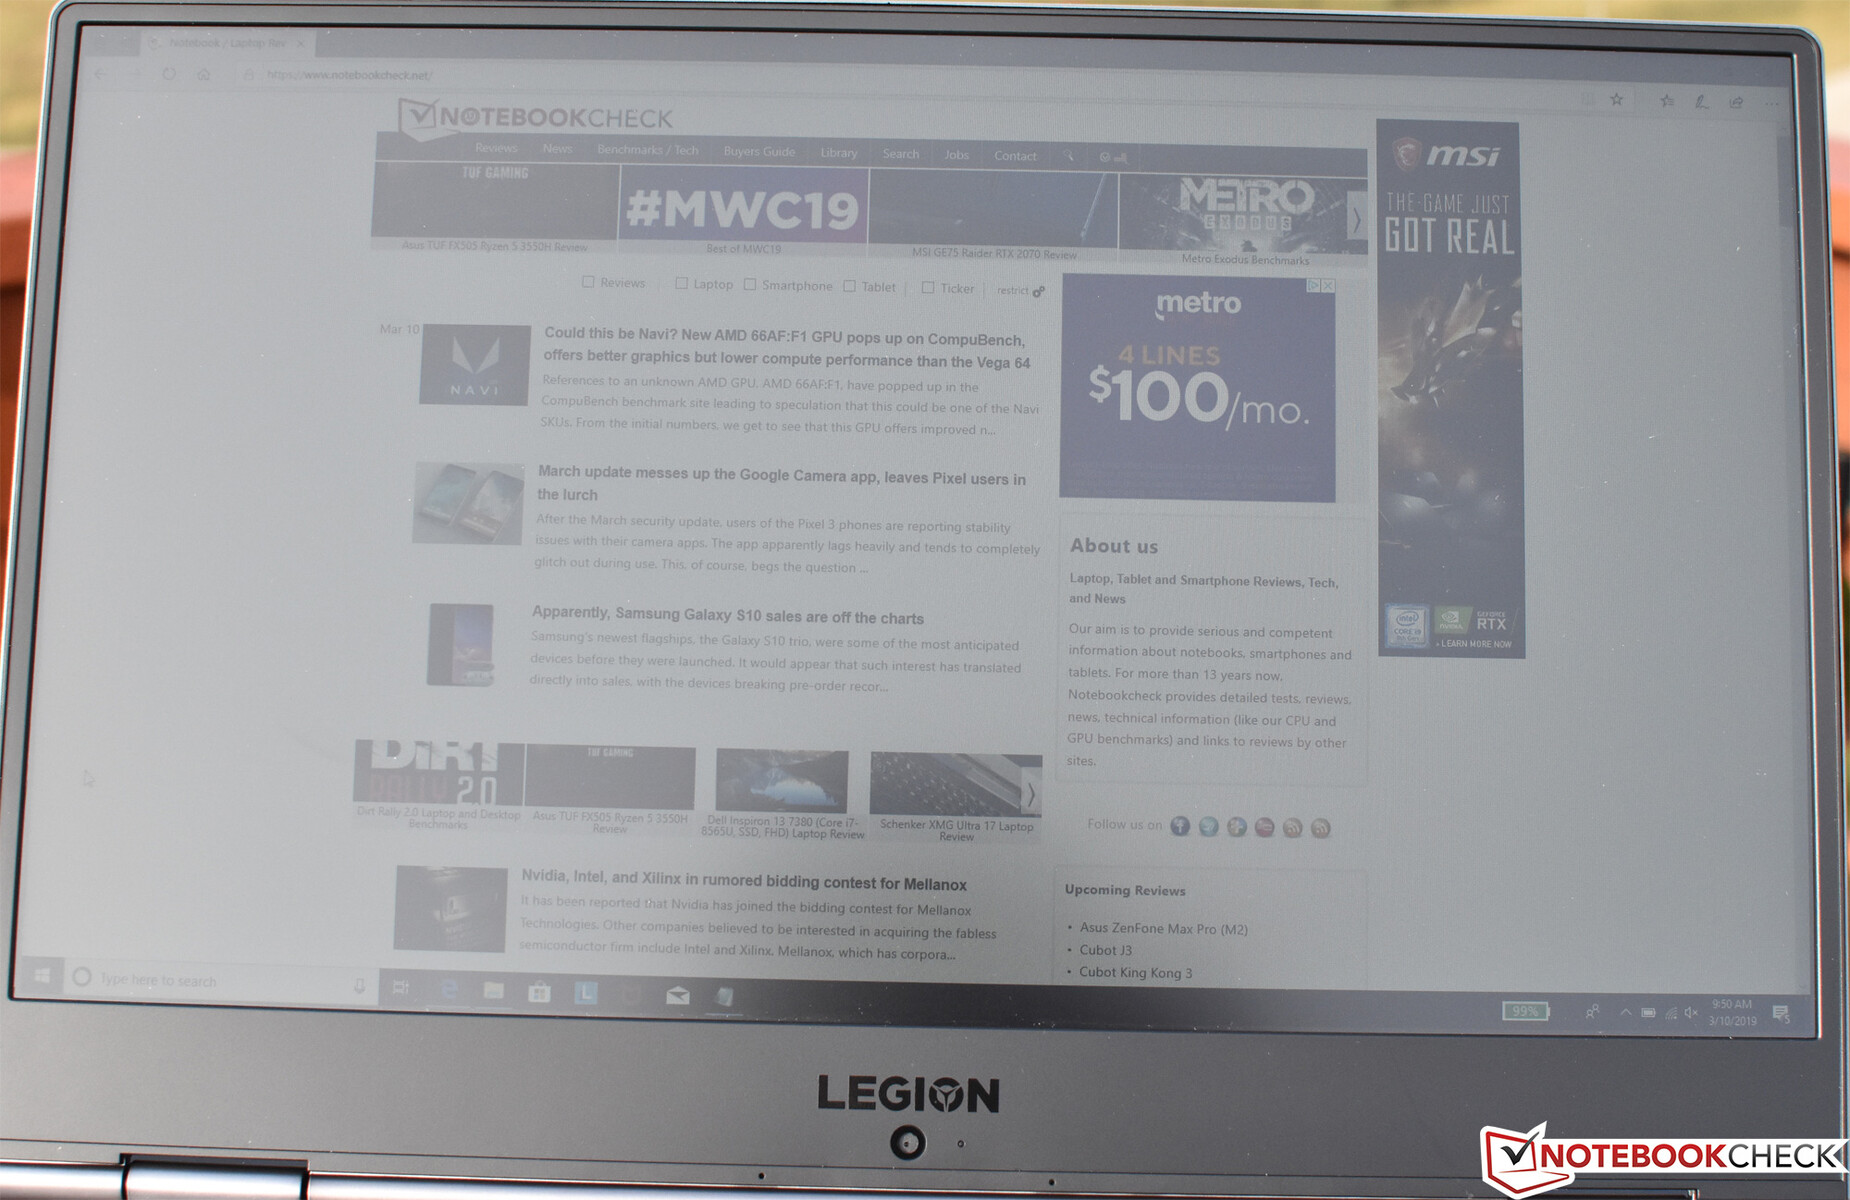
Outdoors, the panel’s matte finish comes in handy, but its somewhat low brightness and middling contrast are quickly overpowered in brighter areas. Shaded use is no problem. Viewing angles are wide as expected for an IPS display.

Performance
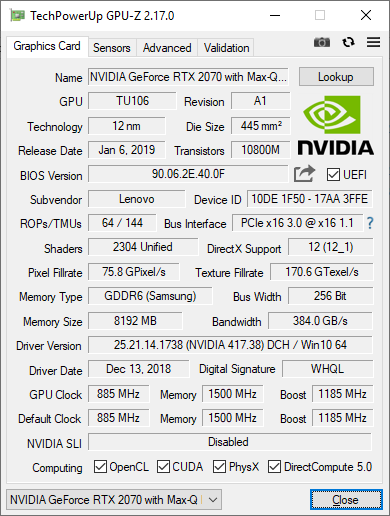
The Y730-15ICH was a much more modest performer than we’d have liked given its price point and stature; our review unit was powered by a quad-core Core i5 and a somewhat disappointing GTX 1050 Ti. Fortunately, the Y740 corrects this discrepancy with the option of a Core i7-8750H six-core CPU and two upgraded GPU options: a GeForce RTX 2060 Max-Q and RTX 2070 Max-Q.
Our review unit features the Core i7-8750H CPU with RTX 2070 Max-Q CPU alongside 16 GB of DDR4 dual-channel RAM and a dual-storage NVMe/HDD combo. It’s a much more capable configuration than before, so let’s see how it performs in our tests!
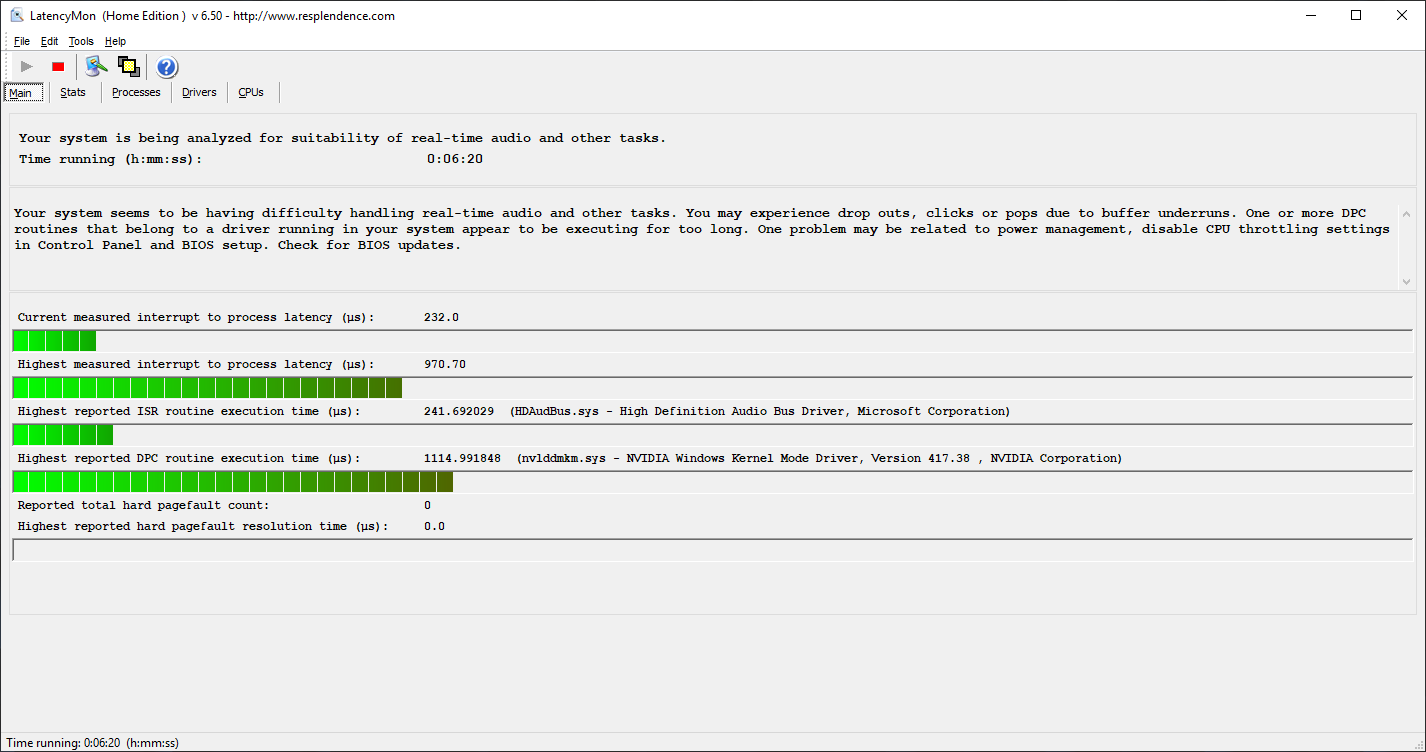
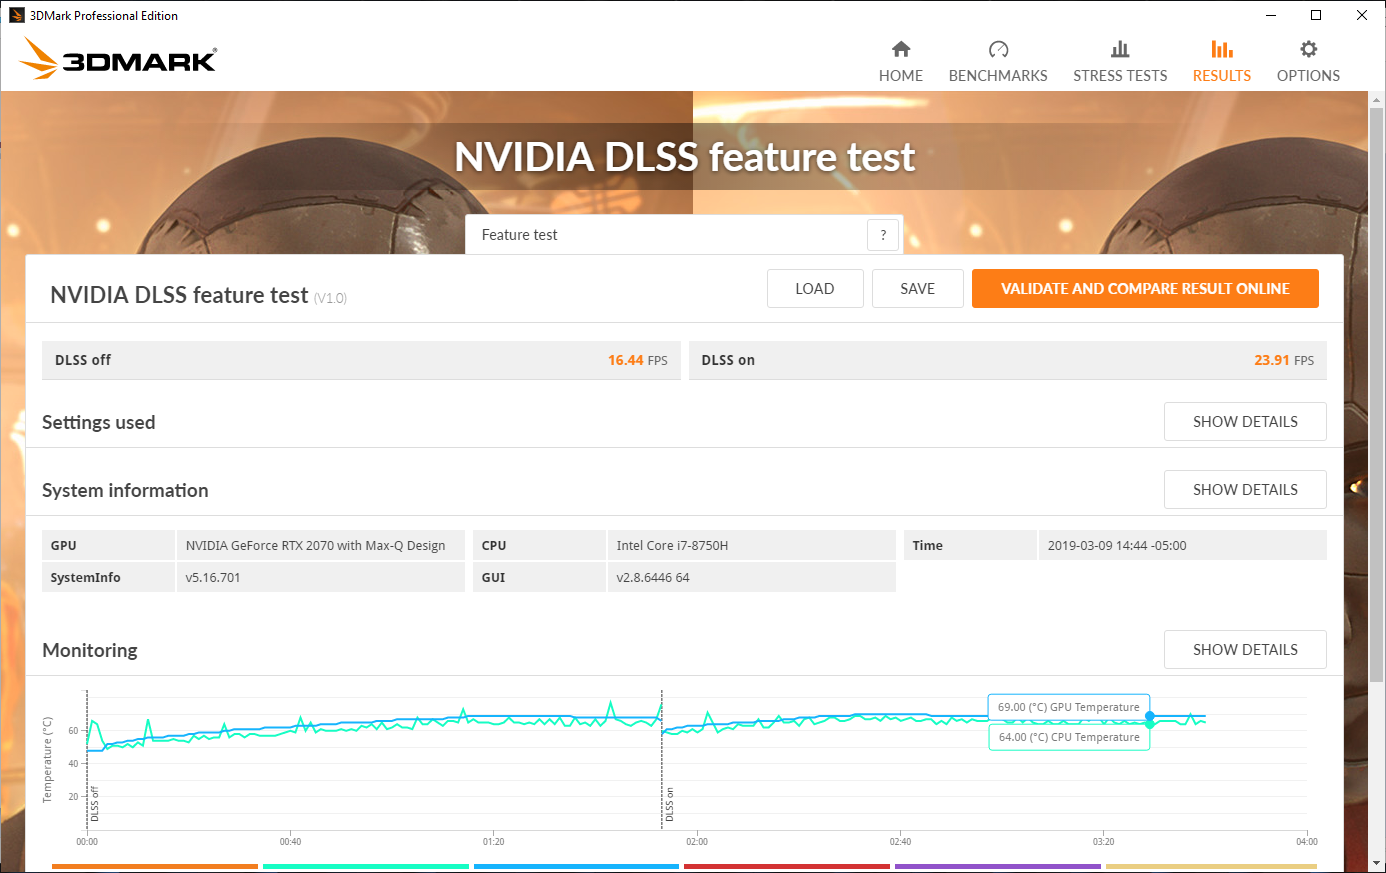
Before we get started, it’s worth mentioning that GPU performance while unplugged is (as expected) notably reduced: a secondary run of 3DMark 06 scored the machine just 23829, nearly 27% below the previous score. LatencyMon reported only minor and occasional issues with DPC latencies. It’s unlikely most users will be affected by this.
Processor
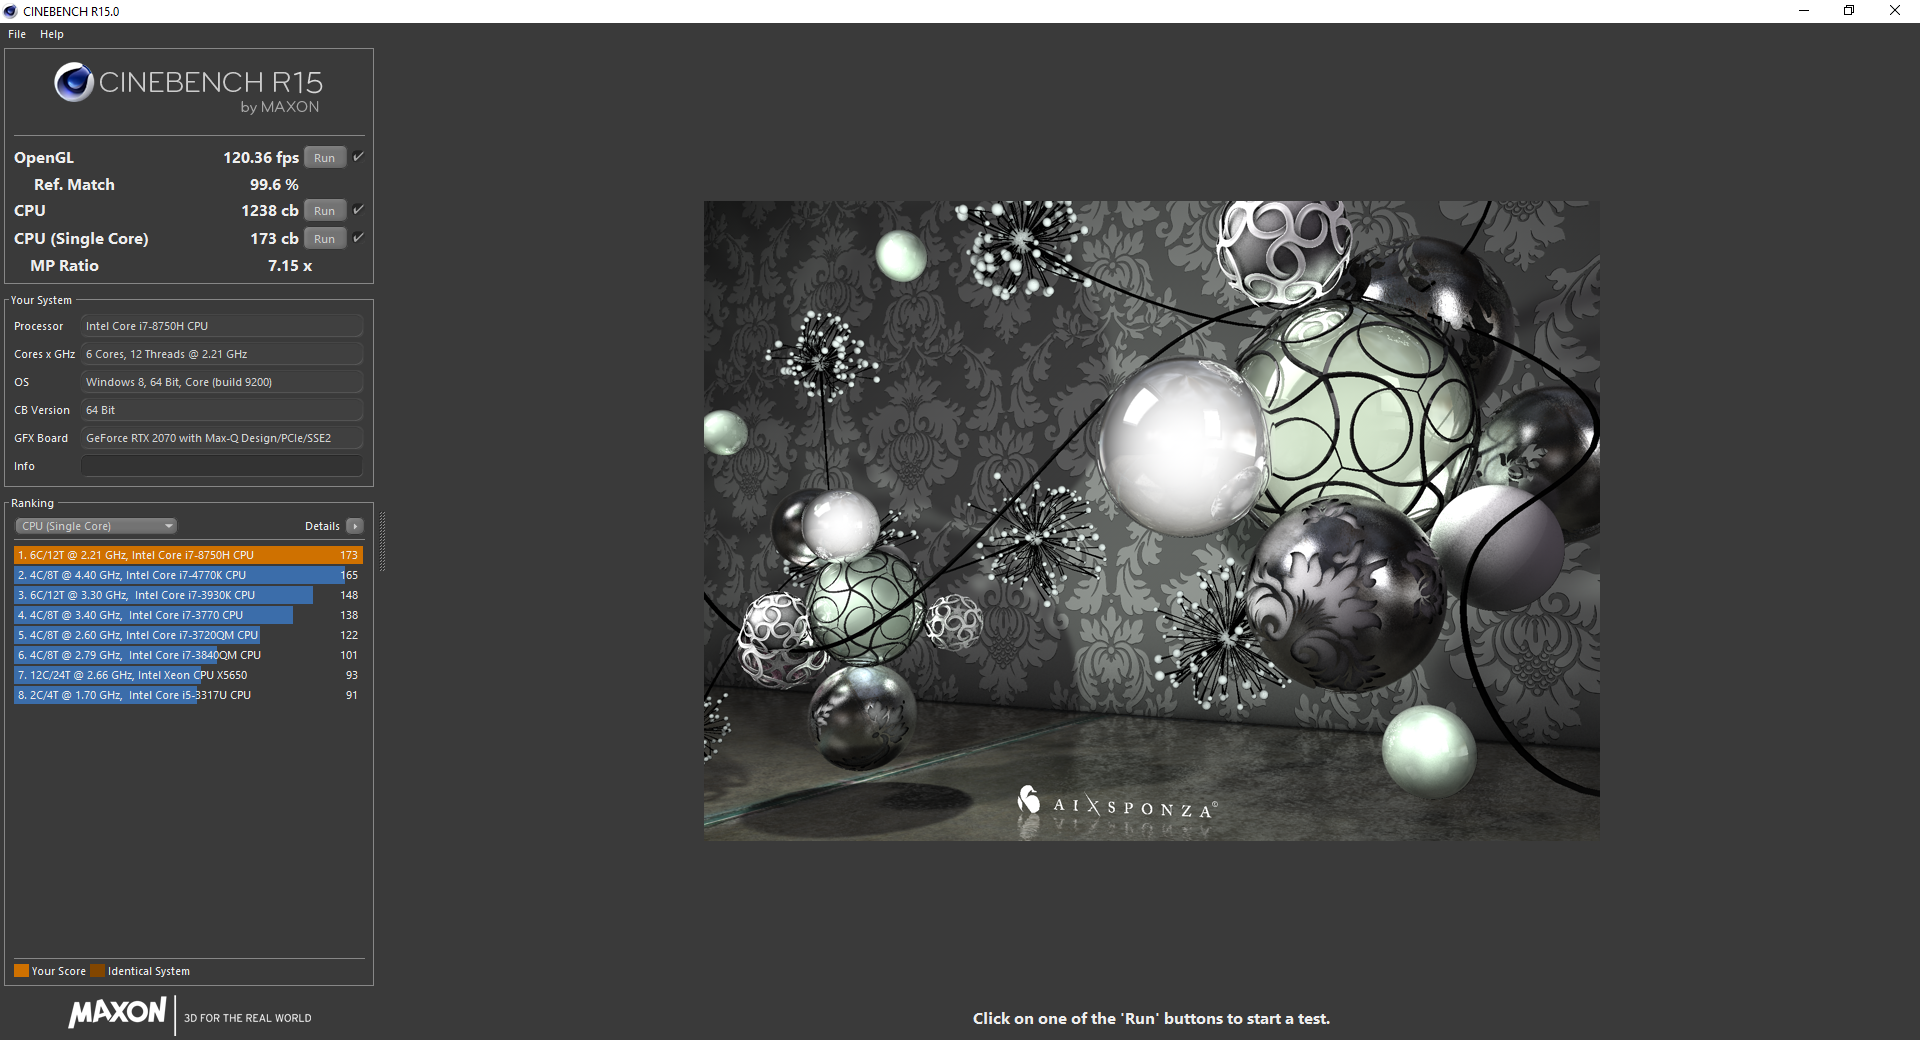
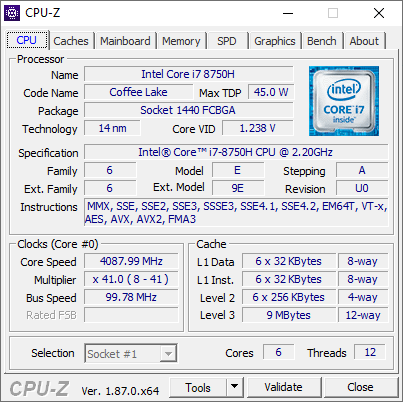
The Core i7-8750H has been heavily tested here at Notebookcheck in the past, and it’s a strong performer. This is a 14 nm hexacore CPU with a clock rate ranging from 2.2 up to 4.1 GHz (4 GHz for 4 cores, 3.9 GHz for 6 cores). It features Hyper-Threading technology which allows for 12 concurrent processing threads.
In our benchmarks, single-core performance is right in line with the average for the CPU; we recorded 173 points in Cinebench R15 64-bit versus the average of 172 points. However, multi-core performance was blisteringly fast, with a score of 1238 points—11 percent above the average of 1113 points, and the highest of any machine in today’s comparison field.
This is thanks in no small part to the ability of the laptop to maintain strong performance over longer periods of stress as compared to its competitors. To explore this, we run our Cinebench R15 multi-CPU loop test, which subjects the machine to several dozen consecutive runs of the benchmark back-to-back, recording each result in the process. With few exceptions, where most competitors falter is beyond the first or second test run of this test—but, while the Y740 did see a drop, it was a minor one of just around 2.5%, moving from the initial score of 1210 down to around the 1180 mark permanently after a few runs in. By comparison, the Alienware m15 actually posted a higher initial result, but it drops quickly down to around 1165 points a few runs later—around a 4 percent drop. Other competitors, many of which feature the exact same CPU (Gigabyte Aero 15-X9, Acer Predator Triton 500, HP Omen 15), can’t even manage an initial score of anywhere close to the Legion’s sustained scores.
| Cinebench R10 | |
| Rendering Multiple CPUs 32Bit | |
| Average of class Gaming (32456 - 112749, n=24, last 2 years) | |
| Gigabyte Aero 15-X9 | |
| Average Intel Core i7-8750H (29664 - 35307, n=25) | |
| HP Omen 15-dc0015ng | |
| Rendering Single 32Bit | |
| Average of class Gaming (5719 - 15819, n=24, last 2 years) | |
| Average Intel Core i7-8750H (6236 - 6645, n=25) | |
| HP Omen 15-dc0015ng | |
| Gigabyte Aero 15-X9 | |
System Performance
When paired with a Samsung PM981 NVMe SSD, such speed ought to translate to great general system performance scores. In our synthetic benchmarks, a PCMark 10 score of 5941 and PCMark 8 Home and Work scores of 5115 and 5852 speak for themselves. All of these top their respective charts.
Subjectively, the system absolutely flies. We experienced no hiccups or slowdowns throughout our testing period.
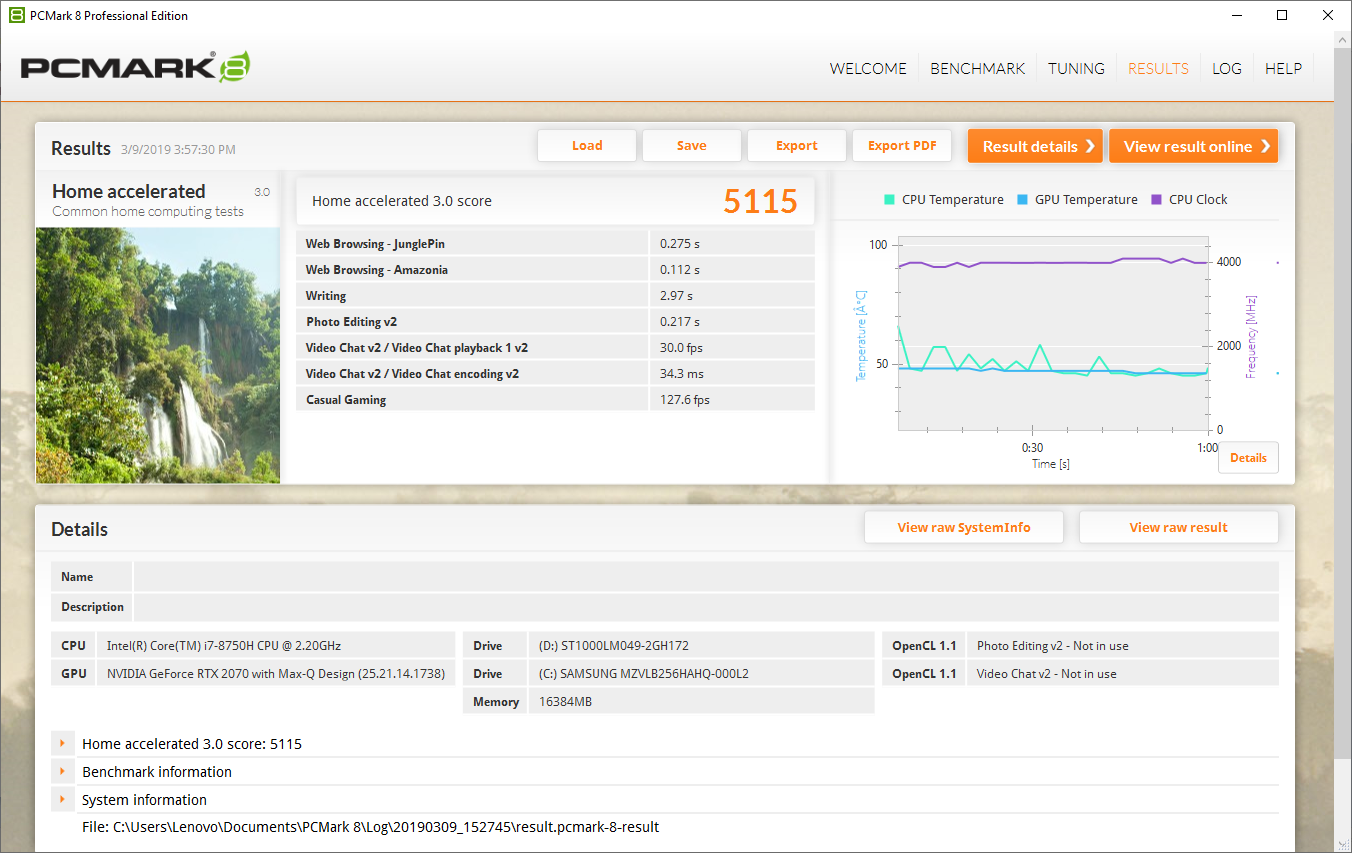
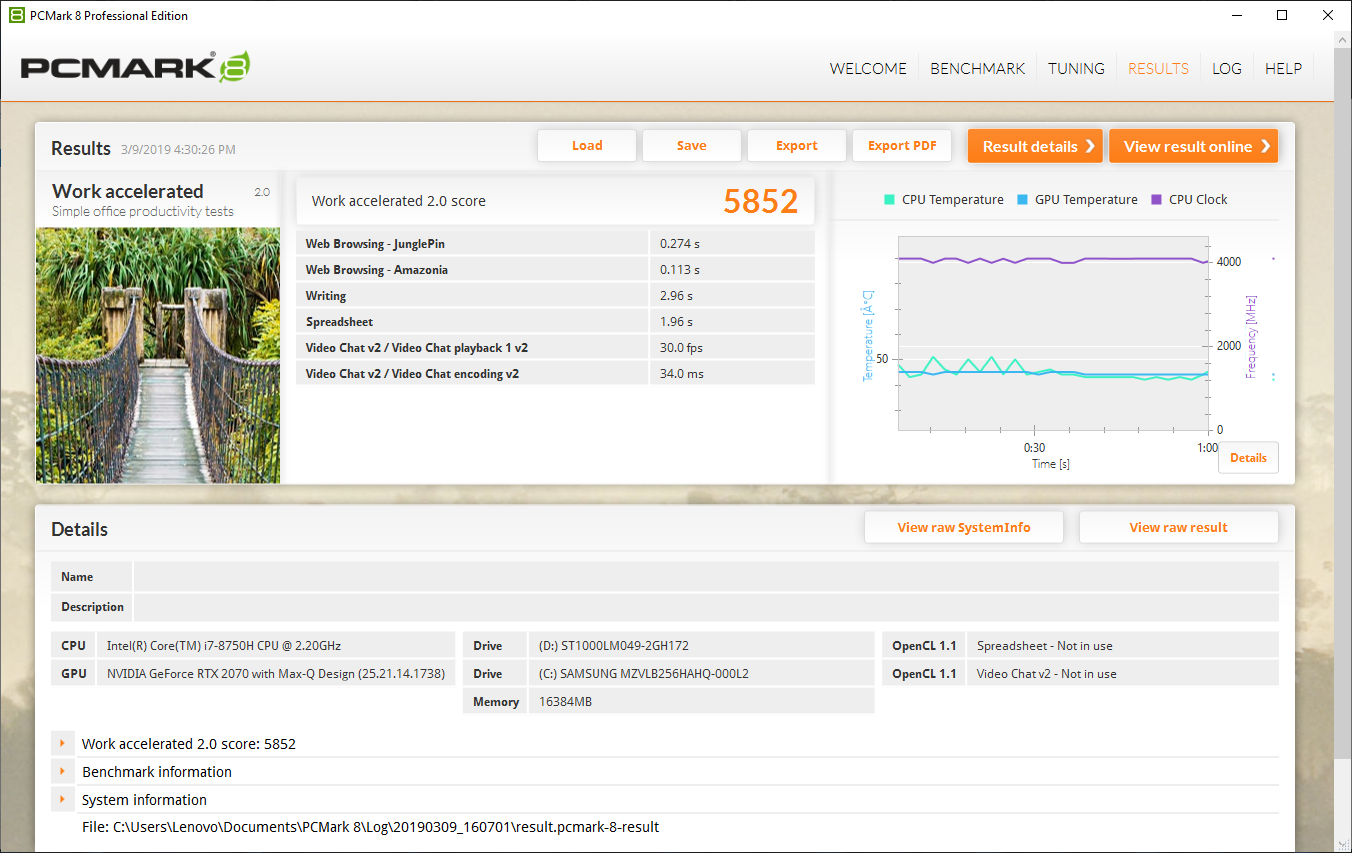

| PCMark 8 Home Score Accelerated v2 | 5115 points | |
| PCMark 8 Work Score Accelerated v2 | 5852 points | |
| PCMark 10 Score | 5941 points | |
Help | ||
Storage Devices
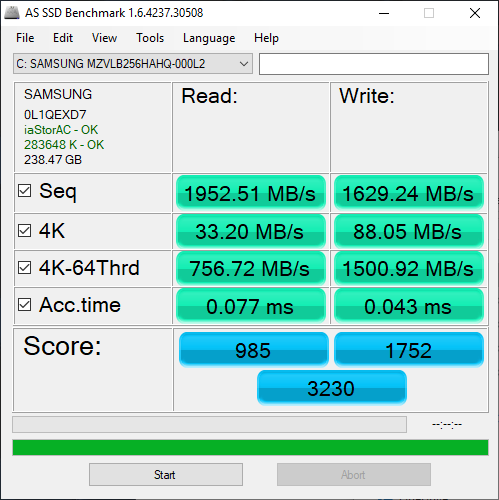
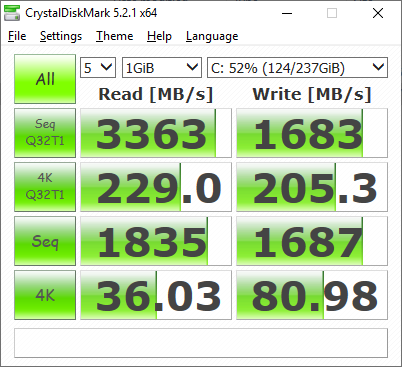
The Y740 is configurable with either a conventional mechanical hard drive or a solid-state drive. The system supports PCIe 3.0 x 4 over the NVMe M.2 slot, and unlike in the case of our Y530, the full-length M.2 2280 SSD—a Samsung PM981—that came preinstalled in our review unit is able to perform to its full potential. Our configuration pairs that highly-rated SSD with a 7200 RPM mechanical drive for storage.
The PM981 has repeatedly shown itself in our testing to be among the fastest SSDs currently available, and the Y740’s storage performance is no exception to that trend. With AS SSD read/write scores of 985 and 1752, we’ve certainly had better results from other machines, but as we’re always quick to remind, returns are diminishing beyond a certain point. It’s nice to have a hard drive for additional storage (game program files, etc.) as well, but of course, it’s an optional extra. It’s not clear whether orders without a 2.5-inch drive still include the hard drive interposer cable, by the way, so keep that in mind if you order an M.2-only configuration with plans to upgrade to dual storage in the future.
| Lenovo Legion Y740-15ICHg Samsung SSD PM981 MZVLB256HAHQ | Gigabyte Aero 15-X9 Intel SSD 760p SSDPEKKW010T8 | Acer Predator Triton 500 2x WDC PC SN720 SDAPNTW-256G-1014 (RAID 0) | Razer Blade 15 RTX 2070 Max-Q Samsung SSD PM981 MZVLB512HAJQ | Alienware m15 GTX 1070 Max-Q Toshiba XG5 KXG50ZNV512G | |
|---|---|---|---|---|---|
| AS SSD | |||||
| Seq Read | 1953 | 2113 8% | 2913 49% | 1840 -6% | 1967 1% |
| Seq Write | 1629 | 1471 -10% | 2492 53% | 1822 12% | 1135 -30% |
| 4K Read | 33.2 | 55 66% | 38.7 17% | 52.3 58% | 29.17 -12% |
| 4K Write | 88.1 | 107.1 22% | 107.2 22% | 110.7 26% | 93.4 6% |
| 4K-64 Read | 757 | 914 21% | 1228 62% | 1126 49% | 995 31% |
| 4K-64 Write | 1501 | 703 -53% | 1079 -28% | 1717 14% | 656 -56% |
| Access Time Read * | 0.077 | 0.114 -48% | 0.047 39% | 0.116 -51% | |
| Access Time Write * | 0.043 | 0.034 21% | 0.035 19% | 0.033 23% | 0.063 -47% |
| Score Read | 985 | 1180 20% | 1558 58% | 1362 38% | 1221 24% |
| Score Write | 1752 | 957 -45% | 1435 -18% | 2010 15% | 862 -51% |
| Score Total | 3230 | 2722 -16% | 3770 17% | 4079 26% | 2667 -17% |
| Copy ISO MB/s | 1872 | 1864 0% | 1975 6% | 642 -66% | |
| Copy Program MB/s | 478.2 | 362.6 -24% | 526 10% | 431.5 -10% | |
| Copy Game MB/s | 1165 | 936 -20% | 1200 3% | 706 -39% | |
| CrystalDiskMark 5.2 / 6 | |||||
| Write 4K | 81 | 97.1 20% | 93.6 16% | 93.9 16% | 107.4 33% |
| Read 4K | 36.03 | 53.7 49% | 38.82 8% | 40.56 13% | 42.91 19% |
| Write Seq | 1687 | 1526 -10% | 2455 46% | 1468 -13% | 467.5 -72% |
| Read Seq | 1835 | 2020 10% | 2107 15% | 1540 -16% | 2335 27% |
| Write 4K Q32T1 | 205.3 | 285.6 39% | 298.7 45% | 293.5 43% | 289.7 41% |
| Read 4K Q32T1 | 229 | 321.8 41% | 338.7 48% | 346 51% | 354.4 55% |
| Write Seq Q32T1 | 1683 | 1533 -9% | 2902 72% | 1941 15% | 460.9 -73% |
| Read Seq Q32T1 | 3363 | 2351 -30% | 3536 5% | 3266 -3% | 3111 -7% |
* ... smaller is better

GPU Performance
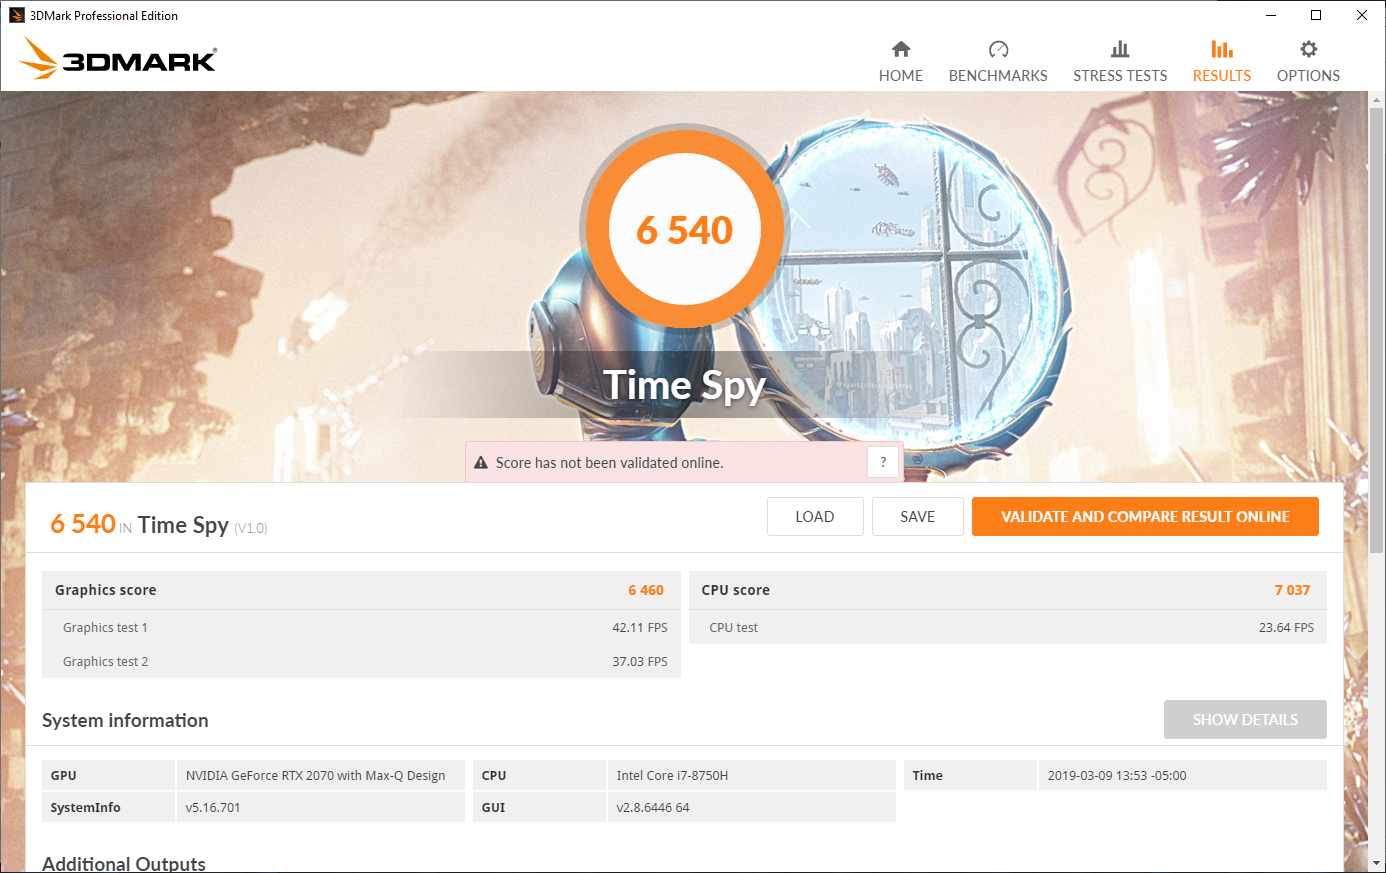
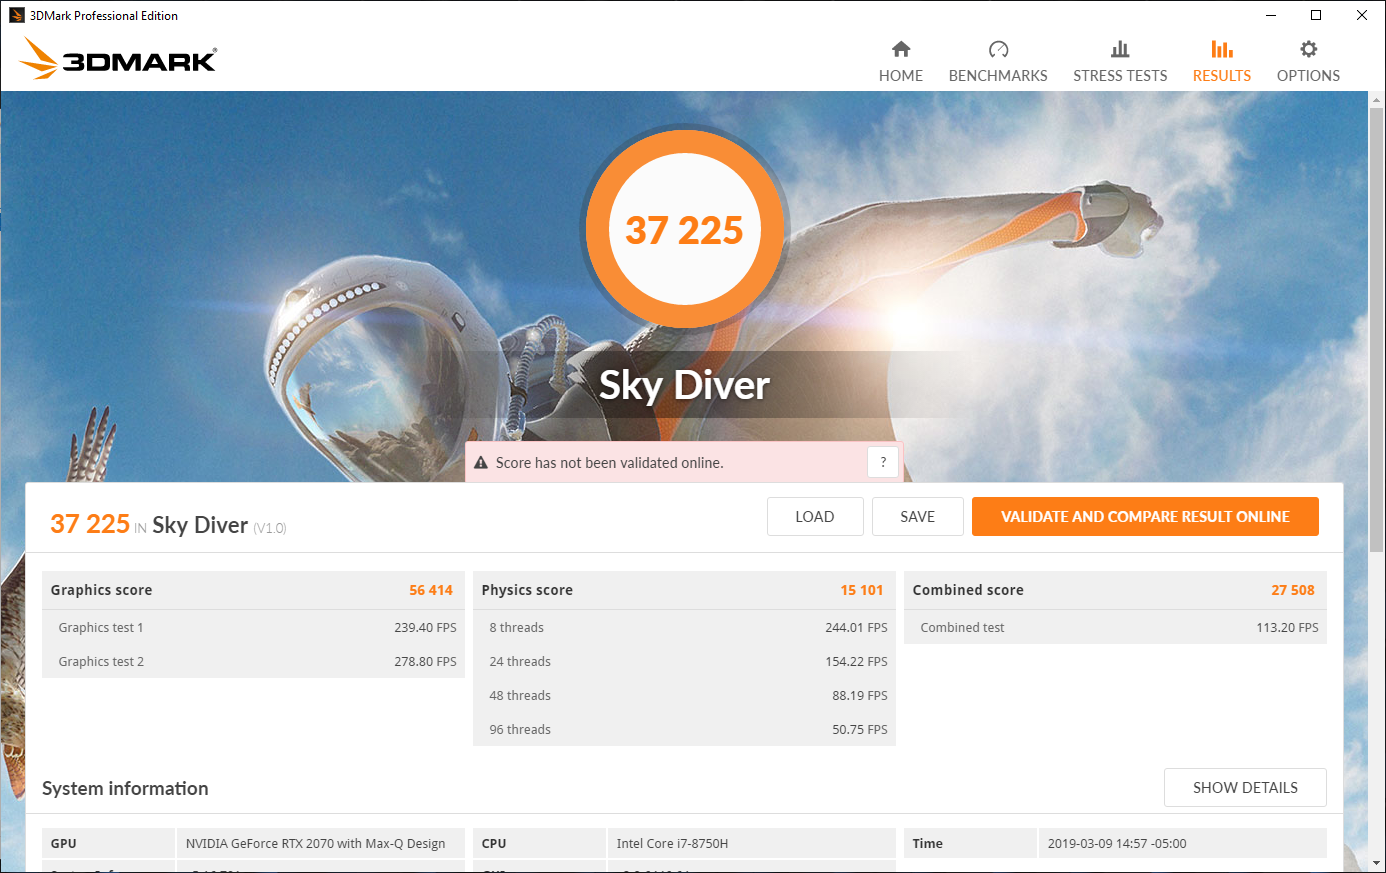
The NVIDIA GeForce RTX 2070 Max-Q features performance somewhere between a conventional RTX 2060 and an RTX 2070. With a few exceptions, most of our 3DMark benchmarks are almost perfectly aligned with the averages, but we’ve also only got a few samples in our database thus far for this adapter.
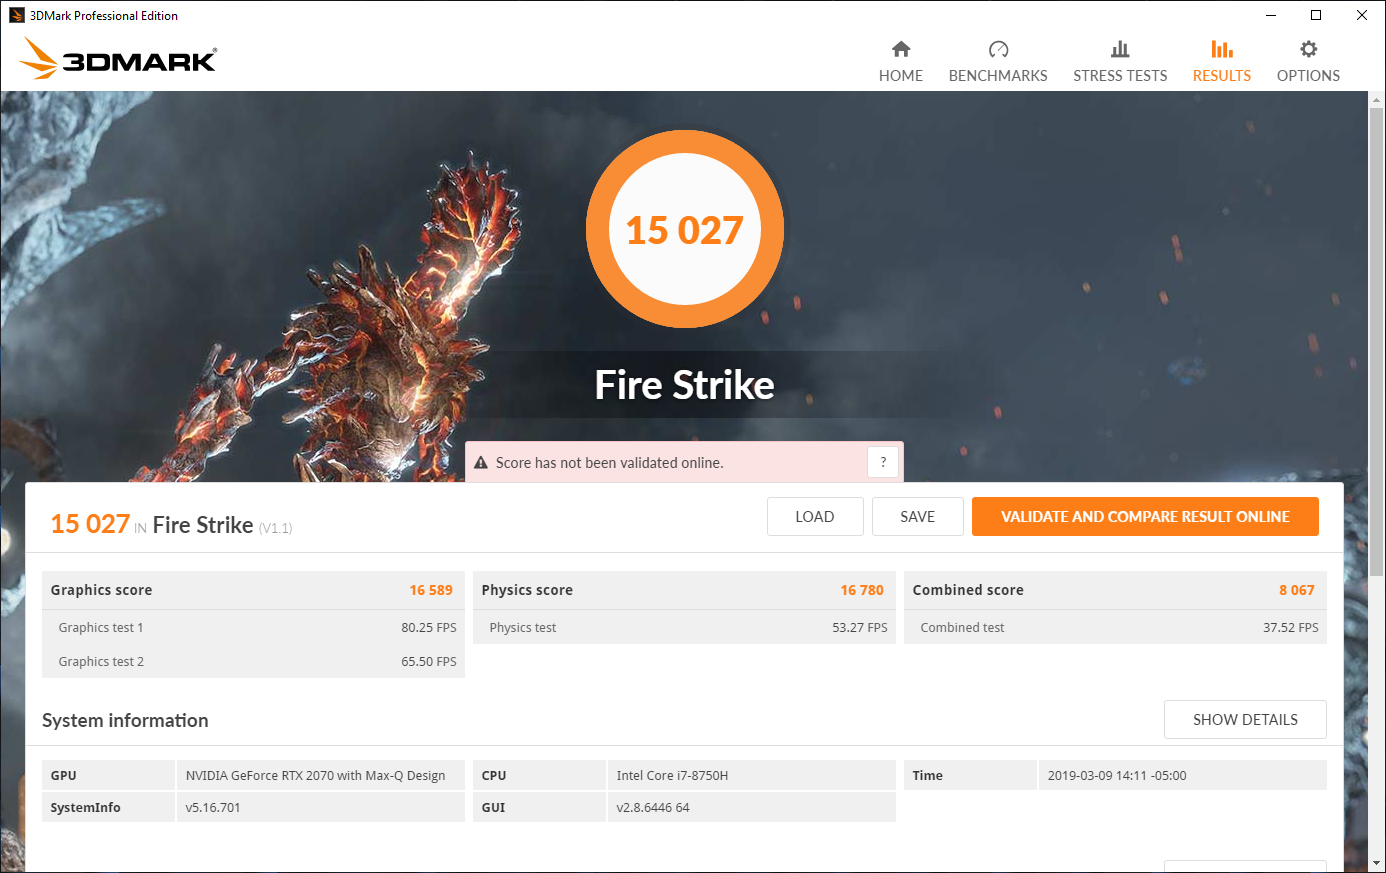
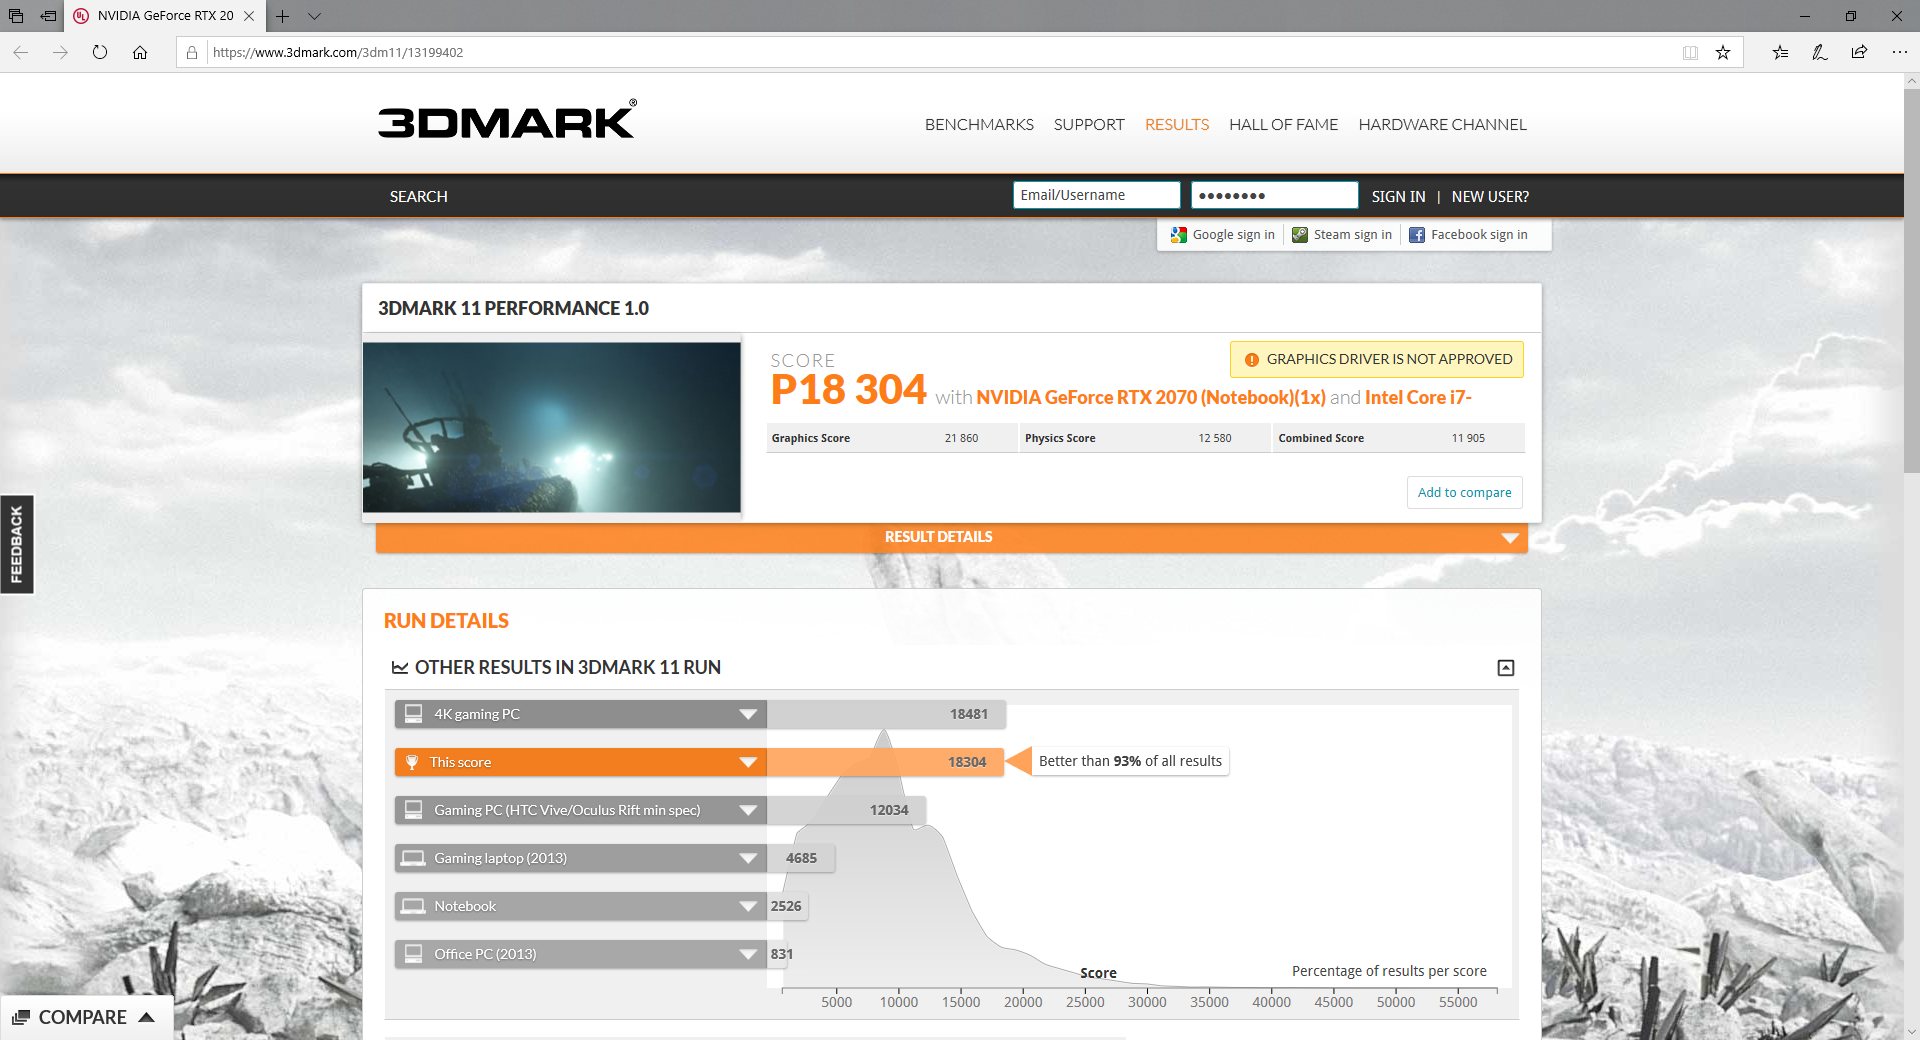
What’s clear, however, is that it’s incredibly fast—much more powerful than the GTX 1050 Ti in last gen’s Y730 review unit (over twice as fast in fact). In 3DMark 11 Graphics, we receive a score of 21860, which is close to the performance of a GTX 1070 (non-Max-Q), which averages around 22,500. In 3DMark Fire Strike Graphics, the score of 16589 is not far off the GTX 1070’s average of around 17000. These are impressive scores for a machine of this size, especially considering (as we’ll see later) the reasonable surface temperatures and noise levels.
Still, faster laptops with this same GPU exist. The Legion Y740 is near the middle of the pack always in our results, but the Gigabyte Aero 15-X9 and Razer Blade 15 have a slight edge over it (a few percentage points) in most GPU benchmarks.
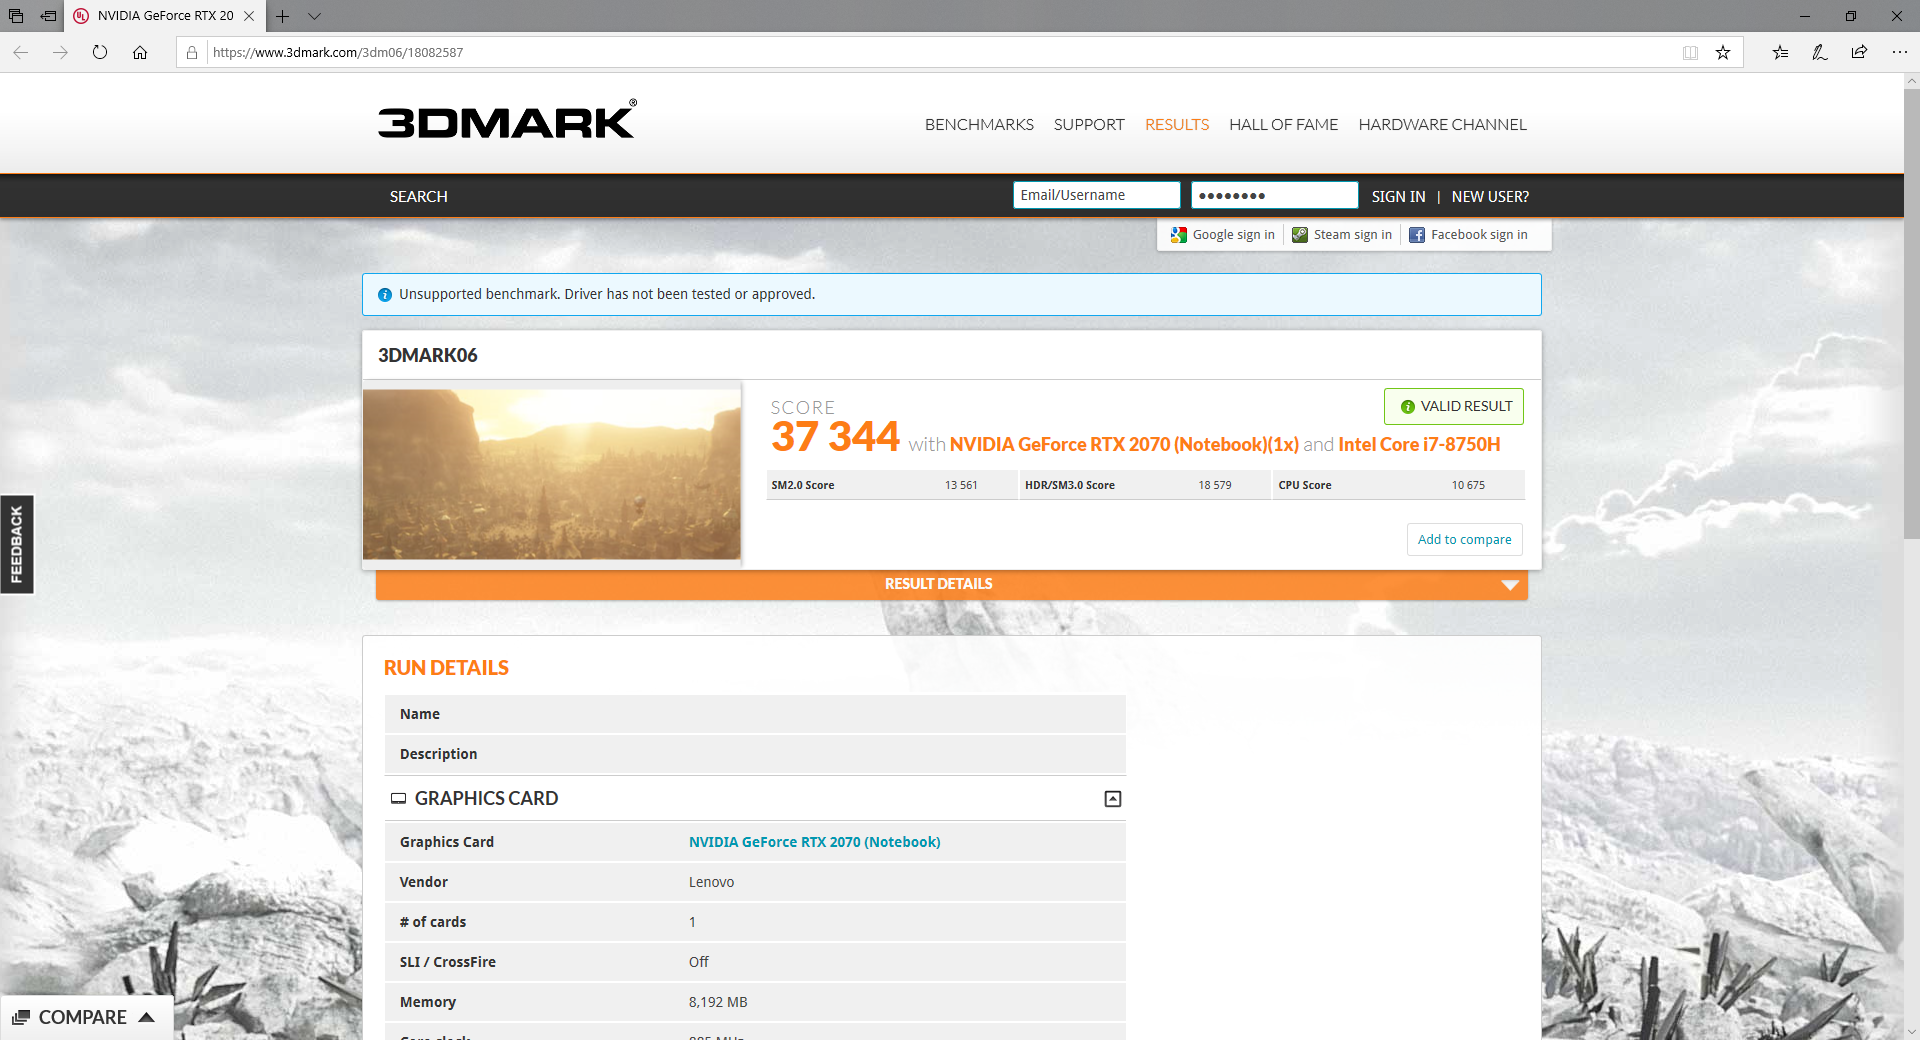
| 3DMark 06 Standard Score | 37344 points | |
| 3DMark 11 Performance | 18304 points | |
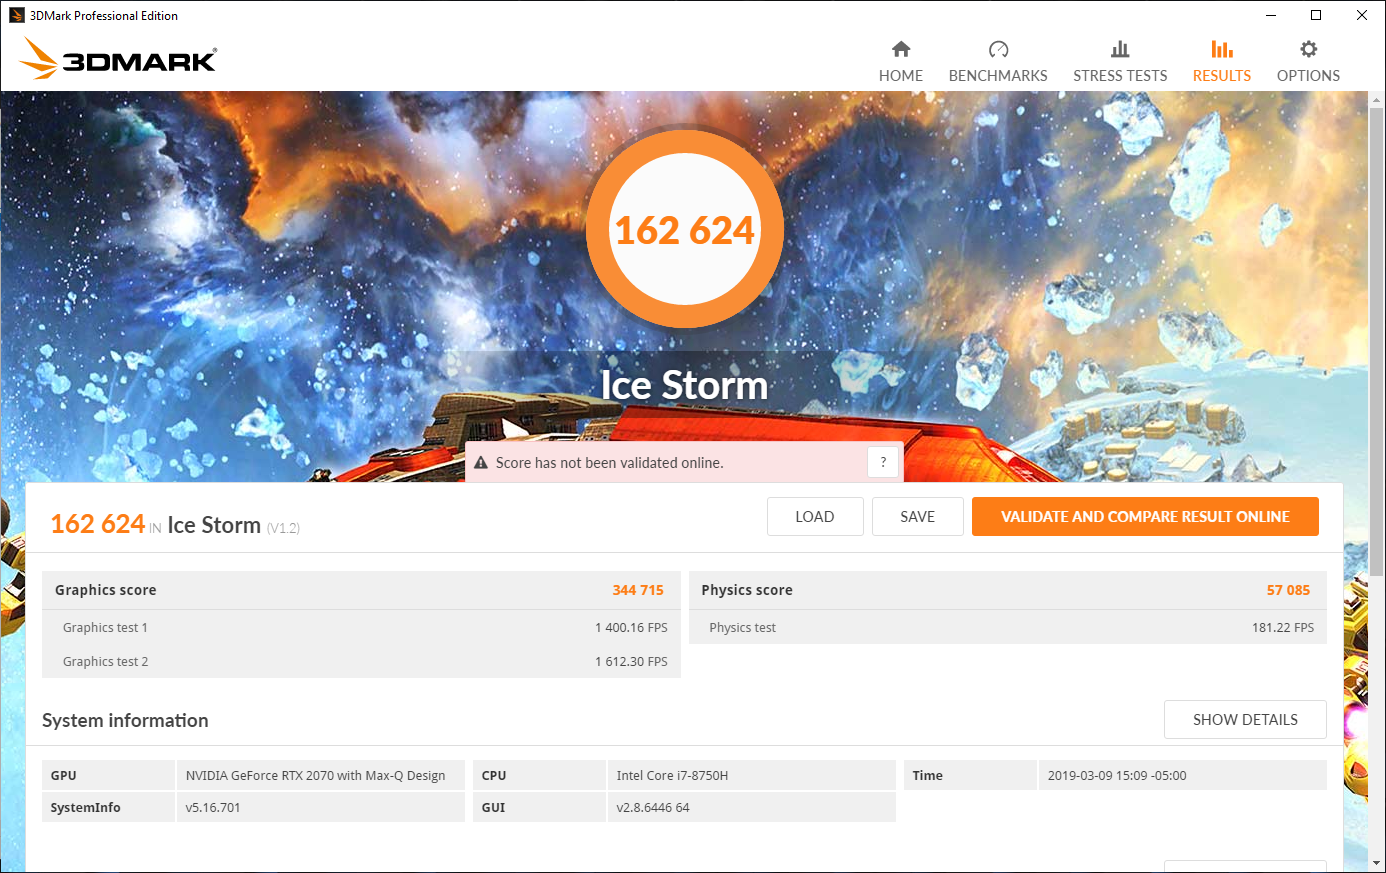
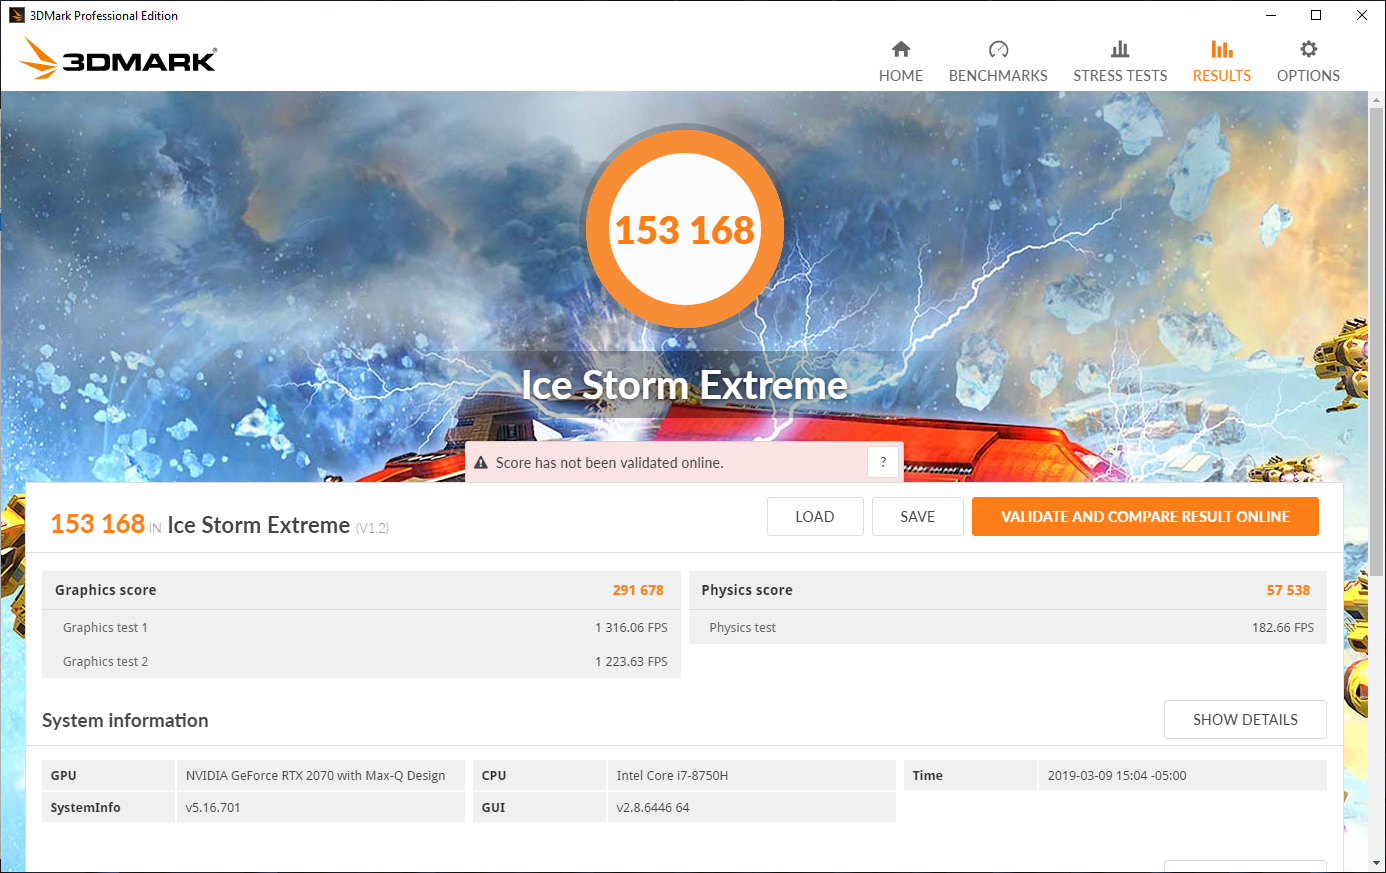
| 3DMark Ice Storm Standard Score | 162624 points | |
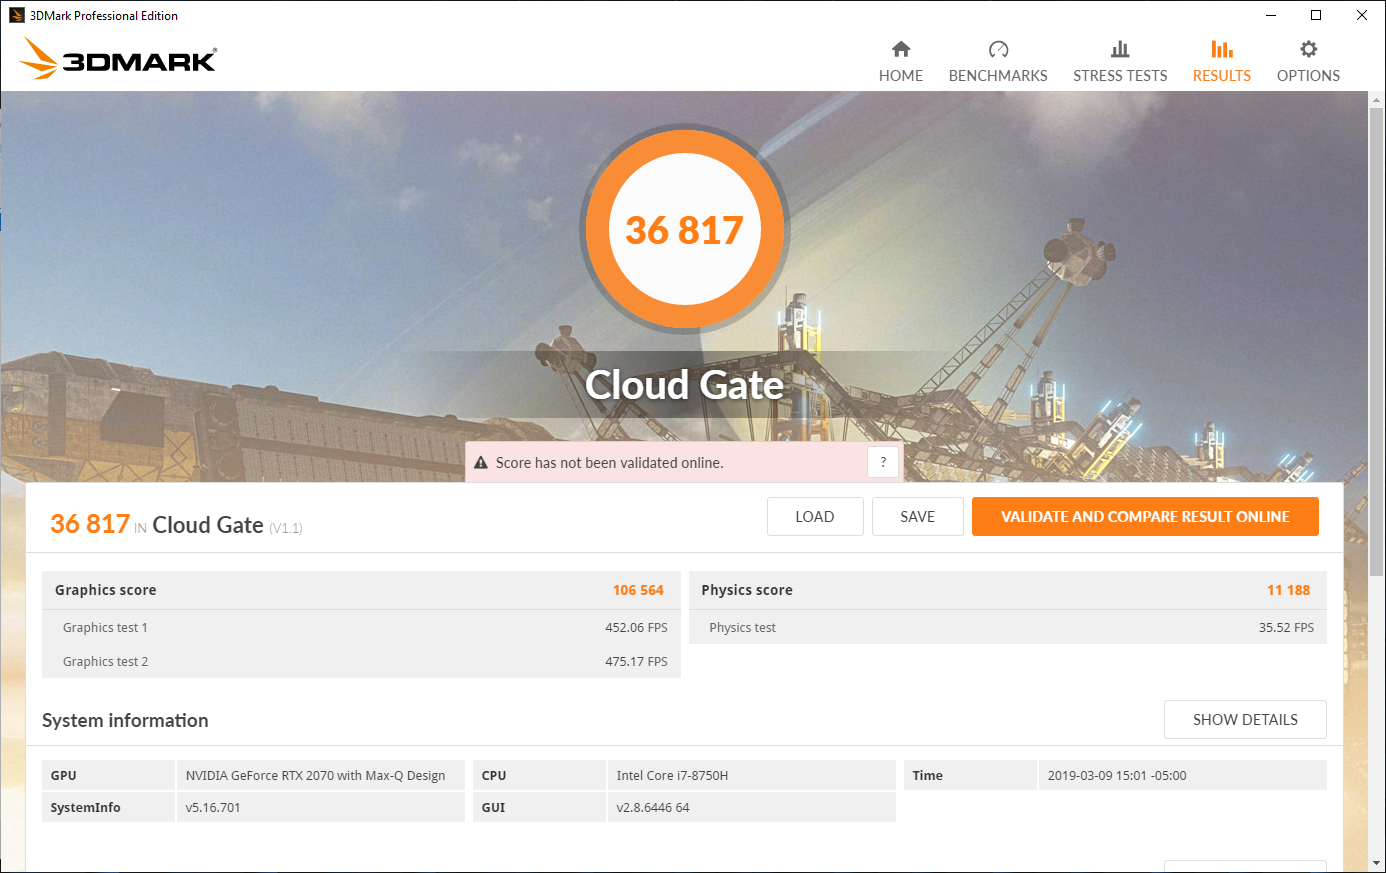
| 3DMark Cloud Gate Standard Score | 36817 points | |
| 3DMark Fire Strike Score | 15027 points | |
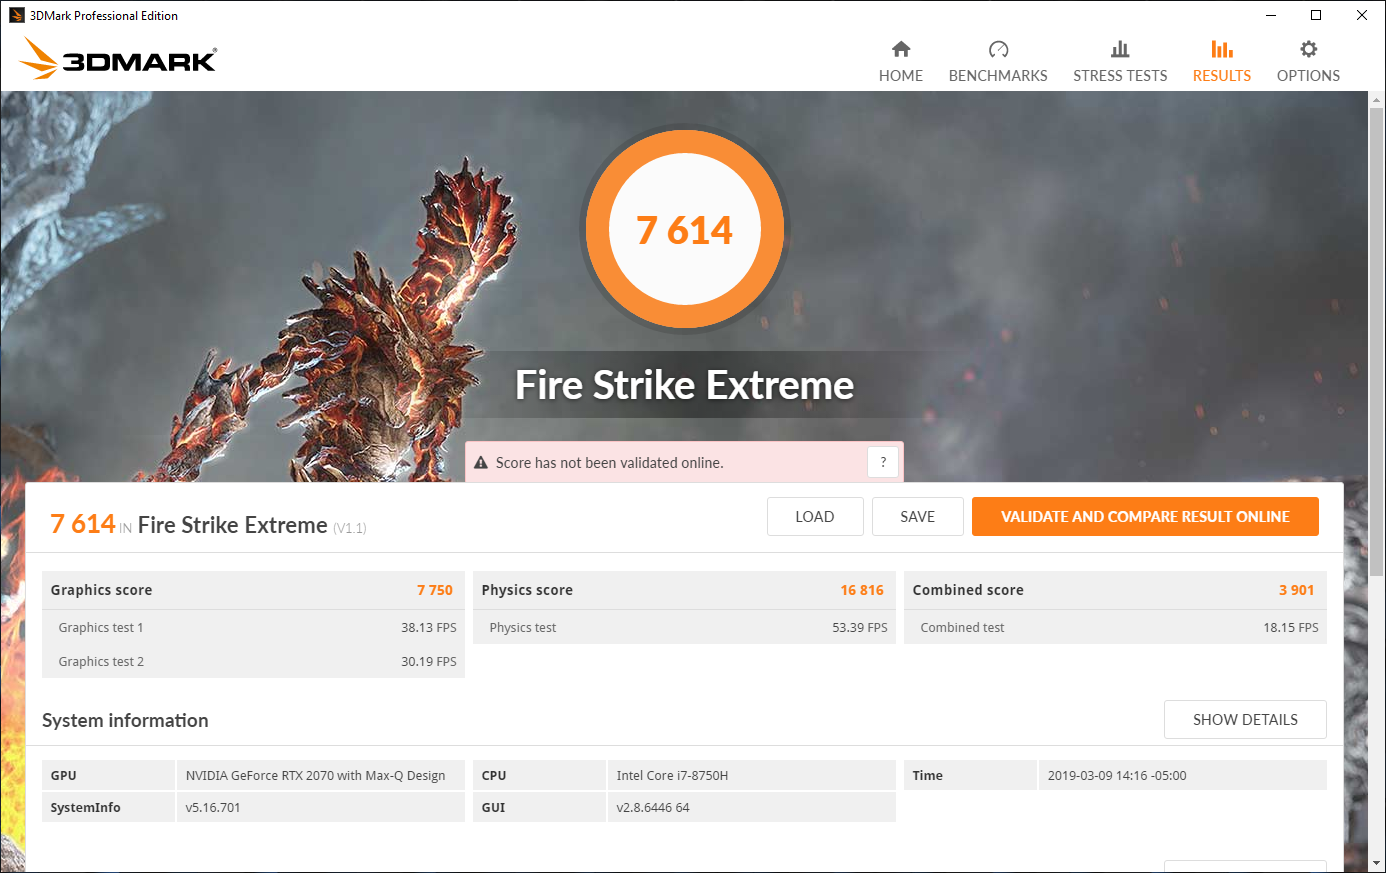
| 3DMark Fire Strike Extreme Score | 7614 points | |
| 3DMark Time Spy Score | 6540 points | |
Help | ||
Gaming Performance
In terms of real-world gaming, the Y740 can handle practically anything you throw at it at native resolution (1920x1080) and high/ultra settings. However, most games will not reach a stable 144 frames per second when playing on higher settings—so the full capabilities of the 144 Hz display won’t be leveraged in those cases. In older games, such as BioShock Infinite, which manages 211 frames per second even at Ultra settings, we can see that this normally isn’t an issue. But most newer heavy-duty titles will need to be played on low/medium for the same results.
| Batman: Arkham Knight | |
| 1280x720 Low / Off AF:Trilinear | |
| Lenovo Legion Y740-15ICHg | |
| Average NVIDIA GeForce RTX 2070 Max-Q () | |
| 1366x768 Normal / Off AF:4x | |
| Lenovo Legion Y740-15ICHg | |
| Average NVIDIA GeForce RTX 2070 Max-Q () | |
| 1920x1080 High / On (Interactive Smoke & Paper Debris Off) AA:SM AF:8x | |
| Lenovo Legion Y740-15ICHg | |
| Average NVIDIA GeForce RTX 2070 Max-Q () | |
| 1920x1080 High / On AA:SM AF:16x | |
| Lenovo Legion Y740-15ICHg | |
| Average NVIDIA GeForce RTX 2070 Max-Q () | |
| low | med. | high | ultra | |
| BioShock Infinite (2013) | 302 | 282 | 261 | 211 |
| The Witcher 3 (2015) | 57 | |||
| Batman: Arkham Knight (2015) | 163 | 153 | 129 | 87 |
| Rise of the Tomb Raider (2016) | 231 | 184 | 116 | 100 |
Emissions
System Noise
Like its bigger brother, the 17.3-inch Y740-17ICH, the 15ICH is a remarkably quiet machine given its level of capability. Lenovo attributes this to their new-and-improved Legion Coldfront dual-channel thermal system, which features revamped fans with 70 individual blades per channel to help simultaneously increase airflow and reduce noise. The Witcher 3 stress only provokes fan noise levels of 41.6 dB(A), which is not all that noticeable if the audio volume is moderate or higher.
On High Performance and Balanced profiles, the fans practically always run, even while idling (albeit at low RPM). The mechanical hard drive can also be heard during use, though tweaking your power plan to spin it down after several minutes of dormancy can help to mitigate this. A quick fix for both is to switch to Power Saver when you’re in a situation where you need more quiet than power; doing so favors passive cooling at lower chip temperatures and disengages the hard drive when not in use.
Noise Level
| Idle |
| 32.6 / 32.7 / 32.7 dB(A) |
| Load |
| 33.3 / 45.2 dB(A) |
 | ||
30 dB silent 40 dB(A) audible 50 dB(A) loud |
||
min: | ||
Temperature
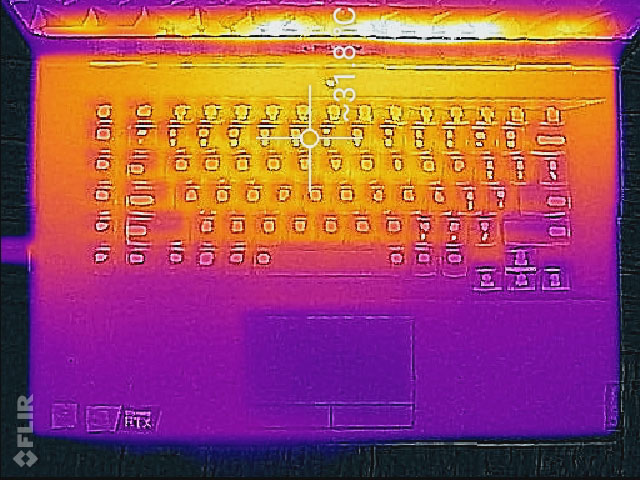
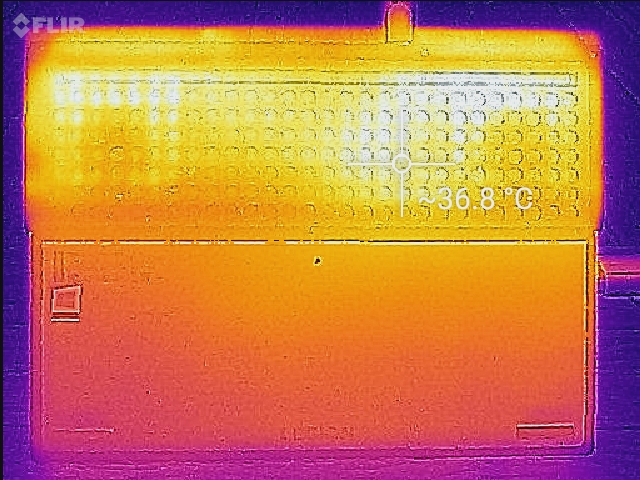
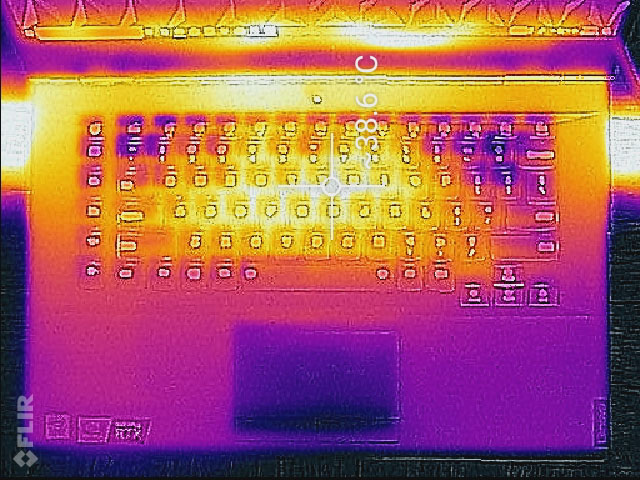
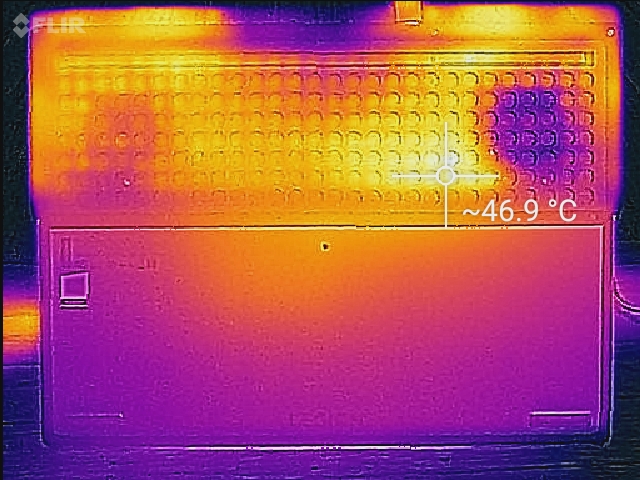
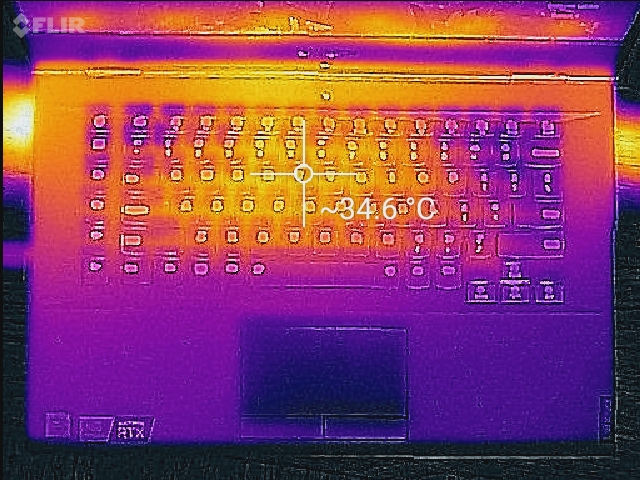
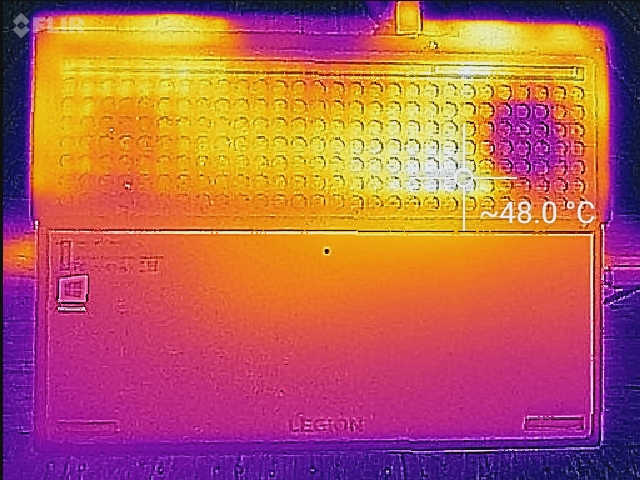
While every bit as quiet, the 15-inch Y740 does get quite a bit warmer under load than its 17.3-inch counterpart. We measure hot spots of up to 37.6 °C in the keyboard area (center top quadrant) and up to a hot 48 °C on the underside. The entire right side and rear of the machine on the bottom reaches temperatures easily exceeding 40 °C under stress, so take care to ensure that adequate ventilation is provided for gaming.
Stress Test
CPU stress poses no real challenge for the Legion Y740-15ICH; we record stable clock rates of 3.7 – 3.8 GHz across all six cores with a chip temperature measurement of 80 °C. GPU stress, likewise, is no big deal: temperatures remain at 70 °C and clock rates are mostly stable between 1000 MHz and 1070 MHz on average.
Combined stress is a bit of a different story. CPU remains at turbo frequencies of 3.7 GHz (across all cores), but the GPU finds itself stuck between 700 MHz and 1000 MHz, often below its base frequency. Temperatures are 90 °C CPU / 62 °C.
These conditions aren’t likely to manifest in real-world gaming conditions, however. For instance, while running Witcher 3, frame rates remain relatively stable throughout, without any significant drop-outs or signs of struggle. The small dip near the end isn’t related to temperature or similar factors; our logs show temperatures stable at around 72 to 73 °C for the duration of the test.
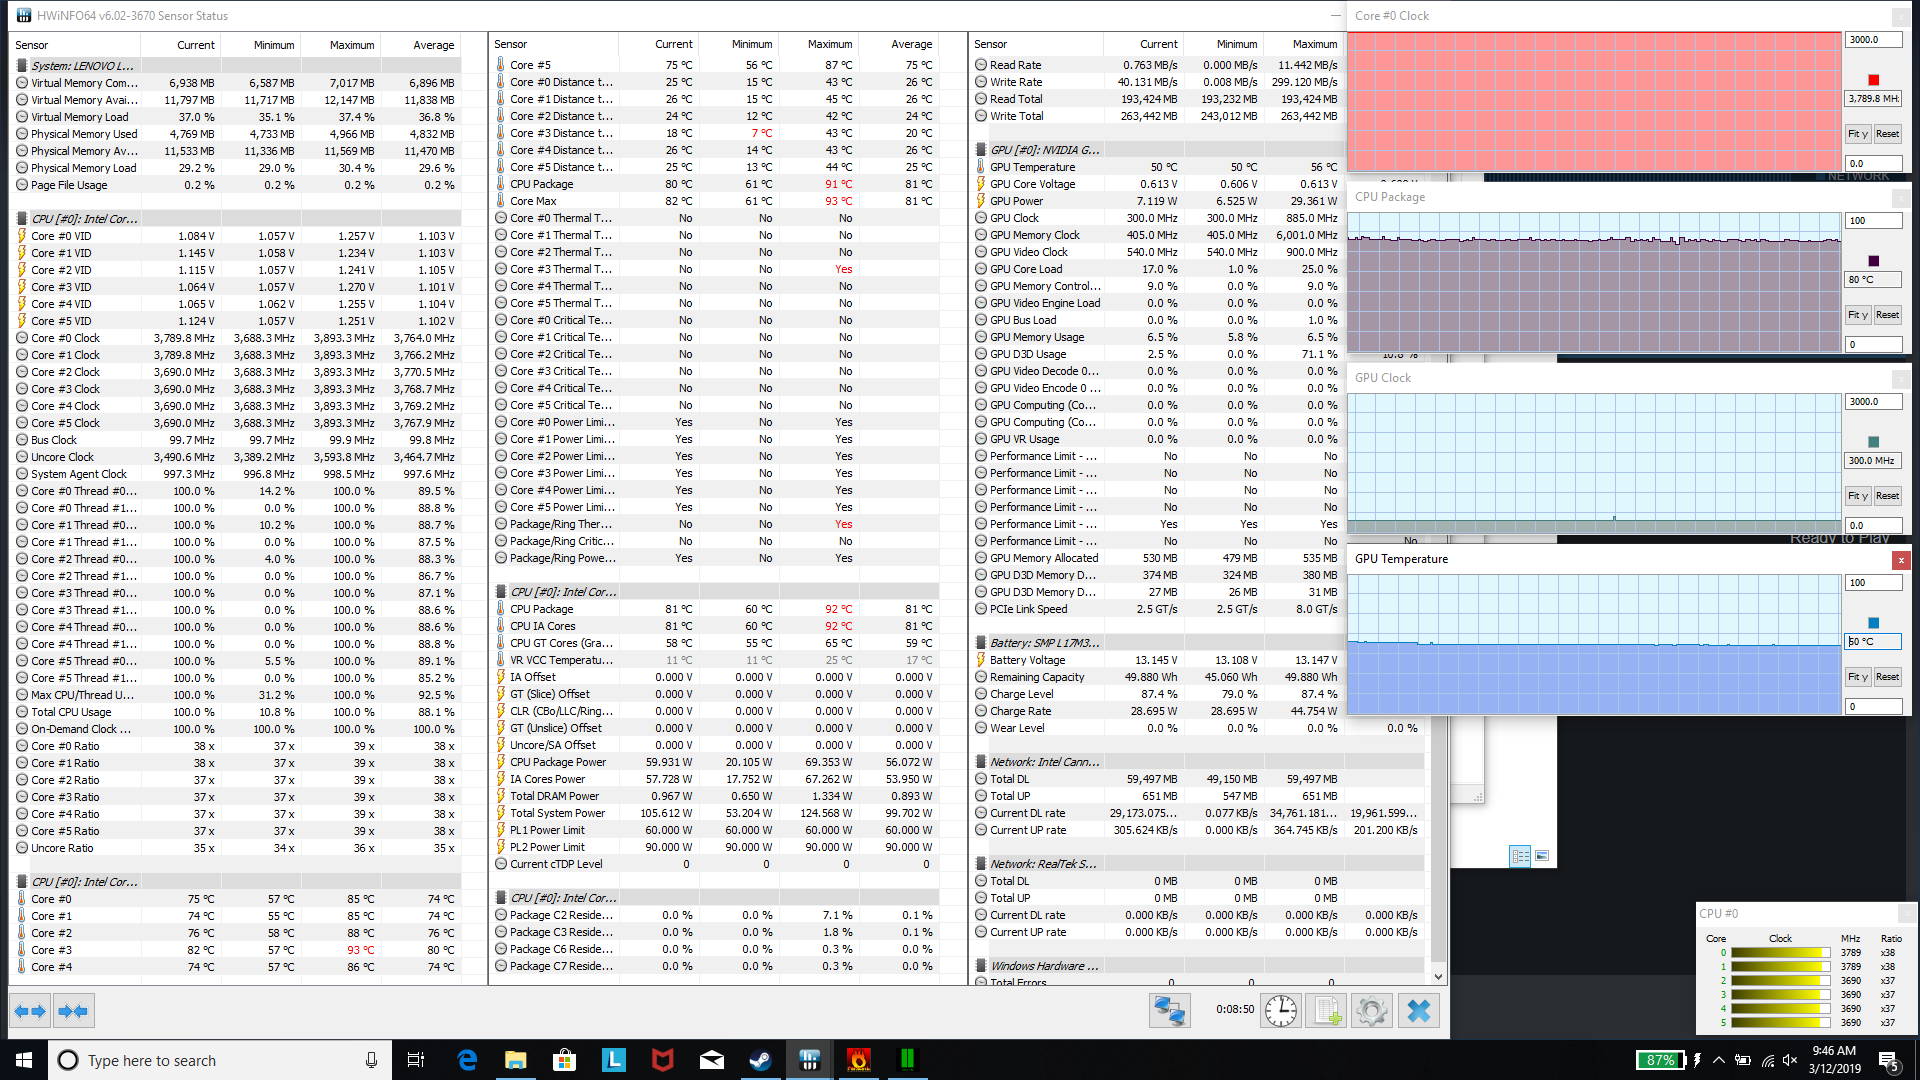
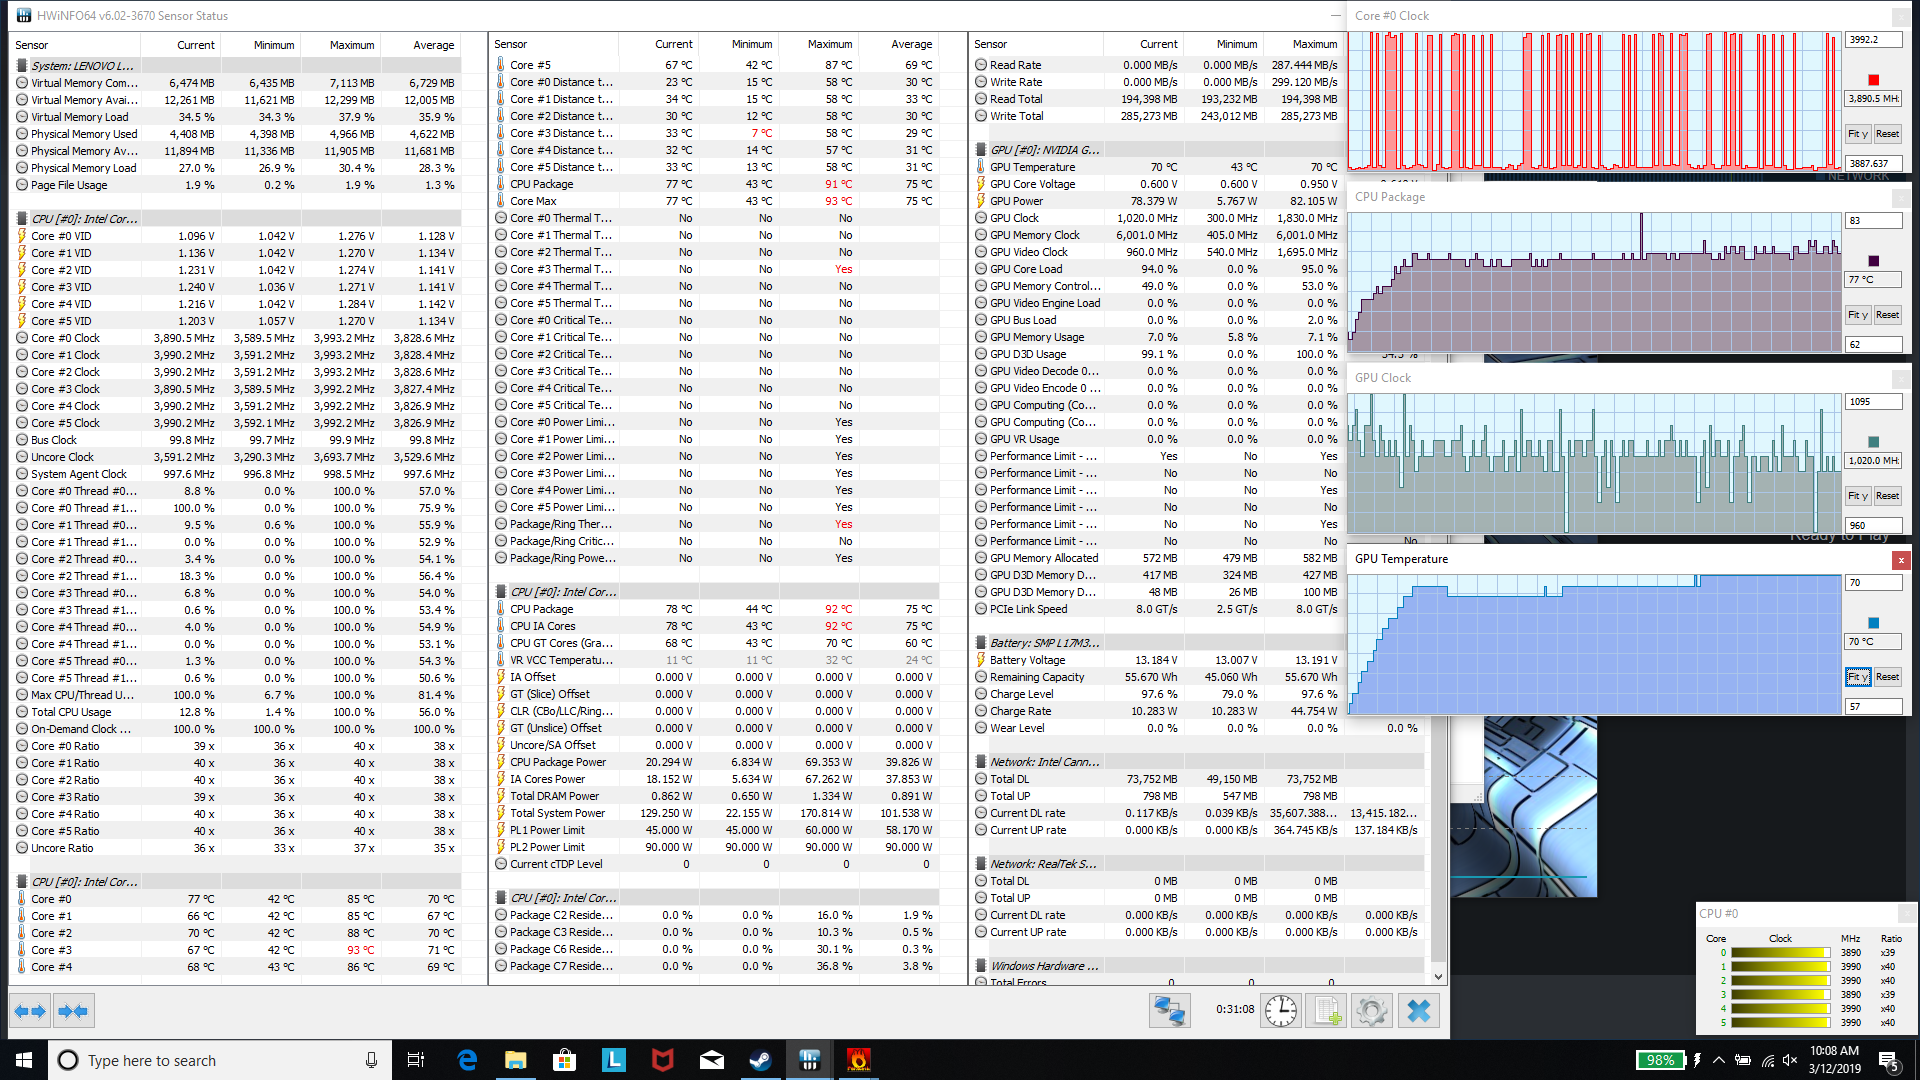
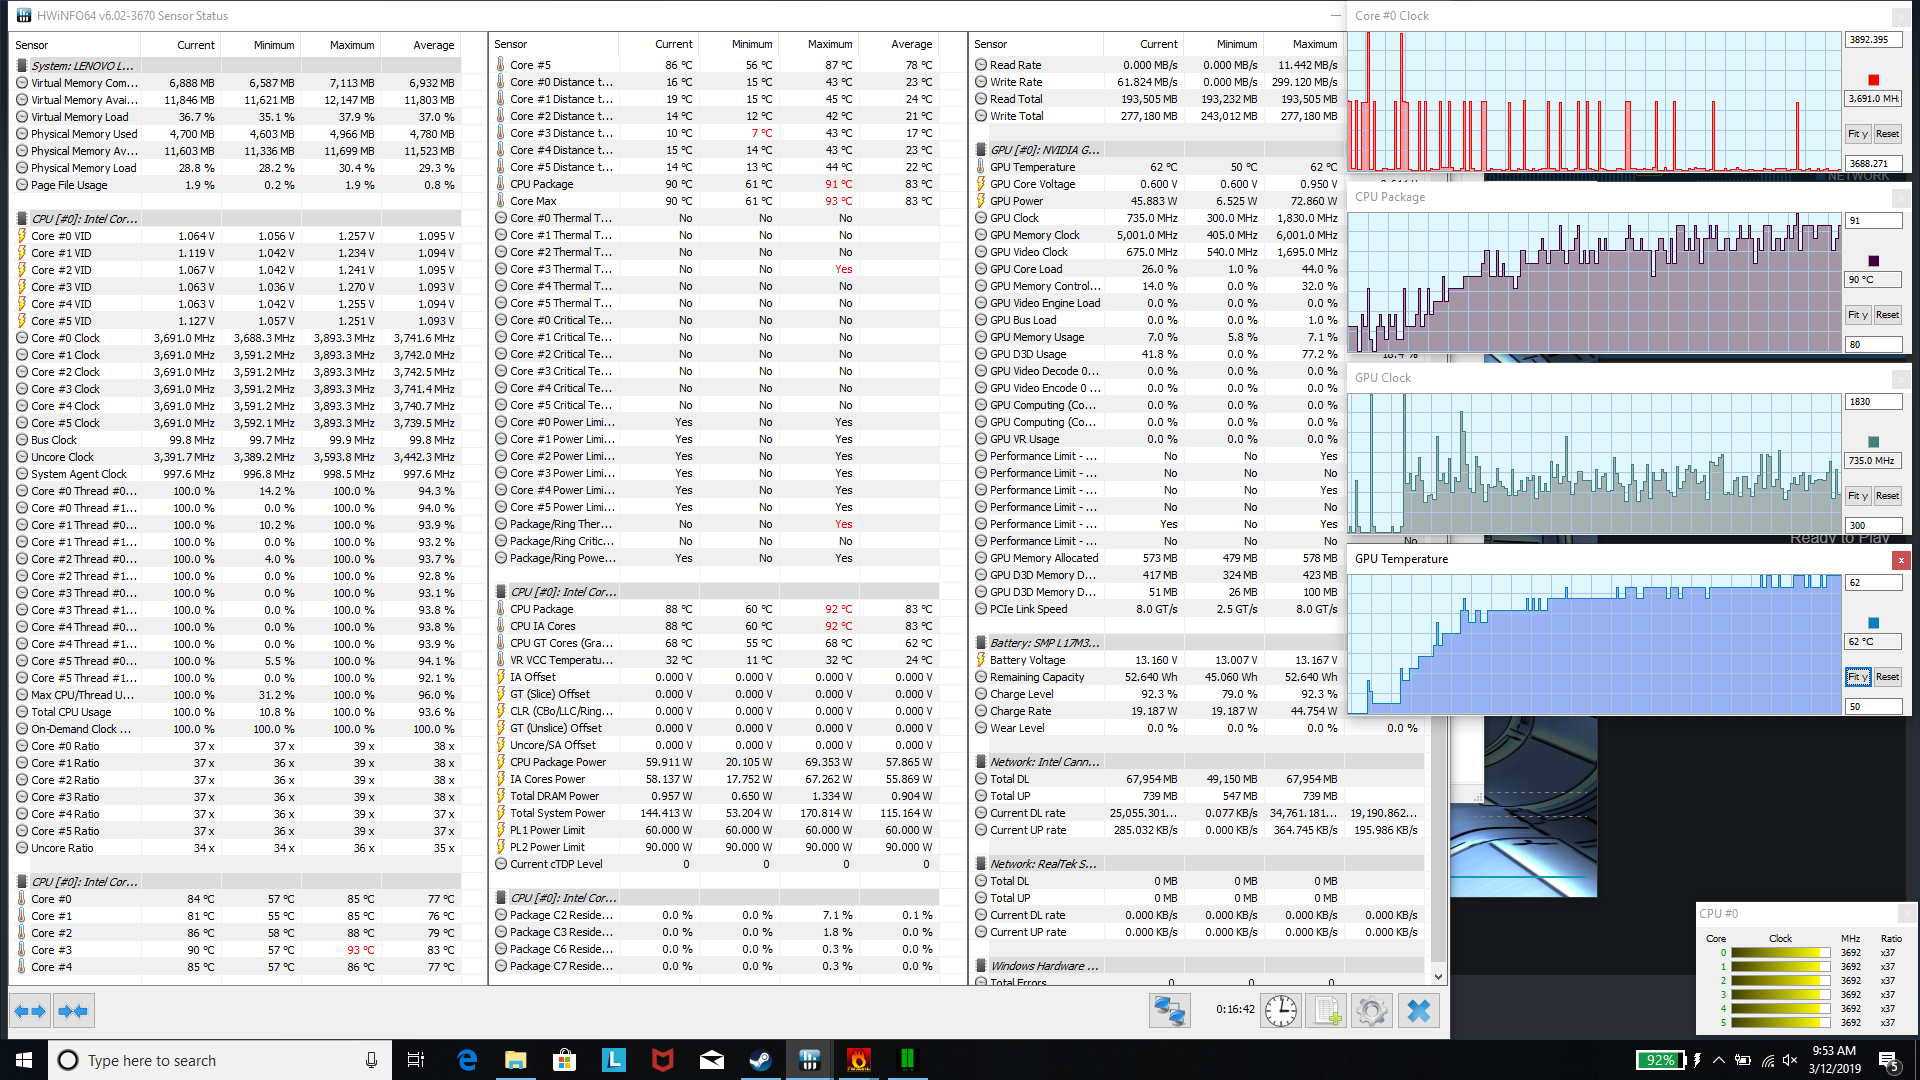
| CPU Clock (GHz) | GPU Clock (MHz) | Average CPU Temperature (°C) | Average GPU Temperature (°C) | |
| Prime95 Stress | 3.7 - 3.8 | - | 80 | - |
| FurMark Stress | - | 1000 - 1070 | - | 70 |
| Prime95 + FurMark | 3.7 | 700 - 1000 | 90 | 62 |
| Witcher 3 Stress | 3.9 | 1400 | 76 | 72 |
(+) The maximum temperature on the upper side is 37.6 °C / 100 F, compared to the average of 40.4 °C / 105 F, ranging from 21.2 to 68.8 °C for the class Gaming.
(-) The bottom heats up to a maximum of 45.2 °C / 113 F, compared to the average of 43.2 °C / 110 F
(+) In idle usage, the average temperature for the upper side is 28 °C / 82 F, compared to the device average of 33.8 °C / 93 F.
(+) Playing The Witcher 3, the average temperature for the upper side is 29.5 °C / 85 F, compared to the device average of 33.8 °C / 93 F.
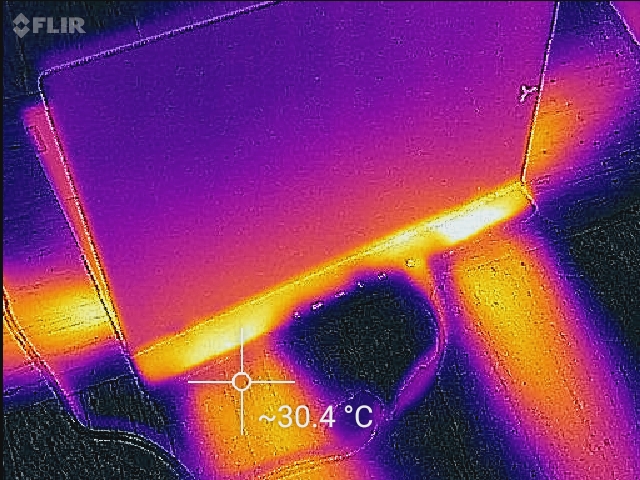
(+) The palmrests and touchpad are cooler than skin temperature with a maximum of 29.2 °C / 84.6 F and are therefore cool to the touch.
(±) The average temperature of the palmrest area of similar devices was 28.9 °C / 84 F (-0.3 °C / -0.6 F).
Speakers

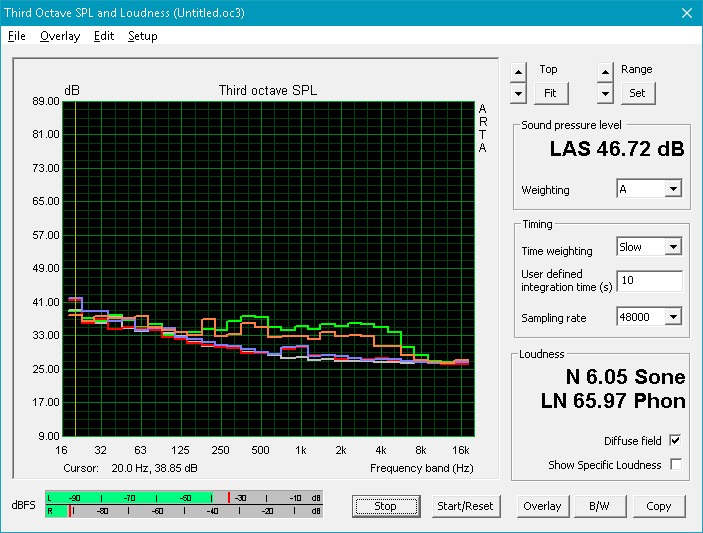
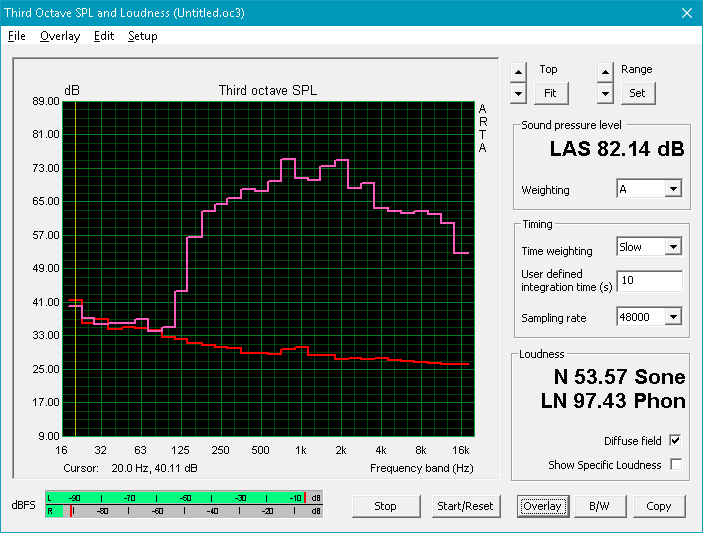
As promised (by Lenovo), the speakers on the Legion Y740-15ICHg are pretty decent as well. Their volume is good, reaching a measured 82.14 dB, and the shape of the audio is average or better across most of the spectrum, with the sole exception of the low frequencies, where the lack of a subwoofer hurts performance. The Dolby Atmos for Gaming post-processing software is one of the better software packages out there both in terms of interface and capability; it features plenty of preset profiles for various applications as well as full 10-point equalizer customization and added options such as surround virtualization, dialogue enhancement, and volume leveling. It is worth mentioning, however, that at higher levels (above half volume), distortion is evident amongst the low end frequencies.
Lenovo Legion Y740-15ICHg audio analysis
(+) | speakers can play relatively loud (82.1 dB)
Bass 100 - 315 Hz
(±) | reduced bass - on average 10.2% lower than median
(±) | linearity of bass is average (14.7% delta to prev. frequency)
Mids 400 - 2000 Hz
(±) | higher mids - on average 6.7% higher than median
(±) | linearity of mids is average (7% delta to prev. frequency)
Highs 2 - 16 kHz
(+) | balanced highs - only 2.6% away from median
(+) | highs are linear (6.5% delta to prev. frequency)
Overall 100 - 16.000 Hz
(±) | linearity of overall sound is average (19.8% difference to median)
Compared to same class
» 66% of all tested devices in this class were better, 7% similar, 27% worse
» The best had a delta of 6%, average was 18%, worst was 132%
Compared to all devices tested
» 45% of all tested devices were better, 7% similar, 48% worse
» The best had a delta of 4%, average was 25%, worst was 134%
Razer Blade 15 RTX 2070 Max-Q audio analysis
(-) | not very loud speakers (71.6 dB)
Bass 100 - 315 Hz
(±) | reduced bass - on average 7.7% lower than median
(±) | linearity of bass is average (11.1% delta to prev. frequency)
Mids 400 - 2000 Hz
(±) | higher mids - on average 7.8% higher than median
(±) | linearity of mids is average (9.5% delta to prev. frequency)
Highs 2 - 16 kHz
(+) | balanced highs - only 3% away from median
(±) | linearity of highs is average (7.2% delta to prev. frequency)
Overall 100 - 16.000 Hz
(±) | linearity of overall sound is average (23.9% difference to median)
Compared to same class
» 84% of all tested devices in this class were better, 5% similar, 11% worse
» The best had a delta of 6%, average was 18%, worst was 132%
Compared to all devices tested
» 67% of all tested devices were better, 7% similar, 26% worse
» The best had a delta of 4%, average was 25%, worst was 134%
Energy Management
Power Consumption
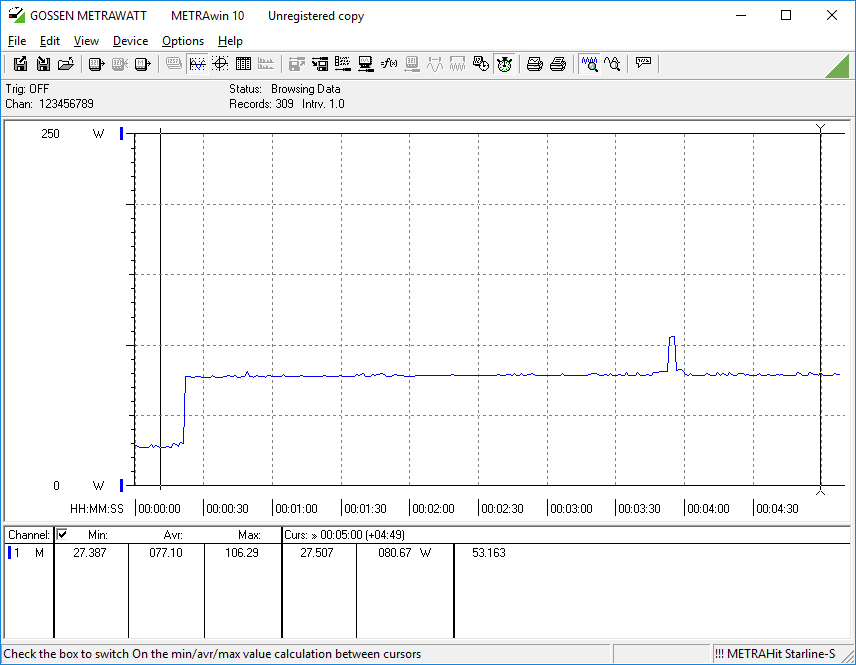
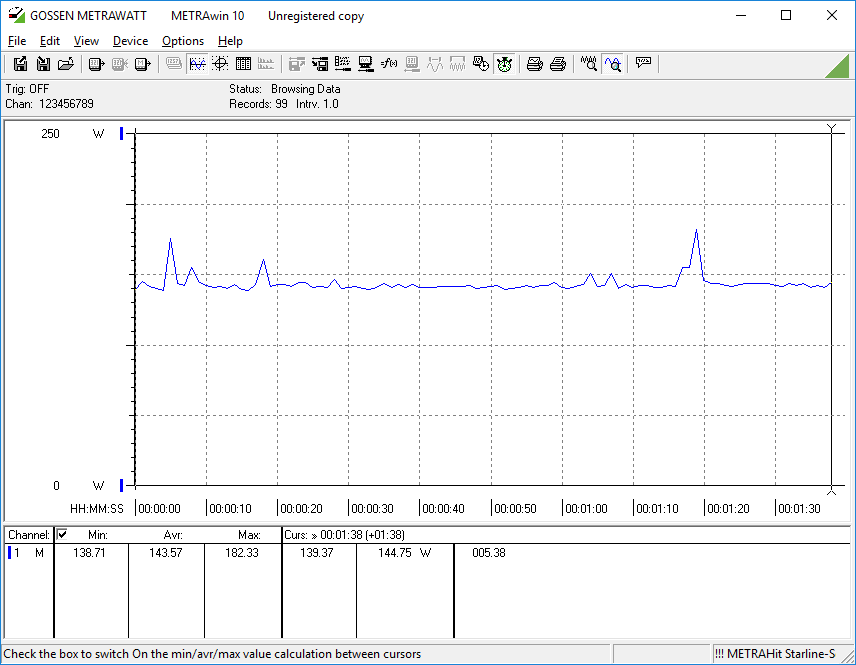
Although load power consumption, at 83.4 W average and 160.5 W max, is around what we’d expect to see from this hardware, idle numbers are on the high side, with an idle average of 27.2 W. We therefore shouldn’t expect to see anything impressive in the battery life testing section below. Some competitors, such as the Alienware m15, handle this better (13.8 W idle average).
| Off / Standby | |
| Idle | |
| Load |
|
| Lenovo Legion Y740-15ICHg i7-8750H, GeForce RTX 2070 Max-Q, Samsung SSD PM981 MZVLB256HAHQ, IPS, 1920x1080, 15.60 | MSI GE75 8SF i7-8750H, GeForce RTX 2070 Mobile, Kingston RBUSNS8154P3256GJ1, IPS, 1920x1080, 17.30 | Gigabyte Aero 15-X9 i7-8750H, GeForce RTX 2070 Max-Q, Intel SSD 760p SSDPEKKW010T8, IPS, 1920x1080, 15.60 | Acer Predator Triton 500 i7-8750H, GeForce RTX 2080 Max-Q, 2x WDC PC SN720 SDAPNTW-256G-1014 (RAID 0), IPS, 1920x1080, 15.60 | Razer Blade 15 RTX 2070 Max-Q i7-8750H, GeForce RTX 2070 Max-Q, Samsung SSD PM981 MZVLB512HAJQ, IPS, 1920x1080, 15.60 | Alienware m15 GTX 1070 Max-Q i7-8750H, GeForce GTX 1070 Max-Q, Toshiba XG5 KXG50ZNV512G, IPS, 1920x1080, 15.60 | HP Omen 15-dc0015ng i7-8750H, GeForce GTX 1070 Max-Q, Toshiba XG5 KXG50ZNV512G, IPS, 1920x1080, 15.60 | Lenovo Legion Y730-15ICH i5-8300H i5-8300H, GeForce GTX 1050 Ti Mobile, Intel Optane 16 GB MEMPEK1J016GAL + HGST ST1000LM049 1 TB HDD, IPS, 1920x1080, 15.60 | |
|---|---|---|---|---|---|---|---|---|
| Power Consumption | -6% | 14% | 3% | 19% | 23% | 1% | 34% | |
| Idle Minimum * | 22.9 | 16.4 28% | 16 30% | 16 30% | 10.4 55% | 7.6 67% | 14 39% | 8 65% |
| Idle Average * | 27.2 | 21.9 19% | 18 34% | 22 19% | 14.6 46% | 13.8 49% | 18.2 33% | 11.8 57% |
| Idle Maximum * | 27.5 | 25.4 8% | 23 16% | 32 -16% | 16.3 41% | 14.6 47% | 24 13% | 13.1 52% |
| Load Average * | 83.4 | 90.7 -9% | 88 -6% | 89 -7% | 88.5 -6% | 97.6 -17% | 143 -71% | 90.2 -8% |
| Witcher 3 ultra * | 143.6 | 203.3 -42% | 120 16% | 147 -2% | 155.4 -8% | 145.8 -2% | 126 12% | 107.8 25% |
| Load Maximum * | 160.5 | 222.9 -39% | 167 -4% | 173 -8% | 182.4 -14% | 172.5 -7% | 190 -18% | 136.2 15% |
* ... smaller is better
Battery Life
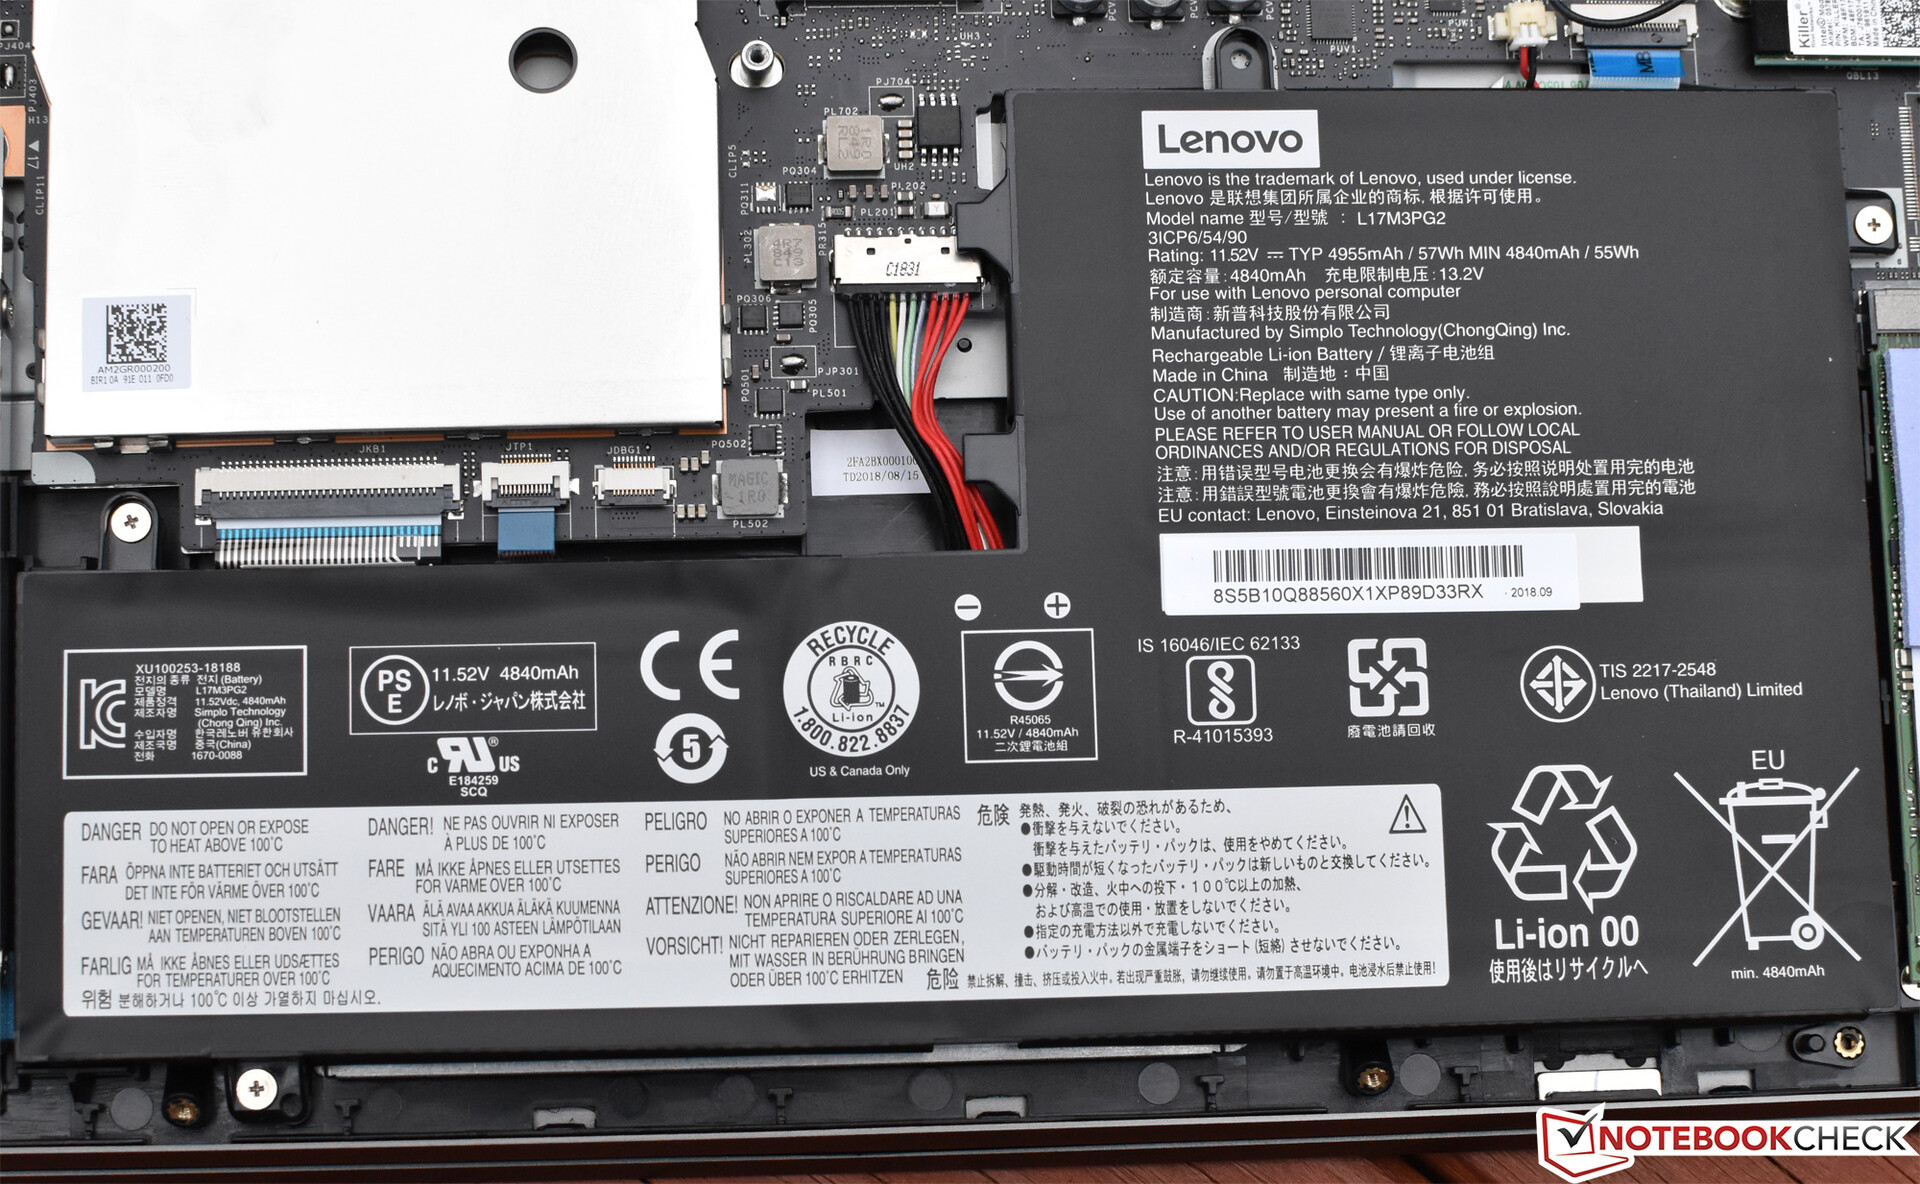
Equipped with its small 57 Wh battery, the Legion Y740 lasts for just 2 hours and 46 minutes in our standardized Wi-Fi web-surfing battery benchmark. Unsurprisingly, that’s the shortest runtime of any of the machines in today’s testing field. After changing the UEFI settings to enable NVIDIA Optimus switchable graphics, a second run of this benchmark results in a jump to 4 hours of runtime, however, which is better, though still brief. Most users who intend to purchase this machine primarily for gaming aren’t likely to mind this shortcoming, but it does largely invalidate the device as a candidate for portable use beyond the basics. Under load, the Legion didn’t even last an hour: just 46 minutes.
The idle benchmark number was also measured with the default system settings (Optimus off), though naturally that number would rise considerably if the setting was changed.
| Lenovo Legion Y740-15ICHg i7-8750H, GeForce RTX 2070 Max-Q, 57 Wh | MSI GE75 8SF i7-8750H, GeForce RTX 2070 Mobile, 65 Wh | Gigabyte Aero 15-X9 i7-8750H, GeForce RTX 2070 Max-Q, 94.24 Wh | Acer Predator Triton 500 i7-8750H, GeForce RTX 2080 Max-Q, 82 Wh | Razer Blade 15 RTX 2070 Max-Q i7-8750H, GeForce RTX 2070 Max-Q, 80 Wh | Alienware m15 GTX 1070 Max-Q i7-8750H, GeForce GTX 1070 Max-Q, 90 Wh | HP Omen 15-dc0015ng i7-8750H, GeForce GTX 1070 Max-Q, 70.07 Wh | Lenovo Legion Y730-15ICH i5-8300H i5-8300H, GeForce GTX 1050 Ti Mobile, 57 Wh | |
|---|---|---|---|---|---|---|---|---|
| Battery Runtime | 28% | 181% | 44% | 138% | 157% | 105% | 89% | |
| Reader / Idle | 235 | 549 134% | 335 43% | 682 190% | 627 167% | 460 96% | 577 146% | |
| WiFi v1.3 | 166 | 212 28% | 382 130% | 190 14% | 387 133% | 463 179% | 274 65% | 315 90% |
| Load | 46 | 174 278% | 81 76% | 88 91% | 103 124% | 117 154% | 60 30% |
Pros
Cons
Verdict
Although it’s still got its share of inadequacies, the Y740-15ICHg eliminates around half of the original complaints we lodged about its direct predecessor, the Y730-15ICH. The new display panel greatly improves black-white response times and features a 144 Hz refresh rate (for NVIDIA G-Sync). Plus, the GPU limitation has been lifted; the RTX 2070 Max-Q is more than twice as fast as the previous GTX 1050 Ti. All of this is achieved without a substantive increase in system fan noise, though surface temperatures have certainly risen noticeably.
Other notable victories for the Legion Y740-15ICHg include very strong CPU performance, both short-term and sustained, as well as fast general system performance thanks to its pairing with a Samsung PM981 NVMe SSD. The machine struggles to handle combined synthetic system stress, but CPU and GPU stress independently pose no problem, and normal real-world gaming is just fine. It’s true that gamers are unlikely to achieve stable frame rates of 144 fps+ without dialing back the quality to medium or low settings in most games, but it’s still nice to have that option.
Although it falls short in the areas of portability and input devices, the Lenovo Legion Y740-15ICHg is a significant improvement over its predecessor, easily handling most gaming with quiet composure and without breaking the bank.
The design, while unconventional, succeeds both aesthetically and haptically, though from a durability standpoint it does leave something to be desired. The display lid in particular is more flexible than we’re comfortable with and the device yields to moderate pressure in the center of the base unit. Input devices are merely decent; the keyboard’s short key travel and spongy feedback and the touchpad buttons’ tiresome actuation force are easily outdone by the likes of leading competitors (such as the XPS 15 and MSI GS65). Maintenance is relatively straightforward.
The Legion Y740-15ICHg is well-priced, at MSRP $1990 for our configuration (discounted to roughly $1,752 as of this writing). It’s powerful enough to run practically all modern games at high settings, FHD native resolution with 60+ fps. Competitors include the Alienware m15, Razer Blade 15, Acer Predator Triton 500, and MSI GE75, all of which carry their own unique pros and cons. All in all, however, the Y740 represents a substantial improvement over its predecessor, and a serious consideration for those seeking a capable gaming laptop that handles the primary challenges without breaking the bank.
Lenovo Legion Y740-15ICHg
-
09/20/2019 v7
Steve Schardein
More articles related to this device
Lenovo Legion Y740-15ICHg (Legion Y740-15 Series)Related Articles
Pricecompare
