

AMD Ryzen 9 5900X vs Intel Core i7-14650HX vs Intel Core i9-14900HX
AMD Ryzen 9 5900X
► remove from comparison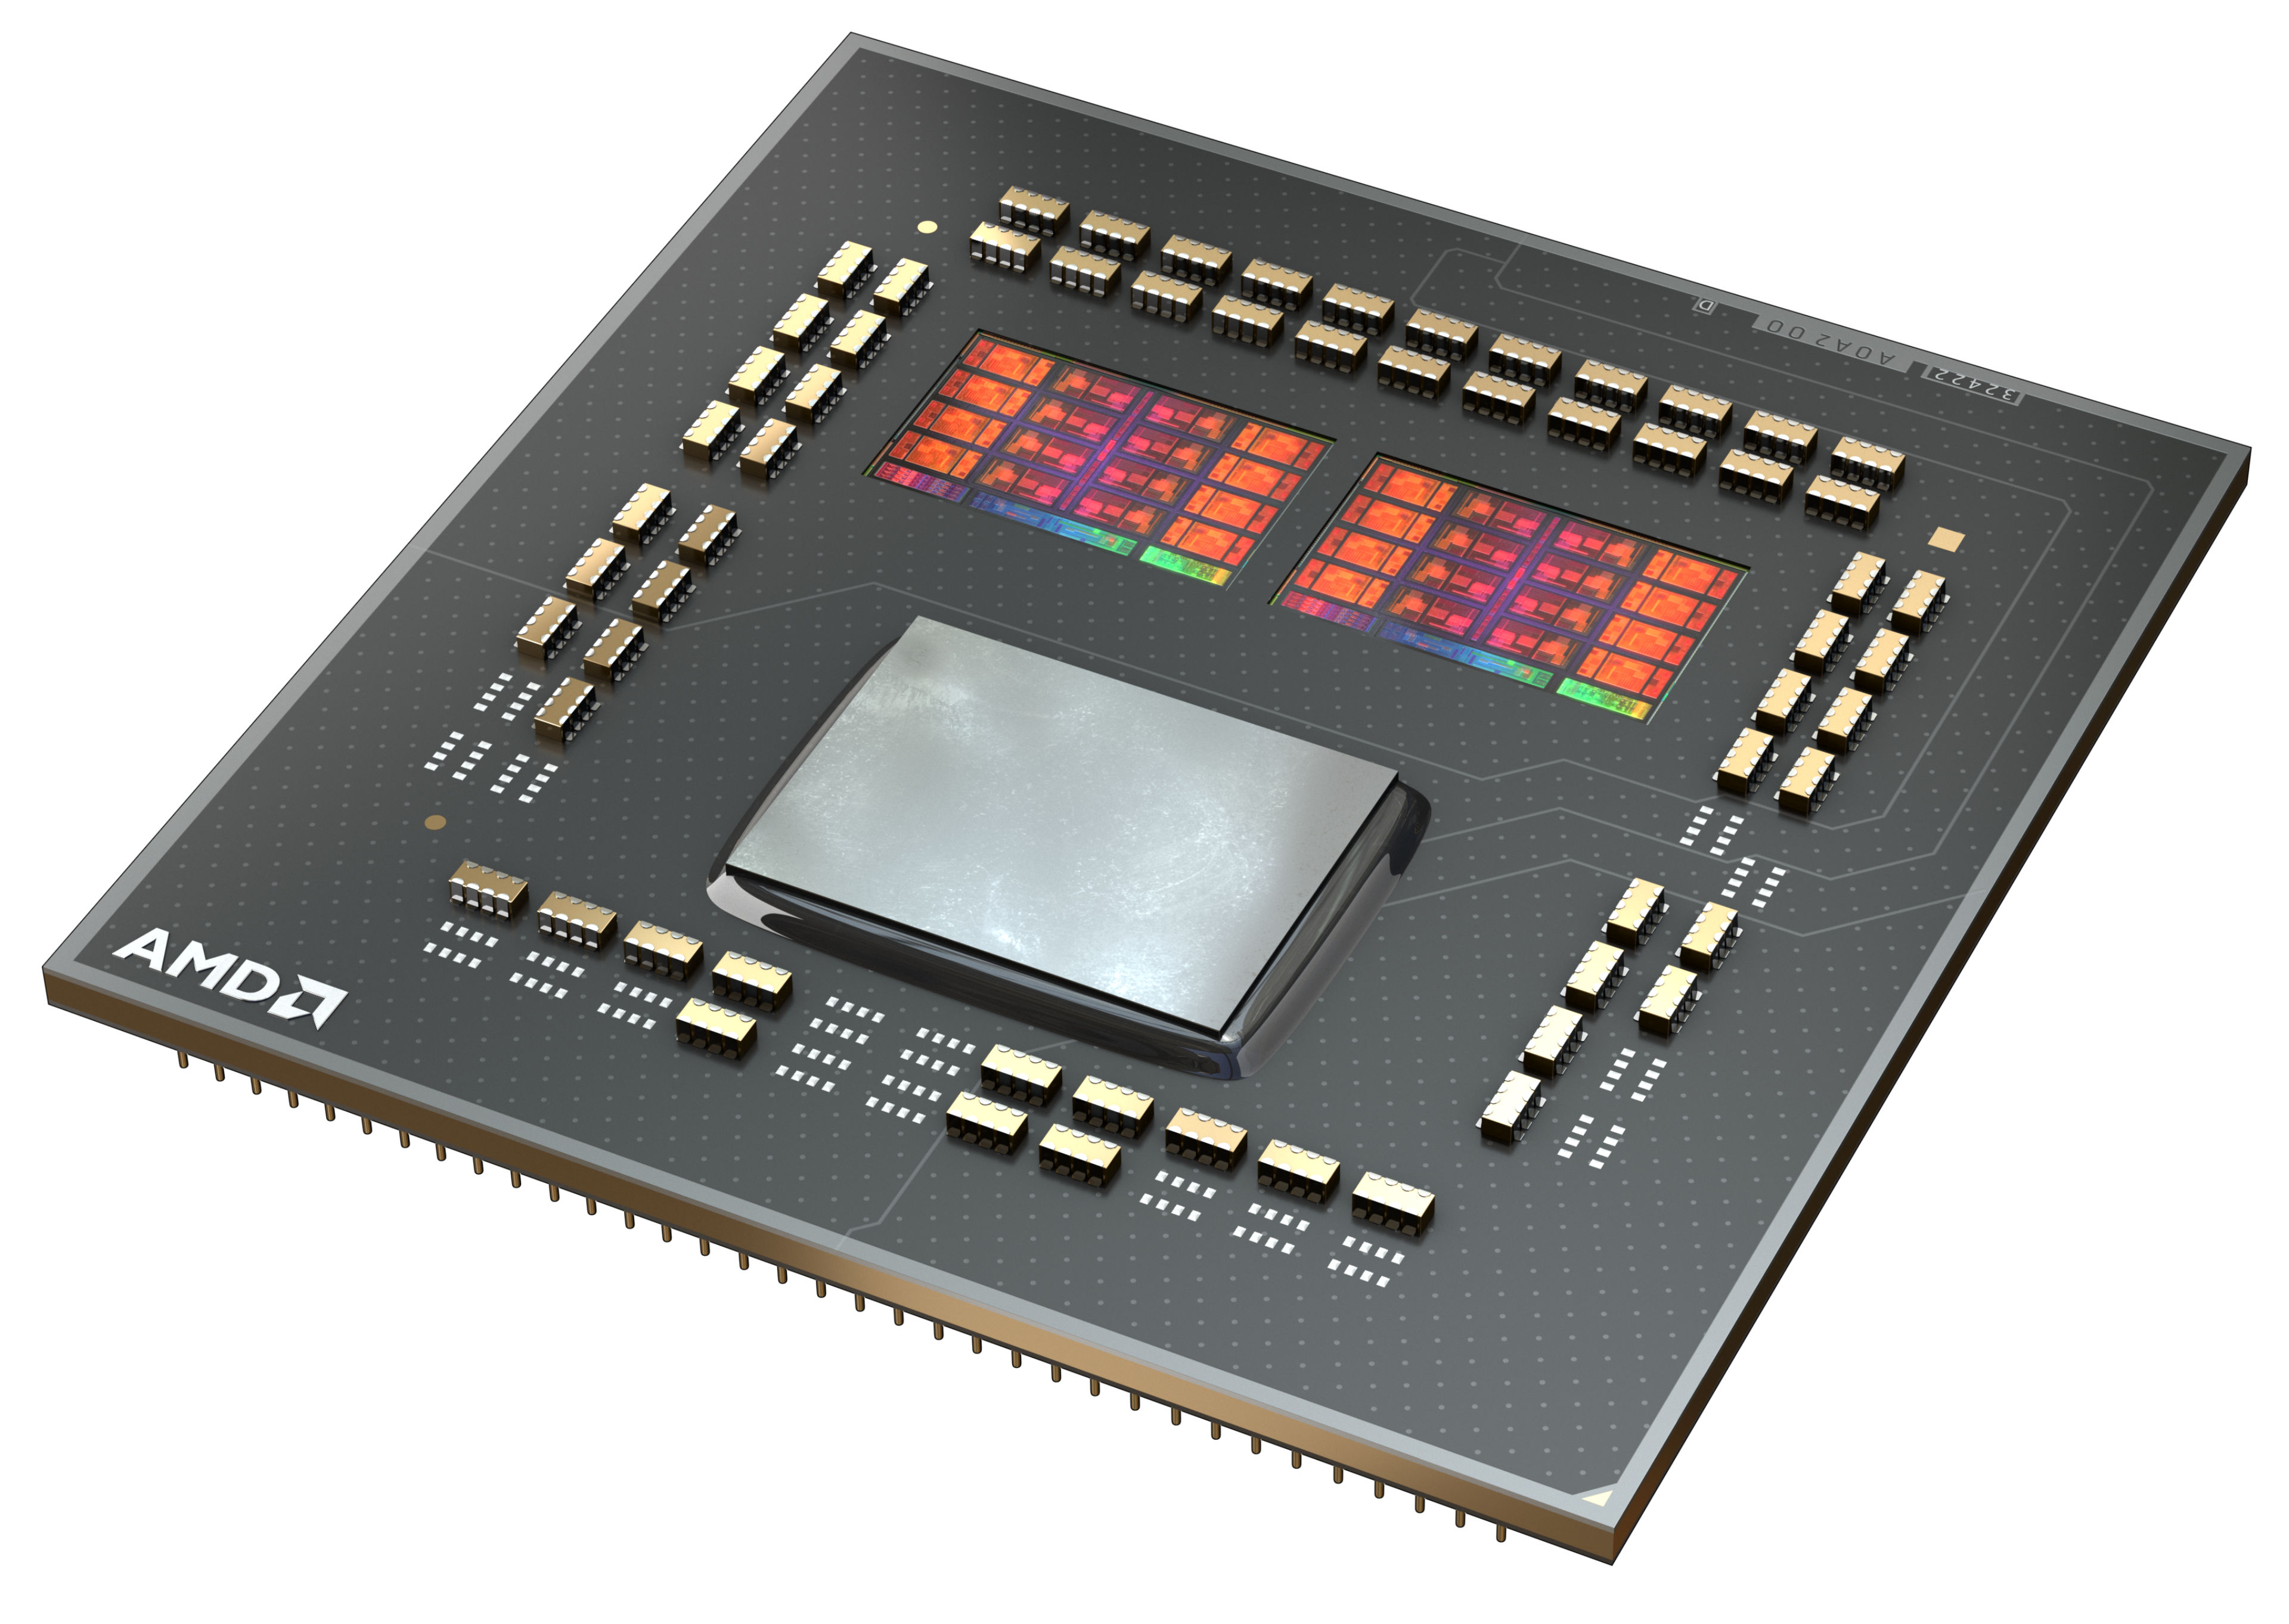
The AMD Ryzen 9 5900X is a high-end 12-core, hyperthreaded (SMT) Vermeer series desktop processor that can process 24 threads simultaneously. Introduced on October 8, 2020, the Ryzen 9 5900X is the fastest 12-core processor and is specified at 105 watts TDP. The top model, the AMD Ryzen 9 5950X, offers even more power and at the same time offers another 4 cores and 8 threads.
The Ryzen 9 5900X clocks with 3.7 GHz base clock and reaches up to 4.8 GHz on one core in turbo mode. However, when all 12 cores are loaded, up to 4.5 GHz is still possible.
The performance of the AMD Ryzen 9 5900X is consistently excellent in all applications and significantly better than the AMD Ryzen 9 3900X. AMD has been able to significantly improve its single thread performance in particular and even beats the Intel Core i9-10900K in this discipline. The multi-thread performance could also be improved. In an in-house duel, the AMD Ryzen 9 5900X can even take on an AMD Threadripper 2950X.
The internal structure of the processor has not changed fundamentally at first glance. The CCX structure has changed a bit compared to Zen2, because now a CCX consists of up to 8 CPU cores. So each individual core can access the complete L3 cache (32 MByte). Furthermore the CCX modules are connected to each other via the same I/O die, which we already know from Zen2. According to AMD, the Infinity-Fabric should now reach clock rates of up to 2 GHz, which in turn allows a RAM clock of 4.000 MHz without performance loss.
For the manufacturing processes, AMD also relies on TSCM for the Vermeer processors for the 7nm production of the CPU cores, although the I/O die is still supplied in 12nm by Globalfoundries.
In games, the AMD Ryzen 9 5900X is convincing thanks to the significantly improved IPC. With the AMD Ryzen 9 5900X, streaming can be done simultaneously with gaming. But if you only want to play games, you are well advised to take a closer look at the AMD Ryzen 7 5800X or the AMD Ryzen 5 5600X.
Intel Core i7-14650HX
► remove from comparison
The Intel Core i7-14650HX is a high-end CPU based on the new Raptor Lake architecture for large and heavy notebooks. The CPU was introduced at the beginning of 2024 and is similar to the older Core i7-13700HX except for slightly higher CPU clock rates (max 200 MHz).
The total of 24 threads are divided into P-cores and E-cores, which we already know from Alder-Lake. The 13700HX offers 8 performance cores (P-cores) with hyperthreading and 8 efficiency cores (E-cores) without hyperthreading. A total of 20 threads are therefore supported. The P-cores clock from 2.2 to 5.2 GHz (single core) or 4.5 GHz (all cores) and the E-cores from 1.6 to 3.7 GHz. The integrated memory controller supports a maximum of DDR5 with 4800 MHz (and not 5600 MHz like the i9 HX models).
Compared to Alder Lake, the new Raptor Lake architecture offers improved P-cores (Raptor Cove architecture with more cache), more E-cores (same Gracemont architecture) and higher clock rates thanks to the improved Intel 7 process. Furthermore, Intel now supports faster DDR5 main memory in the top models (up to 5600 MHz in the i9).
The performance should be slightly above the older Core i7-13700HX (with the same TDP settings and cooling). This makes the CPU ideal for demanding tasks and games.
The 14650HX continues to be manufactured using Intel's improved 10nm FinFET process (Intel 7 process) and is specified with 55 watts of base power and 157 watts of turbo power.
Intel Core i9-14900HX
► remove from comparisonThe Intel Core i9-14900HX is a high-end CPU based on the Raptor Lake architecture for large and heavy notebooks. The CPU was introduced at the beginning of 2024 and is a slightly higher clocked variant of the older Core i9-13980HX.
The total of 32 threads are divided into P-cores and E-cores, which we already know from Alder-Lake. Here, 8 performance cores (P-cores) with hyperthreading are used and 16 efficiency cores, so that a total of 32 threads can be processed simultaneously. The P-cores clock from 2.2 GHz (base clock) to 5.8 GHz (single-core turbo) and the E-cores from 1.6 GHz to 4.1 GHz.
Performance
Due to the slightly higher maximum clock rates, the single-core performance of the 14900HX in particular increases slightly compared to the 13980HX. Compared to AMD's top model, the Ryzen 9 7945HX or 7945HX3D the 14900HX comes in just behind (on average in our benchmarks). However, the performance depends on the benchmark and the cooling and is usually very comparable.
Graphics
Like the Intel Core i9-12900HX, the Intel Core i9-14900HX offers an integrated graphics unit. The Intel Iris XE architecture continues to serve as the basis. In terms of performance, however, not much has changed with the Intel UHD Graphics 770.
The 14900HX is manufactured on the improved 10nm FinFET process at Intel (Intel 7 process) and is specified with 55 watts of base power and 157 watts of turbo power.
| Model | AMD Ryzen 9 5900X | Intel Core i7-14650HX | Intel Core i9-14900HX | ||||||||||||||||||||||||||||||||||||||||||||||||
| Codename | Vermeer (Zen3) | Raptor Lake-HX Refresh | Raptor Lake-HX Refresh | ||||||||||||||||||||||||||||||||||||||||||||||||
| Series | AMD Vermeer (Ryzen 5000) | Intel Raptor Lake-HX | Intel Raptor Lake-HX | ||||||||||||||||||||||||||||||||||||||||||||||||
| Series: Raptor Lake-HX Raptor Lake-HX Refresh |
|
|
| ||||||||||||||||||||||||||||||||||||||||||||||||
| Clock | 3700 - 4800 MHz | 1600 - 5200 MHz | 1600 - 5800 MHz | ||||||||||||||||||||||||||||||||||||||||||||||||
| L1 Cache | 768 KB | ||||||||||||||||||||||||||||||||||||||||||||||||||
| L2 Cache | 6 MB | 24 MB | 32 MB | ||||||||||||||||||||||||||||||||||||||||||||||||
| L3 Cache | 64 MB | 30 MB | 36 MB | ||||||||||||||||||||||||||||||||||||||||||||||||
| Cores / Threads | 12 / 24 | 16 / 24 8 x 5.2 GHz Intel Raptor Cove P-Core 8 x 3.7 GHz Intel Gracemont E-Core | 24 / 32 8 x 5.8 GHz Intel Raptor Cove P-Core 16 x 4.1 GHz Intel Gracemont E-Core | ||||||||||||||||||||||||||||||||||||||||||||||||
| TDP | 105 Watt | 55 Watt | 55 Watt | ||||||||||||||||||||||||||||||||||||||||||||||||
| Technology | 7 nm | 10 nm | 10 nm | ||||||||||||||||||||||||||||||||||||||||||||||||
| Die Size | 2x 80.7 + 125 (I/O) mm2 | 257 mm2 | 257 mm2 | ||||||||||||||||||||||||||||||||||||||||||||||||
| Socket | AM4 (1331) | BGA1964 | BGA1964 | ||||||||||||||||||||||||||||||||||||||||||||||||
| Features | MMX(+), SSE, SSE2, SSE3, SSSE3, SSE4.1, SSE4.2, SSE4A, x86-64, AMD-V, AES, AVX, AVX2, FMA3, SHA, Precision Boost 2 | DDR4-3200/DDR5-5600 RAM, PCIe 5, Thr. Director, DL Boost, GNA, MMX, SSE, SSE2, SSE3, SSSE3, SSE4.1, SSE4.2, AVX, AVX2, BMI2, ABM, FMA, ADX, VMX, SMEP, SMAP, EIST, TM1, TM2, HT, Turbo, SST, AES-NI, RDRAND, RDSEED, SHA | DDR4-3200/DDR5-5600 RAM, PCIe 5, Thr. Dir., DL B., GNA, MMX, SSE, SSE2, SSE3, SSSE3, SSE4.1, SSE4.2, AVX, AVX2, BMI2, ABM, FMA, ADX, VMX, SMEP, SMAP, EIST, TM1, TM2, HT, Turbo, SST, AES-NI, RDRAND, RDSEED, SHA | ||||||||||||||||||||||||||||||||||||||||||||||||
| Architecture | x86 | x86 | x86 | ||||||||||||||||||||||||||||||||||||||||||||||||
| $549 U.S. | |||||||||||||||||||||||||||||||||||||||||||||||||||
| Announced | |||||||||||||||||||||||||||||||||||||||||||||||||||
| TDP Turbo PL2 | 157 Watt | 157 Watt | |||||||||||||||||||||||||||||||||||||||||||||||||
| max. Temp. | 100 °C | 100 °C | |||||||||||||||||||||||||||||||||||||||||||||||||
| iGPU | Intel UHD Graphics 770 ( - 1600 MHz) | Intel UHD Graphics Xe 32EUs (Tiger Lake-H) ( - 1650 MHz) | |||||||||||||||||||||||||||||||||||||||||||||||||
| Manufacturer | ark.intel.com | ark.intel.com |

Benchmarks
| Model | CPU | GPU | RAM | Value |
|---|---|---|---|---|
| MSI Katana 17 HX B14WGK | i7-14650HX 60 W / 50 W | GeForce RTX 5070 Laptop 115 W 1545 / 1500 MHz 8 GB | 16 GB | 116 |
| Lenovo Legion 5 16IRX G9 | i7-14650HX 140 W / 100 W | NVIDIA GeForce RTX 4060 Laptop GPU 125 W 2430 / 2050 MHz 8 GB | 16 GB | 117 |
| CPU TDP 50 W | TDP 100 W |
|---|---|
| 99% | 100% |
| CPU TDP ? | TDP 45 W | TDP 50 W | TDP 55 W | TDP 63 W | TDP 69 W | TDP 90 W | TDP 100 W | TDP 110 W | TDP 130 W | TDP 131 W | TDP 135 W | TDP 140 W | TDP 144 W | TDP 145 W | TDP 160 W | TDP 175 W | TDP 205 W |
|---|---|---|---|---|---|---|---|---|---|---|---|---|---|---|---|---|---|
| 97% | 99% | 89% | 94% | 95% | 97% | 97% | 90% | 96% | 100% | 98% | 95% | 100% | 100% | 100% | 97% | 99% | 98% |
| Model | CPU | GPU | RAM | Value |
|---|---|---|---|---|
| MSI Katana 17 HX B14WGK | i7-14650HX 60 W / 50 W | GeForce RTX 5070 Laptop 115 W 1545 / 1500 MHz 8 GB | 16 GB | 835 |
| Lenovo Legion 5 16IRX G9 | i7-14650HX 140 W / 100 W | NVIDIA GeForce RTX 4060 Laptop GPU 125 W 2430 / 2050 MHz 8 GB | 16 GB | 1235 |
| CPU TDP 50 W | TDP 100 W |
|---|---|
| 68% | 100% |
| CPU TDP ? | TDP 45 W | TDP 50 W | TDP 55 W | TDP 63 W | TDP 69 W | TDP 90 W | TDP 100 W | TDP 110 W | TDP 130 W | TDP 131 W | TDP 135 W | TDP 140 W | TDP 144 W | TDP 145 W | TDP 160 W | TDP 175 W | TDP 205 W |
|---|---|---|---|---|---|---|---|---|---|---|---|---|---|---|---|---|---|
| 81% | 41% | 42% | 50% | 88% | 64% | 71% | 62% | 79% | 72% | 89% | 76% | 86% | 89% | 86% | 74% | 86% | 100% |
| Model | CPU | GPU | RAM | Value |
|---|---|---|---|---|
| SCHENKER XMG Apex 15 Max | R9 5900X @0.7 GHz | GeForce RTX 3070 Laptop GPU Stromsparmodus | 32 GB | @0.7 GHz 2435 |
| SCHENKER XMG Apex 15 Max | R9 5900X @3.6 GHz | GeForce RTX 3070 Laptop GPU Lautlosmodus | 32 GB | @3.6 GHz 2435 |
| SCHENKER XMG Apex 15 Max | R9 5900X | GeForce RTX 3070 Laptop GPU 115 W 1560 / 1750 MHz 8 GB | 32 GB | 10531 |
| Eurocom Nightsky ARX315 | R9 5900X | GeForce RTX 3070 Laptop GPU 115 W 1560 / 1750 MHz 8 GB | 32 GB | 13230 |
| SCHENKER XMG Apex 15 Max | R9 5900X | GeForce RTX 3070 Laptop GPU Leistungsmodus | 32 GB | 16262 |
| SCHENKER XMG Apex 15 Max | R9 5900X | GeForce RTX 3070 Laptop GPU Leistungsmodus, max. Fan | 32 GB | 16550 |
| AMD Ryzen 9 5900X | R9 5900X | NVIDIA Titan RTX 1350 / 7000 MHz 24 GB | 32 GB | 20634 |
| Model | CPU | GPU | RAM | Value |
|---|---|---|---|---|
| MSI Katana 17 HX B14WGK | i7-14650HX 60 W / 50 W | GeForce RTX 5070 Laptop 115 W 1545 / 1500 MHz 8 GB | 16 GB | 16453 |
| Lenovo Legion 5 16IRX G9 | i7-14650HX 140 W / 100 W | NVIDIA GeForce RTX 4060 Laptop GPU 125 W 2430 / 2050 MHz 8 GB | 16 GB | 24455 |
| CPU TDP ? | TDP 50 W | TDP 100 W |
|---|---|---|
| 48% | 67% | 100% |
| CPU TDP ? | TDP 45 W | TDP 50 W | TDP 55 W | TDP 60 W | TDP 63 W | TDP 69 W | TDP 90 W | TDP 95 W | TDP 100 W | TDP 104 W | TDP 110 W | TDP 117 W | TDP 125 W | TDP 130 W | TDP 131 W | TDP 135 W | TDP 140 W | TDP 144 W | TDP 145 W | TDP 160 W | TDP 175 W | TDP 176 W | TDP 205 W |
|---|---|---|---|---|---|---|---|---|---|---|---|---|---|---|---|---|---|---|---|---|---|---|---|
| 51% | 47% | 45% | 57% | 80% | 86% | 75% | 79% | 72% | 73% | 82% | 79% | 76% | 84% | 80% | 91% | 81% | 88% | 87% | 83% | 74% | 87% | 90% | 100% |
| Model | CPU | GPU | RAM | Value |
|---|---|---|---|---|
| SCHENKER XMG Apex 15 Max | R9 5900X @0.7 GHz | GeForce RTX 3070 Laptop GPU Stromsparmodus | 32 GB | @0.7 GHz 527 |
| SCHENKER XMG Apex 15 Max | R9 5900X @3.6 GHz | GeForce RTX 3070 Laptop GPU Lautlosmodus | 32 GB | @3.6 GHz 1024 |
| SCHENKER XMG Apex 15 Max | R9 5900X | GeForce RTX 3070 Laptop GPU 115 W 1560 / 1750 MHz 8 GB | 32 GB | 1487 |
| SCHENKER XMG Apex 15 Max | R9 5900X | GeForce RTX 3070 Laptop GPU Leistungsmodus, max. Fan | 32 GB | 1518 |
| SCHENKER XMG Apex 15 Max | R9 5900X | GeForce RTX 3070 Laptop GPU Leistungsmodus | 32 GB | 1527 |
| Eurocom Nightsky ARX315 | R9 5900X | GeForce RTX 3070 Laptop GPU 115 W 1560 / 1750 MHz 8 GB | 32 GB | 1530 |
| AMD Ryzen 9 5900X | R9 5900X | NVIDIA Titan RTX 1350 / 7000 MHz 24 GB | 32 GB | 1568 |
| Model | CPU | GPU | RAM | Value |
|---|---|---|---|---|
| Lenovo Legion 5 16IRX G9 | i7-14650HX 140 W / 100 W | NVIDIA GeForce RTX 4060 Laptop GPU 125 W 2430 / 2050 MHz 8 GB | 16 GB | 1963 |
| MSI Katana 17 HX B14WGK | i7-14650HX 60 W / 50 W | GeForce RTX 5070 Laptop 115 W 1545 / 1500 MHz 8 GB | 16 GB | 1975 |
| CPU TDP ? | TDP 50 W | TDP 100 W |
|---|---|---|
| 66% | 100% | 99% |
| CPU TDP ? | TDP 45 W | TDP 50 W | TDP 55 W | TDP 60 W | TDP 63 W | TDP 69 W | TDP 90 W | TDP 95 W | TDP 100 W | TDP 104 W | TDP 110 W | TDP 117 W | TDP 125 W | TDP 130 W | TDP 131 W | TDP 135 W | TDP 140 W | TDP 144 W | TDP 145 W | TDP 160 W | TDP 175 W | TDP 176 W | TDP 205 W |
|---|---|---|---|---|---|---|---|---|---|---|---|---|---|---|---|---|---|---|---|---|---|---|---|
| 70% | 97% | 88% | 93% | 95% | 94% | 97% | 96% | 97% | 91% | 95% | 97% | 93% | 99% | 99% | 98% | 95% | 100% | 100% | 98% | 97% | 97% | 96% | 99% |
| Model | CPU | GPU | RAM | Value |
|---|---|---|---|---|
| SCHENKER XMG Apex 15 Max | R9 5900X @0.7 GHz | GeForce RTX 3070 Laptop GPU Stromsparmodus | 32 GB | @0.7 GHz 169 |
| SCHENKER XMG Apex 15 Max | R9 5900X @3.6 GHz | GeForce RTX 3070 Laptop GPU Lautlosmodus | 32 GB | @3.6 GHz 441 |
| SCHENKER XMG Apex 15 Max | R9 5900X | GeForce RTX 3070 Laptop GPU 115 W 1560 / 1750 MHz 8 GB | 32 GB | 579 |
| SCHENKER XMG Apex 15 Max | R9 5900X | GeForce RTX 3070 Laptop GPU Leistungsmodus, max. Fan | 32 GB | 596 |
| Eurocom Nightsky ARX315 | R9 5900X | GeForce RTX 3070 Laptop GPU 115 W 1560 / 1750 MHz 8 GB | 32 GB | 598 |
| SCHENKER XMG Apex 15 Max | R9 5900X | GeForce RTX 3070 Laptop GPU Leistungsmodus | 32 GB | 605 |
| AMD Ryzen 9 5900X | R9 5900X | NVIDIA Titan RTX 1350 / 7000 MHz 24 GB | 32 GB | 639 |
| Model | CPU | GPU | RAM | Value |
|---|---|---|---|---|
| Lenovo Legion 5 16IRX G9 | i7-14650HX 140 W / 100 W | NVIDIA GeForce RTX 4060 Laptop GPU 125 W 2430 / 2050 MHz 8 GB | 16 GB | 754 |
| MSI Katana 17 HX B14WGK | i7-14650HX 60 W / 50 W | GeForce RTX 5070 Laptop 115 W 1545 / 1500 MHz 8 GB | 16 GB | 762 |
| CPU TDP ? | TDP 50 W | TDP 100 W |
|---|---|---|
| 68% | 100% | 99% |
| CPU TDP ? | TDP 45 W | TDP 50 W | TDP 55 W | TDP 60 W | TDP 63 W | TDP 69 W | TDP 90 W | TDP 95 W | TDP 100 W | TDP 104 W | TDP 110 W | TDP 117 W | TDP 125 W | TDP 130 W | TDP 131 W | TDP 135 W | TDP 140 W | TDP 144 W | TDP 145 W | TDP 160 W | TDP 175 W | TDP 176 W | TDP 205 W |
|---|---|---|---|---|---|---|---|---|---|---|---|---|---|---|---|---|---|---|---|---|---|---|---|
| 72% | 96% | 89% | 96% | 95% | 94% | 97% | 96% | 97% | 92% | 95% | 97% | 95% | 98% | 99% | 98% | 95% | 100% | 100% | 100% | 97% | 97% | 96% | 99% |
| Model | CPU | GPU | RAM | Value |
|---|---|---|---|---|
| SCHENKER XMG Apex 15 Max | R9 5900X @3.6 GHz | GeForce RTX 3070 Laptop GPU Lautlosmodus | 32 GB | @3.6 GHz 930 |
| SCHENKER XMG Apex 15 Max | R9 5900X @0.7 GHz | GeForce RTX 3070 Laptop GPU Stromsparmodus | 32 GB | @0.7 GHz 934 |
| SCHENKER XMG Apex 15 Max | R9 5900X | GeForce RTX 3070 Laptop GPU 115 W 1560 / 1750 MHz 8 GB | 32 GB | 4077 |
| Eurocom Nightsky ARX315 | R9 5900X | GeForce RTX 3070 Laptop GPU 115 W 1560 / 1750 MHz 8 GB | 32 GB | 5158 |
| SCHENKER XMG Apex 15 Max | R9 5900X | GeForce RTX 3070 Laptop GPU Leistungsmodus | 32 GB | 6233 |
| SCHENKER XMG Apex 15 Max | R9 5900X | GeForce RTX 3070 Laptop GPU Leistungsmodus, max. Fan | 32 GB | 6425 |
| AMD Ryzen 9 5900X | R9 5900X | NVIDIA Titan RTX 1350 / 7000 MHz 24 GB | 32 GB | 8629 |
| Model | CPU | GPU | RAM | Value |
|---|---|---|---|---|
| MSI Katana 17 HX B14WGK | i7-14650HX 60 W / 50 W | GeForce RTX 5070 Laptop 115 W 1545 / 1500 MHz 8 GB | 16 GB | 6236 |
| Lenovo Legion 5 16IRX G9 | i7-14650HX 140 W / 100 W | NVIDIA GeForce RTX 4060 Laptop GPU 125 W 2430 / 2050 MHz 8 GB | 16 GB | 9349 |
| CPU TDP ? | TDP 50 W | TDP 100 W |
|---|---|---|
| 49% | 67% | 100% |
| CPU TDP ? | TDP 45 W | TDP 50 W | TDP 55 W | TDP 60 W | TDP 63 W | TDP 69 W | TDP 90 W | TDP 95 W | TDP 100 W | TDP 104 W | TDP 110 W | TDP 117 W | TDP 125 W | TDP 130 W | TDP 131 W | TDP 135 W | TDP 140 W | TDP 144 W | TDP 145 W | TDP 160 W | TDP 175 W | TDP 176 W | TDP 205 W |
|---|---|---|---|---|---|---|---|---|---|---|---|---|---|---|---|---|---|---|---|---|---|---|---|
| 51% | 48% | 45% | 58% | 79% | 83% | 73% | 79% | 71% | 75% | 82% | 78% | 79% | 84% | 80% | 89% | 80% | 87% | 85% | 83% | 74% | 88% | 88% | 100% |
| Model | CPU | GPU | RAM | Value |
|---|---|---|---|---|
| SCHENKER XMG Apex 15 Max | R9 5900X @0.7 GHz | GeForce RTX 3070 Laptop GPU Stromsparmodus | 32 GB | @0.7 GHz 400 |
| SCHENKER XMG Apex 15 Max | R9 5900X @3.6 GHz | GeForce RTX 3070 Laptop GPU Lautlosmodus | 32 GB | @3.6 GHz 402 |
| SCHENKER XMG Apex 15 Max | R9 5900X | GeForce RTX 3070 Laptop GPU 115 W 1560 / 1750 MHz 8 GB Unterhaltungsmodus | 32 GB | 1744 |
| Eurocom Nightsky ARX315 | R9 5900X | GeForce RTX 3070 Laptop GPU 115 W 1560 / 1750 MHz 8 GB | 32 GB | 2252 |
| SCHENKER XMG Apex 15 Max | R9 5900X | GeForce RTX 3070 Laptop GPU Leistungsmodus | 32 GB | 2695 |
| SCHENKER XMG Apex 15 Max | R9 5900X | GeForce RTX 3070 Laptop GPU Leistungsmodus, max. Fan | 32 GB | 2749 |
| AMD Ryzen 9 5900X | R9 5900X | NVIDIA Titan RTX 1350 / 7000 MHz 24 GB | 32 GB | 3717 |
| Model | CPU | GPU | RAM | Value |
|---|---|---|---|---|
| MSI Katana 17 HX B14WGK | i7-14650HX 60 W / 50 W | GeForce RTX 5070 Laptop 115 W 1545 / 1500 MHz 8 GB | 16 GB | 3142 |
| Lenovo Legion 5 16IRX G9 | i7-14650HX 140 W / 100 W | NVIDIA GeForce RTX 4060 Laptop GPU 125 W 2430 / 2050 MHz 8 GB | 16 GB | 3799 |
| CPU TDP ? | TDP 50 W | TDP 100 W |
|---|---|---|
| 52% | 83% | 100% |
| CPU TDP ? | TDP 45 W | TDP 50 W | TDP 55 W | TDP 60 W | TDP 63 W | TDP 69 W | TDP 90 W | TDP 95 W | TDP 100 W | TDP 104 W | TDP 110 W | TDP 117 W | TDP 125 W | TDP 130 W | TDP 131 W | TDP 135 W | TDP 140 W | TDP 144 W | TDP 145 W | TDP 160 W | TDP 175 W | TDP 176 W | TDP 205 W |
|---|---|---|---|---|---|---|---|---|---|---|---|---|---|---|---|---|---|---|---|---|---|---|---|
| 55% | 64% | 58% | 68% | 82% | 86% | 77% | 80% | 86% | 77% | 85% | 75% | 78% | 84% | 81% | 84% | 84% | 89% | 89% | 86% | 73% | 86% | 88% | 100% |
| Model | CPU | GPU | RAM | Value |
|---|---|---|---|---|
| SCHENKER XMG Apex 15 Max | R9 5900X @0.7 GHz | GeForce RTX 3070 Laptop GPU Stromsparmodus | 32 GB | @0.7 GHz 79.2 |
| SCHENKER XMG Apex 15 Max | R9 5900X @3.6 GHz | GeForce RTX 3070 Laptop GPU Lautlosmodus | 32 GB | @3.6 GHz 168.2 |
| SCHENKER XMG Apex 15 Max | R9 5900X | GeForce RTX 3070 Laptop GPU 115 W 1560 / 1750 MHz 8 GB | 32 GB | 242 |
| SCHENKER XMG Apex 15 Max | R9 5900X | GeForce RTX 3070 Laptop GPU Leistungsmodus | 32 GB | 248 |
| Eurocom Nightsky ARX315 | R9 5900X | GeForce RTX 3070 Laptop GPU 115 W 1560 / 1750 MHz 8 GB | 32 GB | 250 |
| SCHENKER XMG Apex 15 Max | R9 5900X | GeForce RTX 3070 Laptop GPU Leistungsmodus, max. Fan | 32 GB | 252 |
| AMD Ryzen 9 5900X | R9 5900X | NVIDIA Titan RTX 1350 / 7000 MHz 24 GB | 32 GB | 271 |
| Model | CPU | GPU | RAM | Value |
|---|---|---|---|---|
| MSI Katana 17 HX B14WGK | i7-14650HX 60 W / 50 W | GeForce RTX 5070 Laptop 115 W 1545 / 1500 MHz 8 GB | 16 GB | 284 |
| Lenovo Legion 5 16IRX G9 | i7-14650HX 140 W / 100 W | NVIDIA GeForce RTX 4060 Laptop GPU 125 W 2430 / 2050 MHz 8 GB | 16 GB | 287 |
| CPU TDP ? | TDP 50 W | TDP 100 W |
|---|---|---|
| 75% | 99% | 100% |
| CPU TDP ? | TDP 45 W | TDP 50 W | TDP 55 W | TDP 60 W | TDP 63 W | TDP 69 W | TDP 90 W | TDP 95 W | TDP 100 W | TDP 104 W | TDP 110 W | TDP 117 W | TDP 125 W | TDP 130 W | TDP 131 W | TDP 135 W | TDP 140 W | TDP 144 W | TDP 145 W | TDP 160 W | TDP 175 W | TDP 176 W | TDP 205 W |
|---|---|---|---|---|---|---|---|---|---|---|---|---|---|---|---|---|---|---|---|---|---|---|---|
| 76% | 99% | 89% | 91% | 98% | 94% | 93% | 95% | 98% | 94% | 94% | 95% | 96% | 100% | 99% | 97% | 94% | 100% | 100% | 98% | 97% | 96% | 94% | 99% |
| Model | CPU | GPU | RAM | Value |
|---|---|---|---|---|
| AMD Ryzen 9 5900X | R9 5900X | NVIDIA Titan RTX 1350 / 7000 MHz 24 GB | 32 GB | 41.78 |
| Model | CPU | GPU | RAM | Value |
|---|---|---|---|---|
| Lenovo Legion 5 16IRX G9 | i7-14650HX 140 W / 100 W | NVIDIA GeForce RTX 4060 Laptop GPU 125 W 2430 / 2050 MHz 8 GB | 16 GB | 43.85 |
| CPU TDP ? | TDP 100 W |
|---|---|
| 95% | 100% |
| Model | CPU | GPU | RAM | Value |
|---|---|---|---|---|
| Minisforum AtomMan G7 Ti (Office-Mode) | i9-14900HX 85 W / 55 W | NVIDIA GeForce RTX 4070 Laptop GPU 105 W 8 GB | 32 GB | 40.14 |
| Minisforum AtomMan G7 Ti | i9-14900HX 115 W / 90 W | NVIDIA GeForce RTX 4070 Laptop GPU 140 W 1980 / 2000 MHz 8 GB | 32 GB | 47.36 |
| CPU TDP ? | TDP 55 W | TDP 90 W | TDP 100 W |
|---|---|---|---|
| 88% | 85% | 100% | 93% |
| Model | CPU | GPU | RAM | Value |
|---|---|---|---|---|
| AMD Ryzen 9 5900X | R9 5900X | NVIDIA Titan RTX 1350 / 7000 MHz 24 GB | 32 GB | 3.14 |
| Model | CPU | GPU | RAM | Value |
|---|---|---|---|---|
| Lenovo Legion 5 16IRX G9 | i7-14650HX 140 W / 100 W | NVIDIA GeForce RTX 4060 Laptop GPU 125 W 2430 / 2050 MHz 8 GB | 16 GB | 3.4 |
| CPU TDP ? | TDP 100 W |
|---|---|
| 92% | 100% |
| Model | CPU | GPU | RAM | Value |
|---|---|---|---|---|
| Minisforum AtomMan G7 Ti | i9-14900HX 115 W / 90 W | NVIDIA GeForce RTX 4070 Laptop GPU 140 W 1980 / 2000 MHz 8 GB | 32 GB | 3.45 |
| Minisforum AtomMan G7 Ti (Office-Mode) | i9-14900HX 85 W / 55 W | NVIDIA GeForce RTX 4070 Laptop GPU 105 W 8 GB | 32 GB | 3.54 |
| CPU TDP ? | TDP 55 W | TDP 90 W | TDP 100 W |
|---|---|---|---|
| 89% | 100% | 97% | 96% |
| Model | CPU | GPU | RAM | Value |
|---|---|---|---|---|
| AMD Ryzen 9 5900X | R9 5900X | NVIDIA Titan RTX 1350 / 7000 MHz 24 GB | 32 GB | 6828 |
| Model | CPU | GPU | RAM | Value |
|---|---|---|---|---|
| Lenovo Legion 5 16IRX G9 | i7-14650HX 140 W / 100 W | NVIDIA GeForce RTX 4060 Laptop GPU 125 W 2430 / 2050 MHz 8 GB | 16 GB | 15819 |
| CPU TDP ? | TDP 100 W |
|---|---|
| 43% | 100% |
| Model | CPU | GPU | RAM | Value |
|---|---|---|---|---|
| Minisforum AtomMan G7 Ti (Office-Mode) | i9-14900HX 85 W / 55 W | NVIDIA GeForce RTX 4070 Laptop GPU 105 W 8 GB | 32 GB | 11078 |
| Minisforum AtomMan G7 Ti | i9-14900HX 115 W / 90 W | NVIDIA GeForce RTX 4070 Laptop GPU 140 W 1980 / 2000 MHz 8 GB | 32 GB | 11162 |
| CPU TDP ? | TDP 55 W | TDP 90 W | TDP 100 W |
|---|---|---|---|
| 43% | 70% | 71% | 100% |
| Model | CPU | GPU | RAM | Value |
|---|---|---|---|---|
| AMD Ryzen 9 5900X | R9 5900X | NVIDIA Titan RTX 1350 / 7000 MHz 24 GB | 32 GB | 52076 |
| Model | CPU | GPU | RAM | Value |
|---|---|---|---|---|
| Lenovo Legion 5 16IRX G9 | i7-14650HX 140 W / 100 W | NVIDIA GeForce RTX 4060 Laptop GPU 125 W 2430 / 2050 MHz 8 GB | 16 GB | 112749 |
| CPU TDP ? | TDP 100 W |
|---|---|
| 46% | 100% |
| Model | CPU | GPU | RAM | Value |
|---|---|---|---|---|
| Minisforum AtomMan G7 Ti (Office-Mode) | i9-14900HX 85 W / 55 W | NVIDIA GeForce RTX 4070 Laptop GPU 105 W 8 GB | 32 GB | 63617 |
| Minisforum AtomMan G7 Ti | i9-14900HX 115 W / 90 W | NVIDIA GeForce RTX 4070 Laptop GPU 140 W 1980 / 2000 MHz 8 GB | 32 GB | 72178 |
| CPU TDP ? | TDP 55 W | TDP 90 W | TDP 100 W |
|---|---|---|---|
| 46% | 56% | 64% | 100% |
| Model | CPU | GPU | RAM | Value |
|---|---|---|---|---|
| AMD Ryzen 9 5900X | R9 5900X | NVIDIA Titan RTX 1350 / 7000 MHz 24 GB | 32 GB | 99651 |
| Model | CPU | GPU | RAM | Value |
|---|---|---|---|---|
| Minisforum AtomMan G7 Ti (Office-Mode) | i9-14900HX 85 W / 55 W | NVIDIA GeForce RTX 4070 Laptop GPU 105 W 8 GB | 32 GB | 95056 |
| Minisforum AtomMan G7 Ti | i9-14900HX 115 W / 90 W | NVIDIA GeForce RTX 4070 Laptop GPU 140 W 1980 / 2000 MHz 8 GB | 32 GB | 101679 |
| CPU TDP ? | TDP 55 W | TDP 90 W |
|---|---|---|
| 98% | 93% | 100% |
| Model | CPU | GPU | RAM | Value |
|---|---|---|---|---|
| AMD Ryzen 9 5900X | R9 5900X | NVIDIA Titan RTX 1350 / 7000 MHz 24 GB | 32 GB | 12739 |
| Model | CPU | GPU | RAM | Value |
|---|---|---|---|---|
| Minisforum AtomMan G7 Ti (Office-Mode) | i9-14900HX 85 W / 55 W | NVIDIA GeForce RTX 4070 Laptop GPU 105 W 8 GB | 32 GB | 16204 |
| Minisforum AtomMan G7 Ti | i9-14900HX 115 W / 90 W | NVIDIA GeForce RTX 4070 Laptop GPU 140 W 1980 / 2000 MHz 8 GB | 32 GB | 16469 |
| CPU TDP ? | TDP 55 W | TDP 90 W |
|---|---|---|
| 77% | 98% | 100% |
| Model | CPU | GPU | RAM | Value |
|---|---|---|---|---|
| Lenovo Legion 5 16IRX G9 | i7-14650HX 140 W / 100 W | NVIDIA GeForce RTX 4060 Laptop GPU 125 W 2430 / 2050 MHz 8 GB | 16 GB | 641.6 |
| Model | CPU | GPU | RAM | Value |
|---|---|---|---|---|
| Minisforum AtomMan G7 Ti (Office-Mode) | i9-14900HX 85 W / 55 W | NVIDIA GeForce RTX 4070 Laptop GPU 105 W 8 GB | 32 GB | 104.117 |
| Minisforum AtomMan G7 Ti | i9-14900HX 115 W / 90 W | NVIDIA GeForce RTX 4070 Laptop GPU 140 W 1980 / 2000 MHz 8 GB | 32 GB | 215.805 |
| CPU TDP 55 W | TDP 90 W | TDP 100 W |
|---|---|---|
| 107% | 105% | 100% |
| Model | CPU | GPU | RAM | Value |
|---|---|---|---|---|
| Lenovo Legion 5 16IRX G9 | i7-14650HX 140 W / 100 W | NVIDIA GeForce RTX 4060 Laptop GPU 125 W 2430 / 2050 MHz 8 GB | 16 GB | 14.8 |
| Model | CPU | GPU | RAM | Value |
|---|---|---|---|---|
| Minisforum AtomMan G7 Ti | i9-14900HX 115 W / 90 W | NVIDIA GeForce RTX 4070 Laptop GPU 140 W 1980 / 2000 MHz 8 GB | 32 GB | 2.806 |
| Minisforum AtomMan G7 Ti (Office-Mode) | i9-14900HX 85 W / 55 W | NVIDIA GeForce RTX 4070 Laptop GPU 105 W 8 GB | 32 GB | 3.126 |
| CPU TDP 55 W | TDP 90 W | TDP 100 W |
|---|---|---|
| 102% | 102% | 100% |
| Model | CPU | GPU | RAM | Value |
|---|---|---|---|---|
| AMD Ryzen 9 5900X | R9 5900X | NVIDIA Titan RTX 1350 / 7000 MHz 24 GB | 32 GB | 59.5 |
| Model | CPU | GPU | RAM | Value |
|---|---|---|---|---|
| AMD Ryzen 9 5900X | R9 5900X | NVIDIA Titan RTX 1350 / 7000 MHz 24 GB | 32 GB | 2.47 |
| Model | CPU | GPU | RAM | Value |
|---|---|---|---|---|
| AMD Ryzen 9 5900X | R9 5900X | NVIDIA Titan RTX 1350 / 7000 MHz 24 GB | 32 GB | 13361 |
| Model | CPU | GPU | RAM | Value |
|---|---|---|---|---|
| Lenovo Legion 5 16IRX G9 | i7-14650HX 140 W / 100 W | NVIDIA GeForce RTX 4060 Laptop GPU 125 W 2430 / 2050 MHz 8 GB | 16 GB | 38336 |
| CPU TDP ? | TDP 100 W |
|---|---|
| 35% | 100% |
| Model | CPU | GPU | RAM | Value |
|---|---|---|---|---|
| Minisforum AtomMan G7 Ti (Office-Mode) | i9-14900HX 85 W / 55 W | NVIDIA GeForce RTX 4070 Laptop GPU 105 W 8 GB | 32 GB | 10376 |
| Minisforum AtomMan G7 Ti | i9-14900HX 115 W / 90 W | NVIDIA GeForce RTX 4070 Laptop GPU 140 W 1980 / 2000 MHz 8 GB | 32 GB | 11497 |
| CPU TDP ? | TDP 55 W | TDP 90 W | TDP 100 W |
|---|---|---|---|
| 35% | 27% | 30% | 100% |
| Model | CPU | GPU | RAM | Value |
|---|---|---|---|---|
| MSI Katana 17 HX B14WGK | i7-14650HX 60 W / 50 W | GeForce RTX 5070 Laptop 115 W 1545 / 1500 MHz 8 GB | 16 GB | 68711 |
| Lenovo Legion 5 16IRX G9 | i7-14650HX 140 W / 100 W | NVIDIA GeForce RTX 4060 Laptop GPU 125 W 2430 / 2050 MHz 8 GB | 16 GB | 93686 |
| CPU TDP ? | TDP 50 W | TDP 100 W |
|---|---|---|
| 88% | 73% | 100% |
| CPU TDP ? | TDP 45 W | TDP 50 W | TDP 55 W | TDP 60 W | TDP 63 W | TDP 69 W | TDP 90 W | TDP 95 W | TDP 100 W | TDP 104 W | TDP 110 W | TDP 117 W | TDP 125 W | TDP 130 W | TDP 131 W | TDP 135 W | TDP 140 W | TDP 144 W | TDP 145 W | TDP 160 W | TDP 175 W | TDP 176 W | TDP 205 W |
|---|---|---|---|---|---|---|---|---|---|---|---|---|---|---|---|---|---|---|---|---|---|---|---|
| 64% | 49% | 51% | 61% | 85% | 89% | 74% | 79% | 79% | 66% | 85% | 84% | 79% | 87% | 81% | 91% | 83% | 91% | 90% | 90% | 80% | 88% | 89% | 100% |
| Model | CPU | GPU | RAM | Value |
|---|---|---|---|---|
| MSI Katana 17 HX B14WGK | i7-14650HX 60 W / 50 W | GeForce RTX 5070 Laptop 115 W 1545 / 1500 MHz 8 GB | 16 GB | 6364 |
| Lenovo Legion 5 16IRX G9 | i7-14650HX 140 W / 100 W | NVIDIA GeForce RTX 4060 Laptop GPU 125 W 2430 / 2050 MHz 8 GB | 16 GB | 6695 |
| CPU TDP ? | TDP 50 W | TDP 100 W |
|---|---|---|
| 94% | 95% | 100% |
| CPU TDP ? | TDP 45 W | TDP 50 W | TDP 55 W | TDP 60 W | TDP 63 W | TDP 69 W | TDP 90 W | TDP 95 W | TDP 100 W | TDP 104 W | TDP 110 W | TDP 117 W | TDP 125 W | TDP 130 W | TDP 131 W | TDP 135 W | TDP 140 W | TDP 144 W | TDP 145 W | TDP 160 W | TDP 175 W | TDP 176 W | TDP 205 W |
|---|---|---|---|---|---|---|---|---|---|---|---|---|---|---|---|---|---|---|---|---|---|---|---|
| 85% | 96% | 86% | 96% | 95% | 90% | 94% | 97% | 84% | 84% | 91% | 97% | 88% | 99% | 99% | 96% | 97% | 96% | 96% | 89% | 99% | 97% | 88% | 100% |
| Model | CPU | GPU | RAM | Value |
|---|---|---|---|---|
| AMD Ryzen 9 5900X | R9 5900X | NVIDIA Titan RTX 1350 / 7000 MHz 24 GB | 32 GB | 191 |
| Model | CPU | GPU | RAM | Value |
|---|---|---|---|---|
| Minisforum AtomMan G7 Ti (Office-Mode) | i9-14900HX 85 W / 55 W | NVIDIA GeForce RTX 4070 Laptop GPU 105 W 8 GB | 32 GB | 152.7 |
| Minisforum AtomMan G7 Ti | i9-14900HX 115 W / 90 W | NVIDIA GeForce RTX 4070 Laptop GPU 140 W 1980 / 2000 MHz 8 GB | 32 GB | 200.5 |
| CPU TDP ? | TDP 55 W | TDP 90 W |
|---|---|---|
| 95% | 76% | 100% |
| Model | CPU | GPU | RAM | Value |
|---|---|---|---|---|
| AMD Ryzen 9 5900X | R9 5900X | NVIDIA Titan RTX 1350 / 7000 MHz 24 GB | 32 GB | 335 |
| Model | CPU | GPU | RAM | Value |
|---|---|---|---|---|
| Minisforum AtomMan G7 Ti (Office-Mode) | i9-14900HX 85 W / 55 W | NVIDIA GeForce RTX 4070 Laptop GPU 105 W 8 GB | 32 GB | 337 |
| Minisforum AtomMan G7 Ti | i9-14900HX 115 W / 90 W | NVIDIA GeForce RTX 4070 Laptop GPU 140 W 1980 / 2000 MHz 8 GB | 32 GB | 363 |
| CPU TDP ? | TDP 55 W | TDP 90 W |
|---|---|---|
| 92% | 93% | 100% |
| Model | CPU | GPU | RAM | Value |
|---|---|---|---|---|
| MSI Katana 17 HX B14WGK | i7-14650HX 60 W / 50 W | GeForce RTX 5070 Laptop 115 W 1545 / 1500 MHz 8 GB | 16 GB | 12.6 |
| Lenovo Legion 5 16IRX G9 | i7-14650HX 140 W / 100 W | NVIDIA GeForce RTX 4060 Laptop GPU 125 W 2430 / 2050 MHz 8 GB | 16 GB | 25.6 |
| CPU TDP ? | TDP 50 W | TDP 100 W |
|---|---|---|
| 83% | 49% | 100% |
| CPU TDP ? | TDP 45 W | TDP 50 W | TDP 55 W | TDP 60 W | TDP 63 W | TDP 69 W | TDP 90 W | TDP 95 W | TDP 100 W | TDP 104 W | TDP 110 W | TDP 117 W | TDP 125 W | TDP 130 W | TDP 131 W | TDP 135 W | TDP 140 W | TDP 144 W | TDP 145 W | TDP 160 W | TDP 175 W | TDP 176 W | TDP 205 W |
|---|---|---|---|---|---|---|---|---|---|---|---|---|---|---|---|---|---|---|---|---|---|---|---|
| 61% | 45% | 34% | 58% | 81% | 91% | 73% | 73% | 80% | 74% | 81% | 79% | 75% | 86% | 77% | 87% | 79% | 90% | 87% | 88% | 77% | 89% | 83% | 100% |
| Model | CPU | GPU | RAM | Value |
|---|---|---|---|---|
| AMD Ryzen 9 5900X | R9 5900X | NVIDIA Titan RTX 1350 / 7000 MHz 24 GB | 32 GB | 1.8 |
| Model | CPU | GPU | RAM | Value |
|---|---|---|---|---|
| Lenovo Legion 5 16IRX G9 | i7-14650HX 140 W / 100 W | NVIDIA GeForce RTX 4060 Laptop GPU 125 W 2430 / 2050 MHz 8 GB | 16 GB | 1.9 |
| CPU TDP ? | TDP 100 W |
|---|---|
| 95% | 100% |
| Model | CPU | GPU | RAM | Value |
|---|---|---|---|---|
| Minisforum AtomMan G7 Ti | i9-14900HX 115 W / 90 W | NVIDIA GeForce RTX 4070 Laptop GPU 140 W 1980 / 2000 MHz 8 GB | 32 GB | 1.6 |
| Minisforum AtomMan G7 Ti (Office-Mode) | i9-14900HX 85 W / 55 W | NVIDIA GeForce RTX 4070 Laptop GPU 105 W 8 GB | 32 GB | 1.9 |
| CPU TDP ? | TDP 55 W | TDP 90 W | TDP 100 W |
|---|---|---|---|
| 95% | 100% | 84% | 100% |
| Model | CPU | GPU | RAM | Value |
|---|---|---|---|---|
| AMD Ryzen 9 5900X | R9 5900X | NVIDIA Titan RTX 1350 / 7000 MHz 24 GB | 32 GB | 2.9 |
| Model | CPU | GPU | RAM | Value |
|---|---|---|---|---|
| Lenovo Legion 5 16IRX G9 | i7-14650HX 140 W / 100 W | NVIDIA GeForce RTX 4060 Laptop GPU 125 W 2430 / 2050 MHz 8 GB | 16 GB | 3.7 |
| CPU TDP ? | TDP 100 W |
|---|---|
| 78% | 100% |
| Model | CPU | GPU | RAM | Value |
|---|---|---|---|---|
| Minisforum AtomMan G7 Ti (Office-Mode) | i9-14900HX 85 W / 55 W | NVIDIA GeForce RTX 4070 Laptop GPU 105 W 8 GB | 32 GB | 3.2 |
| Minisforum AtomMan G7 Ti | i9-14900HX 115 W / 90 W | NVIDIA GeForce RTX 4070 Laptop GPU 140 W 1980 / 2000 MHz 8 GB | 32 GB | 3.9 |
| CPU TDP ? | TDP 55 W | TDP 90 W | TDP 100 W |
|---|---|---|---|
| 74% | 82% | 100% | 95% |
| Model | CPU | GPU | RAM | Value |
|---|---|---|---|---|
| AMD Ryzen 9 5900X | R9 5900X | NVIDIA Titan RTX 1350 / 7000 MHz 24 GB | 32 GB | 21.2 |
| Model | CPU | GPU | RAM | Value |
|---|---|---|---|---|
| Lenovo Legion 5 16IRX G9 | i7-14650HX 140 W / 100 W | NVIDIA GeForce RTX 4060 Laptop GPU 125 W 2430 / 2050 MHz 8 GB | 16 GB | 19.8 |
| CPU TDP ? | TDP 100 W |
|---|---|
| 100% | 93% |
| Model | CPU | GPU | RAM | Value |
|---|---|---|---|---|
| Minisforum AtomMan G7 Ti (Office-Mode) | i9-14900HX 85 W / 55 W | NVIDIA GeForce RTX 4070 Laptop GPU 105 W 8 GB | 32 GB | 16.4 |
| Minisforum AtomMan G7 Ti | i9-14900HX 115 W / 90 W | NVIDIA GeForce RTX 4070 Laptop GPU 140 W 1980 / 2000 MHz 8 GB | 32 GB | 16.5 |
| CPU TDP ? | TDP 55 W | TDP 90 W | TDP 100 W |
|---|---|---|---|
| 100% | 77% | 78% | 93% |
| Model | CPU | GPU | RAM | Value |
|---|---|---|---|---|
| Lenovo Legion 5 16IRX G9 | i7-14650HX 140 W / 100 W | NVIDIA GeForce RTX 4060 Laptop GPU 125 W 2430 / 2050 MHz 8 GB 3.3.3 | 16 GB | 247 |
| MSI Katana 17 HX B14WGK | i7-14650HX 60 W / 50 W | GeForce RTX 5070 Laptop 115 W 1545 / 1500 MHz 8 GB 3.3.3 | 16 GB | 367 |
| CPU TDP 50 W | TDP 100 W |
|---|---|
| 100% | 102% |
| CPU TDP ? | TDP 45 W | TDP 50 W | TDP 55 W | TDP 60 W | TDP 63 W | TDP 69 W | TDP 90 W | TDP 95 W | TDP 100 W | TDP 104 W | TDP 110 W | TDP 117 W | TDP 125 W | TDP 130 W | TDP 131 W | TDP 135 W | TDP 140 W | TDP 144 W | TDP 145 W | TDP 160 W | TDP 175 W | TDP 176 W | TDP 205 W |
|---|---|---|---|---|---|---|---|---|---|---|---|---|---|---|---|---|---|---|---|---|---|---|---|
| 103% | 100% | 100% | 101% | 103% | 103% | 102% | 102% | 102% | 102% | 103% | 102% | 103% | 103% | 102% | 103% | 102% | 103% | 103% | 103% | 102% | 103% | 103% | 103% |
| Model | CPU | GPU | RAM | Value |
|---|---|---|---|---|
| Lenovo Legion 5 16IRX G9 | i7-14650HX 140 W / 100 W | NVIDIA GeForce RTX 4060 Laptop GPU 125 W 2430 / 2050 MHz 8 GB | 16 GB | 141 |
| MSI Katana 17 HX B14WGK | i7-14650HX 60 W / 50 W | GeForce RTX 5070 Laptop 115 W 1545 / 1500 MHz 8 GB | 16 GB | 206 |
| CPU TDP ? | TDP 50 W | TDP 100 W |
|---|---|---|
| 100% | 100% | 101% |
| CPU TDP ? | TDP 45 W | TDP 50 W | TDP 55 W | TDP 60 W | TDP 63 W | TDP 69 W | TDP 90 W | TDP 95 W | TDP 100 W | TDP 104 W | TDP 110 W | TDP 117 W | TDP 125 W | TDP 130 W | TDP 131 W | TDP 135 W | TDP 140 W | TDP 144 W | TDP 145 W | TDP 160 W | TDP 175 W | TDP 176 W | TDP 205 W |
|---|---|---|---|---|---|---|---|---|---|---|---|---|---|---|---|---|---|---|---|---|---|---|---|
| 100% | 100% | 100% | 100% | 101% | 101% | 101% | 101% | 101% | 101% | 101% | 101% | 101% | 101% | 101% | 101% | 101% | 101% | 101% | 101% | 101% | 101% | 101% | 101% |
| Model | CPU | GPU | RAM | Value |
|---|---|---|---|---|
| Lenovo Legion 5 16IRX G9 | i7-14650HX 140 W / 100 W | NVIDIA GeForce RTX 4060 Laptop GPU 125 W 2430 / 2050 MHz 8 GB | 16 GB | 0.4195 |
| MSI Katana 17 HX B14WGK | i7-14650HX 60 W / 50 W | GeForce RTX 5070 Laptop 115 W 1545 / 1500 MHz 8 GB | 16 GB | 0.4244 |
| CPU TDP ? | TDP 50 W | TDP 100 W |
|---|---|---|
| 100% | 106% | 106% |
| CPU TDP ? | TDP 45 W | TDP 50 W | TDP 55 W | TDP 60 W | TDP 63 W | TDP 69 W | TDP 90 W | TDP 95 W | TDP 100 W | TDP 104 W | TDP 110 W | TDP 117 W | TDP 125 W | TDP 130 W | TDP 131 W | TDP 135 W | TDP 140 W | TDP 144 W | TDP 145 W | TDP 160 W | TDP 175 W | TDP 176 W | TDP 205 W |
|---|---|---|---|---|---|---|---|---|---|---|---|---|---|---|---|---|---|---|---|---|---|---|---|
| 100% | 107% | 105% | 106% | 107% | 106% | 106% | 106% | 105% | 106% | 106% | 106% | 106% | 107% | 107% | 106% | 106% | 107% | 107% | 107% | 107% | 107% | 106% | 107% |
| Model | CPU | GPU | RAM | Value |
|---|---|---|---|---|
| Nubia RedMagic Titan 16 Pro | i9-14900HX 140 W / 45 W | NVIDIA GeForce RTX 4060 Laptop GPU 140 W 2250 / 2000 MHz 8 GB | 16 GB | 14839 |
| Minisforum AtomMan G7 Ti | i9-14900HX 115 W / 90 W | NVIDIA GeForce RTX 4070 Laptop GPU 140 W 1980 / 2000 MHz 8 GB | 32 GB | 18578 |
| SCHENKER XMG Fusion 15 (Early 24) | i9-14900HX 170 W / 160 W | NVIDIA GeForce RTX 4070 Laptop GPU 140 W 2175 / 2000 MHz 8 GB | 32 GB | 19451 |
| Minisforum AtomMan G7 Ti (Nvidia GeForce RTX 4090 @USB4) | i9-14900HX 54 W / 45 W | 32 GB | 19726 | |
| SCHENKER XMG Neo 16 (Early 24) | i9-14900HX 205 W / 205 W | NVIDIA GeForce RTX 4090 Laptop GPU 175 W 2040 / 2250 MHz 16 GB | 32 GB | 20788 |
| CPU TDP ? | TDP 45 W | TDP 90 W | TDP 160 W | TDP 205 W |
|---|---|---|---|---|
| 87% | 83% | 89% | 94% | 100% |
| Model | CPU | GPU | RAM | Value |
|---|---|---|---|---|
| AMD Ryzen 9 5900X | R9 5900X | NVIDIA Titan RTX 1350 / 7000 MHz 24 GB | 32 GB | 7.185 |
| Model | CPU | GPU | RAM | Value |
|---|---|---|---|---|
| Lenovo Legion 5 16IRX G9 | i7-14650HX 140 W / 100 W | NVIDIA GeForce RTX 4060 Laptop GPU 125 W 2430 / 2050 MHz 8 GB | 16 GB | 6.4 |
| CPU TDP ? | TDP 100 W |
|---|---|
| 100% | 100% |
| Model | CPU | GPU | RAM | Value |
|---|---|---|---|---|
| Minisforum AtomMan G7 Ti (Office-Mode) | i9-14900HX 85 W / 55 W | NVIDIA GeForce RTX 4070 Laptop GPU 105 W 8 GB | 32 GB | 5.837 |
| Minisforum AtomMan G7 Ti | i9-14900HX 115 W / 90 W | NVIDIA GeForce RTX 4070 Laptop GPU 140 W 1980 / 2000 MHz 8 GB | 32 GB | 5.928 |
| CPU TDP ? | TDP 55 W | TDP 90 W | TDP 100 W |
|---|---|---|---|
| 100% | 100% | 100% | 100% |
| Model | CPU | GPU | RAM | Value |
|---|---|---|---|---|
| AMD Ryzen 9 5900X | R9 5900X | NVIDIA Titan RTX 1350 / 7000 MHz 24 GB | 32 GB | 15.49 |
| Model | CPU | GPU | RAM | Value |
|---|---|---|---|---|
| Lenovo Legion 5 16IRX G9 | i7-14650HX 140 W / 100 W | NVIDIA GeForce RTX 4060 Laptop GPU 125 W 2430 / 2050 MHz 8 GB | 16 GB | 14.1 |
| CPU TDP ? | TDP 100 W |
|---|---|
| 100% | 100% |
| Model | CPU | GPU | RAM | Value |
|---|---|---|---|---|
| Minisforum AtomMan G7 Ti (Office-Mode) | i9-14900HX 85 W / 55 W | NVIDIA GeForce RTX 4070 Laptop GPU 105 W 8 GB | 32 GB | 12.965 |
| Minisforum AtomMan G7 Ti | i9-14900HX 115 W / 90 W | NVIDIA GeForce RTX 4070 Laptop GPU 140 W 1980 / 2000 MHz 8 GB | 32 GB | 13.328 |
| CPU TDP ? | TDP 55 W | TDP 90 W | TDP 100 W |
|---|---|---|---|
| 100% | 100% | 100% | 100% |
| Model | CPU | GPU | RAM | Value |
|---|---|---|---|---|
| AMD Ryzen 9 5900X | R9 5900X | NVIDIA Titan RTX 1350 / 7000 MHz 24 GB | 32 GB | 360.5 |
| Model | CPU | GPU | RAM | Value |
|---|---|---|---|---|
| Lenovo Legion 5 16IRX G9 | i7-14650HX 140 W / 100 W | NVIDIA GeForce RTX 4060 Laptop GPU 125 W 2430 / 2050 MHz 8 GB | 16 GB | 337.3 |
| CPU TDP ? | TDP 100 W |
|---|---|
| 100% | 100% |
| Model | CPU | GPU | RAM | Value |
|---|---|---|---|---|
| Minisforum AtomMan G7 Ti (Office-Mode) | i9-14900HX 85 W / 55 W | NVIDIA GeForce RTX 4070 Laptop GPU 105 W 8 GB | 32 GB | 305.103 |
| Minisforum AtomMan G7 Ti | i9-14900HX 115 W / 90 W | NVIDIA GeForce RTX 4070 Laptop GPU 140 W 1980 / 2000 MHz 8 GB | 32 GB | 311.83 |
| CPU TDP ? | TDP 55 W | TDP 90 W | TDP 100 W |
|---|---|---|---|
| 100% | 100% | 100% | 100% |
| Model | CPU | GPU | RAM | Value |
|---|---|---|---|---|
| Minisforum AtomMan G7 Ti | i9-14900HX 115 W / 90 W | NVIDIA GeForce RTX 4070 Laptop GPU 140 W 1980 / 2000 MHz 8 GB | 32 GB | 81852 |
| Minisforum AtomMan G7 Ti (Nvidia GeForce RTX 4090 @USB4) | i9-14900HX 54 W / 45 W | 32 GB | 82094 |
| CPU TDP ? | TDP 45 W | TDP 90 W |
|---|---|---|
| 97% | 100% | 100% |
| Model | CPU | GPU | RAM | Value |
|---|---|---|---|---|
| MSI Katana 17 HX B14WGK | i7-14650HX 60 W / 50 W | GeForce RTX 5070 Laptop 115 W 1545 / 1500 MHz 8 GB | 16 GB | 20090 |
| Lenovo Legion 5 16IRX G9 | i7-14650HX 140 W / 100 W | NVIDIA GeForce RTX 4060 Laptop GPU 125 W 2430 / 2050 MHz 8 GB | 16 GB | 24163 |
| CPU TDP ? | TDP 50 W | TDP 100 W |
|---|---|---|
| 80% | 83% | 100% |
| CPU TDP ? | TDP 45 W | TDP 50 W | TDP 55 W | TDP 60 W | TDP 63 W | TDP 69 W | TDP 90 W | TDP 95 W | TDP 100 W | TDP 104 W | TDP 110 W | TDP 117 W | TDP 130 W | TDP 131 W | TDP 135 W | TDP 140 W | TDP 144 W | TDP 145 W | TDP 160 W | TDP 176 W | TDP 205 W |
|---|---|---|---|---|---|---|---|---|---|---|---|---|---|---|---|---|---|---|---|---|---|
| 74% | 82% | 76% | 78% | 84% | 100% | 89% | 91% | 96% | 88% | 91% | 83% | 93% | 88% | 98% | 84% | 96% | 98% | 92% | 87% | 99% | 95% |
| Model | CPU | GPU | RAM | Value |
|---|---|---|---|---|
| Minisforum AtomMan G7 Ti (Nvidia GeForce RTX 4090 @USB4) | i9-14900HX 54 W / 45 W | 32 GB | 92914 | |
| Asus ROG Strix Scar 16 G634JZR | i9-14900HX 175 W / 135 W | NVIDIA GeForce RTX 4080 Laptop GPU 175 W 12 GB | 32 GB | 92919 |
| Minisforum AtomMan G7 Ti (Office-Mode) | i9-14900HX 85 W / 55 W | NVIDIA GeForce RTX 4070 Laptop GPU 105 W 8 GB | 32 GB | 101304 |
| Minisforum AtomMan G7 Ti | i9-14900HX 115 W / 90 W | NVIDIA GeForce RTX 4070 Laptop GPU 140 W 1980 / 2000 MHz 8 GB | 32 GB | 102194 |
| CPU TDP ? | TDP 45 W | TDP 55 W | TDP 90 W | TDP 135 W |
|---|---|---|---|---|
| 81% | 91% | 99% | 100% | 91% |
| Model | CPU | GPU | RAM | Value |
|---|---|---|---|---|
| Minisforum AtomMan G7 Ti (Office-Mode) | i9-14900HX 85 W / 55 W | NVIDIA GeForce RTX 4070 Laptop GPU 105 W 8 GB | 32 GB | 86115 |
| Asus ROG Strix Scar 16 G634JZR | i9-14900HX 175 W / 135 W | NVIDIA GeForce RTX 4080 Laptop GPU 175 W 12 GB | 32 GB | 94249 |
| Minisforum AtomMan G7 Ti (Nvidia GeForce RTX 4090 @USB4) | i9-14900HX 54 W / 45 W | 32 GB | 94260 | |
| Minisforum AtomMan G7 Ti | i9-14900HX 115 W / 90 W | NVIDIA GeForce RTX 4070 Laptop GPU 140 W 1980 / 2000 MHz 8 GB | 32 GB | 100287 |
| Acer Predator Helios 16 PH16-72 | i9-14900HX | NVIDIA GeForce RTX 4080 Laptop GPU 175 W 1930 MHz 12 GB | 32 GB | 101593 |
| CPU TDP ? | TDP 45 W | TDP 55 W | TDP 90 W | TDP 135 W |
|---|---|---|---|---|
| 83% | 94% | 86% | 100% | 94% |
| Model | CPU | GPU | RAM | Value |
|---|---|---|---|---|
| Asus ROG Strix Scar 16 G634JZR | i9-14900HX 175 W / 135 W | NVIDIA GeForce RTX 4080 Laptop GPU 175 W 12 GB | 32 GB | 94081 |
| Minisforum AtomMan G7 Ti (Office-Mode) | i9-14900HX 85 W / 55 W | NVIDIA GeForce RTX 4070 Laptop GPU 105 W 8 GB | 32 GB | 97199 |
| Minisforum AtomMan G7 Ti (Nvidia GeForce RTX 4090 @USB4) | i9-14900HX 54 W / 45 W | 32 GB | 99882 | |
| Minisforum AtomMan G7 Ti | i9-14900HX 115 W / 90 W | NVIDIA GeForce RTX 4070 Laptop GPU 140 W 1980 / 2000 MHz 8 GB | 32 GB | 100591 |
| Acer Predator Helios 16 PH16-72 | i9-14900HX | NVIDIA GeForce RTX 4080 Laptop GPU 175 W 1930 MHz 12 GB | 32 GB | 102469 |
| CPU TDP ? | TDP 45 W | TDP 55 W | TDP 90 W | TDP 135 W |
|---|---|---|---|---|
| 85% | 99% | 97% | 100% | 94% |
| Model | CPU | GPU | RAM | Value |
|---|---|---|---|---|
| MSI Katana 17 HX B14WGK | i7-14650HX 60 W / 50 W | GeForce RTX 5070 Laptop 115 W 1545 / 1500 MHz 8 GB | 16 GB | 17628 |
| CPU TDP ? | TDP 50 W |
|---|---|
| 100% | 83% |
| CPU TDP ? | TDP 45 W | TDP 50 W | TDP 55 W | TDP 60 W | TDP 90 W | TDP 95 W | TDP 110 W | TDP 130 W | TDP 135 W |
|---|---|---|---|---|---|---|---|---|---|
| 86% | 89% | 71% | 74% | 89% | 90% | 79% | 91% | 67% | 100% |
| Model | CPU | GPU | RAM | Value |
|---|---|---|---|---|
| MSI Katana 17 HX B14WGK | i7-14650HX 60 W / 50 W | GeForce RTX 5070 Laptop 115 W 1545 / 1500 MHz 8 GB | 16 GB | 28404 |
| Lenovo Legion 5 16IRX G9 | i7-14650HX 140 W / 100 W | NVIDIA GeForce RTX 4060 Laptop GPU 125 W 2430 / 2050 MHz 8 GB | 16 GB | 31988 |
| CPU TDP ? | TDP 50 W | TDP 100 W |
|---|---|---|
| 100% | 89% | 100% |
| CPU TDP ? | TDP 45 W | TDP 50 W | TDP 55 W | TDP 60 W | TDP 63 W | TDP 69 W | TDP 90 W | TDP 95 W | TDP 100 W | TDP 104 W | TDP 110 W | TDP 117 W | TDP 130 W | TDP 131 W | TDP 135 W | TDP 140 W | TDP 144 W | TDP 145 W | TDP 160 W | TDP 176 W | TDP 205 W |
|---|---|---|---|---|---|---|---|---|---|---|---|---|---|---|---|---|---|---|---|---|---|
| 71% | 79% | 63% | 76% | 80% | 97% | 81% | 86% | 83% | 78% | 80% | 85% | 86% | 83% | 86% | 81% | 90% | 94% | 92% | 84% | 93% | 100% |
| Model | CPU | GPU | RAM | Value |
|---|---|---|---|---|
| MSI Katana 17 HX B14WGK | i7-14650HX 60 W / 50 W | GeForce RTX 5070 Laptop 115 W 1545 / 1500 MHz 8 GB | 16 GB | 12741 |
| Lenovo Legion 5 16IRX G9 | i7-14650HX 140 W / 100 W | NVIDIA GeForce RTX 4060 Laptop GPU 125 W 2430 / 2050 MHz 8 GB | 16 GB | 15311 |
| CPU TDP ? | TDP 50 W | TDP 100 W |
|---|---|---|
| 75% | 83% | 100% |
| CPU TDP ? | TDP 45 W | TDP 50 W | TDP 55 W | TDP 60 W | TDP 63 W | TDP 69 W | TDP 90 W | TDP 95 W | TDP 100 W | TDP 104 W | TDP 110 W | TDP 117 W | TDP 130 W | TDP 131 W | TDP 135 W | TDP 140 W | TDP 144 W | TDP 145 W | TDP 160 W | TDP 176 W | TDP 205 W |
|---|---|---|---|---|---|---|---|---|---|---|---|---|---|---|---|---|---|---|---|---|---|
| 65% | 78% | 68% | 82% | 75% | 99% | 84% | 91% | 91% | 78% | 89% | 89% | 92% | 88% | 73% | 87% | 96% | 100% | 93% | 86% | 90% | 86% |
| Model | CPU | GPU | RAM | Value |
|---|---|---|---|---|
Gigabyte B550 AORUS ELITE V2  | R9 5900X | 64 GB | 2290 |
| Model | CPU | GPU | RAM | Value |
|---|---|---|---|---|
| MSI Katana 17 HX B14WGK | i7-14650HX 60 W / 50 W | GeForce RTX 5070 Laptop 115 W 1545 / 1500 MHz 8 GB 6.4.0 Pro | 16 GB | 2744 |
| Lenovo Legion 5 16IRX G9 | i7-14650HX 140 W / 100 W | NVIDIA GeForce RTX 4060 Laptop GPU 125 W 2430 / 2050 MHz 8 GB 6.2.1 | 16 GB | 2761 |
| CPU TDP ? | TDP 50 W | TDP 100 W |
|---|---|---|
| 83% | 99% | 100% |
| CPU TDP ? | TDP 45 W | TDP 50 W | TDP 55 W | TDP 60 W | TDP 63 W | TDP 69 W | TDP 90 W | TDP 95 W | TDP 100 W | TDP 104 W | TDP 110 W | TDP 117 W | TDP 125 W | TDP 130 W | TDP 131 W | TDP 135 W | TDP 140 W | TDP 144 W | TDP 145 W | TDP 160 W | TDP 175 W | TDP 176 W | TDP 205 W |
|---|---|---|---|---|---|---|---|---|---|---|---|---|---|---|---|---|---|---|---|---|---|---|---|
| 86% | 97% | 88% | 91% | 95% | 92% | 94% | 95% | 95% | 93% | 93% | 96% | 91% | 99% | 98% | 96% | 93% | 99% | 98% | 97% | 98% | 97% | 91% | 100% |
| Model | CPU | GPU | RAM | Value |
|---|---|---|---|---|
| Gigabyte B550 AORUS ELITE V2 | R9 5900X | 64 GB | 13339 |
| Model | CPU | GPU | RAM | Value |
|---|---|---|---|---|
| MSI Katana 17 HX B14WGK | i7-14650HX 60 W / 50 W | GeForce RTX 5070 Laptop 115 W 1545 / 1500 MHz 8 GB 6.4.0 Pro | 16 GB | 12892 |
| Lenovo Legion 5 16IRX G9 | i7-14650HX 140 W / 100 W | NVIDIA GeForce RTX 4060 Laptop GPU 125 W 2430 / 2050 MHz 8 GB 6.2.1 | 16 GB | 16010 |
| CPU TDP ? | TDP 50 W | TDP 100 W |
|---|---|---|
| 83% | 81% | 100% |
| CPU TDP ? | TDP 45 W | TDP 50 W | TDP 55 W | TDP 60 W | TDP 63 W | TDP 69 W | TDP 90 W | TDP 95 W | TDP 100 W | TDP 104 W | TDP 110 W | TDP 117 W | TDP 125 W | TDP 130 W | TDP 131 W | TDP 135 W | TDP 140 W | TDP 144 W | TDP 145 W | TDP 160 W | TDP 175 W | TDP 176 W | TDP 205 W |
|---|---|---|---|---|---|---|---|---|---|---|---|---|---|---|---|---|---|---|---|---|---|---|---|
| 86% | 67% | 66% | 81% | 90% | 94% | 78% | 90% | 89% | 78% | 93% | 90% | 88% | 91% | 89% | 93% | 91% | 95% | 93% | 86% | 87% | 93% | 85% | 100% |
| Model | CPU | GPU | RAM | Value |
|---|---|---|---|---|
| Minisforum AtomMan G7 Ti | i9-14900HX 115 W / 90 W | NVIDIA GeForce RTX 4070 Laptop GPU 140 W 1980 / 2000 MHz 8 GB | 32 GB | 2694 |
| Asus ROG Strix Scar 18 G834JYR (2024) | i9-14900HX 120 W / 110 W | NVIDIA GeForce RTX 4090 Laptop GPU 175 W 1455 / 2250 MHz 16 GB | 32 GB | 2771 |
| Lenovo Legion Pro 7 16IRX9H | i9-14900HX 185 W / 130 W | NVIDIA GeForce RTX 4080 Laptop GPU 175 W 1665 / 2250 MHz 12 GB | 32 GB | 2895 |
| HP Omen 16 (2024) | i9-14900HX 130 W / 130 W | NVIDIA GeForce RTX 4080 Laptop GPU 145 W 1665 / 2250 MHz 12 GB | 32 GB | 2927 |
| Medion Erazer Beast X40 2024 | i9-14900HX 160 W / 160 W | NVIDIA GeForce RTX 4090 Laptop GPU 175 W 2040 / 2250 MHz 16 GB | 32 GB | 2951 |
| Medion Erazer Beast X40 2024 | i9-14900HX 160 W / 160 W | NVIDIA GeForce RTX 4090 Laptop GPU 175 W 2040 / 2250 MHz 16 GB Gaming Mode | 32 GB | 2975 |
| SCHENKER XMG Neo 17 2024 Engineering Sample | i9-14900HX | NVIDIA GeForce RTX 4090 Laptop GPU | 2977 |
| CPU TDP ? | TDP 90 W | TDP 110 W | TDP 130 W | TDP 160 W |
|---|---|---|---|---|
| 100% | 90% | 93% | 98% | 100% |
| Model | CPU | GPU | RAM | Value |
|---|---|---|---|---|
| Medion Erazer Beast X40 2024 | i9-14900HX 160 W / 160 W | NVIDIA GeForce RTX 4090 Laptop GPU 175 W 2040 / 2250 MHz 16 GB | 32 GB | 15218 |
| HP Omen 16 (2024) | i9-14900HX 130 W / 130 W | NVIDIA GeForce RTX 4080 Laptop GPU 145 W 1665 / 2250 MHz 12 GB | 32 GB | 16057 |
| Minisforum AtomMan G7 Ti | i9-14900HX 115 W / 90 W | NVIDIA GeForce RTX 4070 Laptop GPU 140 W 1980 / 2000 MHz 8 GB | 32 GB | 16229 |
| Asus ROG Strix Scar 18 G834JYR (2024) | i9-14900HX 120 W / 110 W | NVIDIA GeForce RTX 4090 Laptop GPU 175 W 1455 / 2250 MHz 16 GB | 32 GB | 16889 |
| Lenovo Legion Pro 7 16IRX9H | i9-14900HX 185 W / 130 W | NVIDIA GeForce RTX 4080 Laptop GPU 175 W 1665 / 2250 MHz 12 GB | 32 GB | 17686 |
| Medion Erazer Beast X40 2024 | i9-14900HX 160 W / 160 W | NVIDIA GeForce RTX 4090 Laptop GPU 175 W 2040 / 2250 MHz 16 GB Gaming Mode | 32 GB | 17755 |
| SCHENKER XMG Neo 17 2024 Engineering Sample | i9-14900HX | NVIDIA GeForce RTX 4090 Laptop GPU | 18016 |
| CPU TDP ? | TDP 90 W | TDP 110 W | TDP 130 W | TDP 160 W |
|---|---|---|---|---|
| 100% | 90% | 94% | 94% | 92% |
| Model | CPU | GPU | RAM | Value |
|---|---|---|---|---|
| Lenovo Legion 5 16IRX G9 | i7-14650HX 140 W / 100 W | NVIDIA GeForce RTX 4060 Laptop GPU 125 W 2430 / 2050 MHz 8 GB | 16 GB | 1933 |
| MSI Katana 17 HX B14WGK | i7-14650HX 60 W / 50 W | GeForce RTX 5070 Laptop 115 W 1545 / 1500 MHz 8 GB | 16 GB | 1940 |
| CPU TDP ? | TDP 50 W | TDP 100 W |
|---|---|---|
| 77% | 100% | 100% |
| CPU TDP ? | TDP 45 W | TDP 50 W | TDP 55 W | TDP 60 W | TDP 63 W | TDP 69 W | TDP 90 W | TDP 95 W | TDP 100 W | TDP 104 W | TDP 110 W | TDP 117 W | TDP 125 W | TDP 130 W | TDP 131 W | TDP 135 W | TDP 140 W | TDP 144 W | TDP 145 W | TDP 160 W | TDP 175 W | TDP 176 W | TDP 205 W |
|---|---|---|---|---|---|---|---|---|---|---|---|---|---|---|---|---|---|---|---|---|---|---|---|
| 71% | 98% | 88% | 93% | 97% | 76% | 92% | 98% | 91% | 92% | 93% | 96% | 91% | 97% | 98% | 97% | 94% | 96% | 100% | 98% | 97% | 96% | 95% | 100% |
| Model | CPU | GPU | RAM | Value |
|---|---|---|---|---|
| MSI Katana 17 HX B14WGK | i7-14650HX 60 W / 50 W | GeForce RTX 5070 Laptop 115 W 1545 / 1500 MHz 8 GB | 16 GB | 12584 |
| Lenovo Legion 5 16IRX G9 | i7-14650HX 140 W / 100 W | NVIDIA GeForce RTX 4060 Laptop GPU 125 W 2430 / 2050 MHz 8 GB | 16 GB | 16810 |
| CPU TDP ? | TDP 50 W | TDP 100 W |
|---|---|---|
| 67% | 75% | 100% |
| CPU TDP ? | TDP 45 W | TDP 50 W | TDP 55 W | TDP 60 W | TDP 63 W | TDP 69 W | TDP 90 W | TDP 95 W | TDP 100 W | TDP 104 W | TDP 110 W | TDP 117 W | TDP 125 W | TDP 130 W | TDP 131 W | TDP 135 W | TDP 140 W | TDP 144 W | TDP 145 W | TDP 160 W | TDP 175 W | TDP 176 W | TDP 205 W |
|---|---|---|---|---|---|---|---|---|---|---|---|---|---|---|---|---|---|---|---|---|---|---|---|
| 54% | 62% | 54% | 75% | 84% | 37% | 80% | 82% | 87% | 72% | 92% | 86% | 83% | 88% | 85% | 91% | 87% | 93% | 92% | 86% | 83% | 92% | 83% | 100% |
| Model | CPU | GPU | RAM | Value |
|---|---|---|---|---|
| Minisforum AtomMan G7 Ti (Office-Mode) | i9-14900HX 85 W / 55 W | NVIDIA GeForce RTX 4070 Laptop GPU 105 W 8 GB | 32 GB | 1929 |
| Minisforum AtomMan G7 Ti | i9-14900HX 115 W / 90 W | NVIDIA GeForce RTX 4070 Laptop GPU 140 W 1980 / 2000 MHz 8 GB | 32 GB | 2011 |
| Aorus 16X 2024 | i9-14900HX 120 W / 90 W | NVIDIA GeForce RTX 4070 Laptop GPU 140 W 2175 / 2000 MHz 8 GB | 32 GB | 2090 |
| SCHENKER XMG Neo 16 (Early 24) | i9-14900HX 205 W / 205 W | NVIDIA GeForce RTX 4090 Laptop GPU 175 W 2040 / 2250 MHz 16 GB | 32 GB | 2117 |
| CPU TDP ? | TDP 55 W | TDP 90 W | TDP 205 W |
|---|---|---|---|
| 72% | 91% | 97% | 100% |
| Model | CPU | GPU | RAM | Value |
|---|---|---|---|---|
| Minisforum AtomMan G7 Ti | i9-14900HX 115 W / 90 W | NVIDIA GeForce RTX 4070 Laptop GPU 140 W 1980 / 2000 MHz 8 GB | 32 GB | 16611 |
| Minisforum AtomMan G7 Ti (Office-Mode) | i9-14900HX 85 W / 55 W | NVIDIA GeForce RTX 4070 Laptop GPU 105 W 8 GB | 32 GB | 17098 |
| Aorus 16X 2024 | i9-14900HX 120 W / 90 W | NVIDIA GeForce RTX 4070 Laptop GPU 140 W 2175 / 2000 MHz 8 GB | 32 GB | 19253 |
| SCHENKER XMG Neo 16 (Early 24) | i9-14900HX 205 W / 205 W | NVIDIA GeForce RTX 4090 Laptop GPU 175 W 2040 / 2250 MHz 16 GB | 32 GB | 23176 |
| CPU TDP ? | TDP 55 W | TDP 90 W | TDP 205 W |
|---|---|---|---|
| 52% | 74% | 77% | 100% |
| Model | CPU | GPU | RAM | Value |
|---|---|---|---|---|
| Minisforum AtomMan G7 Ti (Office-Mode) | i9-14900HX 85 W / 55 W | NVIDIA GeForce RTX 4070 Laptop GPU 105 W 8 GB | 32 GB | 8705 |
| Minisforum AtomMan G7 Ti | i9-14900HX 115 W / 90 W | NVIDIA GeForce RTX 4070 Laptop GPU 140 W 1980 / 2000 MHz 8 GB | 32 GB | 9044 |
| CPU TDP ? | TDP 55 W | TDP 90 W |
|---|---|---|
| 76% | 96% | 100% |
| Model | CPU | GPU | RAM | Value |
|---|---|---|---|---|
| Minisforum AtomMan G7 Ti (Office-Mode) | i9-14900HX 85 W / 55 W | NVIDIA GeForce RTX 4070 Laptop GPU 105 W 8 GB | 32 GB | 58418 |
| Minisforum AtomMan G7 Ti | i9-14900HX 115 W / 90 W | NVIDIA GeForce RTX 4070 Laptop GPU 140 W 1980 / 2000 MHz 8 GB | 32 GB | 63156 |
| CPU TDP ? | TDP 55 W | TDP 90 W |
|---|---|---|
| 77% | 92% | 100% |
| Model | CPU | GPU | RAM | Value |
|---|---|---|---|---|
| MSI Katana 17 HX B14WGK | i7-14650HX 60 W / 50 W | GeForce RTX 5070 Laptop 115 W 1545 / 1500 MHz 8 GB Chrome 82 | 16 GB | 483 |
| Lenovo Legion 5 16IRX G9 | i7-14650HX 140 W / 100 W | NVIDIA GeForce RTX 4060 Laptop GPU 125 W 2430 / 2050 MHz 8 GB Chrome 82 | 16 GB | 486 |
| CPU TDP ? | TDP 50 W | TDP 100 W |
|---|---|---|
| 100% | 100% | 100% |
| CPU TDP ? | TDP 45 W | TDP 50 W | TDP 55 W | TDP 60 W | TDP 63 W | TDP 69 W | TDP 90 W | TDP 95 W | TDP 100 W | TDP 104 W | TDP 110 W | TDP 117 W | TDP 130 W | TDP 131 W | TDP 135 W | TDP 140 W | TDP 144 W | TDP 145 W | TDP 160 W | TDP 176 W | TDP 205 W |
|---|---|---|---|---|---|---|---|---|---|---|---|---|---|---|---|---|---|---|---|---|---|
| 100% | 100% | 100% | 100% | 100% | 100% | 100% | 100% | 100% | 100% | 100% | 100% | 100% | 100% | 100% | 100% | 100% | 100% | 100% | 100% | 100% | 100% |
| Model | CPU | GPU | RAM | Value |
|---|---|---|---|---|
| Lenovo Legion 5 16IRX G9 | i7-14650HX 140 W / 100 W | NVIDIA GeForce RTX 4060 Laptop GPU 125 W 2430 / 2050 MHz 8 GB | 16 GB | 98007 |
| CPU TDP 45 W | TDP 90 W | TDP 100 W | TDP 110 W | TDP 130 W | TDP 135 W | TDP 140 W | TDP 160 W | TDP 205 W |
|---|---|---|---|---|---|---|---|---|
| 92% | 95% | 85% | 94% | 93% | 90% | 100% | 95% | 98% |
| Model | CPU | GPU | RAM | Value |
|---|---|---|---|---|
| MSI Katana 17 HX B14WGK | i7-14650HX 60 W / 50 W | GeForce RTX 5070 Laptop 115 W 1545 / 1500 MHz 8 GB Chrome 105.0.0.0 | 16 GB | 271 |
| Lenovo Legion 5 16IRX G9 | i7-14650HX 140 W / 100 W | NVIDIA GeForce RTX 4060 Laptop GPU 125 W 2430 / 2050 MHz 8 GB Chrome 105.0.0.0 | 16 GB | 283 |
| CPU TDP 50 W | TDP 100 W |
|---|---|
| 96% | 100% |
| CPU TDP ? | TDP 45 W | TDP 50 W | TDP 55 W | TDP 63 W | TDP 69 W | TDP 90 W | TDP 100 W | TDP 104 W | TDP 110 W | TDP 130 W | TDP 131 W | TDP 135 W | TDP 140 W | TDP 144 W | TDP 145 W | TDP 160 W | TDP 176 W | TDP 205 W |
|---|---|---|---|---|---|---|---|---|---|---|---|---|---|---|---|---|---|---|
| 85% | 96% | 84% | 95% | 96% | 94% | 92% | 88% | 91% | 95% | 98% | 93% | 95% | 98% | 96% | 100% | 93% | 89% | 95% |
| Model | CPU | GPU | RAM | Value |
|---|---|---|---|---|
| MSI Katana 17 HX B14WGK | i7-14650HX 60 W / 50 W | GeForce RTX 5070 Laptop 115 W 1545 / 1500 MHz 8 GB Chrome 82 | 16 GB | 289 |
| Lenovo Legion 5 16IRX G9 | i7-14650HX 140 W / 100 W | NVIDIA GeForce RTX 4060 Laptop GPU 125 W 2430 / 2050 MHz 8 GB Chrome 82 | 16 GB | 311 |
| CPU TDP ? | TDP 50 W | TDP 100 W |
|---|---|---|
| 86% | 93% | 100% |
| CPU TDP ? | TDP 45 W | TDP 50 W | TDP 55 W | TDP 60 W | TDP 63 W | TDP 69 W | TDP 90 W | TDP 100 W | TDP 104 W | TDP 110 W | TDP 117 W | TDP 130 W | TDP 131 W | TDP 135 W | TDP 140 W | TDP 144 W | TDP 145 W | TDP 160 W | TDP 176 W | TDP 205 W |
|---|---|---|---|---|---|---|---|---|---|---|---|---|---|---|---|---|---|---|---|---|
| 80% | 97% | 85% | 97% | 97% | 98% | 94% | 93% | 92% | 95% | 95% | 100% | 99% | 95% | 93% | 98% | 96% | 99% | 99% | 96% | 99% |
| Model | CPU | GPU | RAM | Value |
|---|---|---|---|---|
| SCHENKER XMG Apex 15 Max | R9 5900X | GeForce RTX 3070 Laptop GPU 115 W 1560 / 1750 MHz 8 GB | 32 GB | 1514 |
| Nvidia GeForce RTX 3090 Founders Edition | R9 5900X | NVIDIA GeForce RTX 3090 1395 / 9752 MHz 24 GB | 32 GB | 1567 |
| KFA2 GeForce RTX 3050 EX | R9 5900X | NVIDIA GeForce RTX 3050 130 W 1822 / 14000 MHz 8 GB | 32 GB | 1580 |
| KFA2 GeForce RTX 3080 SG | R9 5900X | NVIDIA GeForce RTX 3080 12 GB 350 W 1740 / 19000 MHz 12 GB | 32 GB | 1616 |
| Sapphire AMD Radeon RX 6950 XT Nitro+ Pure | R9 5900X | Radeon RX 6950 XT 325 W 2435 / 18000 MHz 16 GB | 32 GB | 1619 |
| Model | CPU | GPU | RAM | Value |
|---|---|---|---|---|
| MSI Katana 17 HX B14WGK | i7-14650HX 60 W / 50 W | GeForce RTX 5070 Laptop 115 W 1545 / 1500 MHz 8 GB | 16 GB | 1965 |
| Lenovo Legion 5 16IRX G9 | i7-14650HX 140 W / 100 W | NVIDIA GeForce RTX 4060 Laptop GPU 125 W 2430 / 2050 MHz 8 GB | 16 GB | 2092 |
| CPU TDP ? | TDP 50 W | TDP 100 W |
|---|---|---|
| 75% | 94% | 100% |
| CPU TDP ? | TDP 45 W | TDP 50 W | TDP 55 W | TDP 60 W | TDP 63 W | TDP 69 W | TDP 90 W | TDP 100 W | TDP 104 W | TDP 110 W | TDP 117 W | TDP 130 W | TDP 131 W | TDP 135 W | TDP 140 W | TDP 144 W | TDP 145 W | TDP 160 W | TDP 176 W | TDP 205 W |
|---|---|---|---|---|---|---|---|---|---|---|---|---|---|---|---|---|---|---|---|---|
| 76% | 90% | 84% | 92% | 92% | 95% | 87% | 98% | 89% | 85% | 94% | 87% | 96% | 94% | 88% | 85% | 88% | 92% | 93% | 80% | 100% |
| Model | CPU | GPU | RAM | Value |
|---|---|---|---|---|
| SCHENKER XMG Apex 15 Max | R9 5900X | GeForce RTX 3070 Laptop GPU 115 W 1560 / 1750 MHz 8 GB | 32 GB | 105.1 |
| Eurocom Nightsky ARX315 | R9 5900X | GeForce RTX 3070 Laptop GPU 115 W 1560 / 1750 MHz 8 GB | 32 GB | 122 |
| AMD Ryzen 9 5900X | R9 5900X | NVIDIA Titan RTX 1350 / 7000 MHz 24 GB | 32 GB | 235.6 |
| Model | CPU | GPU | RAM | Value |
|---|---|---|---|---|
| MSI Katana 17 HX B14WGK | i7-14650HX 60 W / 50 W | GeForce RTX 5070 Laptop 115 W 1545 / 1500 MHz 8 GB | 16 GB | 155.8 |
| Lenovo Legion 5 16IRX G9 | i7-14650HX 140 W / 100 W | NVIDIA GeForce RTX 4060 Laptop GPU 125 W 2430 / 2050 MHz 8 GB | 16 GB | 159.3 |
| CPU TDP ? | TDP 50 W | TDP 100 W |
|---|---|---|
| 101% | 101% | 100% |
| CPU TDP ? | TDP 45 W | TDP 50 W | TDP 55 W | TDP 60 W | TDP 69 W | TDP 90 W | TDP 95 W | TDP 100 W | TDP 104 W | TDP 110 W | TDP 130 W | TDP 131 W | TDP 135 W | TDP 140 W | TDP 144 W | TDP 145 W | TDP 160 W | TDP 176 W | TDP 205 W |
|---|---|---|---|---|---|---|---|---|---|---|---|---|---|---|---|---|---|---|---|
| 154% | 193% | 162% | 181% | 153% | 171% | 165% | 177% | 161% | 150% | 158% | 158% | 139% | 165% | 135% | 100% | 141% | 177% | 113% | 147% |
| Model | CPU | GPU | RAM | Value |
|---|---|---|---|---|
| SCHENKER XMG Apex 15 Max | R9 5900X | GeForce RTX 3070 Laptop GPU 115 W 1560 / 1750 MHz 8 GB | 32 GB | 106.6 |
| Eurocom Nightsky ARX315 | R9 5900X | GeForce RTX 3070 Laptop GPU 115 W 1560 / 1750 MHz 8 GB | 32 GB | 114 |
| AMD Ryzen 9 5900X | R9 5900X | NVIDIA Titan RTX 1350 / 7000 MHz 24 GB | 32 GB | 235.8 |
| Model | CPU | GPU | RAM | Value |
|---|---|---|---|---|
| Lenovo Legion 5 16IRX G9 | i7-14650HX 140 W / 100 W | NVIDIA GeForce RTX 4060 Laptop GPU 125 W 2430 / 2050 MHz 8 GB | 16 GB | 197 |
| CPU TDP ? | TDP 100 W |
|---|---|
| 113% | 100% |
| CPU TDP ? | TDP 55 W | TDP 60 W | TDP 69 W | TDP 90 W | TDP 100 W | TDP 104 W | TDP 131 W | TDP 135 W | TDP 140 W | TDP 144 W | TDP 145 W | TDP 176 W |
|---|---|---|---|---|---|---|---|---|---|---|---|---|
| 152% | 173% | 147% | 137% | 143% | 142% | 132% | 123% | 121% | 134% | 100% | 146% | 117% |
| Model | CPU | GPU | RAM | Value |
|---|---|---|---|---|
| Sapphire Pulse Radeon RX 6500 XT | R9 5900X | Radeon RX 6500 XT 130 W 2825 / 18000 MHz 4 GB | 32 GB | 63.1 |
| Sapphire Nitro+ Radeon RX 6650 XT | R9 5900X | Radeon RX 6650 XT 180 W 2694 / 2188 MHz 8 GB | 32 GB | 67.7 |
| Sapphire Nitro+ Radeon RX 6750 XT | R9 5900X | Radeon RX 6750 XT 250 W 2623 / 2250 MHz 12 GB | 32 GB | 70.4 |
| Sapphire AMD Radeon RX 6950 XT Nitro+ Pure | R9 5900X | Radeon RX 6950 XT 325 W 2435 / 18000 MHz 16 GB | 32 GB | 73.6 |
| KFA2 GeForce RTX 3050 EX | R9 5900X | NVIDIA GeForce RTX 3050 130 W 1822 / 14000 MHz 8 GB | 32 GB | 80.7 |
| AMD Radeon RX 6800 | R9 5900X | Radeon RX 6800 250 W 2105 MHz 16 GB | 32 GB | 81.5 |
| KFA2 GeForce RTX 3080 SG | R9 5900X | NVIDIA GeForce RTX 3080 12 GB 350 W 1740 / 19000 MHz 12 GB | 32 GB | 88.3 |
| Model | CPU | GPU | RAM | Value |
|---|---|---|---|---|
| Lenovo Legion 5 16IRX G9 | i7-14650HX 140 W / 100 W | NVIDIA GeForce RTX 4060 Laptop GPU 125 W 2430 / 2050 MHz 8 GB | 16 GB | 22.4 |
| MSI Katana 17 HX B14WGK | i7-14650HX 60 W / 50 W | GeForce RTX 5070 Laptop 115 W 1545 / 1500 MHz 8 GB | 16 GB | 24.8 |
| CPU TDP ? | TDP 50 W | TDP 100 W |
|---|---|---|
| 100% | 166% | 169% |
| CPU TDP ? | TDP 45 W | TDP 50 W | TDP 55 W | TDP 60 W | TDP 69 W | TDP 90 W | TDP 95 W | TDP 100 W | TDP 104 W | TDP 110 W | TDP 130 W | TDP 131 W | TDP 135 W | TDP 140 W | TDP 144 W | TDP 145 W | TDP 160 W | TDP 176 W | TDP 205 W |
|---|---|---|---|---|---|---|---|---|---|---|---|---|---|---|---|---|---|---|---|
| 100% | 141% | 136% | 141% | 139% | 154% | 136% | 126% | 139% | 143% | 130% | 130% | 146% | 132% | 132% | 147% | 134% | 140% | 141% | 138% |
| Model | CPU | GPU | RAM | Value |
|---|---|---|---|---|
| MSI Katana 17 HX B14WGK | i7-14650HX 60 W / 50 W | GeForce RTX 5070 Laptop 115 W 1545 / 1500 MHz 8 GB | 16 GB | 15 |
| Lenovo Legion 5 16IRX G9 | i7-14650HX 140 W / 100 W | NVIDIA GeForce RTX 4060 Laptop GPU 125 W 2430 / 2050 MHz 8 GB | 16 GB | 17.6 |
| CPU TDP 50 W | TDP 100 W |
|---|---|
| 104% | 100% |
| CPU TDP ? | TDP 45 W | TDP 50 W | TDP 55 W | TDP 60 W | TDP 69 W | TDP 90 W | TDP 95 W | TDP 100 W | TDP 104 W | TDP 110 W | TDP 130 W | TDP 131 W | TDP 135 W | TDP 140 W | TDP 144 W | TDP 145 W | TDP 160 W | TDP 176 W | TDP 205 W |
|---|---|---|---|---|---|---|---|---|---|---|---|---|---|---|---|---|---|---|---|
| 122% | 135% | 142% | 136% | 136% | 155% | 135% | 100% | 137% | 130% | 138% | 138% | 138% | 104% | 153% | 138% | 113% | 144% | 128% | 139% |
| Model | CPU | GPU | RAM | Value |
|---|---|---|---|---|
| AMD Ryzen 9 5900X | R9 5900X | NVIDIA Titan RTX 1350 / 7000 MHz 24 GB | 32 GB | 15.8 |
| SCHENKER XMG Apex 15 Max | R9 5900X | GeForce RTX 3070 Laptop GPU 115 W 1560 / 1750 MHz 8 GB | 32 GB | 16.4 |
| Eurocom Nightsky ARX315 | R9 5900X | GeForce RTX 3070 Laptop GPU 115 W 1560 / 1750 MHz 8 GB | 32 GB | 19.8 |
| Model | CPU | GPU | RAM | Value |
|---|---|---|---|---|
| Lenovo Legion 5 16IRX G9 | i7-14650HX 140 W / 100 W | NVIDIA GeForce RTX 4060 Laptop GPU 125 W 2430 / 2050 MHz 8 GB | 16 GB | 19.3 |
| CPU TDP ? | TDP 100 W |
|---|---|
| 90% | 100% |
| CPU TDP ? | TDP 55 W | TDP 60 W | TDP 69 W | TDP 90 W | TDP 100 W | TDP 104 W | TDP 131 W | TDP 135 W | TDP 140 W | TDP 144 W | TDP 145 W | TDP 176 W |
|---|---|---|---|---|---|---|---|---|---|---|---|---|
| 67% | 100% | 89% | 74% | 84% | 71% | 77% | 69% | 72% | 82% | 59% | 92% | 68% |
Average Benchmarks AMD Ryzen 9 5900X → 100% n=33
Average Benchmarks Intel Core i7-14650HX → 123% n=33
Average Benchmarks Intel Core i9-14900HX → 128% n=33
* Smaller numbers mean a higher performance
1 This benchmark is not used for the average calculation
#0 ran 0s before starting gpusingle class +0s ... 0s
#1 checking url part for id 12782 +0s ... 0s
#2 checking url part for id 17170 +0s ... 0s
#3 checking url part for id 17163 +0s ... 0s
#4 redirected to Ajax server, took 1759247433s time from redirect:0 +0s ... 0s
#5 did not recreate cache, as it is less than 5 days old! Created at Mon, 29 Sep 2025 12:06:34 +0200 +0s ... 0s
#6 composed specs +0.006s ... 0.006s
#7 did output specs +0s ... 0.006s
#8 getting avg benchmarks for device 12782 +0.004s ... 0.01s
#9 got single benchmarks 12782 +0.049s ... 0.059s
#10 getting avg benchmarks for device 17170 +0.004s ... 0.063s
#11 got single benchmarks 17170 +0.008s ... 0.071s
#12 getting avg benchmarks for device 17163 +0.005s ... 0.075s
#13 got single benchmarks 17163 +0.046s ... 0.121s
#14 got avg benchmarks for devices +0s ... 0.121s
#15 min, max, avg, median took s +0.103s ... 0.224s
#16 return log +0s ... 0.224s